

Sample Category Title
GBP/JPY Daily Outlook
Daily Pivots: (S1) 174.56; (P) 175.05; (R1) 175.80; More...
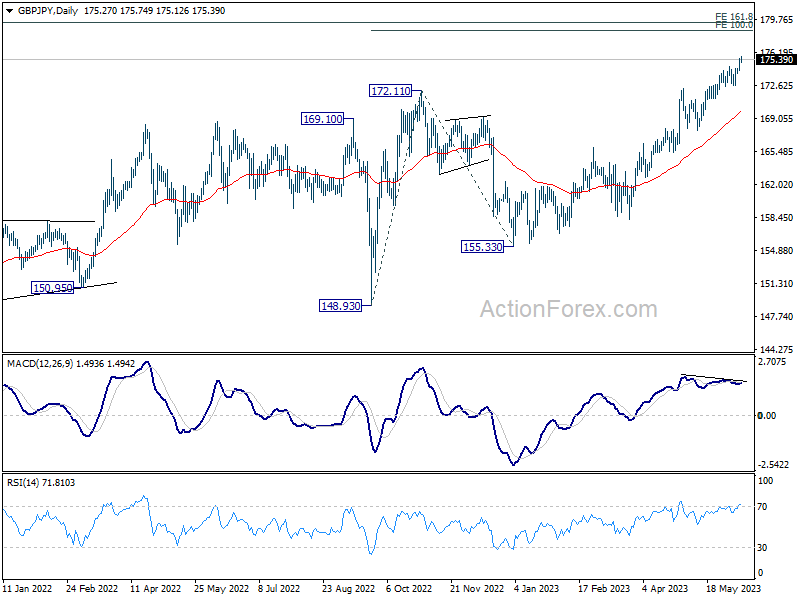
Intraday bias in GBP/JPY remains on the upside for the moment. Current up trend should target 100% projection of 148.93 to 172.11 from 155.33 at 178.51 next. Strong resistance could be seen from there to bring pull back, at least on first attempt. But break of 172.64 support is needed to indicate short term topping. Otherwise, outlook will remain bullish in case of retreat.
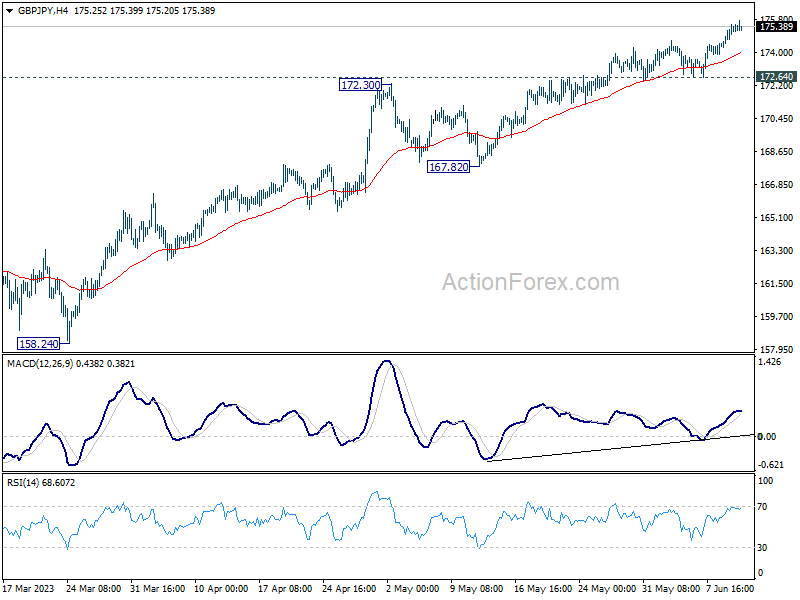
In the bigger picture, up trend from 123.94 (2020 low) is extending. Next target will be 161.8% projection of 122.75 (2016 low) to 156.59 (2018 high) from 123.94 at 178.69. For now, medium term outlook will remain bullish as long as 167.82 support holds, even in case of deep pull back.
EUR/JPY Daily Outlook
Daily Pivots: (S1) 149.49; (P) 149.96; (R1) 150.28; More....
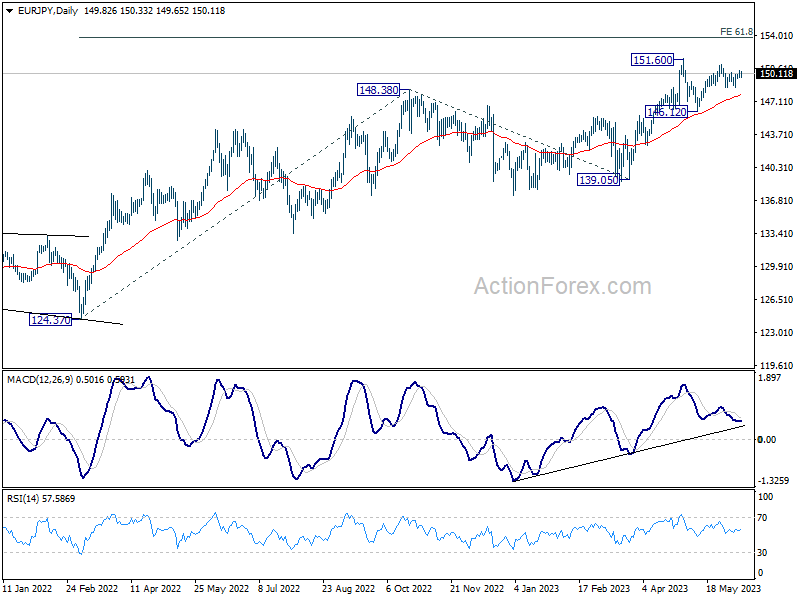
Intraday bias in EUR/JPY remains neutral for the moment. On the downside, below 148.58 will extend the corrective pattern from 151.60 with another falling leg. Deeper fall would be seen to 146.12 support and possibly below. On the upside, however, above 151.05 will target 151.60 high. Firm break there will resume larger up trend to 153.64 projection level.
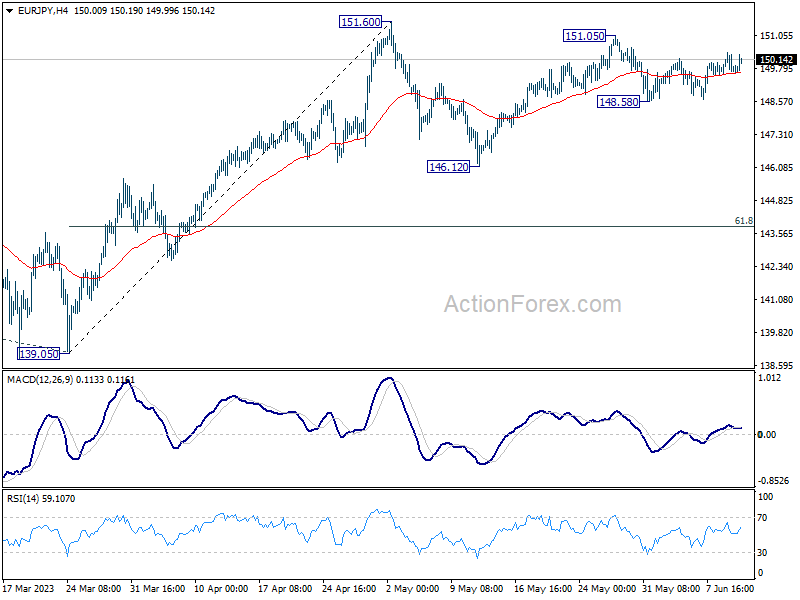
In the bigger picture, rise from 114.42 (2020 low) is in progress. Next target is 61.8% projection of 124.37 to 148.38 from 138.81 at 153.64. Sustained break there will pave the way to 100% projection at 162.82. For now, medium term outlook will remain bullish as long as 139.05 support holds, even in case of deep pull back.
EUR/GBP Daily Outlook
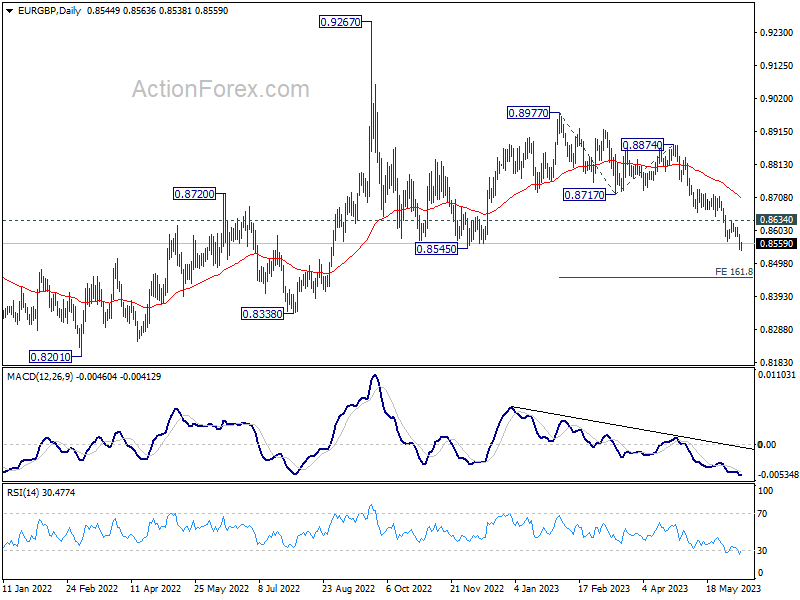
Daily Pivots: (S1) 0.8526; (P) 0.8559; (R1) 0.8576; More...
Intraday bias in EUR/GBP stays on the downside for the moment. Current fall from 0.8977 should target 161.8% projection of 0.8977 to 0.8717 from 0.8874 at 0.8453. On the upside, break of 0.8634 resistance is needed to indicate short term bottoming. Otherwise, outlook will remain bearish in case of recovery.
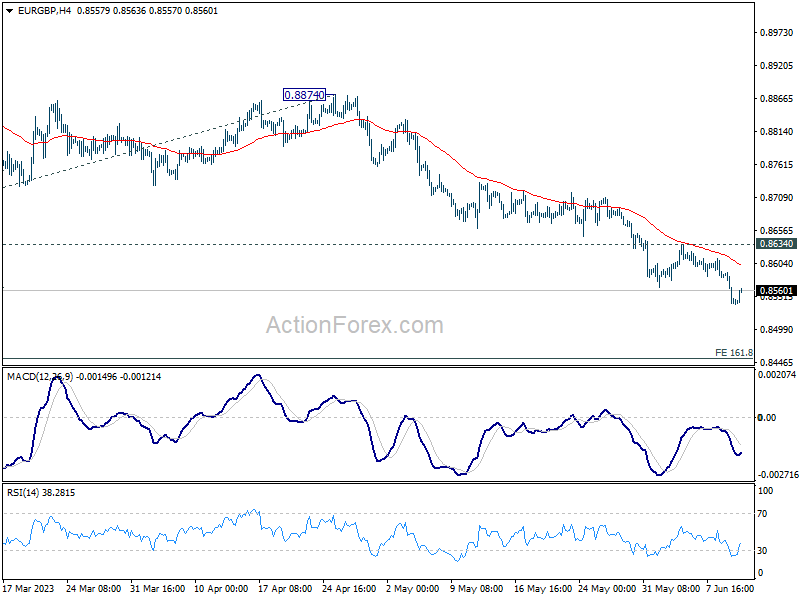
In the bigger picture, the down trend form 0.9267 (2022 high) is still in progress. It's seen as part of the long term range pattern from 0.9499 (2020 high). Deeper fall would be seen towards 0.8201 (2022 low). But strong support should be seen from there to bring reversal. This will now remain the favored case as long as 0.8717 support turned resistance holds.
EUR/AUD Daily Outlook
Daily Pivots: (S1) 1.5884; (P) 1.5994; (R1) 1.6049; More...
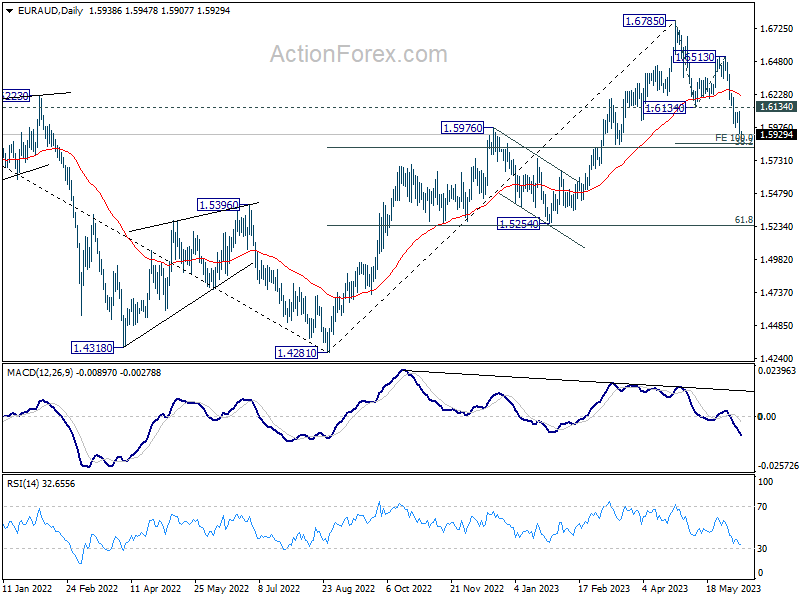
Intraday bias in EUR/AUD stays on the downside at this point. Fall from 1.6785 is in progress for 100% projection of 1.6785 to 1.6134 from 1.6513 at 1.5862. Strong support could be seen around there to bring rebound, at least on first attempt. On the upside, firm break of 1.6134 support turned resistance should confirm short term bottoming and turn bias back to the upside.
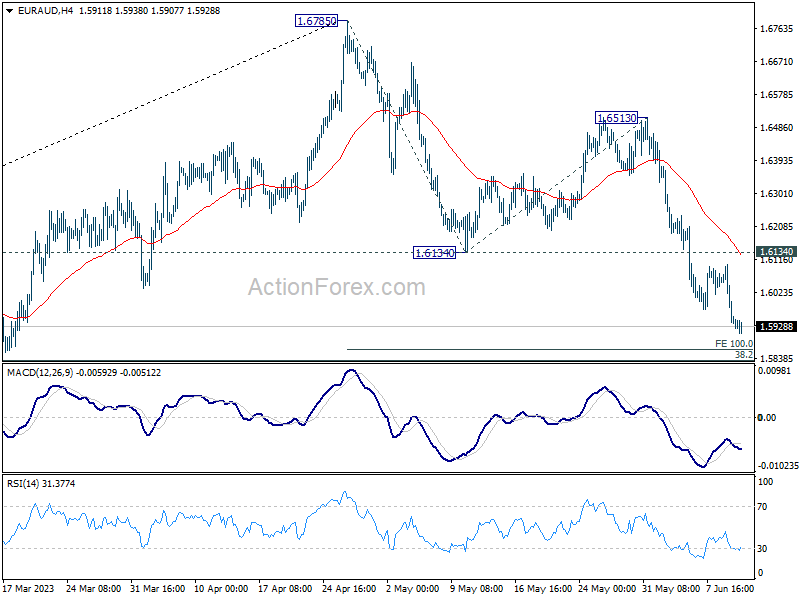
In the bigger picture, a medium term is possibly in place at 1.6785 already, on bearish divergence condition in D MACD. Fall from there is seen as corrective whole up trend from 1.4281 (2022 low). Deeper decline is expected as long as 1.6513 resistance holds, to 38.2% retracement of 1.4281 to 1.6785 at 1.5828. Strong support could be seen there to complete the first leg of the corrective pattern.
EUR/CHF Daily Outlook
Daily Pivots: (S1) 0.9689; (P) 0.9703; (R1) 0.9723; More...
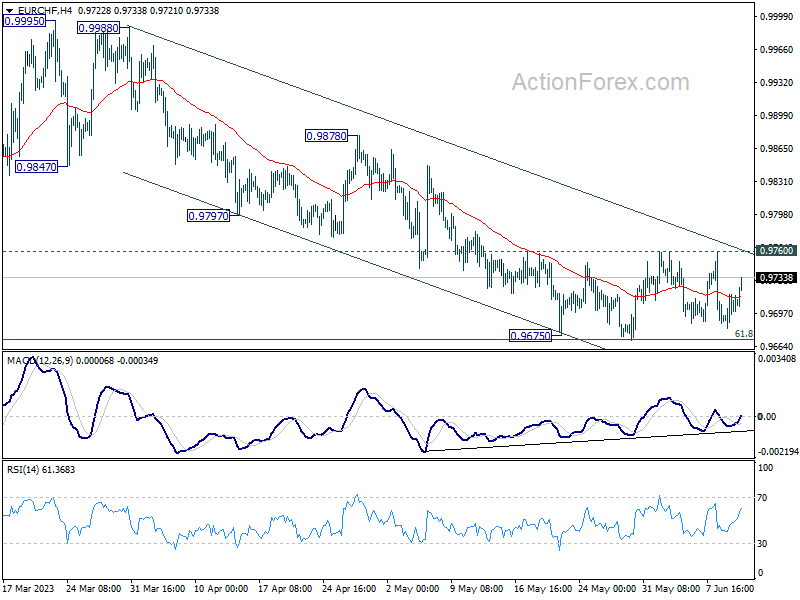
EUR/CHF recovers today but stays in range below 0.9760. Intraday bias remains neutral at this point. On the upside, firm break of 0.9760 resistance should confirm short term bottoming, after drawing support from 61.8% retracement of 0.9407 to 1.0095 at 0.9670. Intraday bias will be turned back to the upside for 0.9878 resistance next. Nevertheless, sustained break of 0.9670 will extend the whole decline from 1.0095 towards 0.9407 low instead.
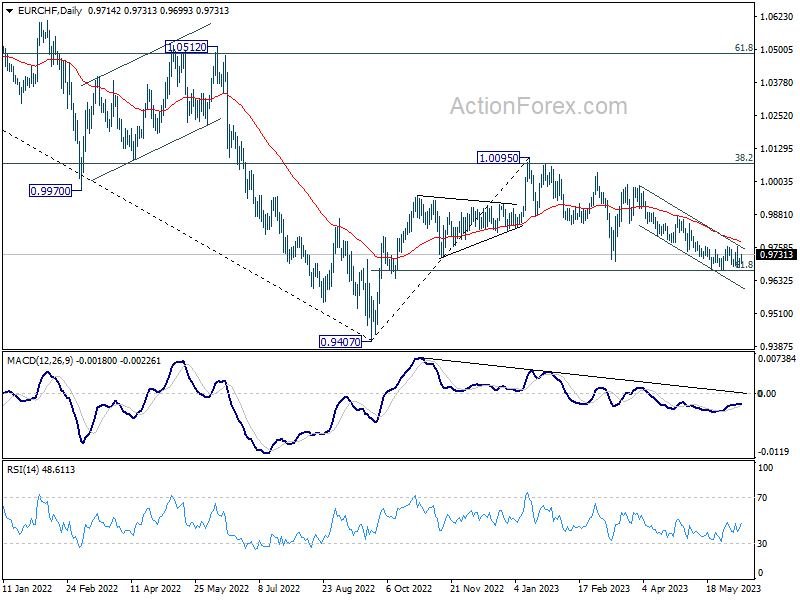
In the bigger picture, prior rejection by 38.2% retracement of 1.1149 to 0.9407 at 1.0072 suggests that medium term outlook is staying bearish. The pair is also capped below 55 W EMA (now at 0.9929). Down trend from 1.2004 (2018 high) is not complete yet and is in favor to resume through 0.9407 at a later stage. However, decisive break of 1.0095 resistance will raise the chance of bullish trend reversal. Rise from 0.9407 should then target 1.0505 cluster resistance (2020 low at 1.0505, 61.8% retracement of 1.1149 to 0.9407 at 1.1484).
GBPUSD Analysis: A Week Full of News Begins
The following events may affect the GBP/USD rate:
→ Tue: 09:00 (GMT+3) – Claimant Count Change (UK labor market indicator)
→ Tue: 15:30 (GMT+3) - Consumer Price Index (indicator of inflation in the US)
→ Tue: 17:00 (GMT+3) – Speech by the Governor of the Bank of England
→ Wed: 09:00 (GMT+3) - UK GDP
→ Wed: 15:30 (GMT+3) – Producer Price Index (US inflation indicator)
→ Wed: 21:00 (GMT+3) – Fed rate decision (!)
→ Thu: 15:30 (GMT+3) – News on unemployment and retail sales in the US
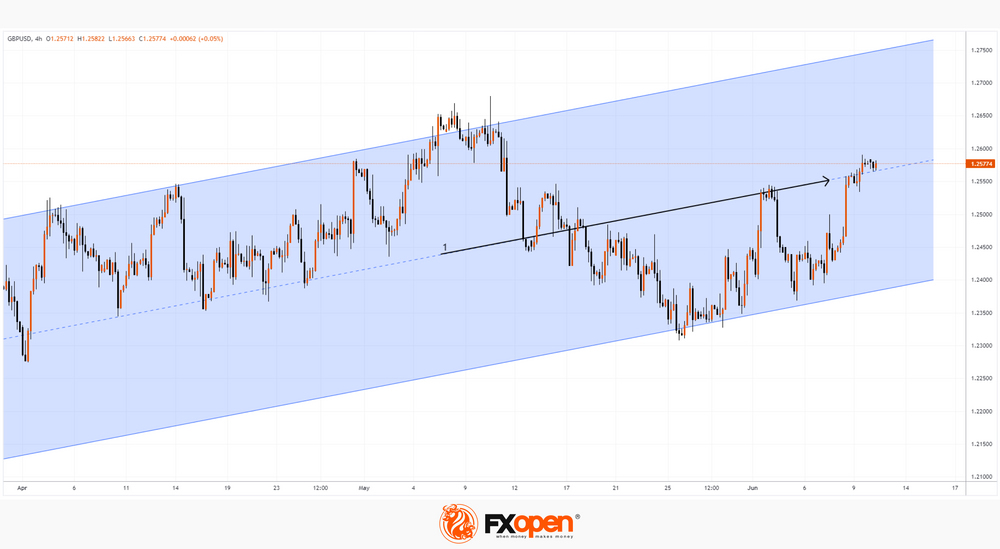
The GBP/USD chart shows that so far the market is more bullish than bearish, because:
→ rate dynamics fit into the uplink (shown in blue)
→ on Monday morning, it looks like a bullish breakout test pattern of the median line (1) of this channel is forming.
GBP/USD Consolidates Gains, USD/CAD Faces Hurdle
GBP/USD is showing positive signs above the 1.2540 resistance. USD/CAD is struggling and might decline further below the 1.3310 support.
Important Takeaways for GBP/USD and USD/CAD Analysis Today
The British Pound started a strong increase above the 1.2440 resistance zone.
There is a key bullish trend line forming with support near 1.2540 on the hourly chart of GBP/USD at FXOpen.
USD/CAD is correcting losses from the 1.3310 support zone.
There is a major bearish trend line forming with resistance near 1.3350 on the hourly chart at FXOpen.
GBP/USD Technical Analysis
On the hourly chart of GBP/USD at FXOpen, the pair started a major increase from the 1.2370 zone. The British Pound climbed above the 1.2440 resistance against the US Dollar.
The upward move gained pace above the 1.2500 resistance and the 50-hour simple moving average. Finally, it broke the 1.2540 resistance and traded toward 1.2600. A high is formed near 1.2590 and the pair is now consolidating gains.
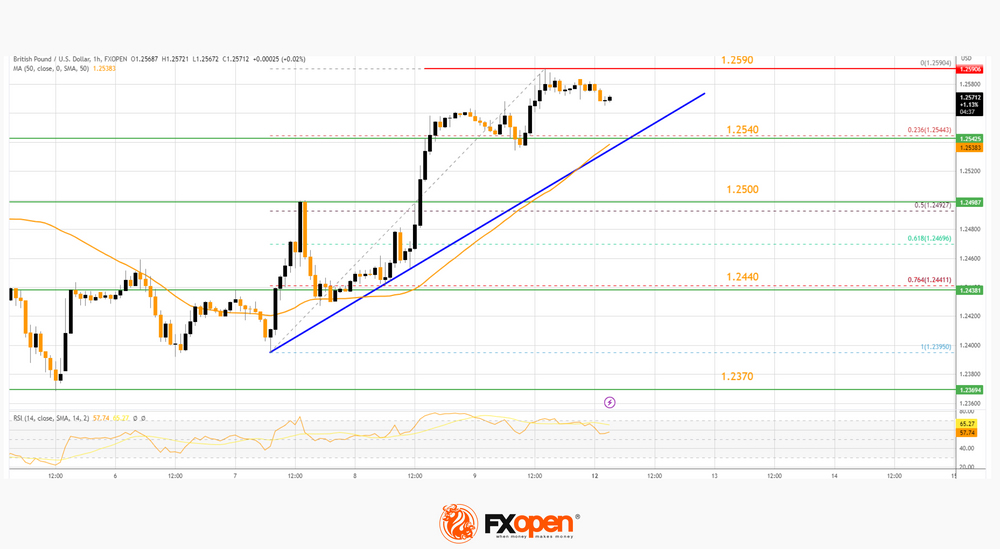
Initial support sits near a key bullish trend line at 1.2540 and the 50-hour simple moving average. It is close to the 23.6% Fib retracement level of the upward move from the 1.2395 swing low to the 1.2590 high.
The next major support sits at 1.2500 or the 50% Fib retracement level of the upward move from the 1.2395 swing low to the 1.2590 high, where the bulls might take a stand. If there is a downside break, GBP/USD might test the 1.2440 support.
Immediate resistance is near the 1.2590 level. The first major resistance on the GBP/USD chart is near the 1.2600 level. The next major resistance is near the 1.2620 level. Any more gains could lead the pair toward the 1.2650 resistance in the near term.
USD/CAD Technical Analysis
On the hourly chart of USD/CAD at FXOpen, the pair failed to climb above the 1.3450 resistance. The US Dollar started a major decline below the 1.3400 level against the Canadian Dollar.
The pair gained bearish momentum below the 1.3370 support and the 50-hour simple moving average. A low is formed near 1.3313 and the pair is now attempting an upside correction. It is now consolidating near the 1.3350 resistance and the 23.6% Fib retracement level of the downward move from the 1.3461 swing high to the 1.3312 low.
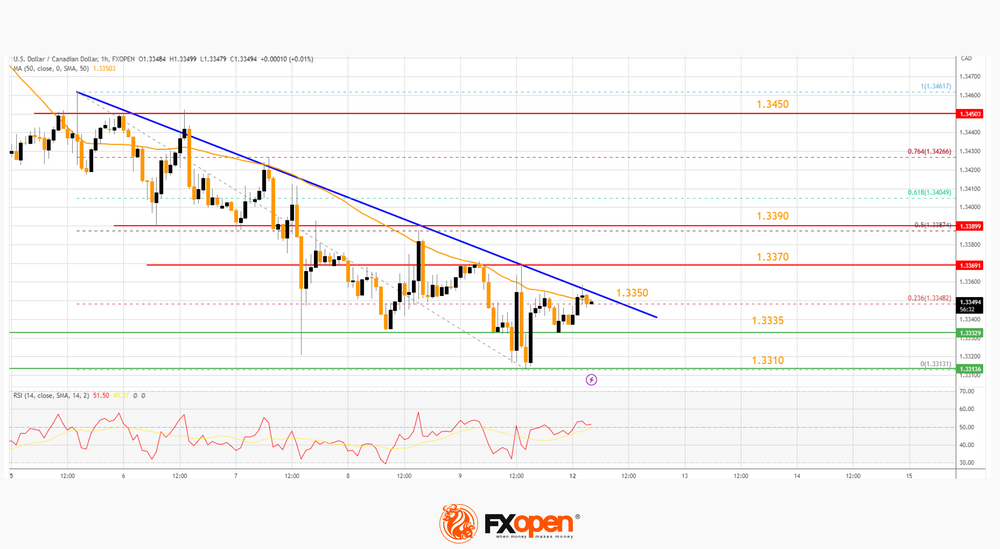
There is also a major bearish trend line forming with resistance near 1.3350 on the same USD/CAD chart. The next major resistance is the 50% Fib retracement level of the downward move from the 1.3461 swing high to the 1.3312 low at 1.3390.
A close above the 1.3390 level might send the pair toward the 1.3450 level. Any more gains could open the doors for a test of the 1.3500 level.
On the downside, the pair is likely to find bids near 1.3335. The next major support is near the 1.3310 level. A downside break below the 1.3310 support level could push the pair further lower. The next major support is near the 1.3260 zone, below which the pair might revisit the 1.3220 level.
Trade global forex with the Innovative Broker of 2022*. Choose from 50+ forex markets 24/5. Open your FXOpen account now or learn more about making your money go further with FXOpen.
USD/TRY Hits New Record High, CBRT Expected to Sharply Raise Interest Rates on June 22
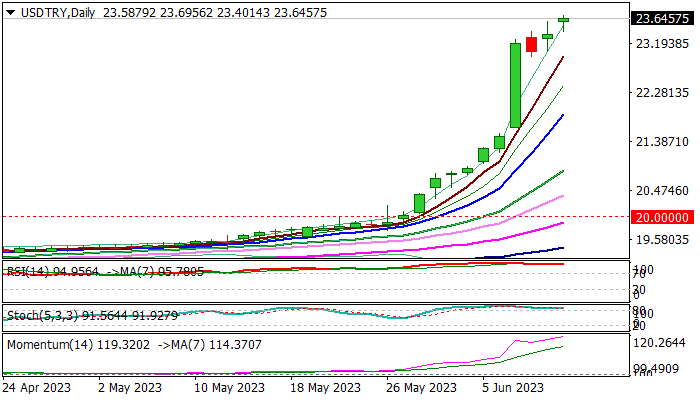
USDTRY extends steep ascend of past two weeks and hit new record high on Monday morning, after starting week with gap-higher opening.
There are no firm signs that the latest rally may run out of steam, as initial signals (Thursday’s close in red and Friday’s long-legged Doji) were offset by higher opening on Monday.
Extremely overbought daily/weekly studies suggest that bulls may take a breather after sharp bullish acceleration, as last week’s rally marked the biggest weekly gain since mid-December 2021, though still lacking clearer signal.
Treaders focus on CBRT’s June 22 policy meeting, as the finance minister and central bank governor in the new cabinet signaled a sharp turn in monetary policy towards more orthodox methods.
Wall Street banks, in the latest comments, pointed to a number of monetary and fiscal adjustments needed to stabilize the economy, expecting Turkish central bank to raise interest rate from current 8.5% to 22% and likely to reach 30% by the end of the year.
They also see possibility that rate would rise to 40% if the CBRT employs fully orthodox policy and suggest that rate could drop towards 25% if conditions stabilize.
However, markets are cautiously optimistic, as sharp policy tightening by the world major central banks in past one year, so far did not provide expected relief, as inflation in all most developed economies remains stubbornly high.
Turkey’s GDP outlook for 2023 has also been downgraded from initial forecast at 2.9% to 2.3% and economy is expected to enter recession in the second half of the year, due to sharp tightening in credit conditions.
Bulls focus psychological 24.00 barrier, ahead of Fibo projections at 24.5713 and 26.4966 (Fibo 176.4% and 200% of the uptrend from Dec 2021 low at 10.20).
Price adjustments are likely to be shallow for now and to face solid supports in the 23.00 zone, ahead of next week’s policy meeting.
Res: 23.6956; 24.0000; 24.5713; 26.4966.
Sup: 23.4014; 23.0000; 22.4026; 22.0000.
Be Wary of the New Bull Market of SP 500
- The key US benchmark stock index, S&P 500 has entered a new bull market.
- Market breadth has seen some signs of improvement as prior cyclical laggards; Energy, Industrials, and Financials sectors outperformed last week.
- Several elements such as rising sovereign bond yields, a steeper US Treasury yield curve inversion, and underperformance of Quality and Momentum beta factors raise concerns about the sustainability of the current bull market.
Last week, the key US benchmark stock index, S&P 500 finally exited its recent bear market of 282 days from its 3 January 2022 all-time high closing level to 12 October 2022 and kickstarted a fresh bull market as it rallied by at least 20% from its October 2022 low.
The improving breadth factor may indicate that this newly born bull market of the S&P 500 has the legs to push higher versus prior “false bull markets” (low to close) of 22 March 2001 to 21 May 2001, 21 September 2001 to 13 November 2001, and 20 November 2008 to 2 January 2009 where the market resumed its downtrend and broke into new respective lows.
Last week, the laggard cyclical-oriented sectors of the S&P 500; Energy (+1.71%), Industrials (+1.38%), and Financials (+1.05%) outperformed in terms of weekly returns over the S&P 500 (+0.39%) as well as the year-to-date high-flying Technology sector (-0.66%) that has led the rally since the October 2022 low.
However, do allow me to be the devil’s advocate to highlight several inherent risks that the current minted bull market of the S&P 500 may not live up to its initial bullish expectations.
Rising sovereign bond yields
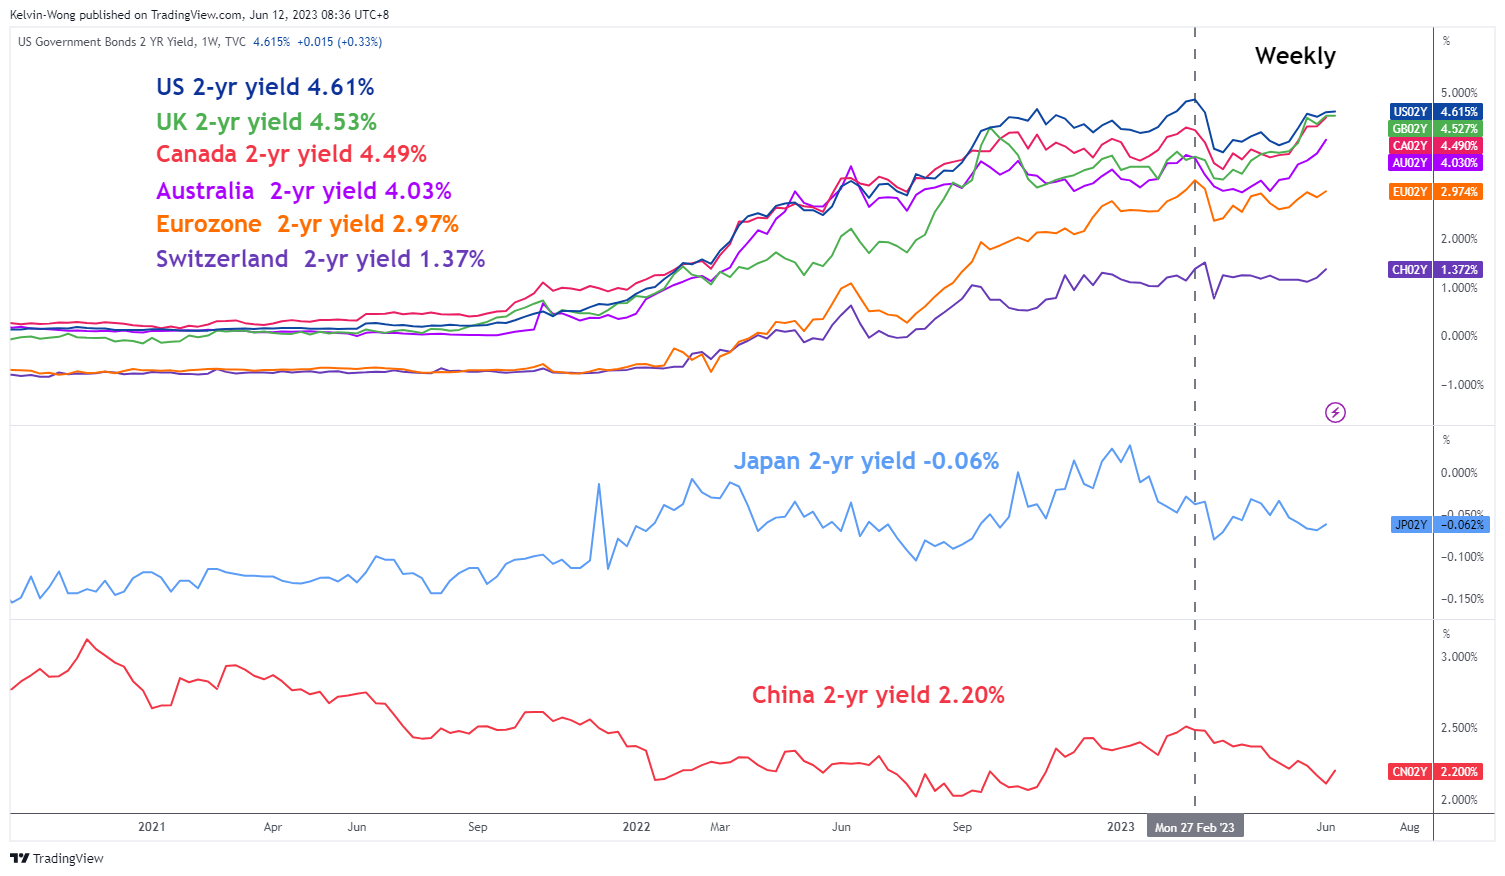
Fig 1: G-20 2-year sovereign bond yields medium-term trend as of 12 Jun 2023 (Source: TradingView, click to enlarge chart)
Except for Japan and China, the other major G-20 nations’ 2-year sovereign bond yields have started to resume their ascend in the past two weeks with the UK, Canada, and Australia’s 2-year sovereign yields breaking above their respective February 2023 highs, the up moves in the latter two countries sovereign yields have been supported by renewed interest rates hikes from their respective central banks, BoC and RBA.
The US 2-year Treasury yield is now trading at 4.61% at this time of the writing, just a whisker away from its 27 February 2023 swing high closing level of 4.86%. Also, technical analysis suggests that positive momentum has started to built-up, and the next key resistance is coming in at a higher level of 5.20%.
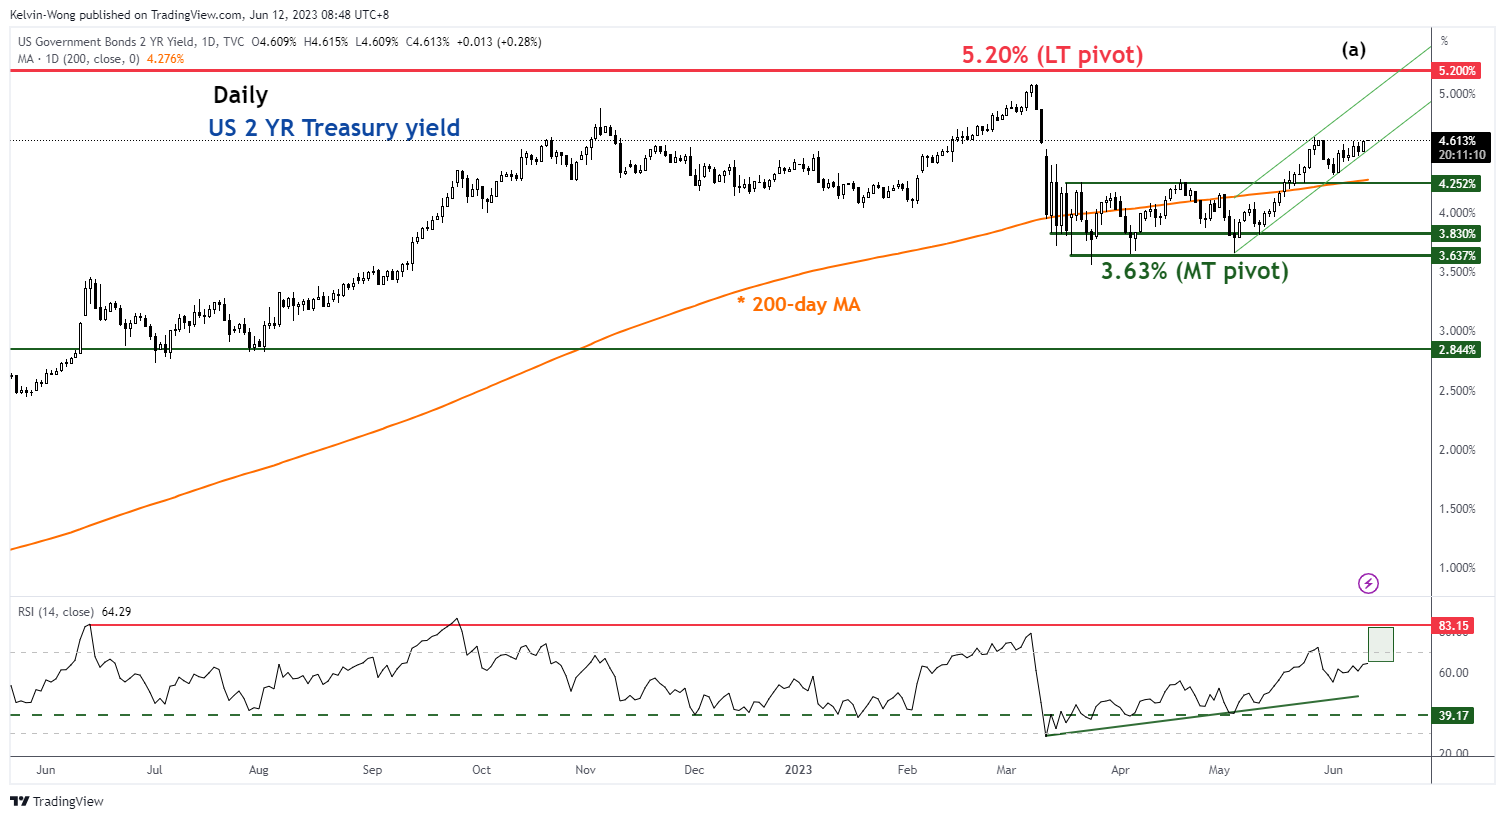
Fig 2: US 2-year Treasury yield medium-term trend as of 12 Jun 2023 (Source: TradingView, click to enlarge chart)
These observations suggest that the medium-term cost of funding for corporations may start to creep up in the second half of 2023.
US Treasury yield curve inversion (10-YR over 2-YR) is the steepest in almost 42 years
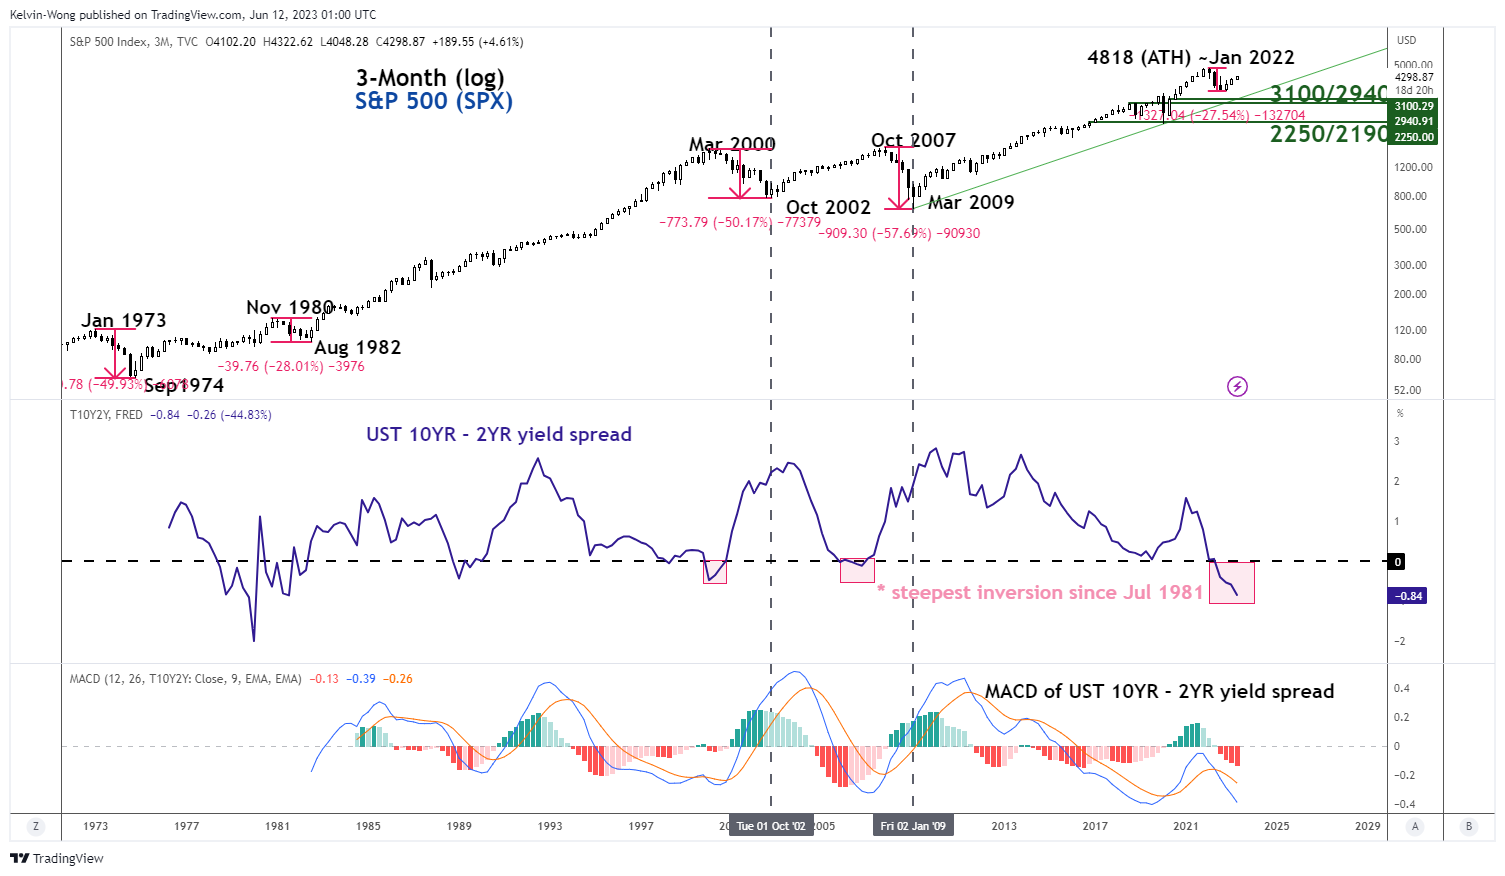
Fig 3: US 10-year over 2-year Treasury yield spread major trend as of 12 Jun 2023 (Source: TradingView, click to enlarge chart)
The inverted US Treasury yield curve measured by the 10-year minus the 2-year has continued to plummet lower to -0.84% at this time of the writing, that’s the steepest inversion level since July 1981 and the MACD trend indicator of the US Treasury 10-year over 2-year yield curve spread is not showing any signs of a potential bullish trend reversal at this juncture.
Thus, further economic weakness in the US and even a recession cannot be ruled out in the later half of 2023.
Based on the latest data from FactSet as of 9 June 2023, analysts now expect estimated Q3 2023 earnings of the S&P 500 to recover with a minor growth rate of 0.8% year-on-year after a contraction of -6.4% year-on-year recorded in Q2 2023. For Q4 2023, the estimated earnings growth rate is expected to expand further to 8.2% year-on-year; if the 8.2% earnings growth rate for Q4 turns out as expected, it will mark the highest year-on-year growth rate for the S&P 500 since Q1 2022 at 9.4%.
Given the current optimistic earnings upgrade from analysts that has been contrasted with a potentially higher cost of funding in the second half of the year and further economic weakness ahead, there could be a risk of earnings downward revisions that may put downside pressure on the S&P 500 due to overoptimistic expectations.
S&P 500 quality and momentum factors are not supporting the current bull market
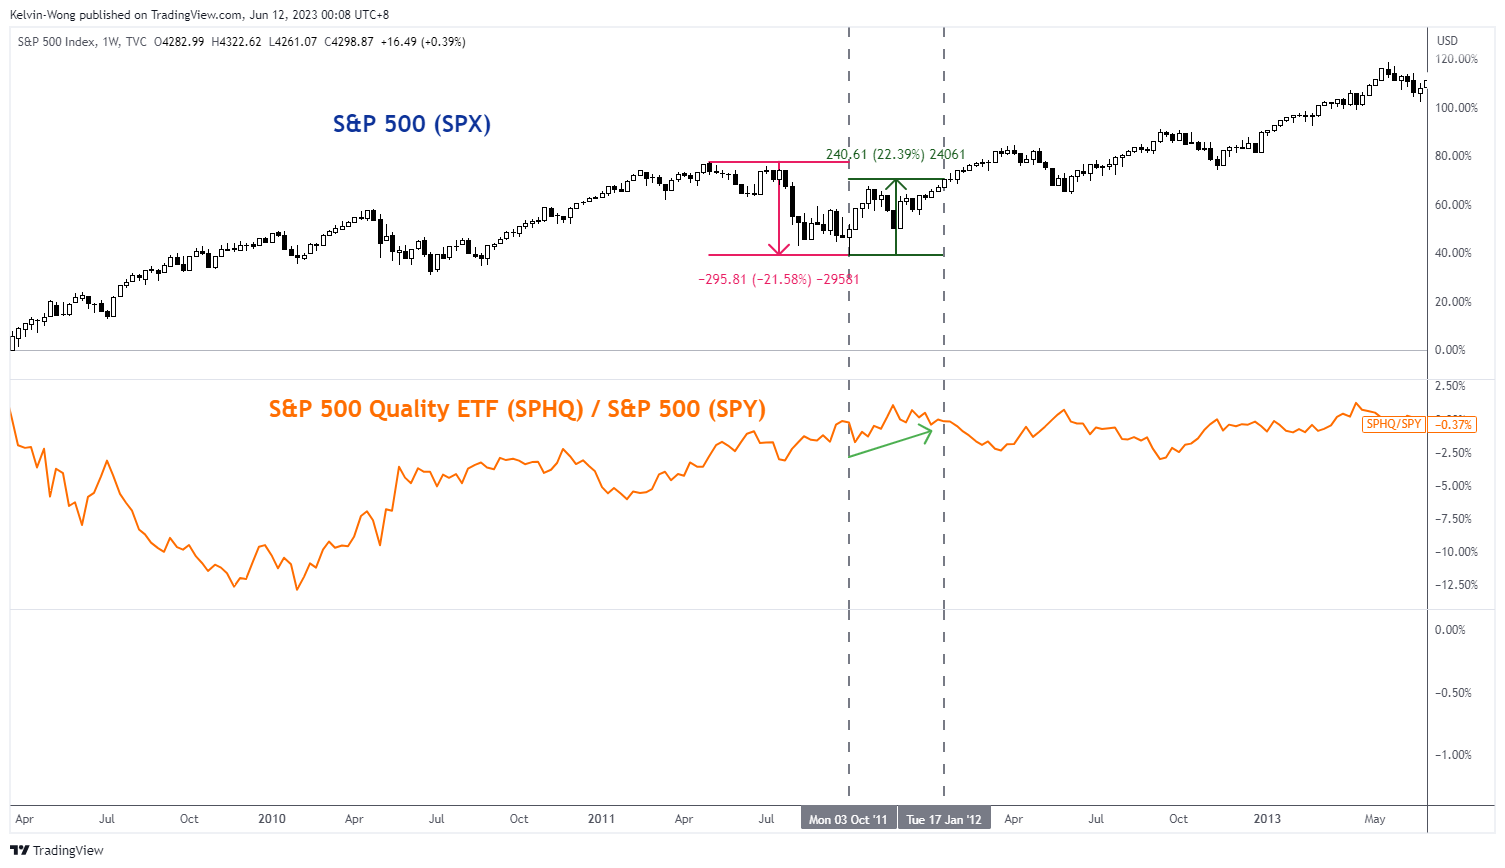
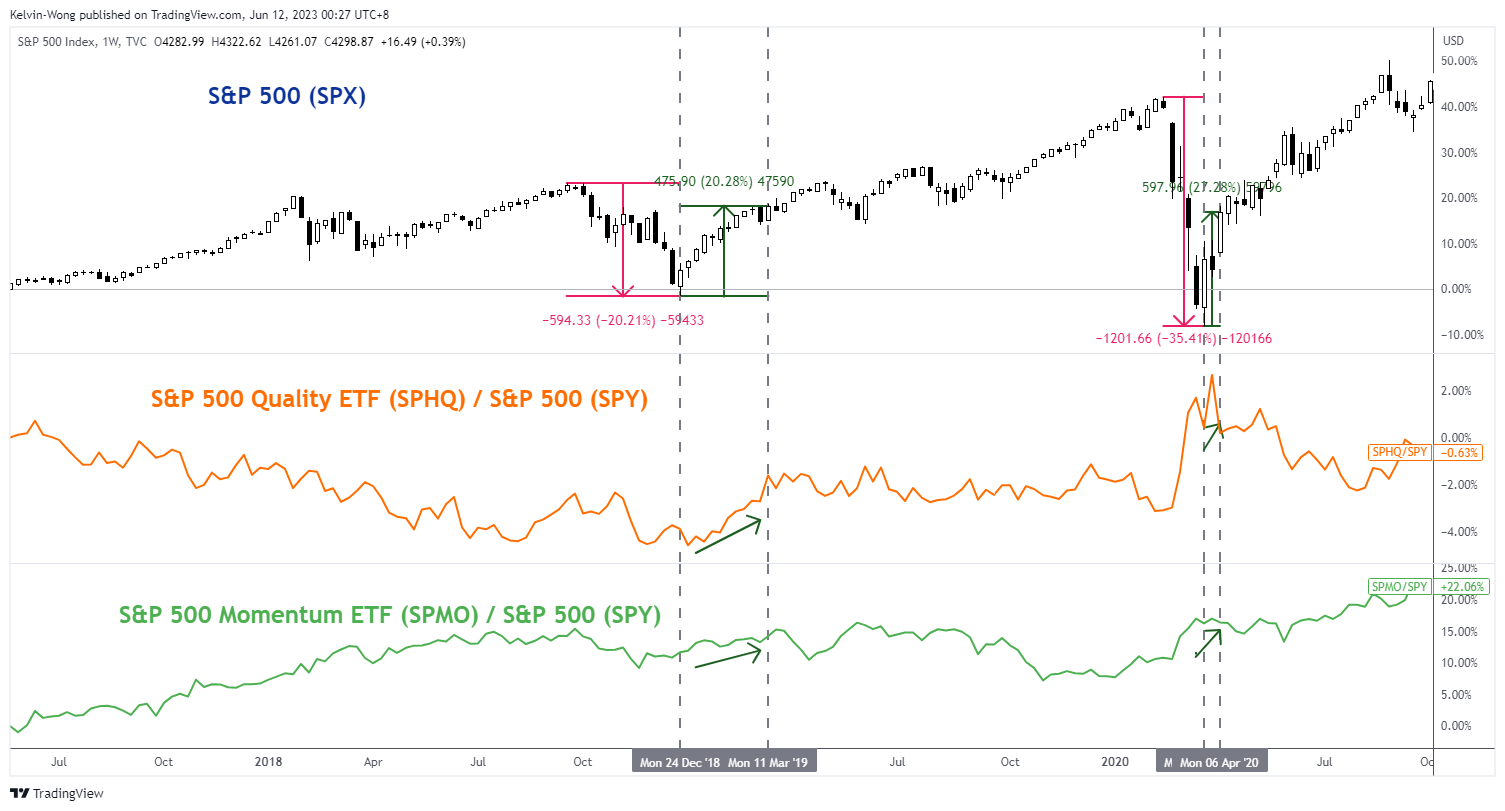
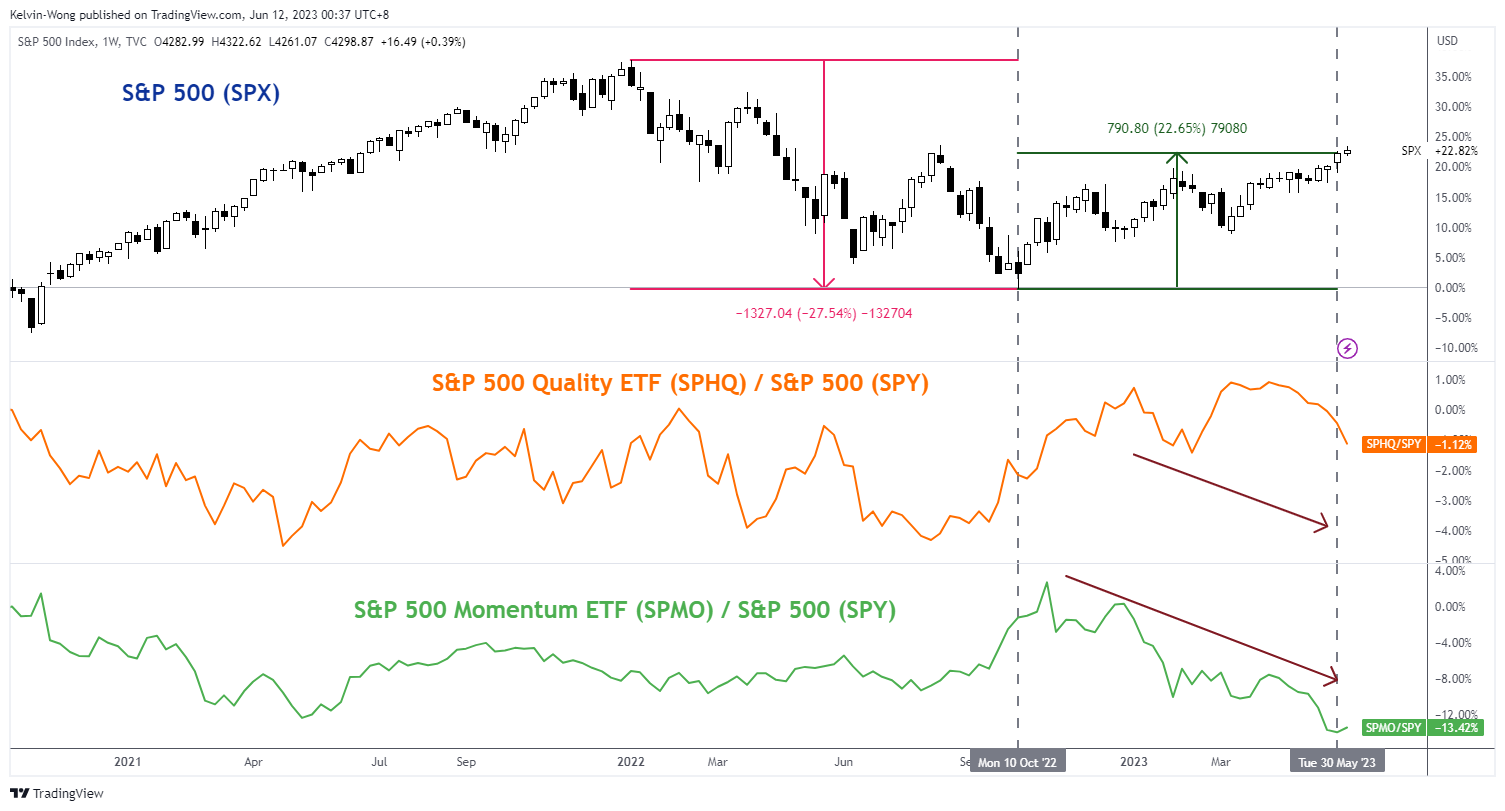
Fig 4: Performance of S&P 500 Quality & Momentum factors against S&P 500 in comparison with prior bull markets within long-term secular uptrend since March 2009 as of 9 Jun 2023
(Source: TradingView, click to enlarge chart)
The period of the observed data on the S&P 500 will be based on its current ongoing long-term secular uptrend phase in place since its March 2009 low that has been primarily supported by the central bank’s liquidity.
The “Quality” and “Momentum” smart beta factors of the S&P 500 are obtained from the Invesco S&P 500 Quality (SPHQ) and Momentum (SPMO) exchange-traded funds; relative strength analysis is applied by plotting their respective price actions over the S&P 500 (ratios of SPHQ/SPY & SPMO/SPY) to gauge underperformance or overperformance against the S&P 500.
A point to note is that the Invesco S&P 500 Momentum ETF is only incepted in October 2015, hence there is no comparison of its SPMO/SPY ratio with the prior birth of a new bull market from October 2011 to 17 January 2012.
Based on the three prior births of a new bull market (defined as low to close) from October 2011 to January 2012, December 2018 to March 2019, and March 2020 to April 2020, both the Quality and Momentum factors outperformed the S&P 500 and in turn saw the benchmark index broke higher highs thereafter.
In contrast, this latest new bull market leg from October 2022 to June 2023 does not see the outperformance of Quality and Momentum factors which may give the current bull run a suspicious doubt on its sustainability.
Overall, these highlighted risk factors are still on the radar screen and prudent risk management techniques are warranted while riding this current new bull market of the S&P 500.
BoE’s Haskel: Important to lean against risks of inflation momentum
In an article penned for The Scotsman newspaper, BoE Monetary Policy Committee member Jonathan Haskel signaled the potential for further increases in interest rates, citing persistent inflation concerns.
Haskel highlighted an improvement in UK's inflation outlook, observing, "Things look better than a few months ago. Since October last year, inflation has fallen from 11.1 per cent to 8.7 per cent, and we expect it to be around 5 per cent by the end of this year."
However, he expressed concern that "inflation remains much too high," reaffirming the MPC's commitment to achieving its 2% target. "Our tool for doing this is interest rates," he added.
"My own view is that it's important we continue to lean against the risks of inflation momentum, and therefore that further increases in interest rates cannot be ruled out," he said.
Haskel addressed the often-asked question of how increasing interest rates can help when inflation is driven by the prices of essential goods like energy and food, largely determined at a global level.
He clarified, "The aim of higher interest rates is not to affect the prices of these goods directly. Instead, it is to ensure the resulting inflation does not become embedded in the economy and prices do not continue to increase at the rates we've seen recently."