

Sample Category Title
USD/TRY Hits New Record High, CBRT Expected to Sharply Raise Interest Rates on June 22
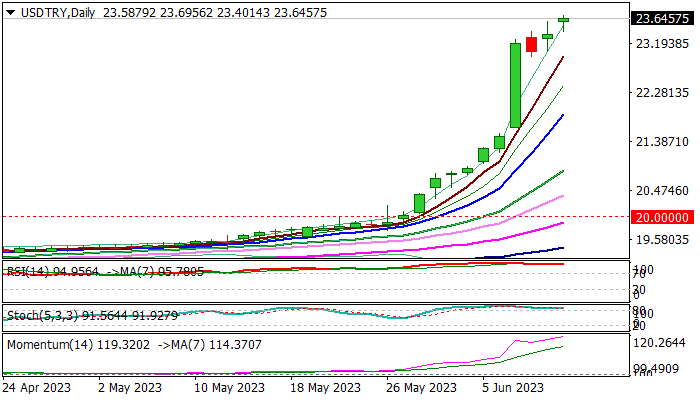
USDTRY extends steep ascend of past two weeks and hit new record high on Monday morning, after starting week with gap-higher opening.
There are no firm signs that the latest rally may run out of steam, as initial signals (Thursday’s close in red and Friday’s long-legged Doji) were offset by higher opening on Monday.
Extremely overbought daily/weekly studies suggest that bulls may take a breather after sharp bullish acceleration, as last week’s rally marked the biggest weekly gain since mid-December 2021, though still lacking clearer signal.
Treaders focus on CBRT’s June 22 policy meeting, as the finance minister and central bank governor in the new cabinet signaled a sharp turn in monetary policy towards more orthodox methods.
Wall Street banks, in the latest comments, pointed to a number of monetary and fiscal adjustments needed to stabilize the economy, expecting Turkish central bank to raise interest rate from current 8.5% to 22% and likely to reach 30% by the end of the year.
They also see possibility that rate would rise to 40% if the CBRT employs fully orthodox policy and suggest that rate could drop towards 25% if conditions stabilize.
However, markets are cautiously optimistic, as sharp policy tightening by the world major central banks in past one year, so far did not provide expected relief, as inflation in all most developed economies remains stubbornly high.
Turkey’s GDP outlook for 2023 has also been downgraded from initial forecast at 2.9% to 2.3% and economy is expected to enter recession in the second half of the year, due to sharp tightening in credit conditions.
Bulls focus psychological 24.00 barrier, ahead of Fibo projections at 24.5713 and 26.4966 (Fibo 176.4% and 200% of the uptrend from Dec 2021 low at 10.20).
Price adjustments are likely to be shallow for now and to face solid supports in the 23.00 zone, ahead of next week’s policy meeting.
Res: 23.6956; 24.0000; 24.5713; 26.4966.
Sup: 23.4014; 23.0000; 22.4026; 22.0000.
Be Wary of the New Bull Market of SP 500
- The key US benchmark stock index, S&P 500 has entered a new bull market.
- Market breadth has seen some signs of improvement as prior cyclical laggards; Energy, Industrials, and Financials sectors outperformed last week.
- Several elements such as rising sovereign bond yields, a steeper US Treasury yield curve inversion, and underperformance of Quality and Momentum beta factors raise concerns about the sustainability of the current bull market.
Last week, the key US benchmark stock index, S&P 500 finally exited its recent bear market of 282 days from its 3 January 2022 all-time high closing level to 12 October 2022 and kickstarted a fresh bull market as it rallied by at least 20% from its October 2022 low.
The improving breadth factor may indicate that this newly born bull market of the S&P 500 has the legs to push higher versus prior “false bull markets” (low to close) of 22 March 2001 to 21 May 2001, 21 September 2001 to 13 November 2001, and 20 November 2008 to 2 January 2009 where the market resumed its downtrend and broke into new respective lows.
Last week, the laggard cyclical-oriented sectors of the S&P 500; Energy (+1.71%), Industrials (+1.38%), and Financials (+1.05%) outperformed in terms of weekly returns over the S&P 500 (+0.39%) as well as the year-to-date high-flying Technology sector (-0.66%) that has led the rally since the October 2022 low.
However, do allow me to be the devil’s advocate to highlight several inherent risks that the current minted bull market of the S&P 500 may not live up to its initial bullish expectations.
Rising sovereign bond yields
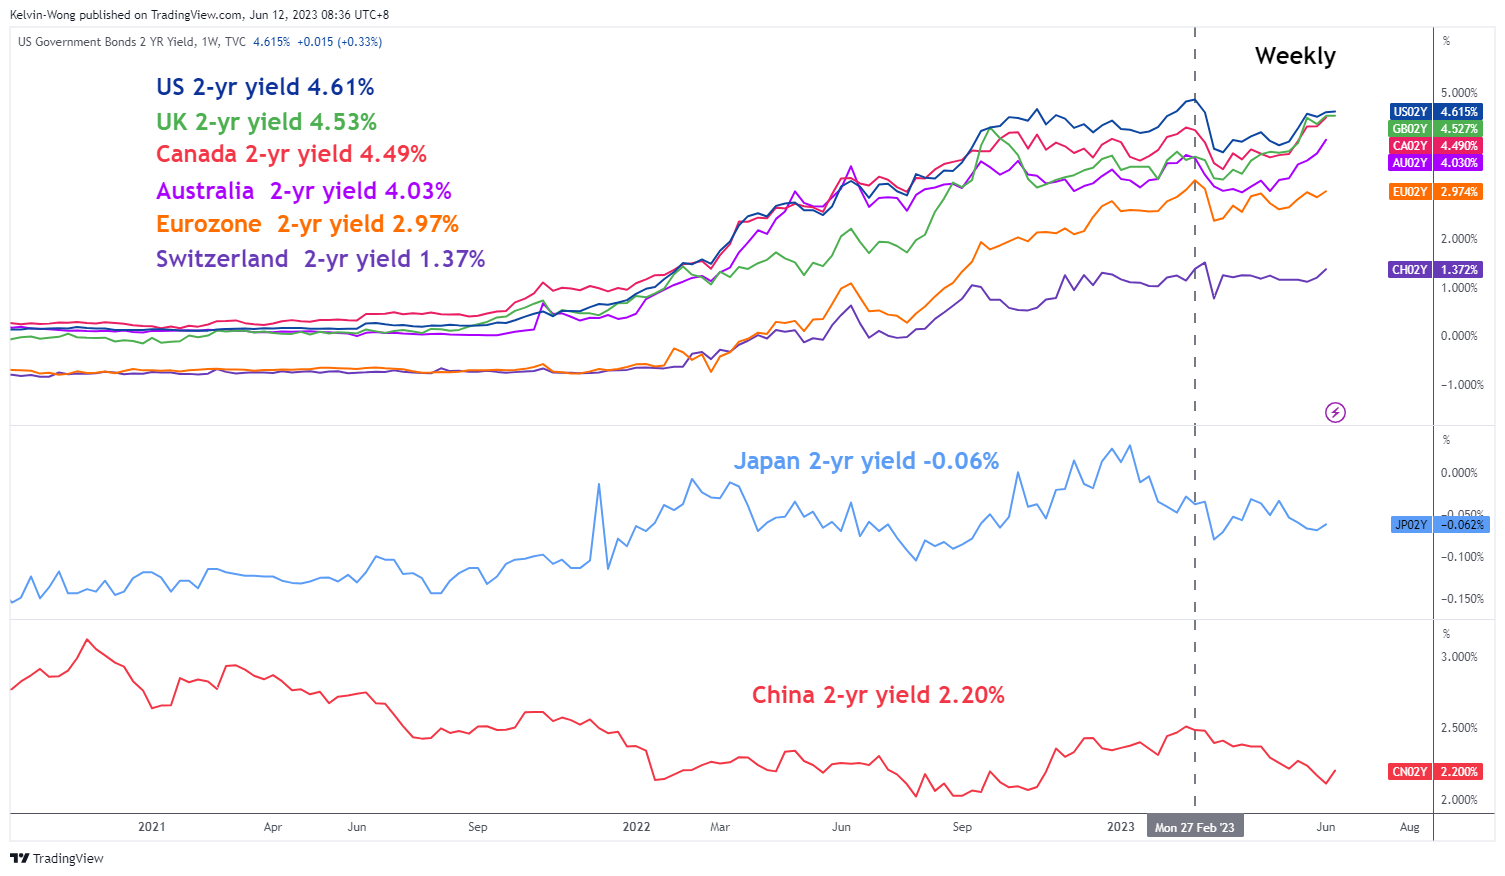
Fig 1: G-20 2-year sovereign bond yields medium-term trend as of 12 Jun 2023 (Source: TradingView, click to enlarge chart)
Except for Japan and China, the other major G-20 nations’ 2-year sovereign bond yields have started to resume their ascend in the past two weeks with the UK, Canada, and Australia’s 2-year sovereign yields breaking above their respective February 2023 highs, the up moves in the latter two countries sovereign yields have been supported by renewed interest rates hikes from their respective central banks, BoC and RBA.
The US 2-year Treasury yield is now trading at 4.61% at this time of the writing, just a whisker away from its 27 February 2023 swing high closing level of 4.86%. Also, technical analysis suggests that positive momentum has started to built-up, and the next key resistance is coming in at a higher level of 5.20%.
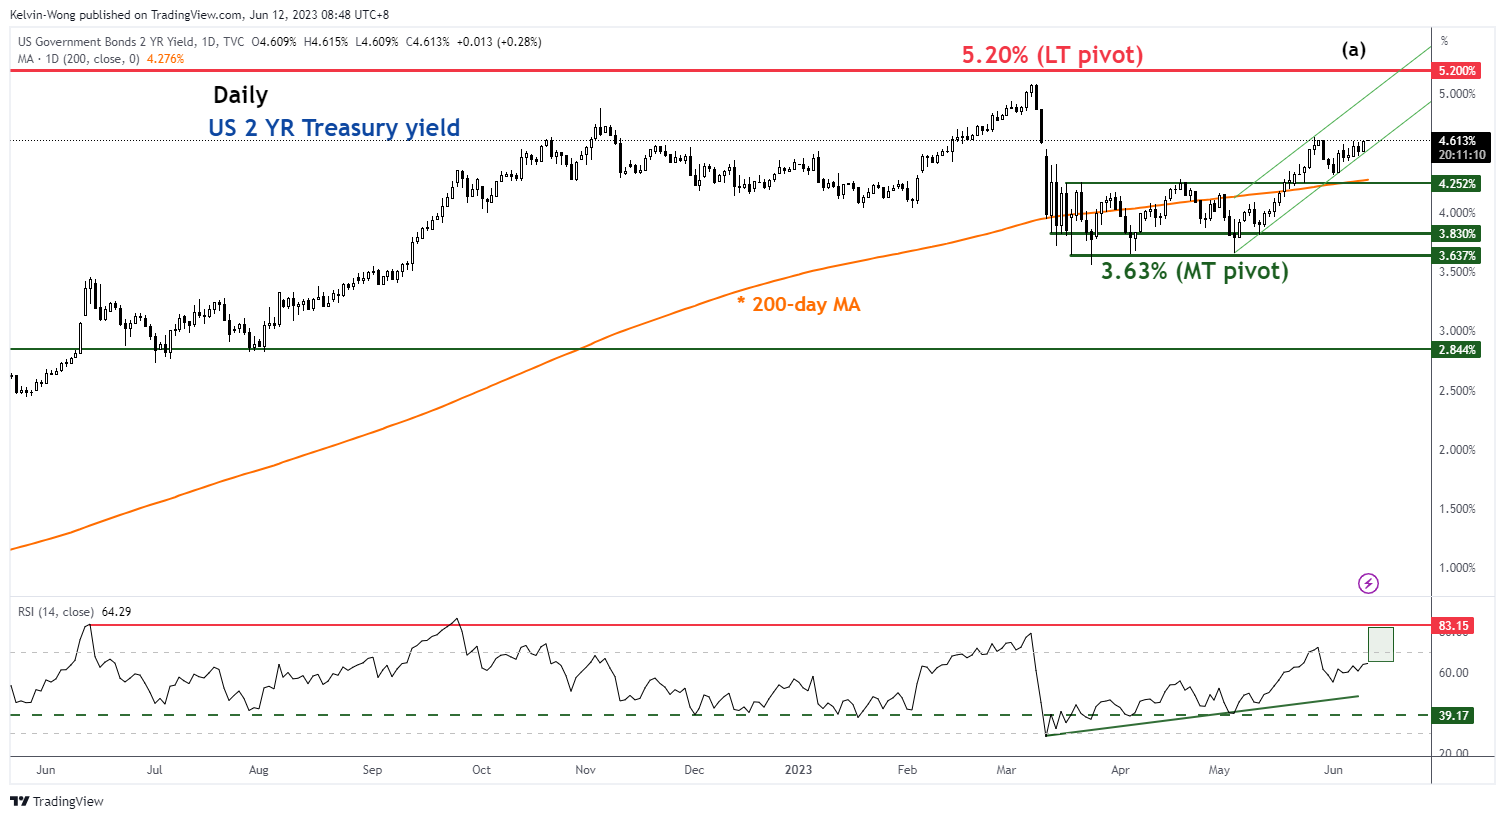
Fig 2: US 2-year Treasury yield medium-term trend as of 12 Jun 2023 (Source: TradingView, click to enlarge chart)
These observations suggest that the medium-term cost of funding for corporations may start to creep up in the second half of 2023.
US Treasury yield curve inversion (10-YR over 2-YR) is the steepest in almost 42 years
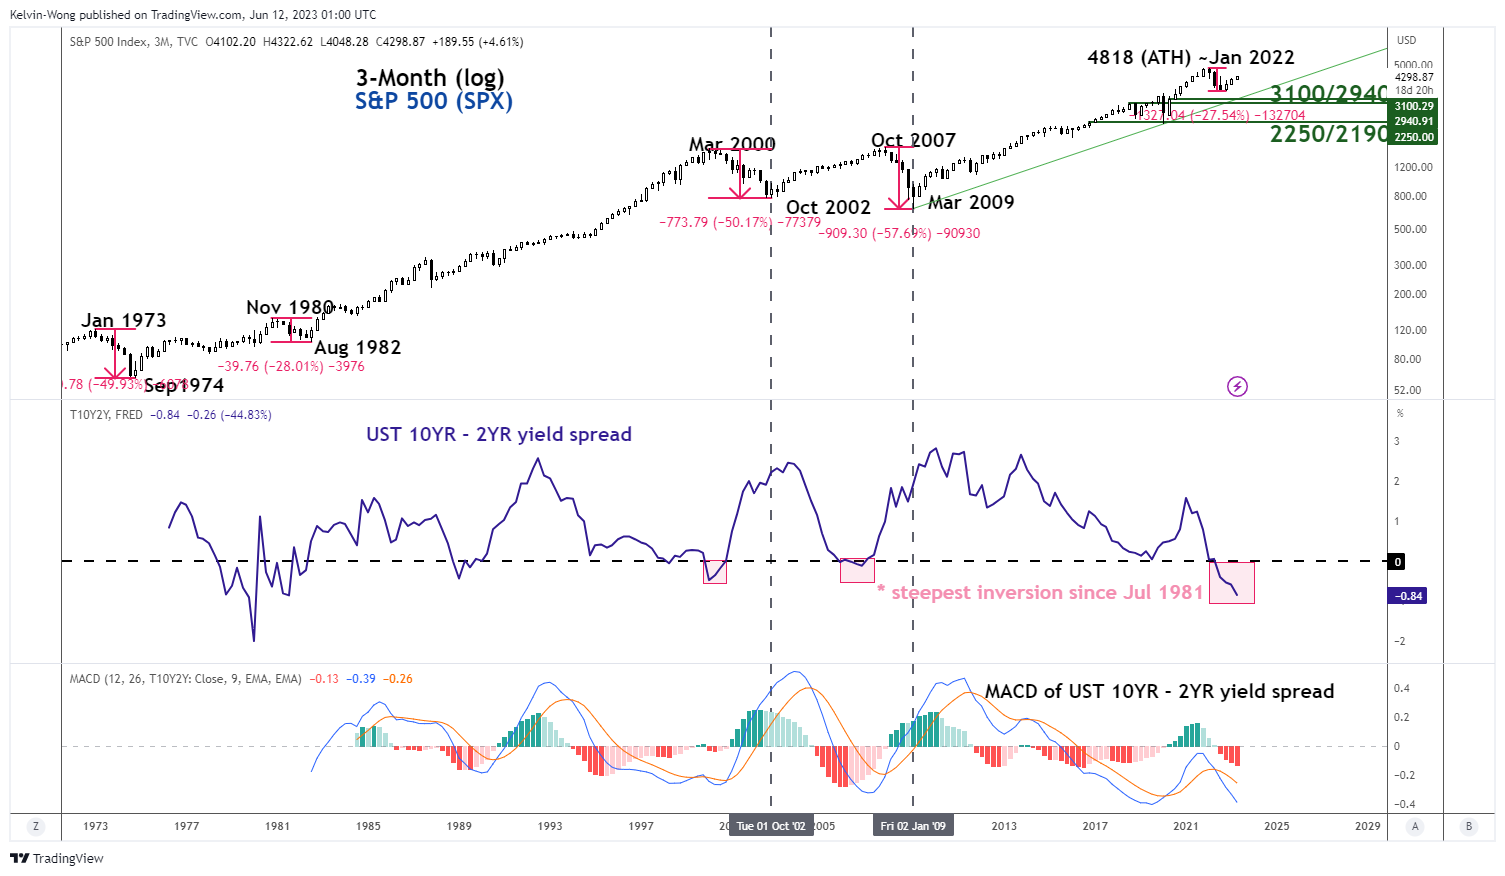
Fig 3: US 10-year over 2-year Treasury yield spread major trend as of 12 Jun 2023 (Source: TradingView, click to enlarge chart)
The inverted US Treasury yield curve measured by the 10-year minus the 2-year has continued to plummet lower to -0.84% at this time of the writing, that’s the steepest inversion level since July 1981 and the MACD trend indicator of the US Treasury 10-year over 2-year yield curve spread is not showing any signs of a potential bullish trend reversal at this juncture.
Thus, further economic weakness in the US and even a recession cannot be ruled out in the later half of 2023.
Based on the latest data from FactSet as of 9 June 2023, analysts now expect estimated Q3 2023 earnings of the S&P 500 to recover with a minor growth rate of 0.8% year-on-year after a contraction of -6.4% year-on-year recorded in Q2 2023. For Q4 2023, the estimated earnings growth rate is expected to expand further to 8.2% year-on-year; if the 8.2% earnings growth rate for Q4 turns out as expected, it will mark the highest year-on-year growth rate for the S&P 500 since Q1 2022 at 9.4%.
Given the current optimistic earnings upgrade from analysts that has been contrasted with a potentially higher cost of funding in the second half of the year and further economic weakness ahead, there could be a risk of earnings downward revisions that may put downside pressure on the S&P 500 due to overoptimistic expectations.
S&P 500 quality and momentum factors are not supporting the current bull market
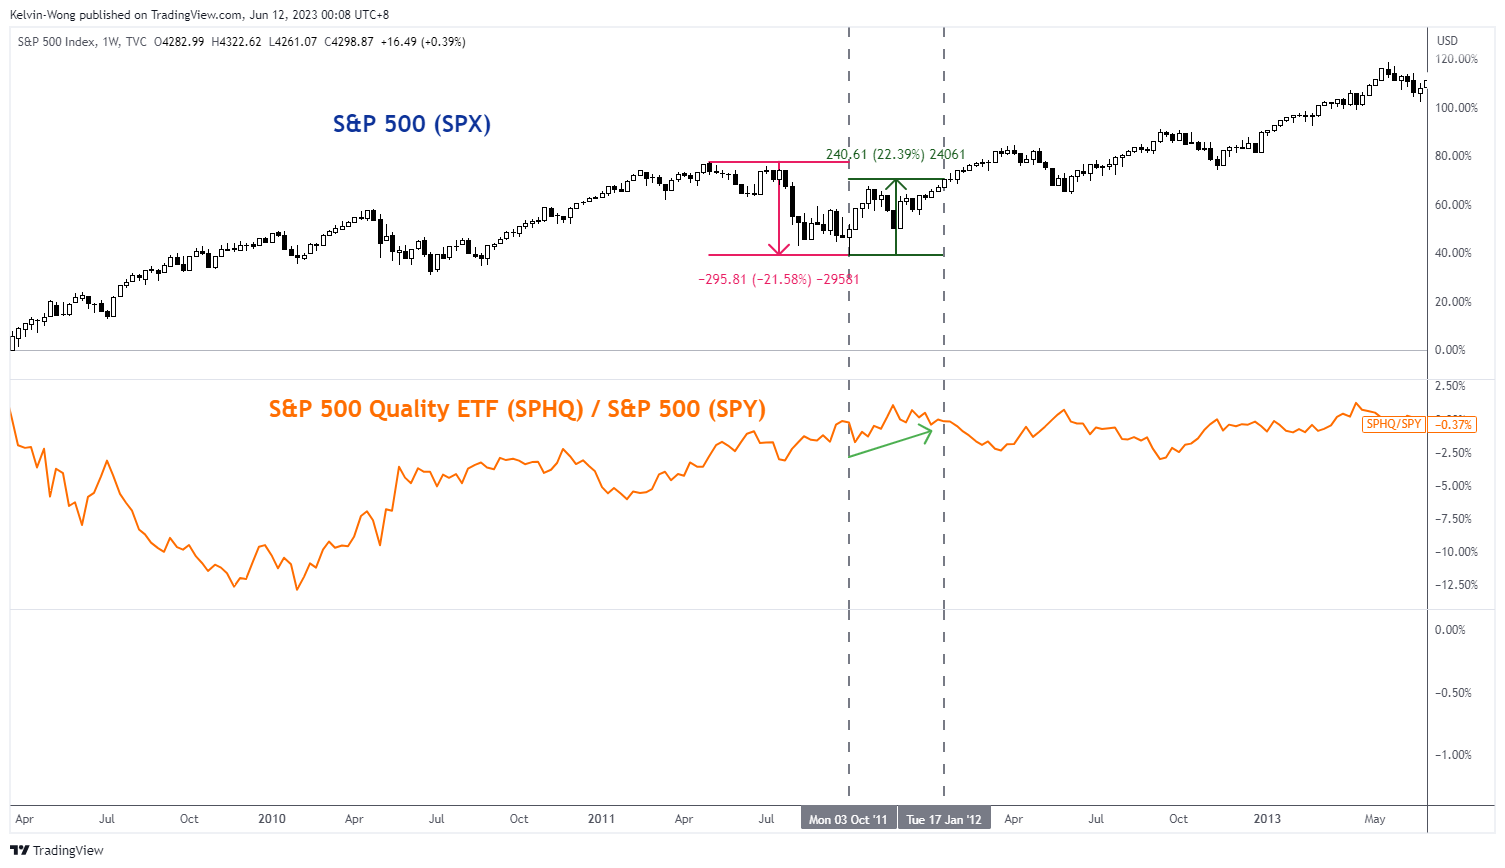
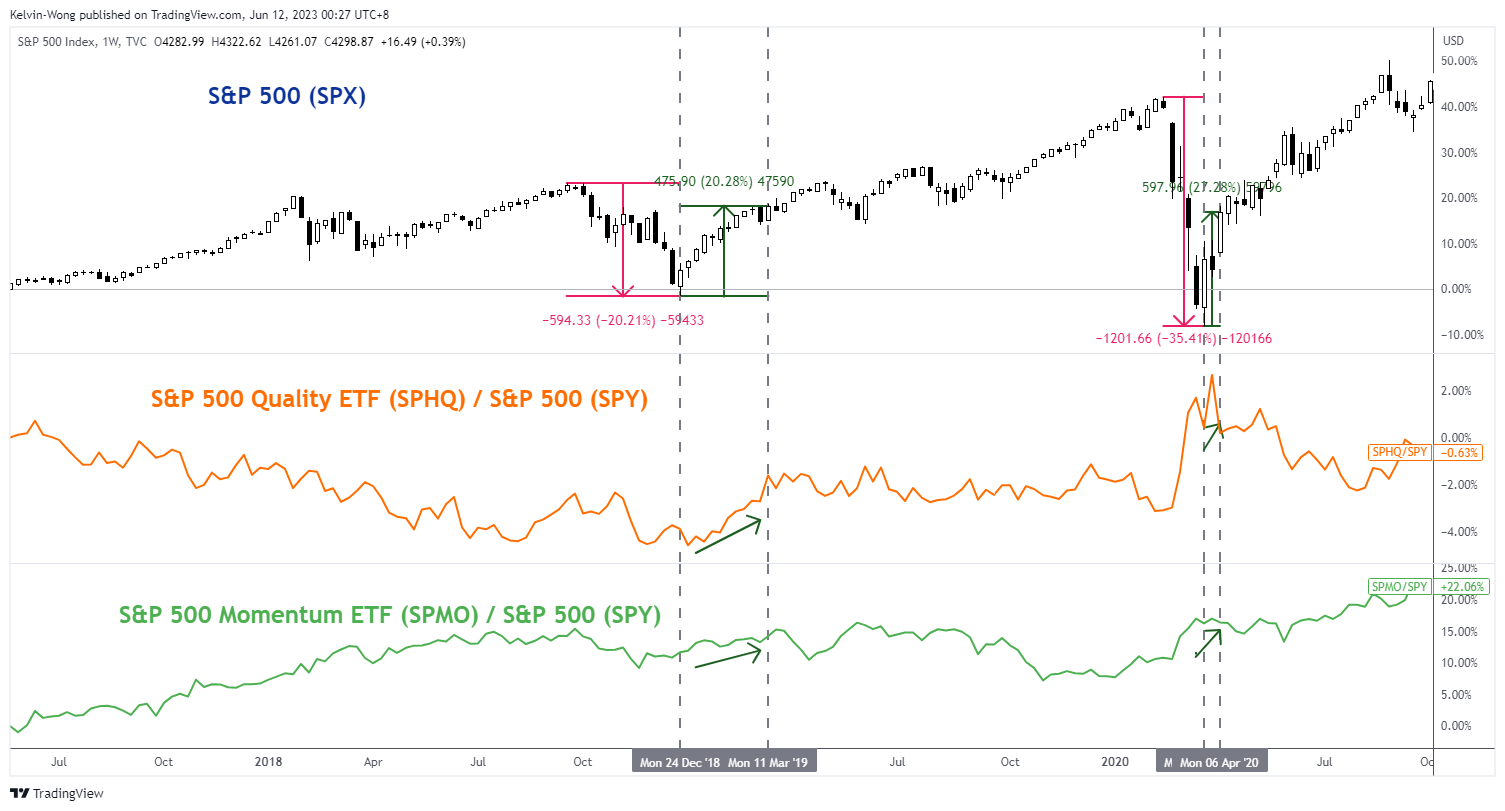
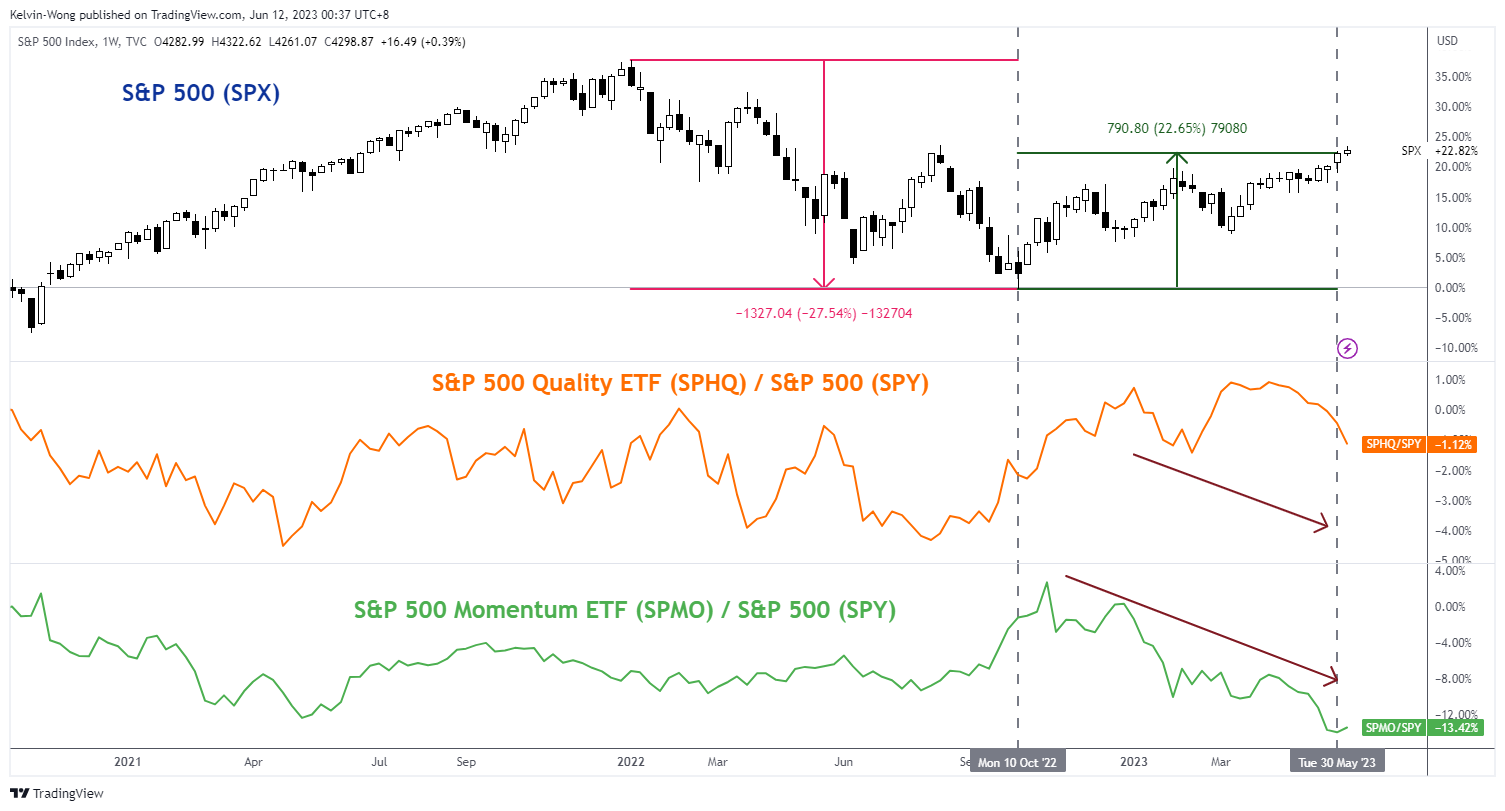
Fig 4: Performance of S&P 500 Quality & Momentum factors against S&P 500 in comparison with prior bull markets within long-term secular uptrend since March 2009 as of 9 Jun 2023
(Source: TradingView, click to enlarge chart)
The period of the observed data on the S&P 500 will be based on its current ongoing long-term secular uptrend phase in place since its March 2009 low that has been primarily supported by the central bank’s liquidity.
The “Quality” and “Momentum” smart beta factors of the S&P 500 are obtained from the Invesco S&P 500 Quality (SPHQ) and Momentum (SPMO) exchange-traded funds; relative strength analysis is applied by plotting their respective price actions over the S&P 500 (ratios of SPHQ/SPY & SPMO/SPY) to gauge underperformance or overperformance against the S&P 500.
A point to note is that the Invesco S&P 500 Momentum ETF is only incepted in October 2015, hence there is no comparison of its SPMO/SPY ratio with the prior birth of a new bull market from October 2011 to 17 January 2012.
Based on the three prior births of a new bull market (defined as low to close) from October 2011 to January 2012, December 2018 to March 2019, and March 2020 to April 2020, both the Quality and Momentum factors outperformed the S&P 500 and in turn saw the benchmark index broke higher highs thereafter.
In contrast, this latest new bull market leg from October 2022 to June 2023 does not see the outperformance of Quality and Momentum factors which may give the current bull run a suspicious doubt on its sustainability.
Overall, these highlighted risk factors are still on the radar screen and prudent risk management techniques are warranted while riding this current new bull market of the S&P 500.
BoE’s Haskel: Important to lean against risks of inflation momentum
In an article penned for The Scotsman newspaper, BoE Monetary Policy Committee member Jonathan Haskel signaled the potential for further increases in interest rates, citing persistent inflation concerns.
Haskel highlighted an improvement in UK's inflation outlook, observing, "Things look better than a few months ago. Since October last year, inflation has fallen from 11.1 per cent to 8.7 per cent, and we expect it to be around 5 per cent by the end of this year."
However, he expressed concern that "inflation remains much too high," reaffirming the MPC's commitment to achieving its 2% target. "Our tool for doing this is interest rates," he added.
"My own view is that it's important we continue to lean against the risks of inflation momentum, and therefore that further increases in interest rates cannot be ruled out," he said.
Haskel addressed the often-asked question of how increasing interest rates can help when inflation is driven by the prices of essential goods like energy and food, largely determined at a global level.
He clarified, "The aim of higher interest rates is not to affect the prices of these goods directly. Instead, it is to ensure the resulting inflation does not become embedded in the economy and prices do not continue to increase at the rates we've seen recently."
Gold Extends Sideways Move Below 2,000
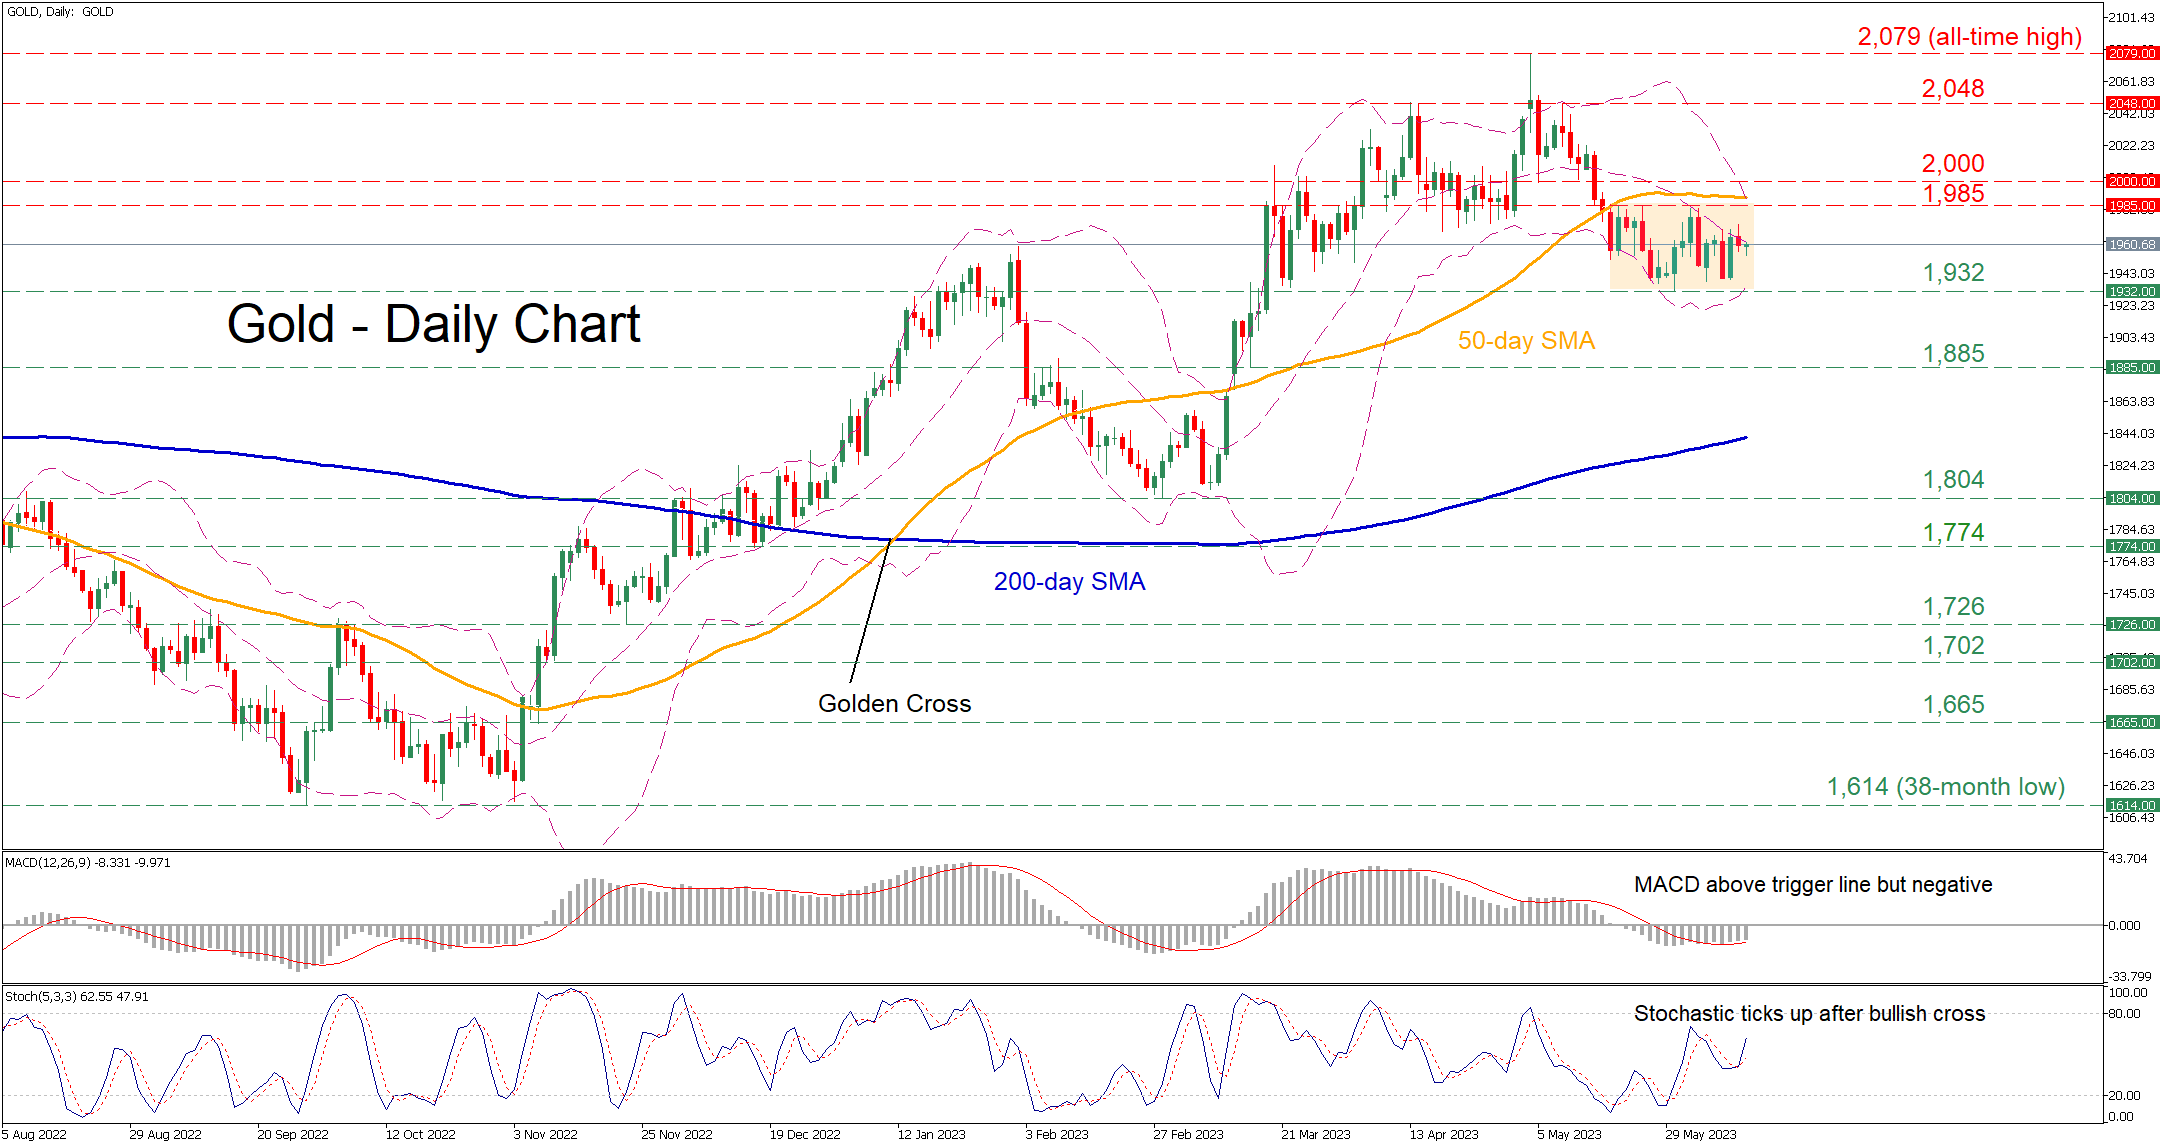
Gold experienced a mild pullback after peaking at the all-time high of 2,079 in early May, falling beneath its 2,000 psychological mark and the 50-day simple moving average (SMA). Although bullion managed to halt its retreat at the 2½-month low of 1,932, it has been trading sideways for the past three weeks.
The momentum indicators currently suggest that bearish forces are subsiding. Specifically, the MACD jumped above its red signal line but remains in negative territory, while the stochastic oscillator is ticking upwards after posting a bullish cross.
Should buying pressures intensify, the bulls could attack 1,985, which is the upper end of the recent rangebound pattern. A violation of that zone could set the stage for the 2,000 psychological mark before 2,048 comes under examination. Failing to halt there, the price could ascend to test its record high of 2,079.
On the flipside, if the short-term weakness persists, the price could initially challenge the 2½-month low of 1,932. Should that floor collapse, the spotlight could turn to 1,885 before the 2023 bottom of 1,804 gets tested. A break below the latter could trigger a retreat towards the 1,774 hurdle.
Overall, gold has been directionless in the past three weeks, but the short-term oscillators are slowly tilting towards the bullish side. Therefore, a break above the 50-day SMA is needed to put an end to the recent downside correction.
EURCHF Downside Breakout Might Not Have Legs
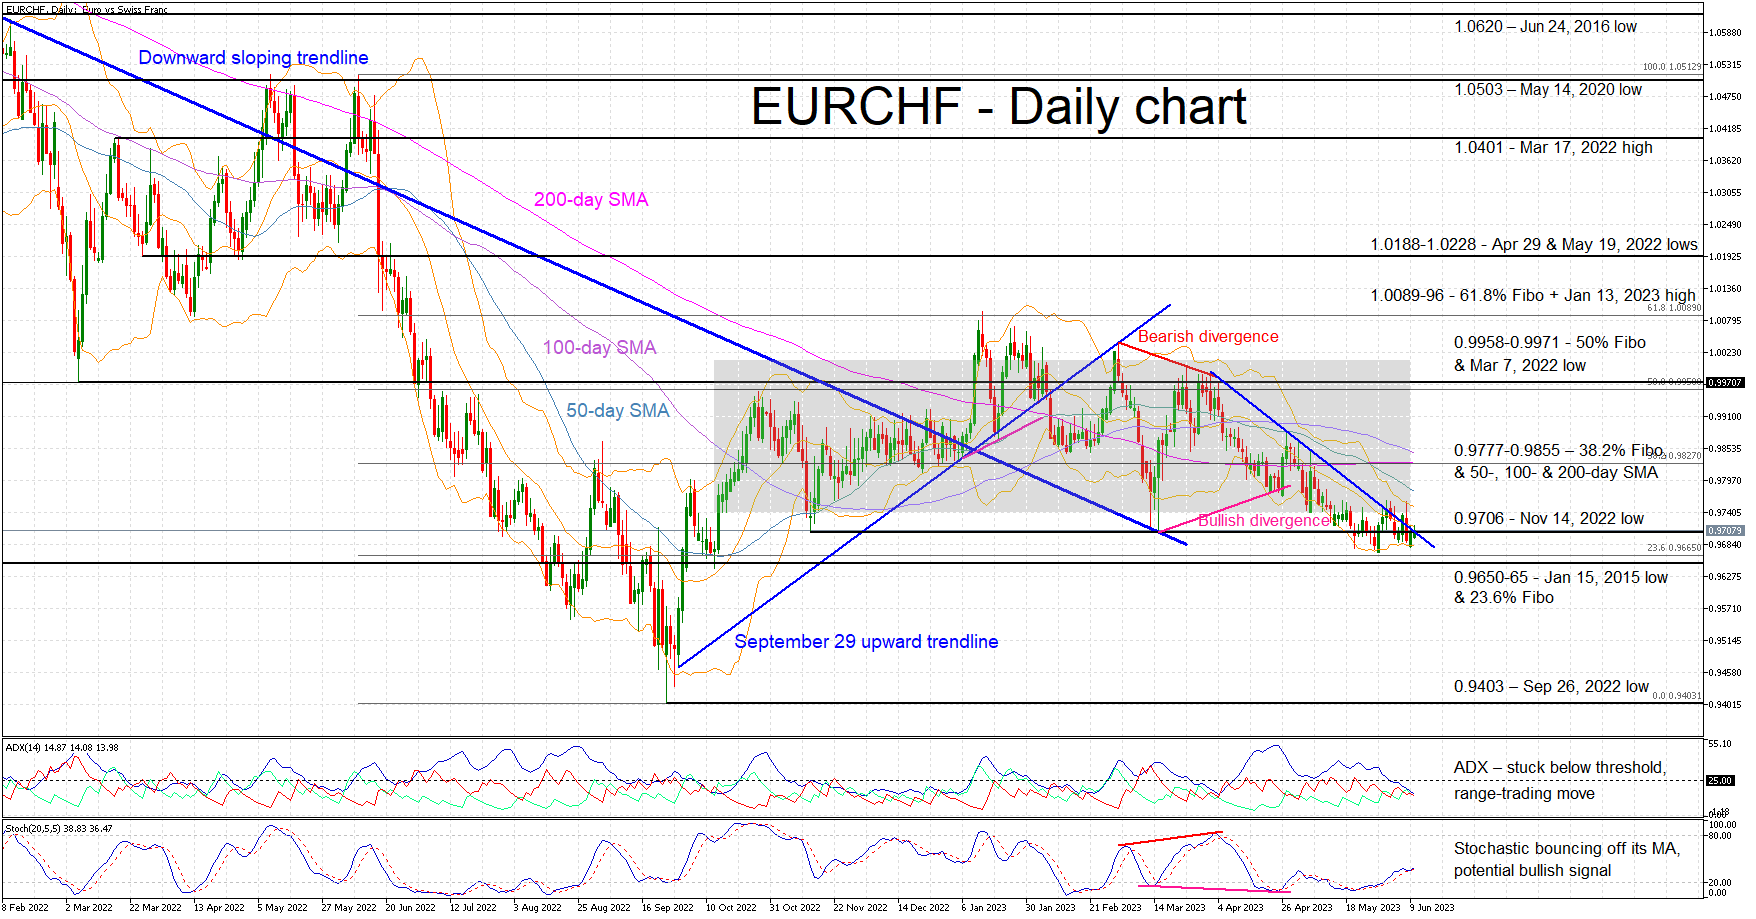
EURCHF is hovering around the 0.9706 level, a tad below the rectangle that has been dominating the price action since October 13, 2022. However, as the price move following the recent bearish breakout has been very weak, there are increased chances of a rebound back inside the rectangle. That would potentially be significant from a short-term momentum perspective.
With the Average Directional Movement Index (ADX) stuck below its 25-threshold and signaling an entirely range-trading market, the focus turns to the stochastic oscillator for some sort of guidance. Interestingly, this indicator appears to bounce off its moving average, a potential bullish signal.
Should the bulls decide to push the market higher, they would have to overcome the 0.9706 level set by the November 14, 2022 low. The path then looks trickier as the various simple moving averages (SMAs) occupy the 0.9777-0.9855 area along with the 38.2% Fibonacci retracement of the June 9, 2022 – September 26, 2022 downtrend.
On the other hand, the bears are keen on staging a proper move lower to negate any thoughts of a false breakout. The first test comes at the 0.9650-0.9665 area defined by the January 15, 2015 low and the 23.6% Fibonacci retracement respectively. Even lower, the next key resistance might come at the 0.9403 area.
To sum up, the much-expected bearish EURCHF breakout has not delivered a sizeable correction, increasing the chances for a strong upleg.
GBPCAD Forecasting The Path & Selling The Rallies At The Blue Box
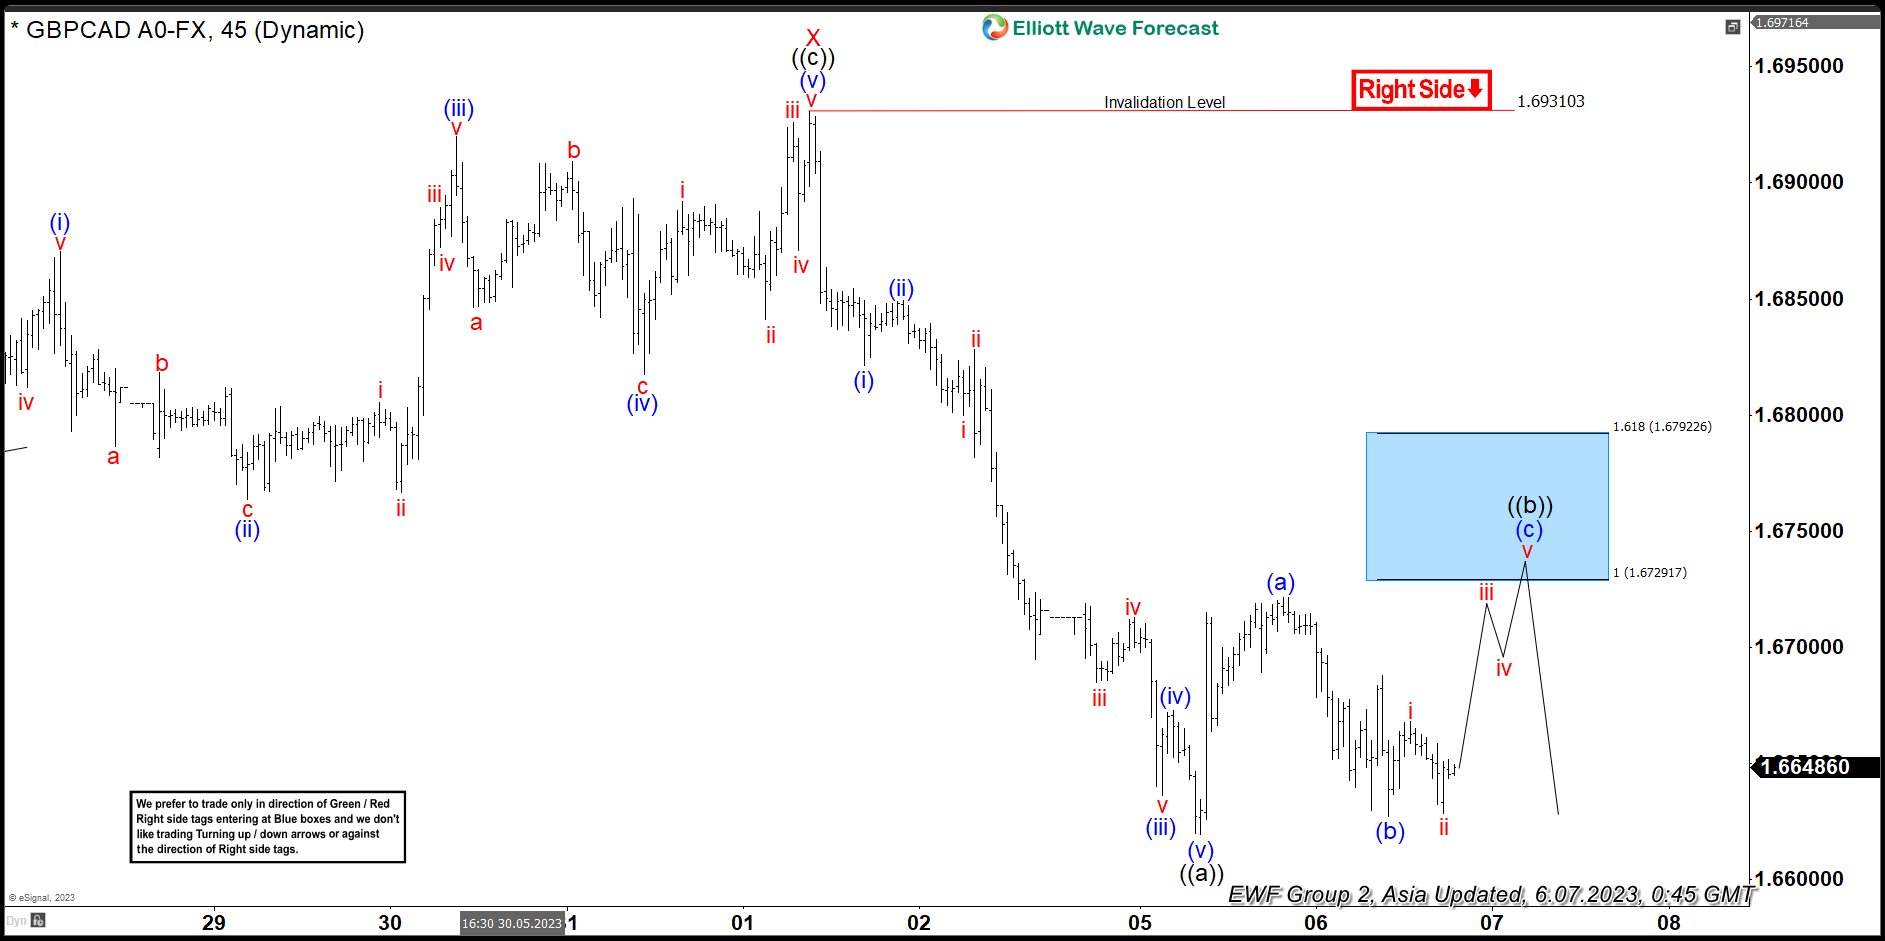
Hello traders. In this technical article we’re going to take a look at the Elliott Wave charts charts of GBPCAD published in members area of the website. Recently the pair made short term recovery against the 1.6931 peak that has reached the extreme zone. It made clear 3 waves up from the lows and made decline from our Blue Box ( selling zone) . In further text we’re going to explain the Elliott Wave pattern and trading setup
GBPCAD 1h Hour Asia Elliott Wave Analysis 06.07.2023
GBPCAD is giving us short term red recovery against the 1.6931 high. Correction is unfolding as Elliott Wave Zig Zag Pattern with (a)(b)(c) blue inner labeling. So far rally from the lows looks like 5 waves, so we expect to see another 5 waves up in (c) blue leg. Target area is marked as a Blue Box : 1.6729-1.6792 on the chart and that is our selling zone. At the marked area buyers should be ideally taking profits and sellers can appear again. Consequently , we expect to see reaction from that zone. The pair can make either decline toward new lows or larger 3 waves pull back at least. Once pull back reaches 50 Fibs against the (b) blue low, we will make short position risk free ( put SL at BE) and take partial profits. Break of 1.618 fib extension: 1.6792 would invalidated the trade.
Reminder on how to trade EWF Charts :
Red bearish stamp+ blue box = Selling Setup
Green bullish stamp+ blue box = Buying Setup
Charts with Black stamps are not tradable. 🚫
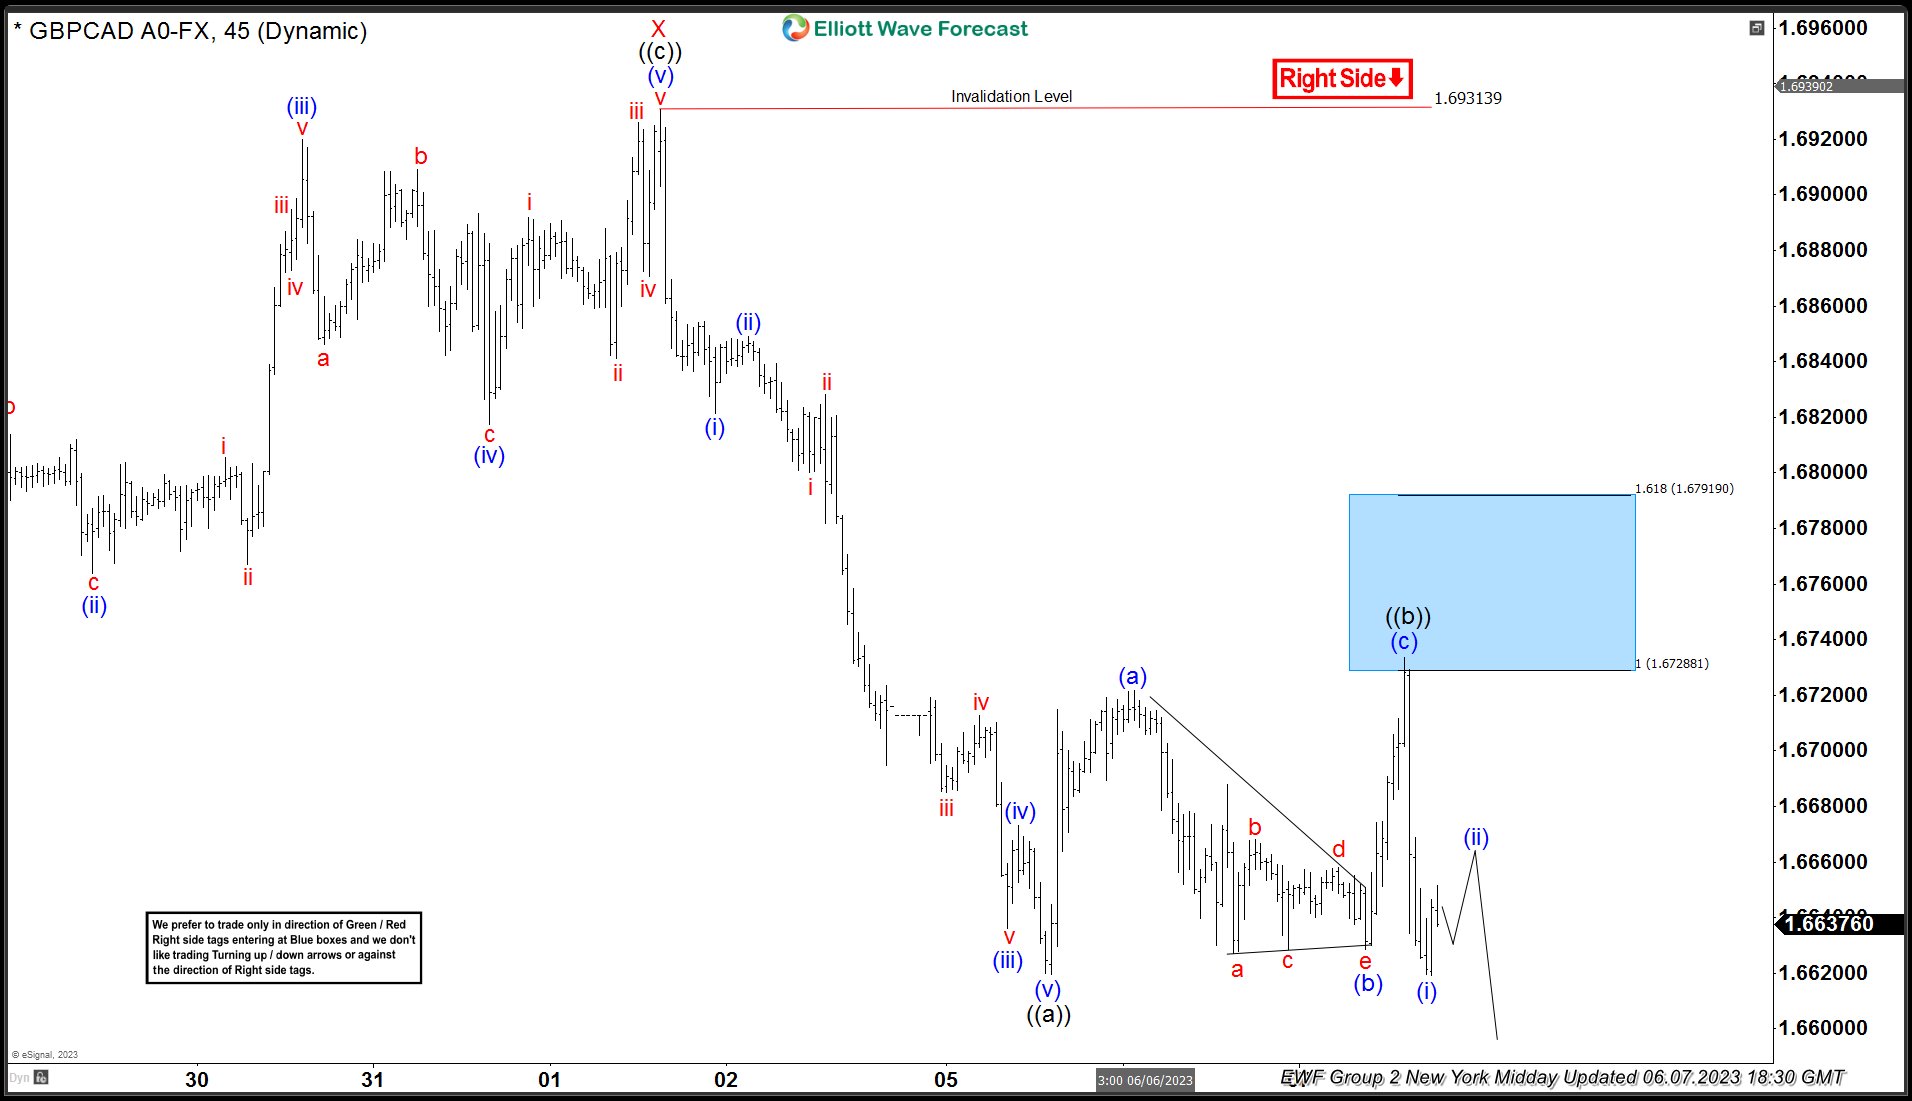
GBPCAD 1h Hour New York Midday Elliott Wave Analysis 06.07.2023
The pair found sellers right at the blue box and made decline from there toward new lows. At this stage we see the pair remains bearish against the 1.6931 pivot. Decline from the peak looks to be unfolding as 5 waves. As far as the price holds below 1.6733 level, short term recovery ((b)) can be done there. Otherwise, if we get strong reaction to the upside and 1.6733 peak gives up, then the pair could make irregular Flat pattern against the 1.69313 peak. Anyway, members who took short trades have made positions risk free. They have Put Stop Loss at entry level and took partial profits.
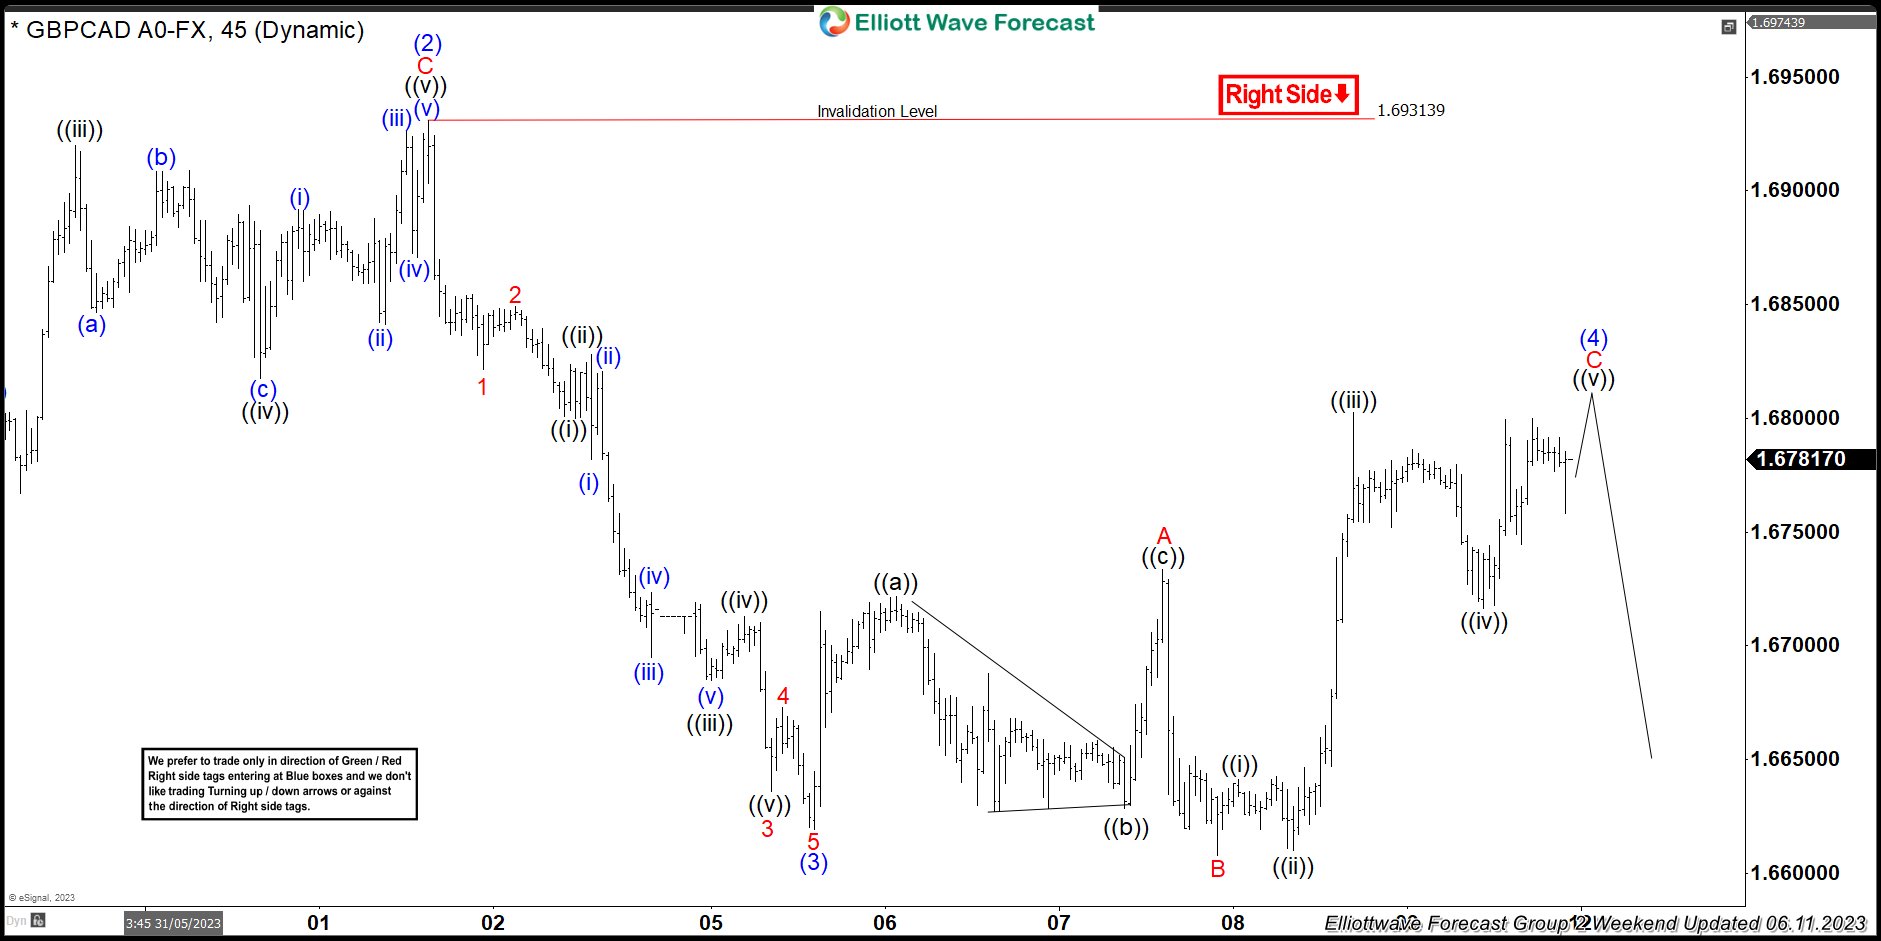
GBPCAD 1h Hour Weekend Elliott Wave Analysis 06.11.2023
The pair has taken alternative path. It made sharp rally and broke the previous high. We assume correction against the 1.6931 high is still in progress as potential Elliott Wave Flat pattern. Keep in mind there is no Blue Box on the chart at the moment, so don’t like forcing the trades at the current levels. When looking for a trade, corrections against the trend should be Double Three or Zigzag, that can give us clear entries and invalidation levels. We avoid Triple Threes and especially Flat structures for trading purpose as they are tricky to trade.
As you can notice, trading is not about being right all the time. We don’t make the market and our forecasts don’t have 100% accuracy. However we do have a system which allows us to get out Risk Free + cash partial profit from the trade, even if primary analysis gets wrong.
USD/CAD: The Price is Expected to Rise in a Minute Impulse
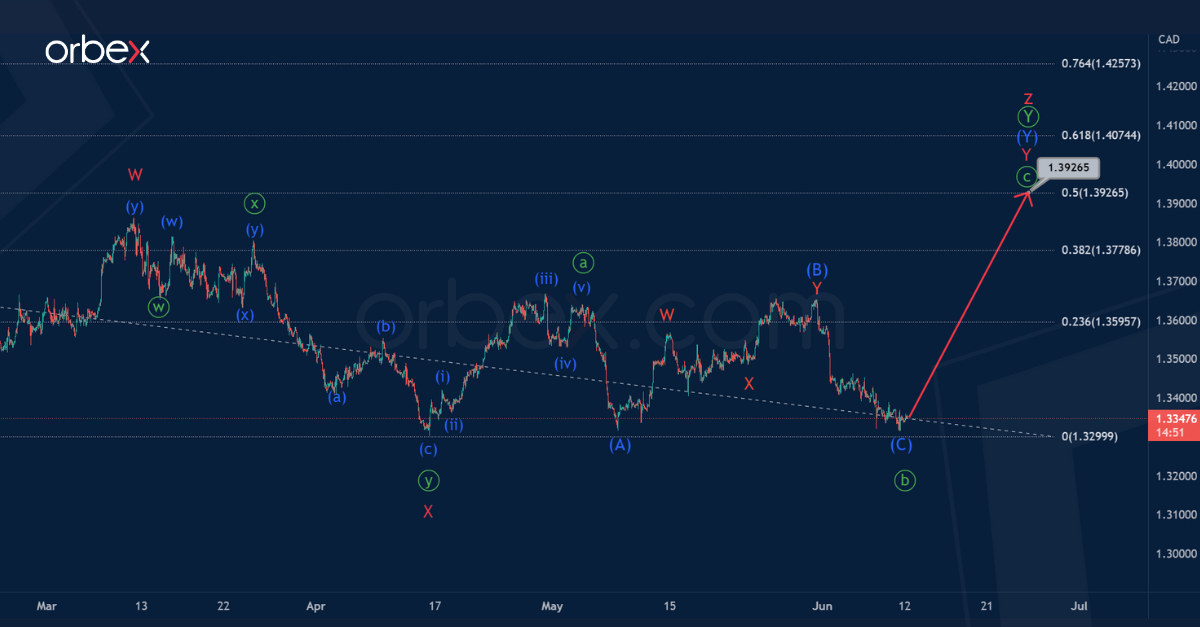
In the global perspective, USDCAD may build a global triple zigzag w-x-y-x-z.
The current chart shows the final actionary wave z of the cycle degree. Apparently, it takes the form of a primary double zigzag Ⓦ-Ⓧ-Ⓨ, where the sub-waves Ⓦ-Ⓧ are completed.
Now we see the development of the primary wave Ⓨ, more precisely, its final part – intermediate wave (Y). It is assumed that the wave (Y) to be completed in the form of minute zigzag ⓐ-ⓑ-ⓒ near 1.392.
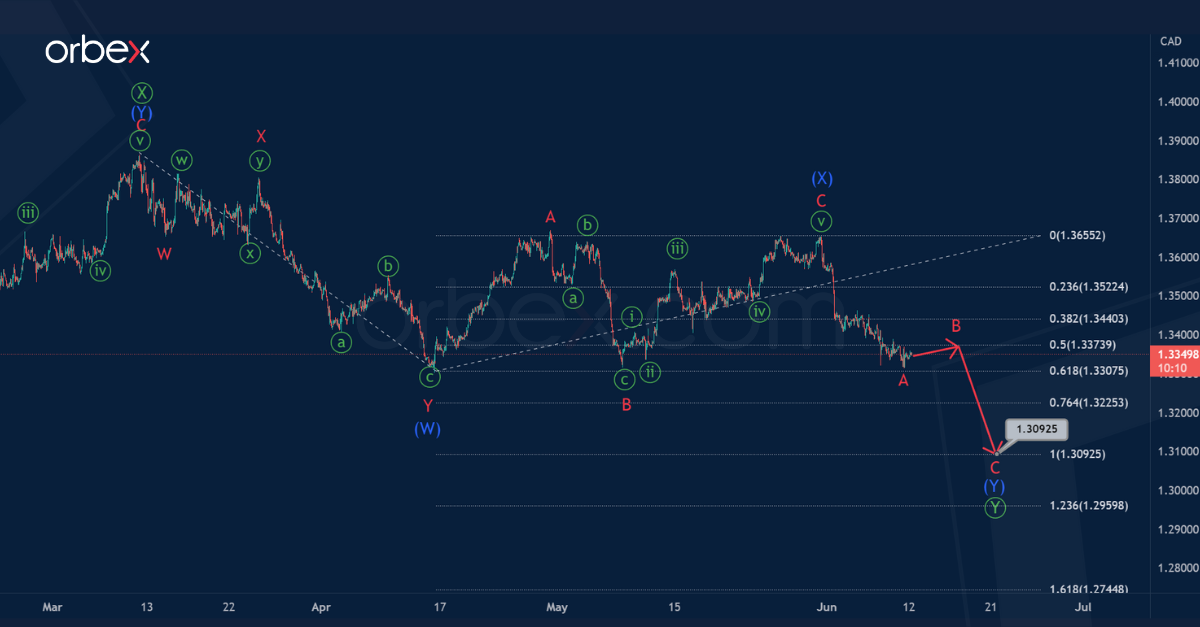
In the second scenario, we may see the construction of a bearish double zigzag Ⓦ-Ⓧ-Ⓨ.
As part of the primary pattern, the waves Ⓦ-Ⓧ are completed, so a continuation of the bearish primary wave Ⓨ is possible.
The primary wave Ⓨ, taking the form of a minor double zigzag, may end at the minimum of the wave Ⓦ, near 1.309.
At the specified level, the intermediate waves (W) and (Y) will be equal to each other.
CAD Probes Key Resistance
USD/CAD struggles to bounce
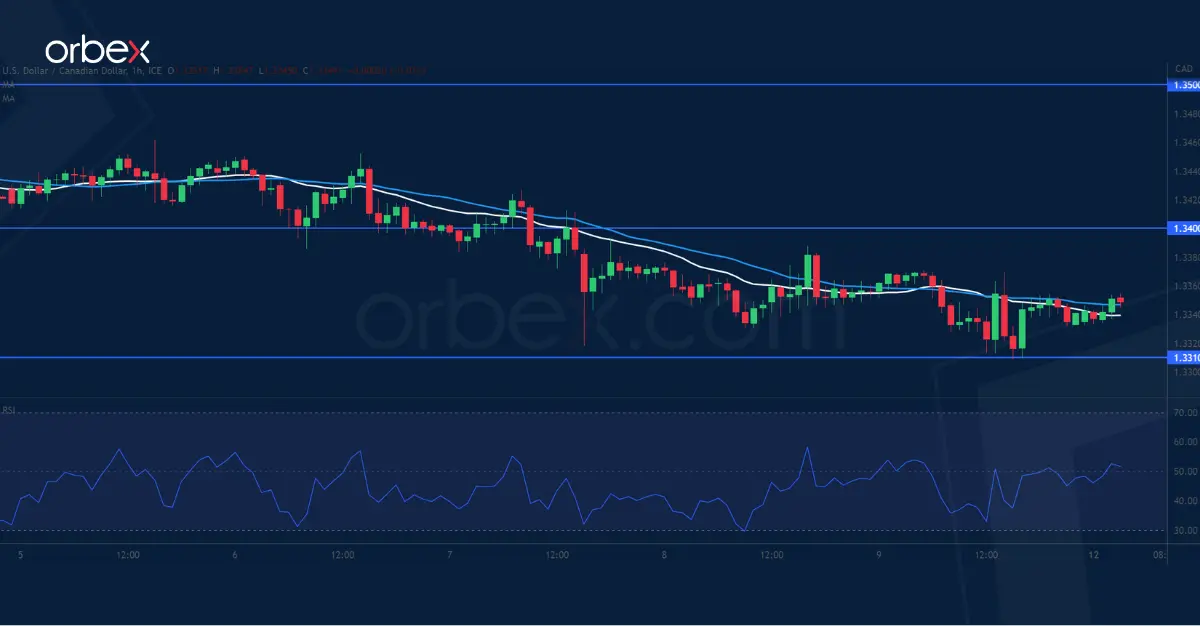
The Canadian dollar rallied after May’s unemployment rate came out lower than expected. The major floor of 1.3310 from the daily chart has attracted some bargain hunters but may not be enough to turn the cautious mood around. A bearish breakout would force buyers to bail out and trigger a correction towards last September’s lows near 1.3000, putting a dent to the bullish bias in the medium-term. 1.3400 is a fresh resistance and 1.3500 is a key obstacle to lift before the US dollar could make a sustained comeback.
EUR/GBP breaks critical floor
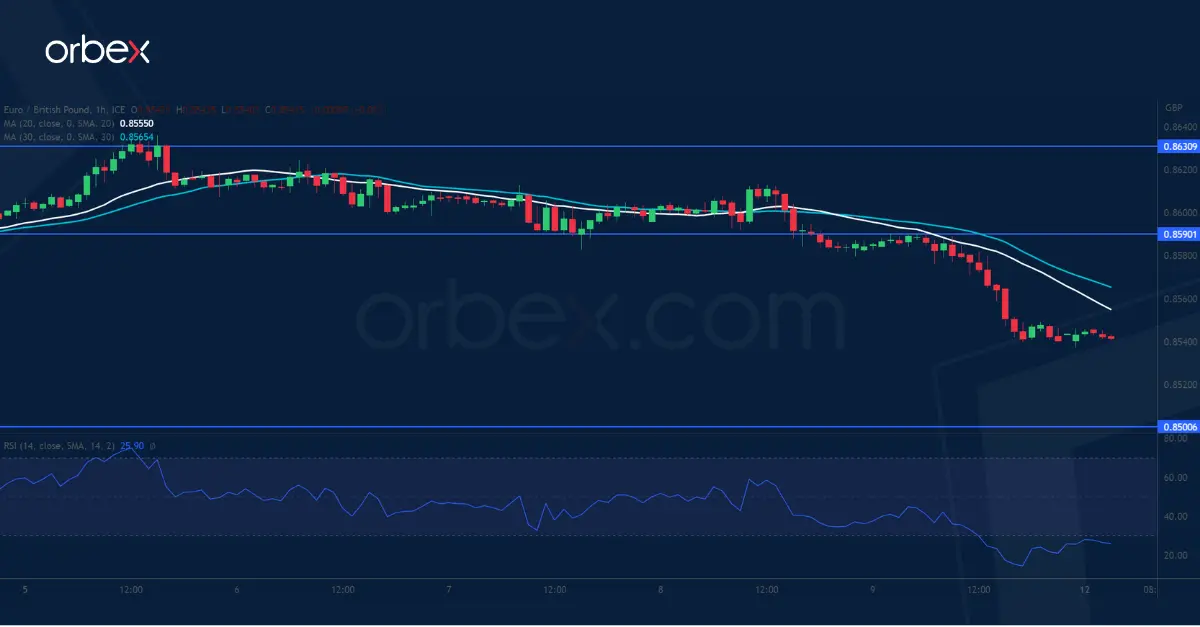
The pound rallied with the prospect of more rate hikes from the BoE amid sticky inflation. The price cut through last December’s low of 0.8560 after it struggled to preserve gains from the past few months. A lack of buying interests left the door open for momentum selling and triggered a new round of sell-off. 0.8500 is the next stop with an oversold RSI likely to attract some dip buyers. However, as sentiment turned wary, the bears may sell into strength at the first resistance of 0.8590. 0.8630 on the 20-day SMA is a strong hurdle.
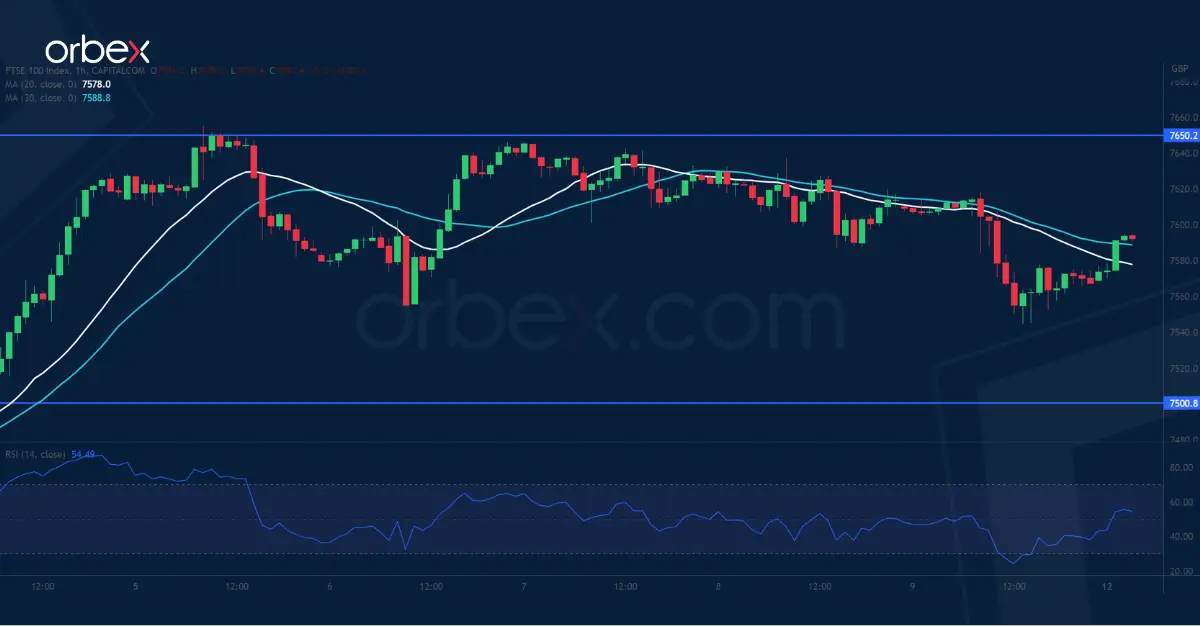
FTSE 100 seeks support
The FTSE 100 slipped as stresses in the housing sector dented investors’ risk appetite. The rebound came under pressure at the confluence of the brief swing high of 7650 and the 20-day SMA which acts like a dynamic resistance in the current corrective path. A bullish breakout would prompt sellers to cover and ease the downward pressure, paving the way for a recovery to the previous consolidation area around 7800. Failing that, the demand zone 7440-7500 is an important level to prevent a broader liquidation.
There’s a Tail Risk Scenario to See Last-Minute Change of Heart at Fed
Markets
Sign of the times. Last week’s surprising hawkish 25 bps rate hikes by the Reserve Bank of Australian and by the Bank of Canada upped the ante going into this week’s monetary policy meetings by the Fed and by the ECB. The RBA and the BoC both paused their policy normalization cycles earlier this year, only to conclude that their efforts proved to be insufficient still. As the BoC put it the most clearly: “monetary policy was just not sufficiently restrictive to bring supply and demand back into balance and return inflation sustainably to the 2% target.”
Their decisions helped shape expectations for the Fed’s June & July policy decision. The market is on the skip and hike scenario put forward by several heavyweight Fed governors, discounting a 1/3 probability of a hike this week, while it is fully discounted by July. With June CPI figures (tomorrow) still to be released and with a large minority already in favour of continuing the tightening cycle, there’s a tail risk scenario to see a last-minute change of heart at the Fed nonetheless. We’ve seen the same thing happening early in the normalization cycle when eco data in the week running up to the meeting overturned guidance to hike by 50 bps to conduct a 75 bps hike instead. The Fed decision will be flanked by a new Summary of Economic Projections including an updated dot plot which will show a higher peak rate than in March (5-5.25%) and possibly also a higher policy rate level for end 2024 (current median 4.25%). Reasons include ongoing tightness in the labour market, economic resilience, an already bottoming out housing market, a retightening of financial conditions as the impact of the regional bank crisis petered out and (core) inflation stalling at elevated levels.
The ECB on Thursday is expected to deliver on its May promise of more tightening. A 25 bps rate hike is discounted. Lagarde at the previous meeting namedropped June, July and even September meetings for more action to achieve a timely return of inflation to the 2% target. At the press conference, she might remain tightlipped though when it comes to the future. She’ll stress that the ECB’s complete halt of reinvestments under the APP programme will kick in next week. Over the next 12 months, this suggests that an additional €160bn of liquidity will pulled from the market. These amounts will gain traction in coming years given the way the €3200bn APP portfolio was built mainly during 2016-2018 (average maturity of APP portfolio rapidly declining). Their impact at first will likely be seen via swap spreads vs govies rather than be outright felt in yield levels. Finally, the ECB will likely want to see the impact of the big TLTRO repayment at the end of June (€476.8bn).
The People Bank of China and Bank of Japan are on duty as well this week. A status quo is expected for both, with last Friday’s stories suggesting that the BoJ is in no rush to further increase the tolerance band around the 0% YCC target for the 10y yield. Risks to the PBOC outcome are on the easing side as the Chinese central bank might start cutting to pull borrowing costs lower and give a helping hand to the economy.
News and views
In an interview with the Hospodarske Noviny newspaper, Member of the Czech National Bank MPC Holub said that while raising rates further now would be too late curb price pressures in the first half of next year, it still will have a signaling effect helping to anchor inflation expectations and prevent a wage-price spiral. At the same time, he indicated that the CNB might be able to start with gradual and probably cautious rate cuts in the first half of next year unless a wage-price inflation spiral was to develop at that time. Holub is a hawkish member of the MPC. However, at the previous meeting he was joined by two other members in a close 4-3 vote to leave the policy rate unchanged at 7%. The next CNB meeting is scheduled on June 21. Czech inflation in April slowed to 12.7%. Y/Y. May CPI inflation will be published later today.
A Busy Week for Central Banks
Sentiment is cautiously bullish into the next US CPI figure, due tomorrow, and the next FOMC decision due Wednesday.
Inflation in the US is expected to have eased from 4.9% to 4.1% in May, and core inflation is seen slower at 5.3%, versus 5.5% printed a month earlier. If there is no major surprise on the inflation data front, the Federal Reserve (Fed) should keep the interest rates unchanged at this week’s policy meeting. Activity in Fed funds futures currently gives more than 73% chance for a no rate hike for this Wednesday. But that doesn’t mean that the Fed is done hiking. Whatever pause we might see this week will come with a hawkish accompanying statement, and a threat that the Fed could resume its rate hikes next meeting.
Investors are flocking into call options because no one wants to miss a further rally in stock markets, but no one is sure that the rally will continue given the fact that the Fed has hiked rates at a record speed since last year, leading to the failure of a couple of US regional banks on the way. The earnings expectations for this year are comfortably negative, and the strongly inverted US 2-10-yield curve hints that recession is certainly not far. So yes, it’s good to think of protection, when economic fundamentals don’t necessarily support a further rally, especially when the rally is shouldered by tech stocks, who are, in theory, sensitive to changes in interest rates.
Across the Atlantic Ocean, the European Central Bank (ECB) is expected to hike its interest rates by 25bp when it meets on Thursday, while the Bank of Japan (BoJ) is expected to keep its policy rate at the negative territory despite the rising inflation.
The USDJPY remains bid into the 140 level, with the possibility of a further retreat toward the 200-DMA, which stands near the 137 mark. But that possibility is very much dependent on where the USD will be headed after the inflation report and the Fed decision. The dollar index slipped below past month’s bullish trend and is preparing to return to its 100-DMA. A surprise inflation uptick, and/or a hawkish Fed pause are the major upside risks to the dollar’s downside correction this week. If that’s the case, we could see the USJDPY jump back above 140 easily, though the upside potential will likely remain limited above this level. The EURUSD on the other hand has a better chance to temper a potential rise in USD demand, as the ECB will likely sound and act hawkish despite the waning inflation and slowing demand.
In commodities, crude oil slips below the $70pb at the start of the week. Goldman dropped its forecast for Brent crude by almost $10 to $86pb for December pointing at recession fears a supply increases from nations facing sanctions like Russia, Iran and Venezuela. But the US driving season and the Mid-East boiling hot months will likely bolster demand, while the US will still have to fill in its oil reserves at levels below $70pb, which will likely throw a floor under US crude selloff near $65pb.