Sample Category Title
Major Central Bank Week
Market movers today
It is major central bank week. On Wednesday, we expect the first unchanged decision from the Fed since January 2022, but it is not a done deal and markets are pricing a chance of another 25bp hike. An ECB hike of 25bp on Thursday is fully expected as well as a decision to end APP reinvestments, but we will get new staff projections and policy signals. We do expect Bank of Japan to tighten policy by easing its yield curve control during this year, but the meeting on Friday is likely too soon.
There are no major data releases from the large economies planned for today. In Denmark, we expect a sharp decline in inflation from 5.3% y/y in April to 3.0% y/y in May, mostly driven by electricity prices, see more below.
Through the remainder of the week, US CPI figures released tomorrow will be key information ahead of the FOMC meeting.
The 60 second overview
Trade: The global trade bellwether, South Korea, saw some improvement in exports in the first ten days of June, with an annual increase of 1.2%, for the first increase since February. Car and ship exports were the main drivers, whereas semiconductor sales continue on a weak note, with a 31% annual decline. US and EU shipments improved whereas sales to China continues to look fairly weak.
The Russian central bank kept rates unchanged at a meeting Friday and delivered a hawkish message as it considered hiking rates by 25-75bps. Consumer prices have shown signs of further acceleration recently after it slowed this year from a 20-year high in 2022. Russia is running a large public deficit, which could require tighter monetary policy, see Reuters.
Equities: Global equities marginally higher Friday in a quiet session where Japan stood out on the strong side while European stocks were lower. This is the trend we have seen for a couple of months, and we expect to continue as long as the macro momentum in Japan is so much stronger than in Europe. On the sector side, cyclicals/growth, consumer discretionary and tech led the gains while defensives were lower. In US equities mostly higher though with small caps lower: Dow +0.1%, S&P 500 +0.1%, Nasdaq +0.2% and Russell 2000 -0.8%. We see limited gains this morning in Asian and European futures ahead of the flood of monetary decisions that will dominate the week ahead of us.
FI: 10Y Global bond yields closed more or less unchanged on Friday, but the curves flattened as shown by the 2-10Y slope of both US Treasury curve and the German yield curve, that both flattened from the short-end although we are getting closer to the end of the hiking cycle of both Federal Reserve and ECB.
FX: The end to last week's session was not least characterised by NOK strength following much-stronger-than-expected Norwegian inflation sending EUR/NOK below 11.60. Otherwise EUR/USD erased part of Thursday's gains with the cross moving back to 1.0750 while EUR/GBP continues to set new lows (now at 0.8550).
Credit: Credit spreads barely moved on Friday where iTraxx Xover tightened 1.4bp (closing in 408bp) and Main tightened 0.1bp to close in 77bp.
Nordic macro
In Denmark, we get May inflation figures. We expect a very big decline in CPI inflation in May to 3.0% from 5.3% in April. Energy prices will be the key driver, as we are looking for a big decline in electricity prices. Also fuel prices have declined in May and German food prices suggest that also Danish prices have slowed. If we are right, this highly challenges our 5.1% headline inflation forecast for this year. With the May figures, Statistics Denmark registers a quarterly rent increase, which will be highly interesting as it also sets the tone for what we can expect of rents over the coming year.
EUR/USD Bulls Eye Recovery Toward 1.0850
Key Highlights
- EUR/USD started an upside correction above the 1.0720 resistance.
- A key rising channel is forming with support near 1.0710 on the 4-hour chart.
- GBP/USD is consolidating gains near the 1.2550 zone.
- USD/JPY is holding gains above the 138.50 support.
EUR/USD Technical Analysis
The Euro started an upside correction from the 1.0640 zone against the US Dollar. EUR/USD was able to clear the 1.0720 resistance to start a recovery wave.
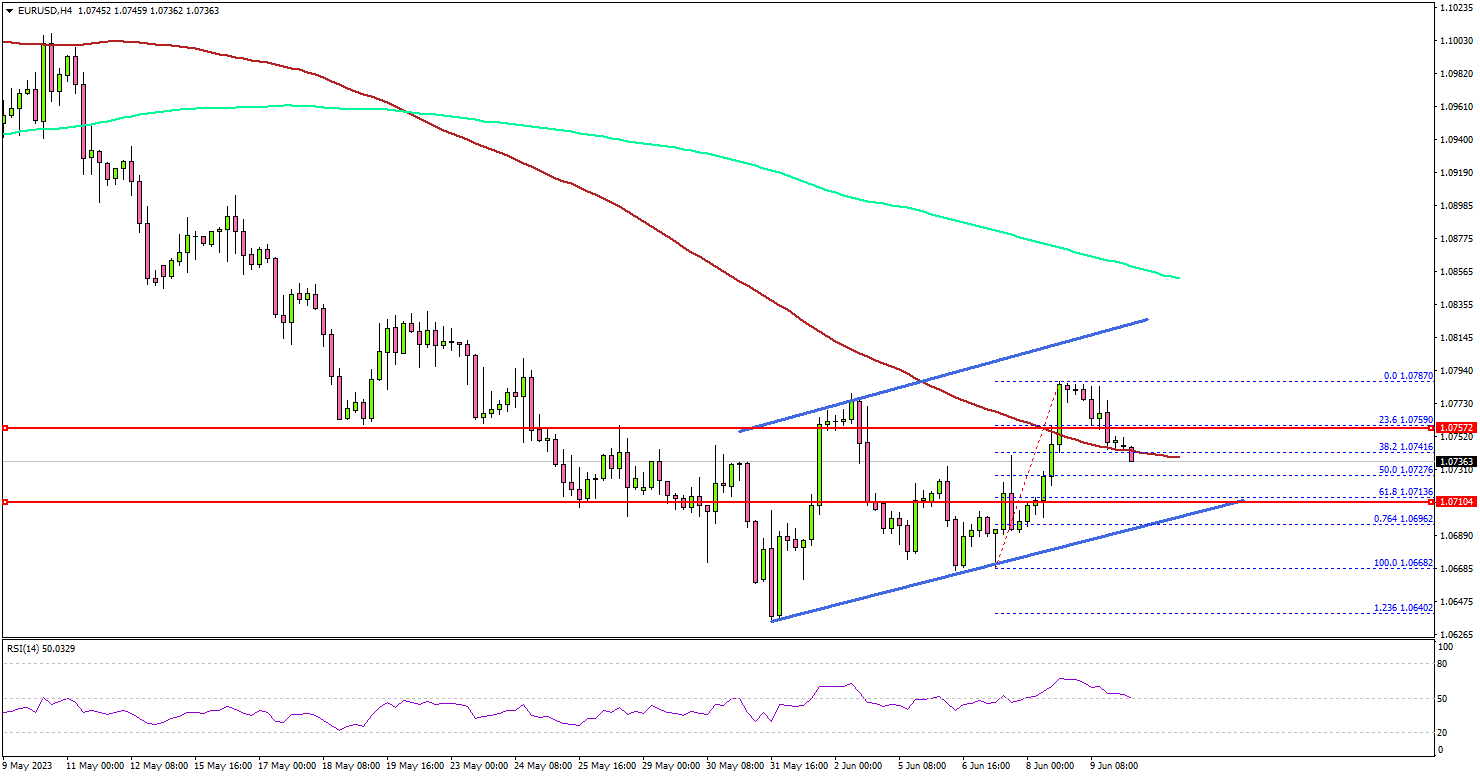
Looking at the 4-hour chart, the pair was able to climb above the 1.0750 resistance and the 100 simple moving average (red, 4 hours). However, the bears were active near the 1.0785 zone. A high is formed near 1.0787 and the pair is now moving lower.
Immediate support is near the 1.0715 level. The next major support is near the 1.0710 level. There is also a key rising channel forming with support near 1.0710 on the same chart.
If there is a downside break below the 1.0710 support, the pair could decline toward the 1.0640 support. Any more losses might send EUR/USD toward 1.0600.
If there is a fresh increase, the pair could face resistance near 1.0780. The first major resistance is near the 1.0820 level. If there is a move above the 1.0820 resistance, the pair could drift toward 1.0880.
Looking at GBP/USD, the pair is showing a lot of positive signs but there might be a downside correction toward the 1.2500 level.
Economic Releases
- US Monthly Budget Statement for May 2023.
XAU/USD: Historical Overview and Forecast Until 2027
Gold is one of the favourite trading instruments of the most successful traders at NordFX. This can be easily confirmed by looking at the monthly rankings published by this brokerage company. That is why it is appropriate to provide a special review, focusing solely on the XAU/USD pair.
Is Gold Truly a Protective Asset?
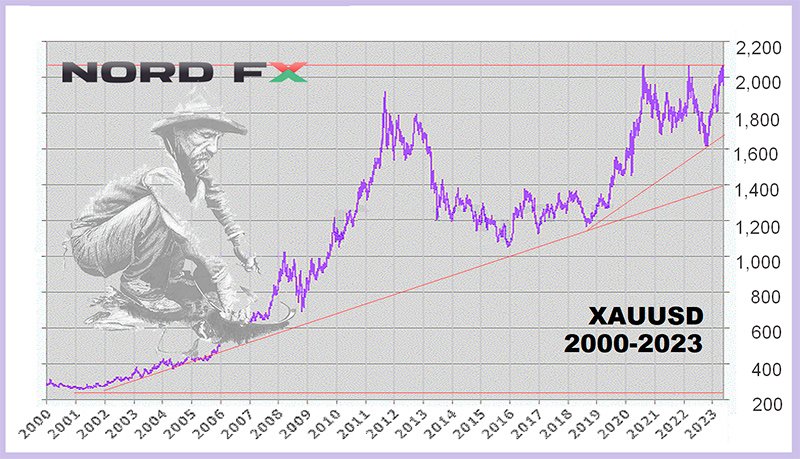
In the current economic situation, as leading central banks worldwide attempt to curb inflation, the price of this precious metal has reached a historic high, hitting $2,080 per troy ounce on May 4. Market participants are rushing to buy gold, believing it can safeguard their capital from devaluation.
According to a survey conducted by Bloomberg, approximately 50% of respondents identified gold as their primary safe-haven asset (with US Treasury bonds coming in second place, receiving only 15% of the votes). However, is gold truly an effective tool for hedging price risks, or is this a widespread misconception?
Consider, for instance, the period from March to October 2022 when gold prices fell from $2,070 to $1,616, a decline of almost 22%. This occurred despite the fact that inflation in the United States reached a 40-year peak during that time. So, what kind of protective asset is gold, then?
The Growth of Gold Prices
If we trace the dynamics of gold prices since the beginning of the 20th century, we observe the following pattern. In the year 1900, the price of this precious metal was approximately $20 per troy ounce.
During the period from 1914 to 1918, amidst and immediately after World War I, the price rose to around $35. Then, in the 1930s, during the Great Depression and as a result of currency reforms in the United States, the price was set at $20.67 per troy ounce. Throughout World War II, the value of the asset remained stable and was fixed at $35 under the Bretton Woods system, the same level as during World War I.
In 1971, the United States abandoned the gold standard, which led to floating exchange rates and an increase in the price of gold. In the late 1970s and early 1980s, the price exceeded the $800 mark per troy ounce due to geopolitical tensions, inflation, and a reduction in gold production. From the 1980s to the 2000s, the price of gold declined and fluctuated within a range of approximately $250 to $500.
Since the early 2000s, there has been a significant increase in the price of gold due to geopolitical events, financial instability, and inflationary pressures. In August 2020, amidst the COVID-19 pandemic and economic uncertainty, the price of gold surpassed the $2,000 mark per troy ounce for the first time. However, following this peak, it experienced a decline due to expectations of economic recovery, tightening monetary policies by central banks, rising interest rates, and various other factors.
A subsequent unsuccessful attempt to break above the $2,000 resistance level occurred in March 2022. Finally, the third surge occurred in May of this year.
Why Gold Prices Are Rising
So, what contributes to the value of gold and why does its price rise?
- Rarity and Limited Supply: Gold is a rare metal, and its extraction is limited and requires significant efforts and resources.
- Durability and Longevity: Gold is highly resistant to wear and corrosion. It retains its physical properties over time, making it suitable for long-term storage and attractive for use in jewellery and various industries.
- Store of Value: Gold has long been considered a store of value. It can preserve its purchasing power over extended periods, serving as a hedge against inflation and the instability of stocks and currencies.
- Liquidity and Recognizability: Gold is universally recognized and accepted as an asset. It can be easily exchanged for cash or used as a medium of payment in different countries and cultures.
- These factors contribute to the desirability and demand for gold, thus driving its price upward.
Factors Influencing Gold Prices
Let's delve into the factors that influence the price of gold. It's important to note that there is no direct correlation between the price of gold and each of these factors individually. Market forecasts and the combination of these factors also play a role in determining gold prices. For example, the recent surge in XAU/USD can be attributed to expectations of a reversal in the Federal Reserve's interest rate hike cycle, potential U.S. debt default, as well as geopolitical and economic instability due to Russia's armed actions in Ukraine. Now, let's explore the key factors:
- Economic Conditions: The global economic situation, including GDP growth or decline, unemployment, and overall financial stability, can impact gold prices. Uncertainty in the markets or a recession, for instance, may increase demand for gold as a risk-free asset.
- Geopolitical Events: Political and geopolitical events such as armed conflicts, wars, terrorist acts, sanctions, elections, etc., can cause market instability and uncertainty, leading to an increased demand for gold as a safe haven.
- Inflation: The level of inflation plays a crucial role in determining the value of gold. When inflation rises, the price of gold typically follows suit as investors seek protection against the devaluation of money.
- Central Banks: Actions taken by central banks, including changes in interest rates, can influence gold prices. For example, a decrease in interest rates may stimulate demand for gold as holding it becomes comparatively more attractive than other assets.
- Currency Movements: Fluctuations in exchange rates between different countries can also impact the price of gold. If the currency of a gold-producing country weakens against other currencies, the price of gold in that currency may increase, stimulating exports and raising the demand for gold.
- Investment Demand: Investment demand includes the purchase of gold bars, coins, and futures market transactions. Demand typically rises when trust in fiat currencies weakens.
- It's important to consider the interplay of these factors and market expectations when assessing the price of gold.
Forecast: Will the Price of Gold Rise?
When it comes to forecasts, it's important to note that they are mere assumptions based on available information and analysis. As mentioned before, the gold market is complex and subject to the influence of multiple factors. Any forecasts are subjective assessments and can change depending on economic and geopolitical situations, as well as changes in market demand and supply. However, it should be acknowledged that some forecasts have proven to be relatively accurate.
Here are a few examples of such forecasts made before September 2021. In May 2021, analysts at Goldman Sachs predicted that the price of gold would reach $2,000 per troy ounce by 2024. Two months later, their counterparts at Bank of America made the exact same forecast. The touch of this resistance level occurred one year earlier. However, whether XAU/USD will be able to sustainably establish itself above this level, turning it from resistance to support, remains to be seen.
Currently, Goldman Sachs strategists are indicating a target of $2,200. Meanwhile, the Swiss financial holding UBS believes that the price of gold may rise to $2,100 by the end of 2023 and to $2,200 by March 2024. (It's worth noting that their previous forecast projected a peak of $2,400 for this year). Similar figures are mentioned by analysts at the Economic Forecasting Agency, who believe that the price of gold may even exceed $2,400, but this is expected to occur only in 2027.
***
At the beginning of this overview, we raised the question of whether gold is a protective asset. In his early statements, Warren Buffett expressed scepticism about investing in gold, referring to it as an unproductive asset that doesn't generate income. However, looking at the chart, it becomes clear that he was mistaken. Even the legendary investor himself acknowledged this and later expressed a positive attitude towards gold as a store of value. Prominent financier George Soros also recognized gold as a diversification asset that provides protection against inflation and political instability. Ray Dalio, the founder of investment firm Bridgewater Associates, recommended including this precious metal in one's portfolio.
Most likely, they are all correct, and in the foreseeable future, gold will retain its role as a primary capital preserver. However, it is always important to remember that the effectiveness of any investment depends on the entry point. If the timing of a trade is chosen incorrectly, it is possible that your deposit may start to decrease. Nevertheless, in the case of gold, the probability of XAU/USD rising again is significantly higher than that of many fiat currencies. To withstand drawdowns and ultimately achieve profit, sound money management, as well as time and patience, are necessary.
RBA and BoC Bombshells Stir Market Waters; Dollar, Euro and Yen Suffered
Last week marked the beginning of an avalanche of central bank surprises, with both RBA and BoC springing unexpected rate hikes on markets. However, the market reactions diverged substantially. Despite a weaker-than-anticipated Australian GDP report and terrible Chinese trade data, Aussie's underlying strength was striking. In contrast, the Loonie's ascent was curtailed by worse-than-expected employment figures.
When the dust settled, Aussie emerged as the top performer, followed by Kiwi and then Sterling. Loonie's rally left it in fourth place. Pound gained significant ground in the latter part of the week, largely buoyed by purchases against the Euro as markets recalibrated expectations for BoE's terminal rate. Dollar languished at the bottom of the pile, but its performance was not dramatically dissimilar from Euro and Yen.
Markets brace themselves for more potential surprises and volatility in the coming days with Fed, ECB, and BoJ due to announce their policy decisions this week. BoE and SNB will follow suit the next week, adding to the mix of market excitement.
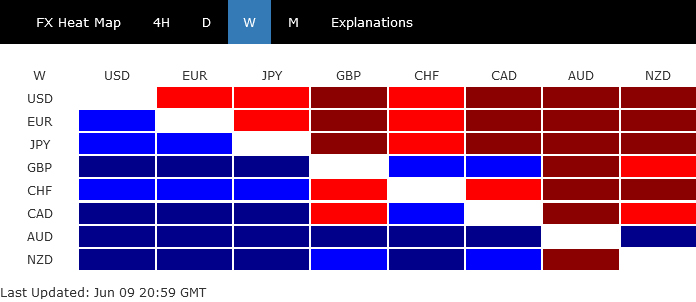
Aussie as top performer following RBA's surprise rate hike
Australian Dollar secured its position as the strongest currency of the week, spurred by RBA's unexpected 25bps rate hike to 4.10%. The central bank's communication, underscored by Governor Philip Lowe's speech, has marked a distinct pivot back to tackling inflation. Opinions are divided on whether another rate hike will be announced at the next meeting, but there is a broad consensus that further tightening will occur within the third quarter. The bank's hawkish inclination is clearly discernible.
Australian Dollar ended as the strongest currency after RBA's surprised 25bps rate hike to 4.10%. The focus of the statement, as well as speech of Governor Philip Lowe a day after, seemed to have emphasis shifted back to fighting inflation. Opinions on whether RBA would hike again at next meeting is divided, but there seems to be a consensus of more tightening within Q3. Either way, hawkish bias is clear.
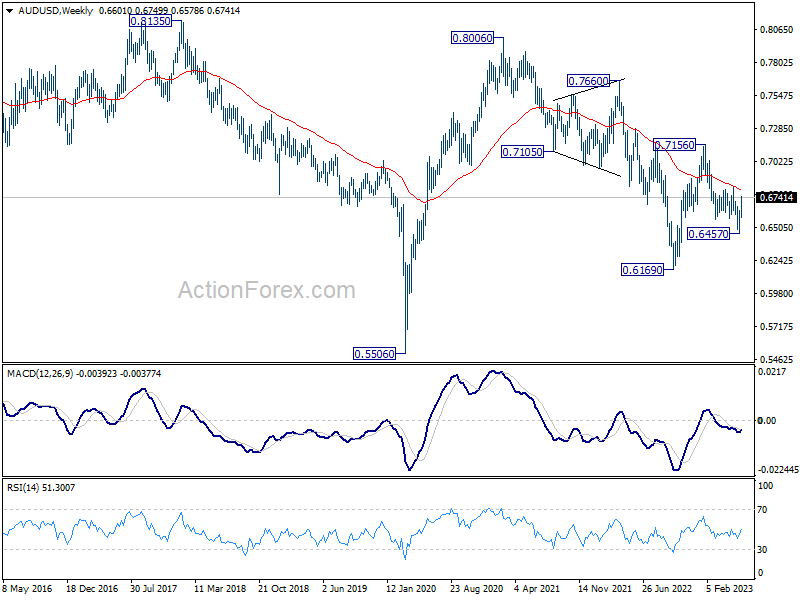
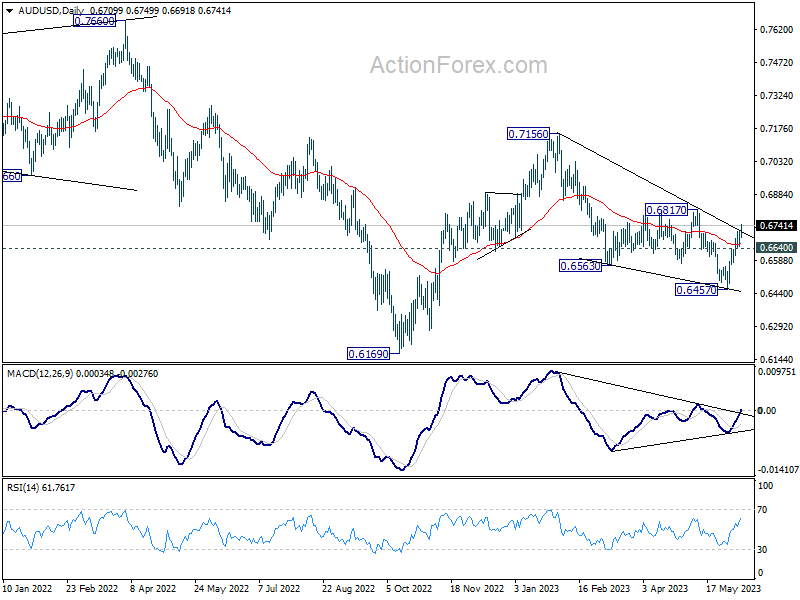
AUD/USD was the top mover last week, ended up more than 2%. The break of trend line resistance, together with bullish convergence condition in D MACD raises the chance that fall from 0.7156 has completed at 0.6457.
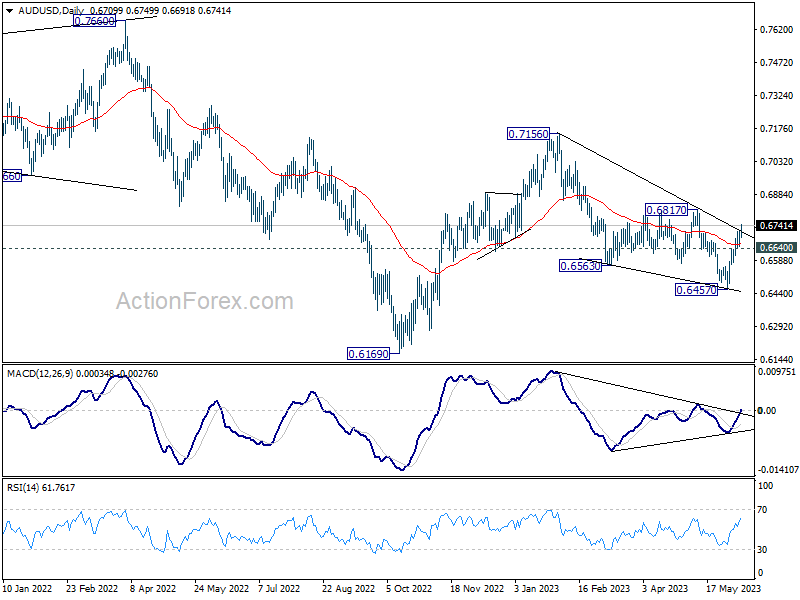
More importantly, the three-wave corrective structure of the decline argues that rise from 0.6457 is possibly resuming whole rebound from 0.6169 (2022 low). Further rally is now in favor as long as 0.6640 support holds, with 0.6817 resistance as next target. Decisive break there will solidify the bullish case and extend the rise towards 0.7156 in H2.
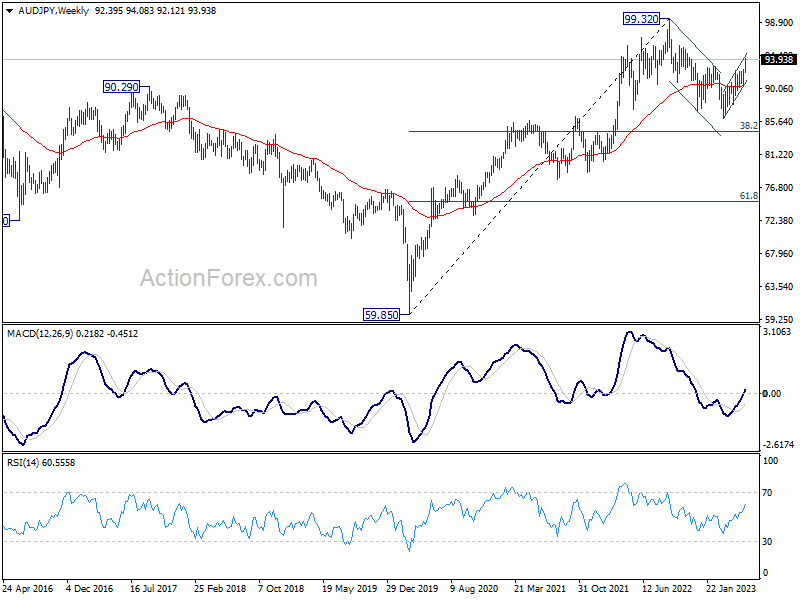
AUD/JPY was the third top mover last week, next to EUR/AUD. The firm break of 0.9299 should confirm that corrective fall from 99.32 has completed with three waves down to 86.04. Further rise is expected as long as 92.12 support holds, to retest 99.32 high.
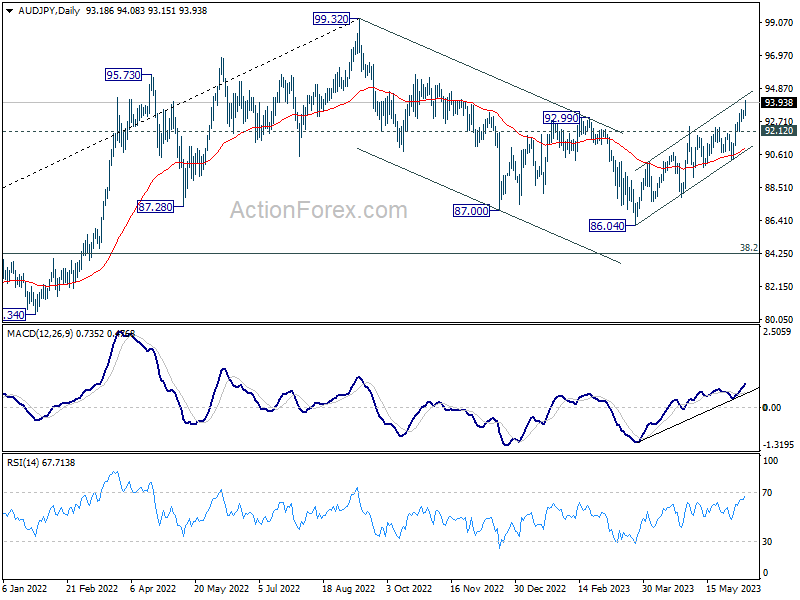
However, AUD/JPY presents a different overall outlook compared to AUD/USD. Price actions from 99.32 are seen as correcting the whole uptrend from 59.85 (2020 low). Consequently, the pattern from 99.32 could potentially stretch further with another falling leg. Thus, attention will be paid to sign of loss of momentum and reversal as AUD/JPY approaches 99.32 high.
Loonie's BoC inspired rally capped by weak job data
Despite BoC surprising 25bps rate hike to 4.75%, Canadian Dollar struggled to extend gain towards the end of the week. This hesitation in performance was largely due to disappointing job data. Market expectations, however, underwent a dramatic shift over the week, transitioning from anticipation of a 25bps rate cut by year's end to now foreseeing an additional rate hike of the same magnitude or potentially more. The consensus now predicts another 25 basis point hike to 5.00% in July, though what lies beyond remains uncertain.
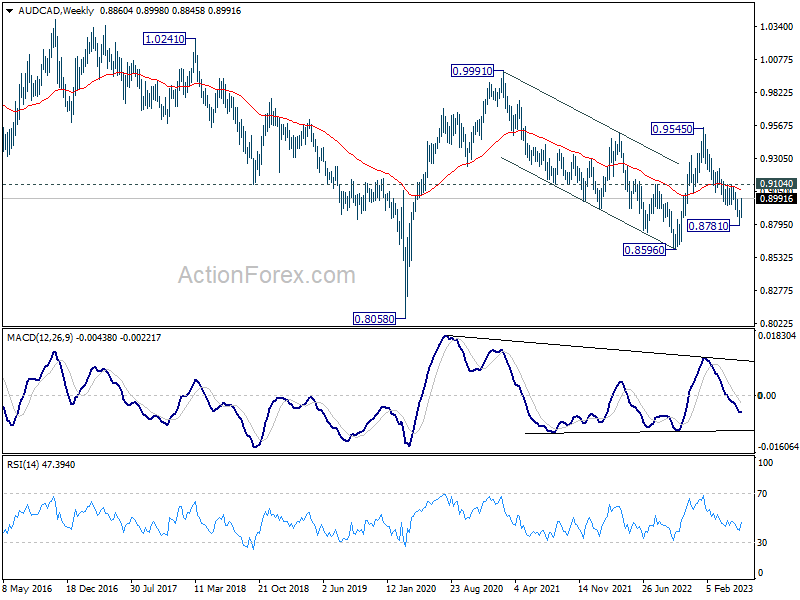
AUD/CAD's strong rebound last week suggests clearly indicate the relative performance. The development now raises the chance that whole corrective fall from 0.9545 has completed with three waves down to 0.8781, after hitting 61.8% projection of 0.9545 to 0.9043 from 0.9104 at 0.8794.
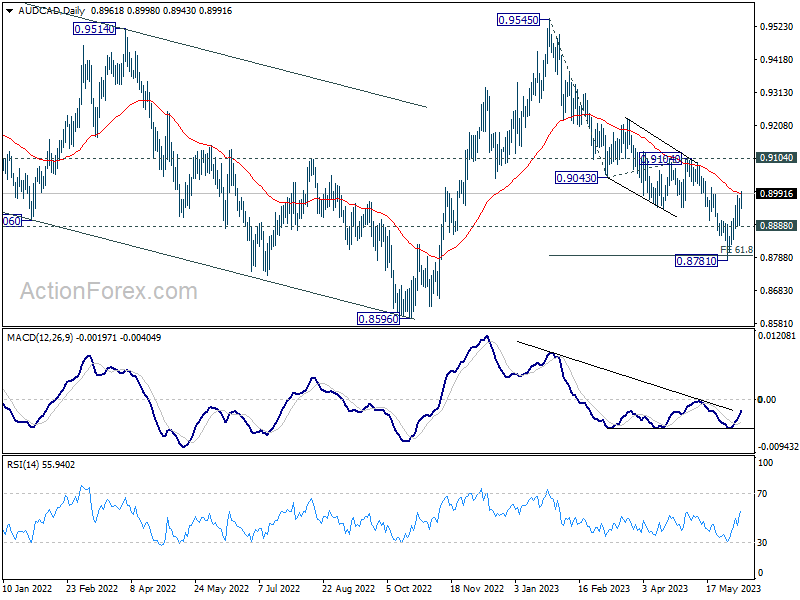
Further rally is expected as long as 0.8888 resistance holds. Firm break of 0.9104 will solidify this bullish case, and pave the way to retest 0.9454 high next.
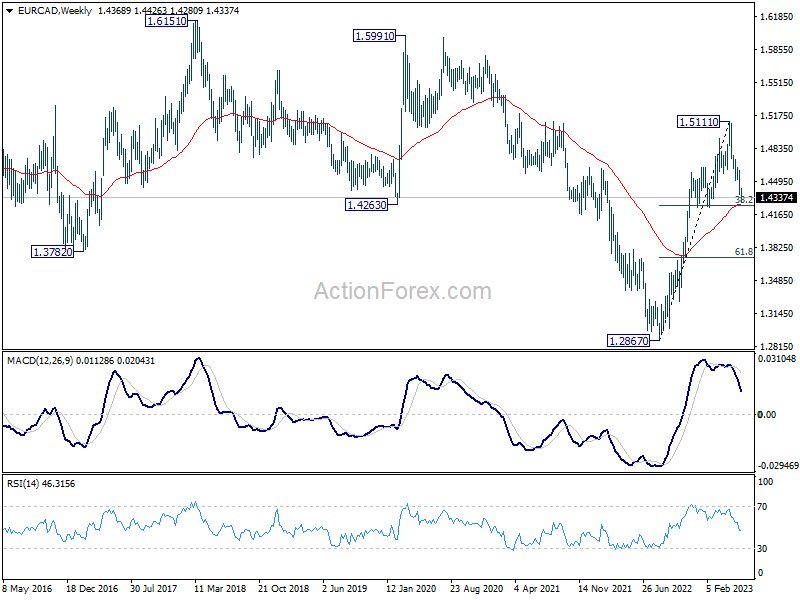
EUR/CAD's fall from 1.5111 appeared to have slowed at it approached 1.4236 cluster support (38.2% retracement of 1.2867 to 1.5111 at 1.4254), which is also close to 55 W EMA (now at 1.4261).
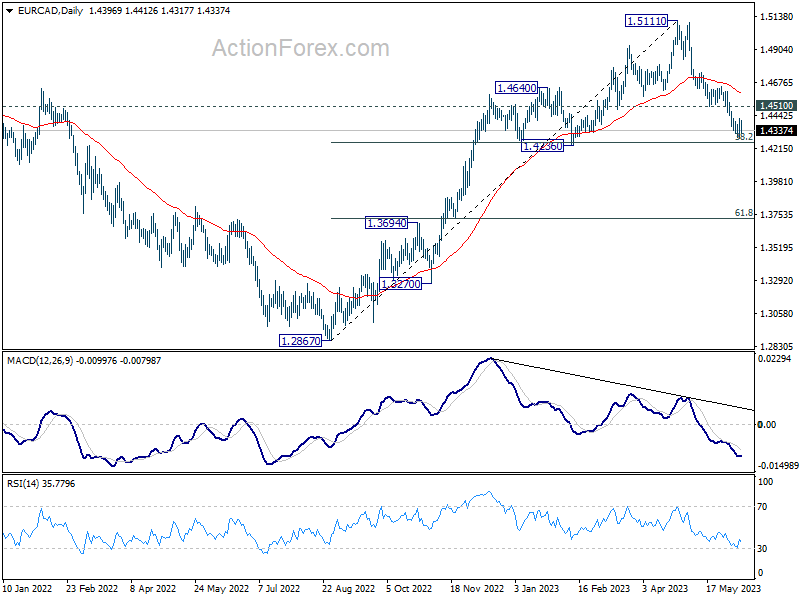
A strong bounce from current level, followed by break of 1.4510 support turned resistance, will argue that the corrective decline from 1.5111 has completed. Further break of 55 D EMA (now at 1.4595) will pave the way to retest 1.5111 high. However, sustained decisive break of 1.4236 could trigger further downside acceleration to 61.8% retracement at 1.3724, even just as a deep corrective move.
Meanwhile, it should be emphasized that performance of EUR/CAD will also depend on the overall strength of Euro, which will be affected by its actions against Dollar and other European majors.
EUR/GBP extended down trend on BoE rate expectations
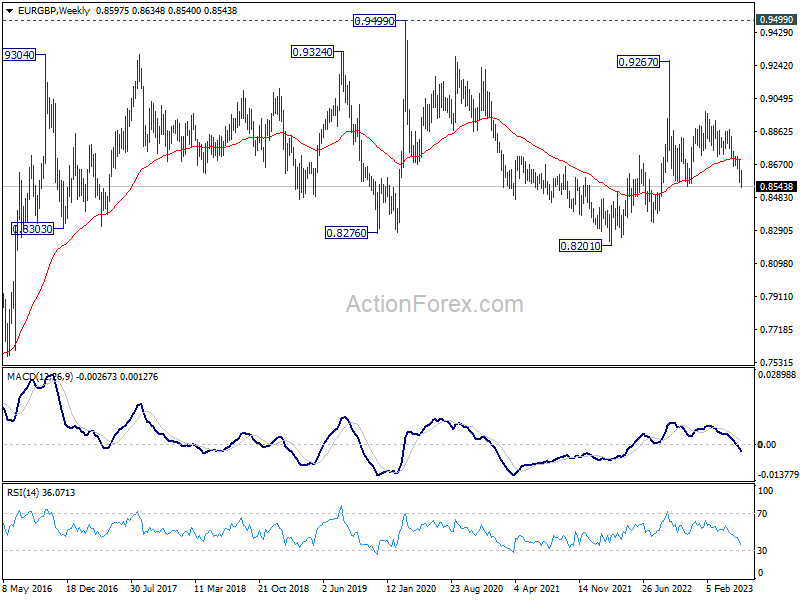
Talking about Euro, the decline in EUR/GBP is worth a mention. This depreciation can be attributed, in part, to the Euro's general weakness following the latest inflation reports. While ECB is widely expected to continue tightening on June 15, a peak seems more likely during the summer.
Contrarily, market predictions for BoE terminal rate are being adjusted upwards to 5.50% from the previous 4.50% prediction. This alteration comes as UK inflation struggles to decelerate at the anticipated pace, prompting a re-evaluation of BoE's potential response.
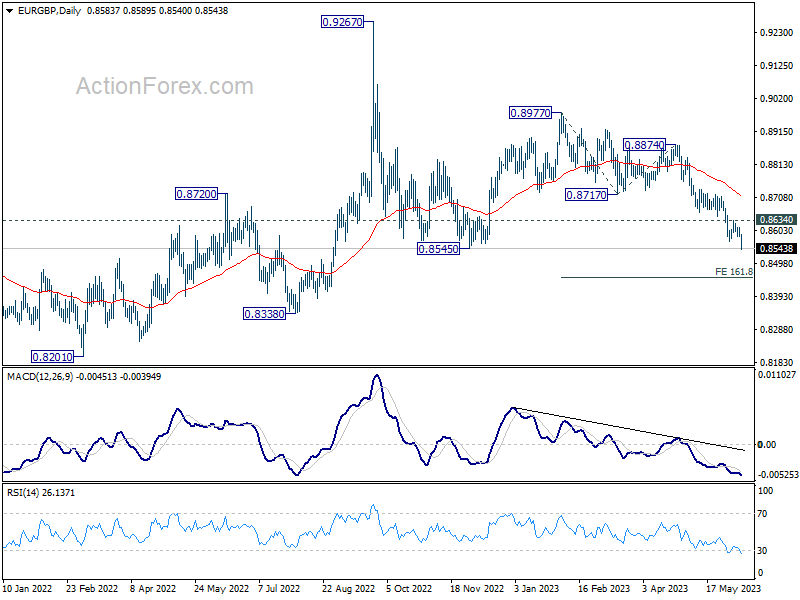
EUR/GBP extended the fall from 0.8977 and has indeed closed below 0.8545 medium term support (2022 low). Near term outlook will stay bearish as long as 0.8634 resistance holds. Next target is 161.8% projection of 0.8977 to 0.8717 from 0.8874 at 0.8453.
Extended selloff in EUR/GBP could be accompanied by even deeper decline in Euro-commodity crosses.
Dollar's uncertain trajectory: Weakness offset by soft Euro and Yen
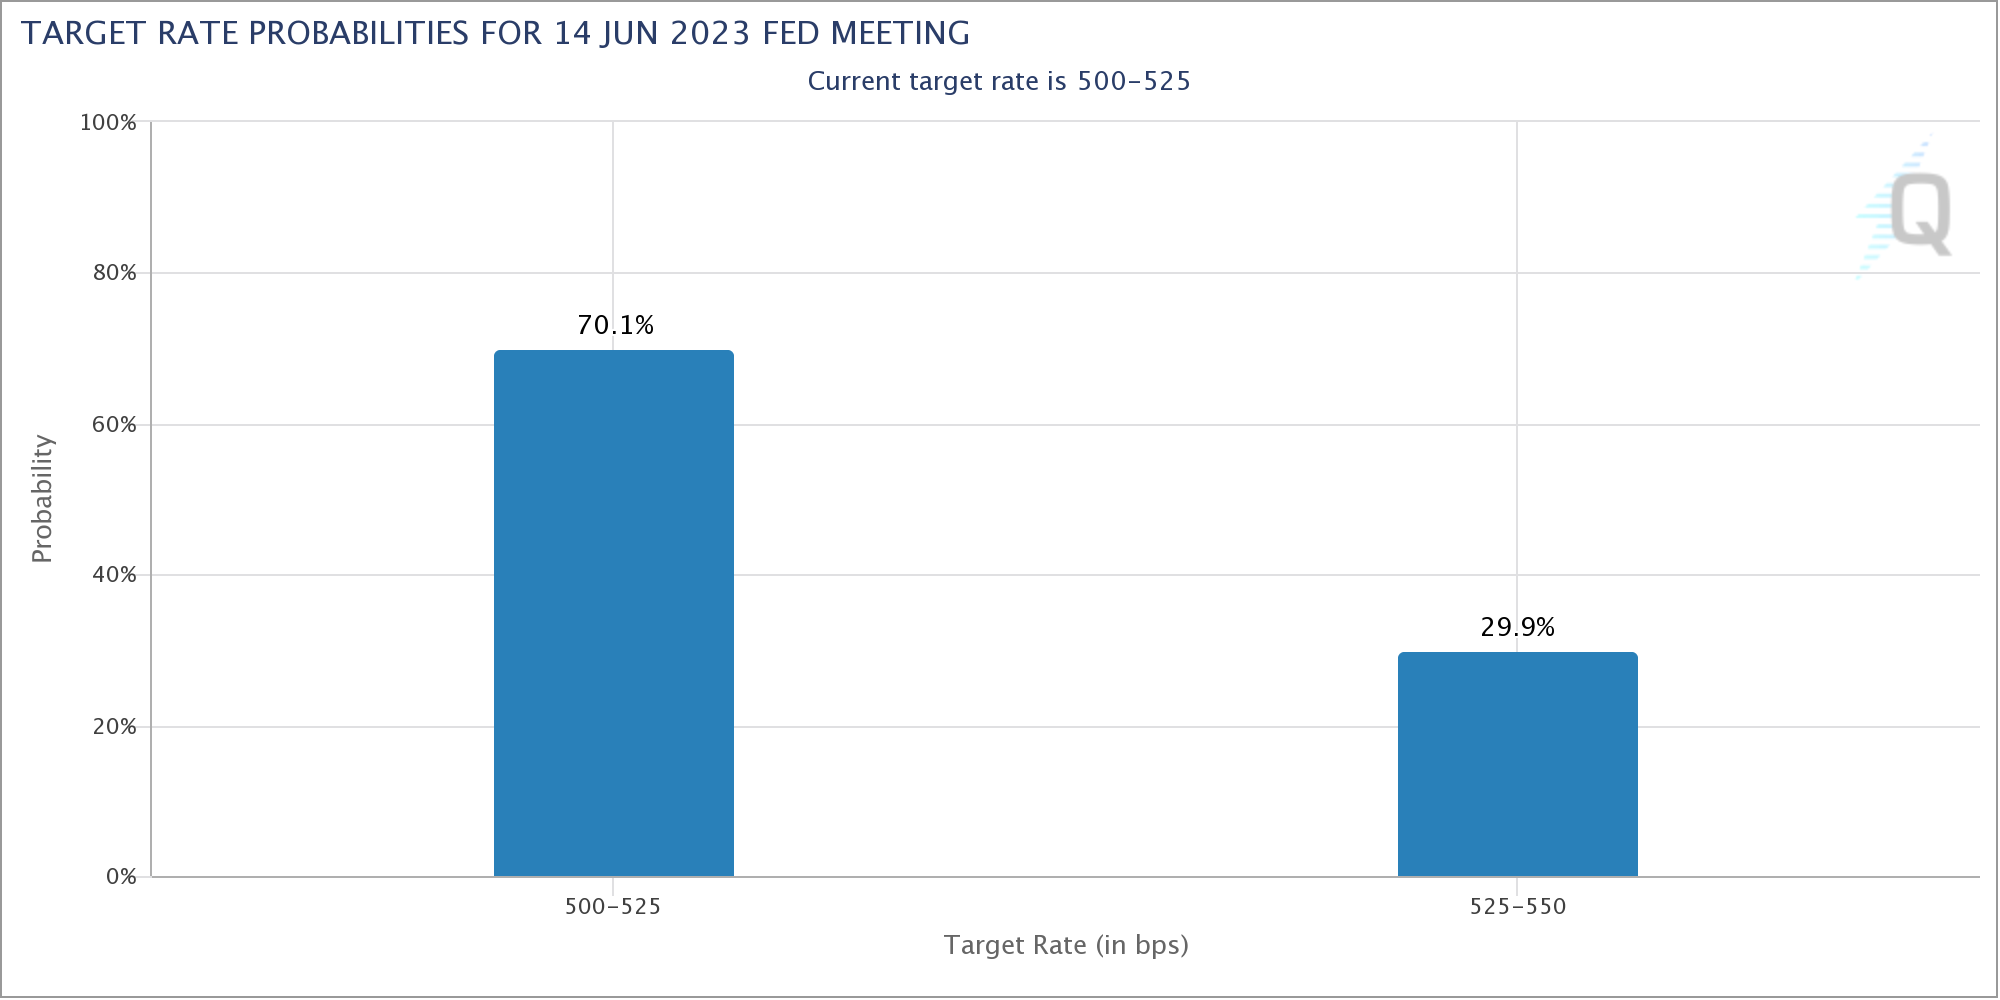
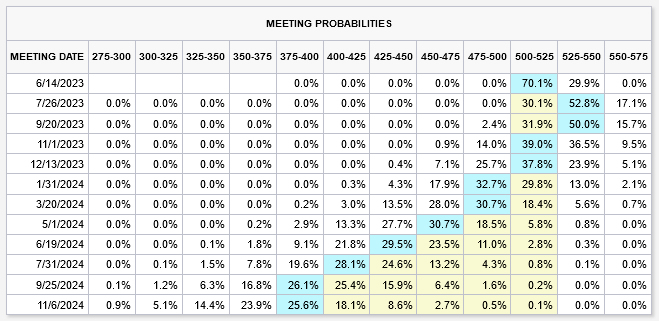
Dollar's broad based weakness was clear last week, but that wasn't much reflected in Dollar index. A "skip" is probably a done deal for FOMC rate decision on June 14. There is 70% chance of a hold at 5.00-5.25% as indicated by fed fund futures. Meanwhile, there is near 70% chance a final 25bps hike in July to 5.25-5.50%. But there are much uncertainty beyond June, subject to this week's CPI release, as well as new Fed economic projections.
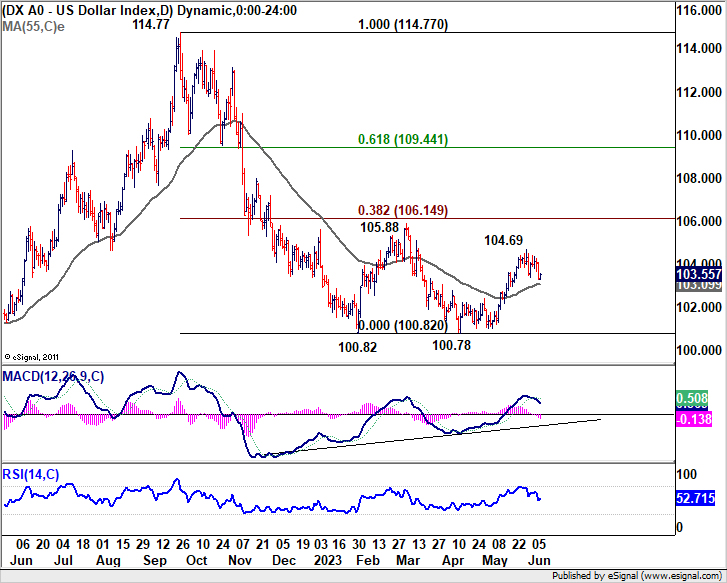
The softness in Euro and Yen kept Dollar Index's loss limited last week. With 55 D EMA (now at 103.09) intact, it's technically uncertain whether rise from 100.78 has completed at 104.69. That is, another rally through this resistance is possible. But even in this case, strong resistance is anticipated at 38.2% retracement of 114.77 to 100.82 at 106.14 to complete the corrective pattern from 100.82.
Meanwhile, sustained break of 103.09 will turn near term outlook bearish for a retest of 100.82. But that would come in the unlikely event of simultaneous strength in both Euro and Yen.
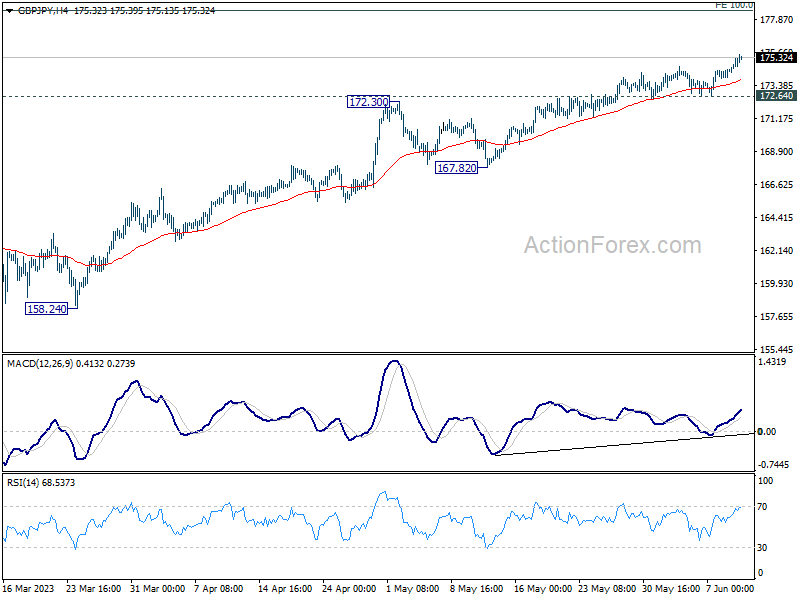
GBP/JPY Weekly Outlook
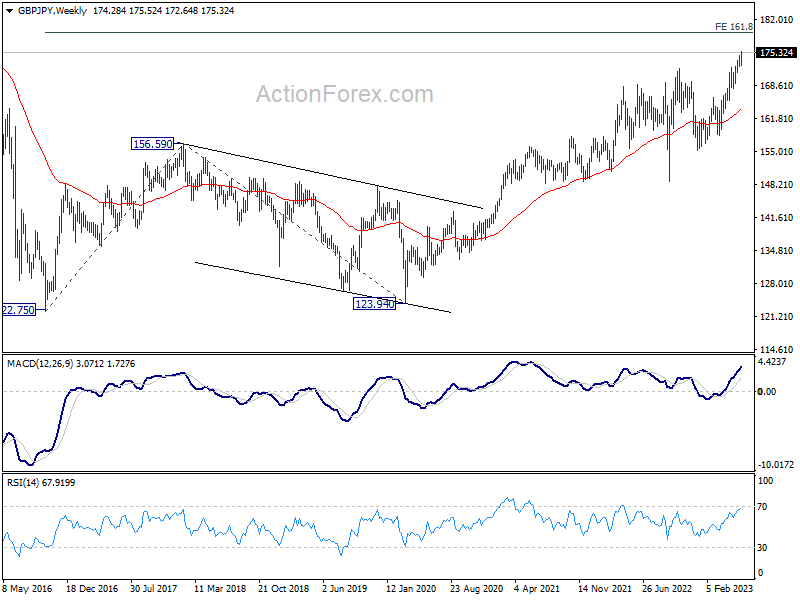
GBP/JPY's up trend continued last week and hit as high as 175.52. Initial bias remains on the upside for this week for 100% projection of 148.93 to 172.11 from 155.33 at 178.51 next. Strong resistance could be seen from there to bring pull back, at least on first attempt. But break of 172.64 support is needed to indicate short term topping. Otherwise, outlook will remain bullish in case of retreat.
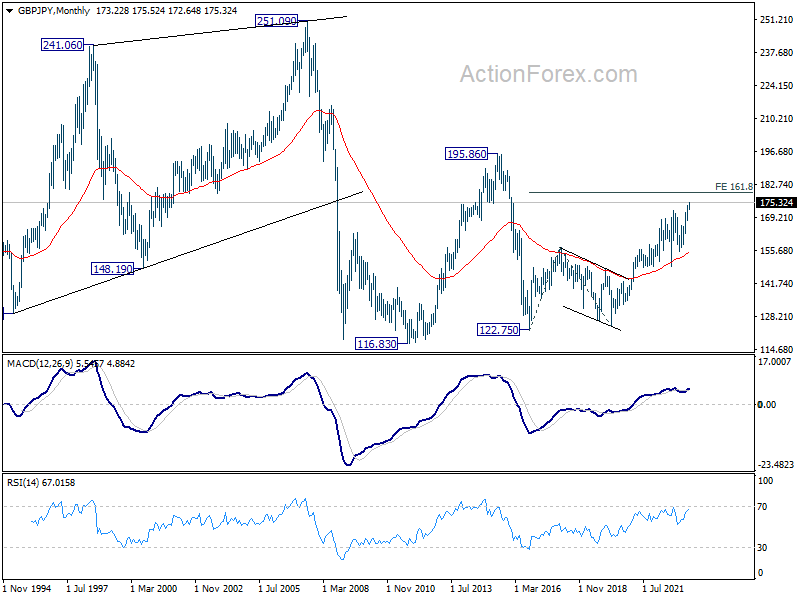
In the bigger picture, up trend from 123.94 (2020 low) is extending. Next target will be 161.8% projection of 122.75 (2016 low) to 156.59 (2018 high) from 123.94 at 178.69. For now, medium term outlook will remain bullish as long as 167.82 support holds, even in case of deep pull back.
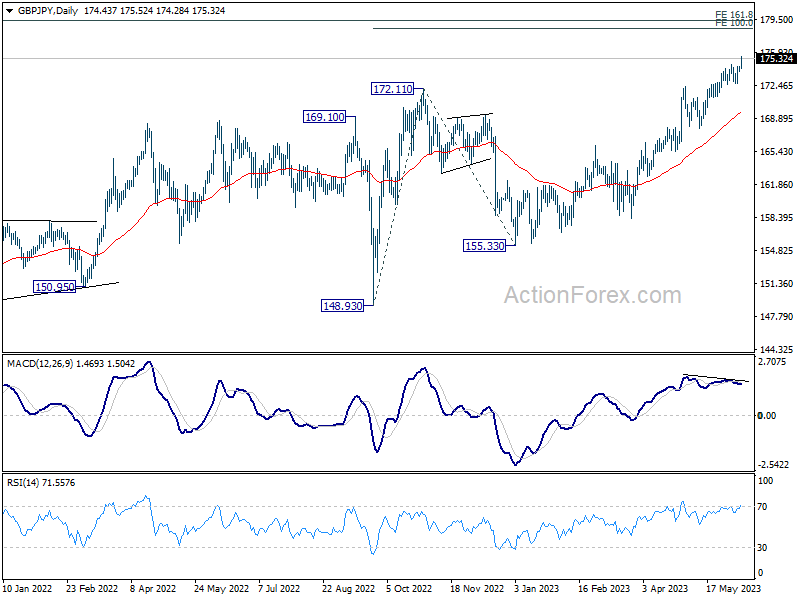
In the longer term picture, as long as 55 M EMA (now at 155.22) holds, rise from 122.75 (2016 low) could still extend higher to 195.86 (2015 high).
EUR/USD Weekly Outlook
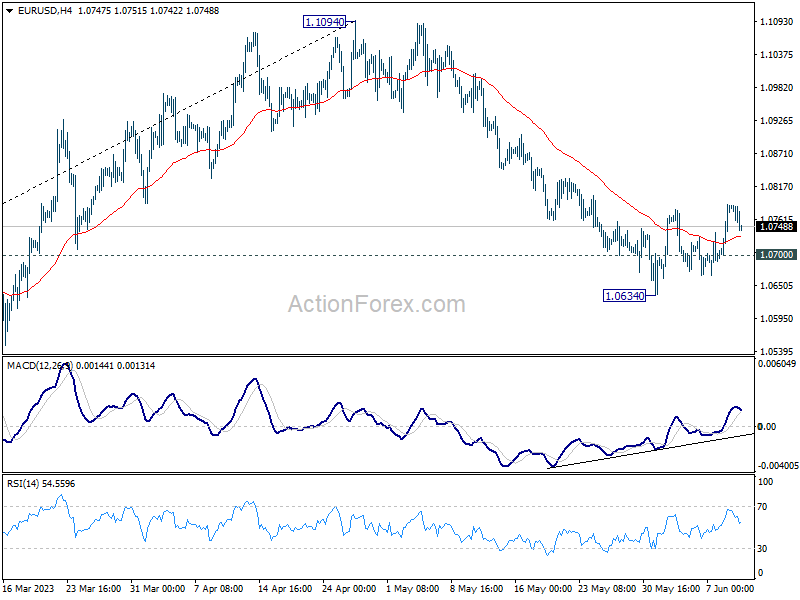
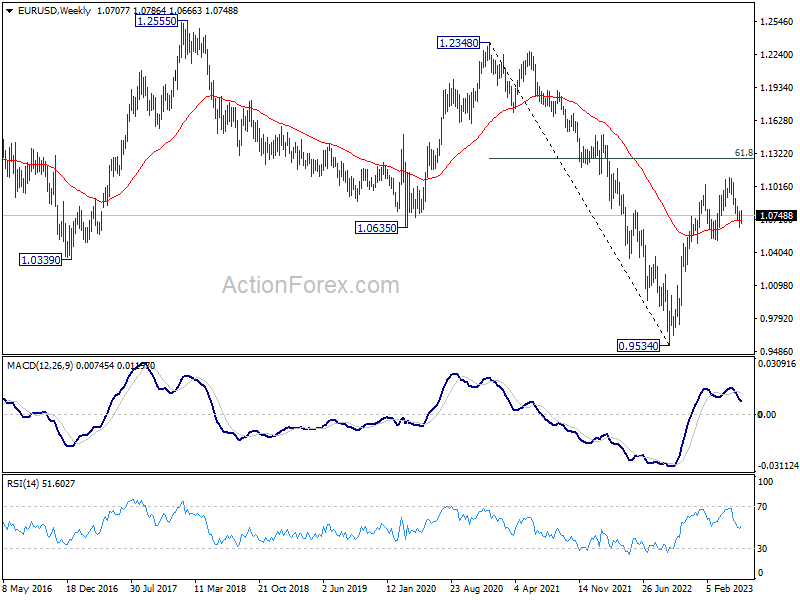
EUR/USD's recovery from 1.0634 extended higher last week after brief setback. Further rise is mildly in favor for now. Sustained trading above 55 EMA (now at 1.0813) will pave the way back to retest 1.1094 high. Nevertheless, break of 1.0700 minor support should resume the fall from 1.1094 through 1.0634 support.
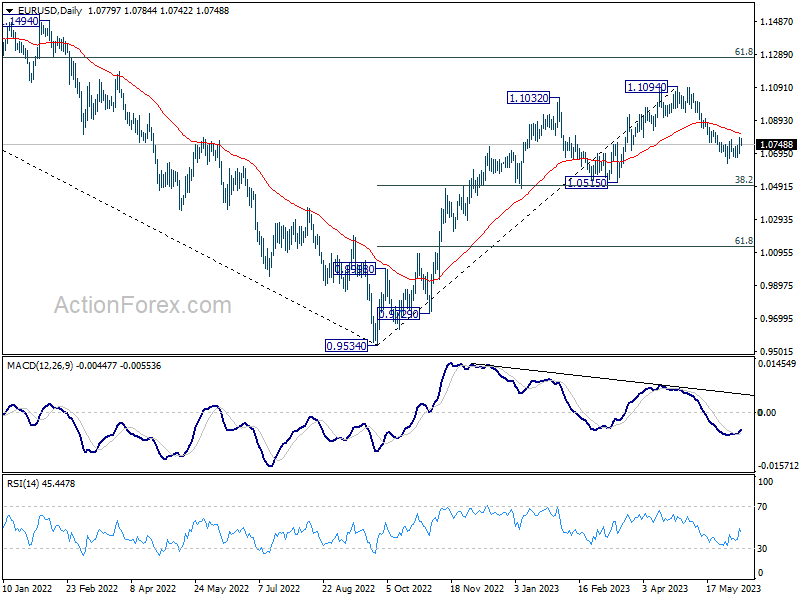
In the bigger picture, as long as 1.0515 support holds, rise from 0.9534 (2022 low) would still extend higher. Sustained break of 61.8% retracement of 1.2348 (2021 high) to 0.9534 at 1.1273 will solidify the case of bullish trend reversal and target 1.2348 resistance next (2021 high).
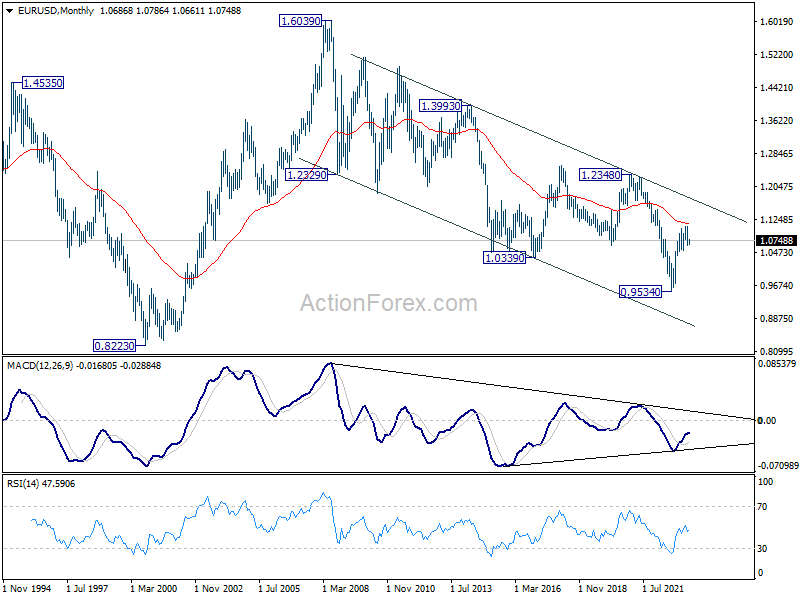
In the long term picture, focus is now on 55 M EMA (now at 1.1134). Rejection by this EMA will revive long term bearishness. However, sustained break above here will be affirm the case of long term bullish reversal and target 1.2348 resistance next.
USD/JPY Weekly Outlook
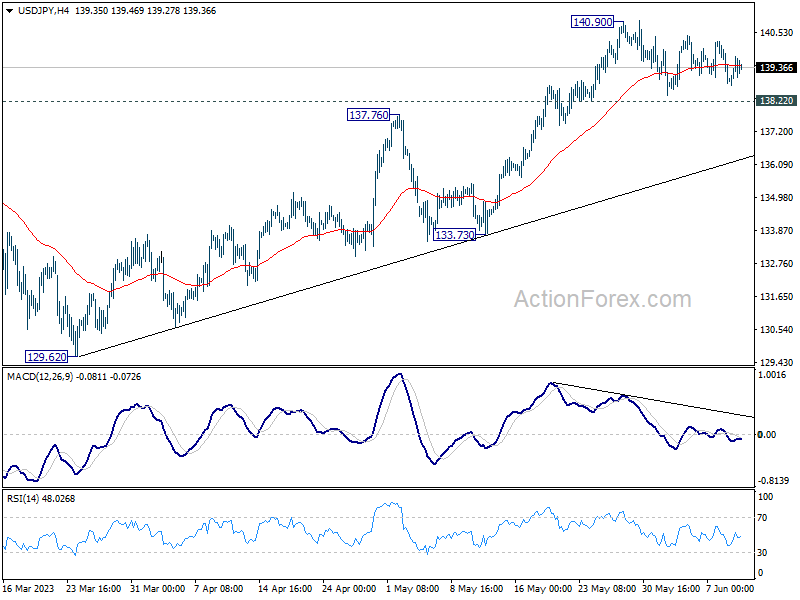
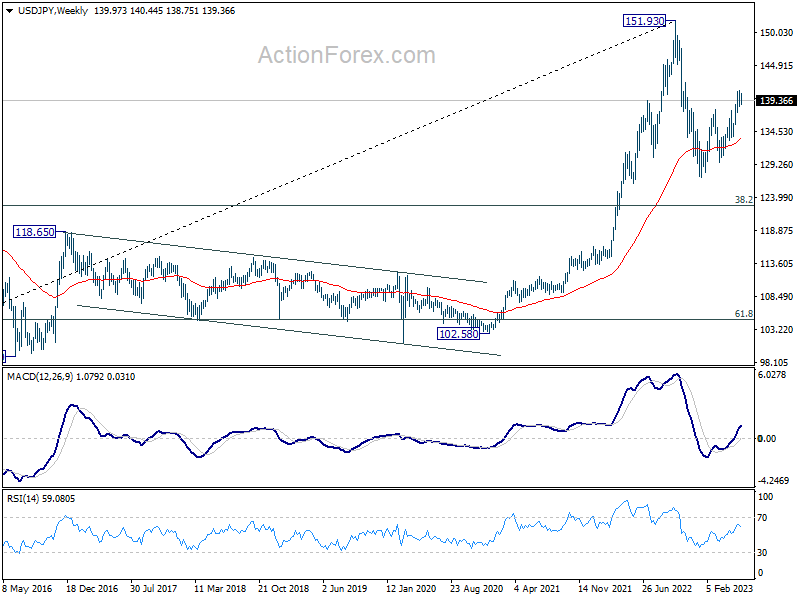
USD/JPY stayed in consolidation below 140.90 last week and outlook is unchanged. Initial bias remains neutral this week first, and further rally is expected as long as 138.22 minor support holds. On the upside, break of 140.90 will resume larger rise from 127.20 to 142.48 fibonacci level. However, considering bearish divergence condition in 4 hour MACD, break of 138.22 will confirm short term topping, and turn bias back to the downside for 55 D EMA (now at 136.59).
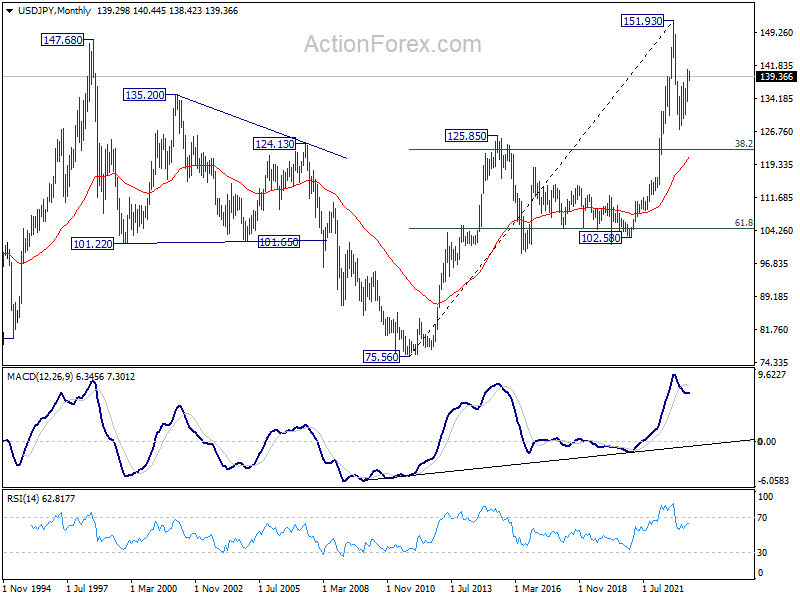
In the bigger picture, rise from 127.20 is seen as the second leg of the corrective pattern from 151.93 high. Stronger rally would be seen to 61.8% retracement of 151.93 to 127.20 at 136.34. Sustained break there will pave the way back to retest 151.93. On the downside, however, break of 133.73 support will argue that the pattern could have started the third leg through 127.20 low.
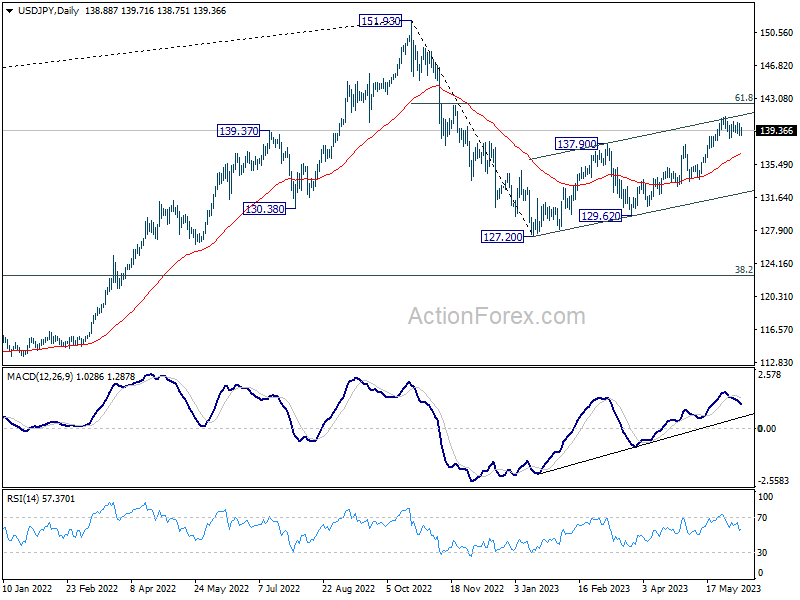
In the long term picture, price action from 151.93 is seen as developing into a corrective pattern to up trend from 75.56 (2011 low). While deeper decline cannot be ruled out, downside should be contained by 38.2% retracement of 75.56 to 151.93 at 122.75.
GBP/USD Weekly Outlook
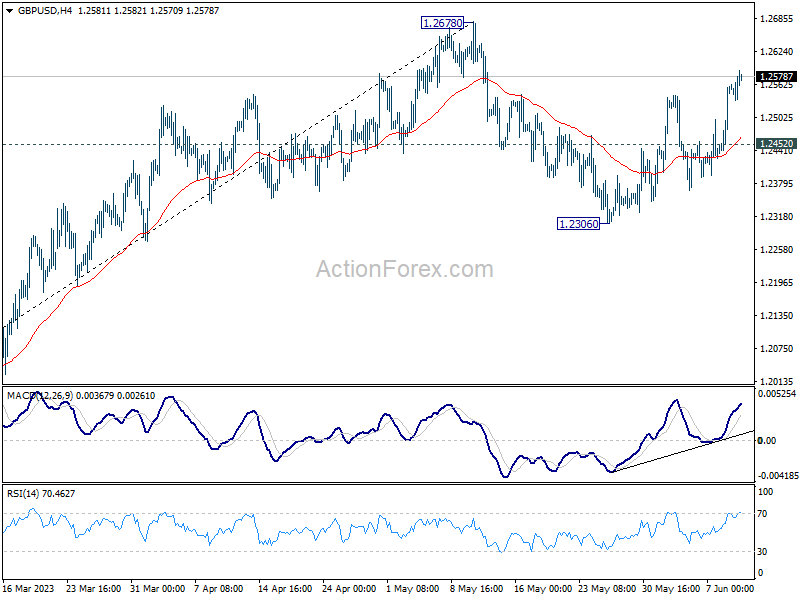
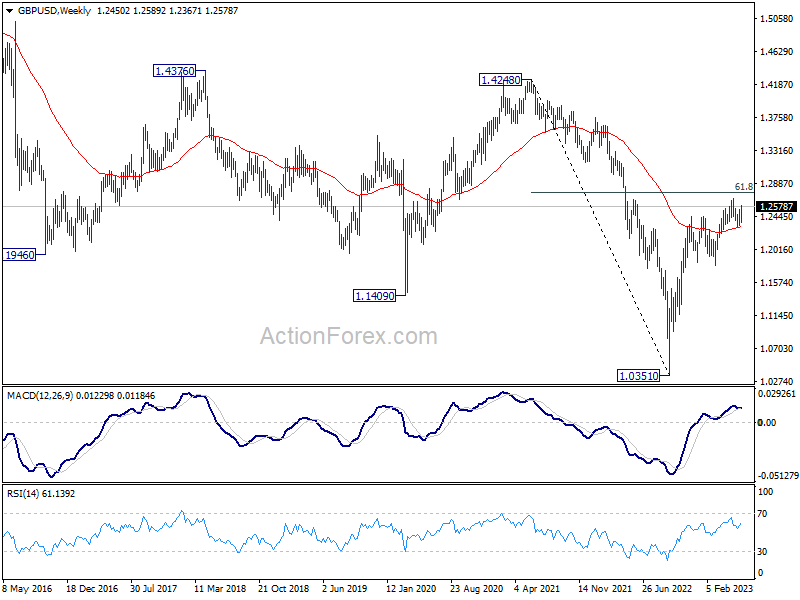
GBP/USD's rebound from 1.2306 resumed last week. Initial bias stays on the upside this week for retesting 1.2678 high. Firm break there will resume larger up trend to 1.2759 fibonacci level next. On the downside, however, break of 1.2452 minor support will turn bias back to the downside, to extend the pattern from 1.2678 with another falling leg through 1.2306 support.
In the bigger picture, as long as 1.1801 support holds, rise from 1.0351 medium term bottom (2022 low) is expected to extend further. Sustained break of 61.8% retracement of 1.4248 (2021 high) to 1.0351 at 1.2759 will add to the case of long term bullish trend reversal. However, firm break of 1.1801 will indicate rejection by 1.2759, and bring deeper decline, even as a correction.
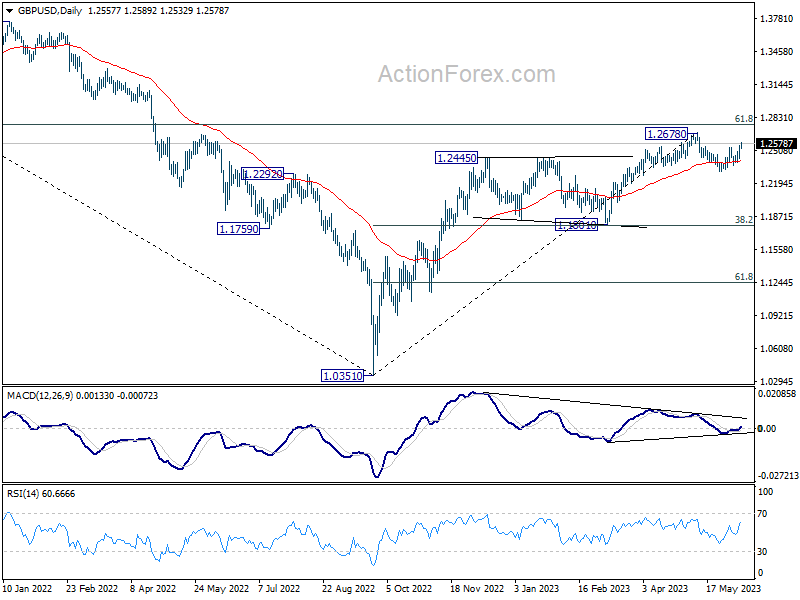
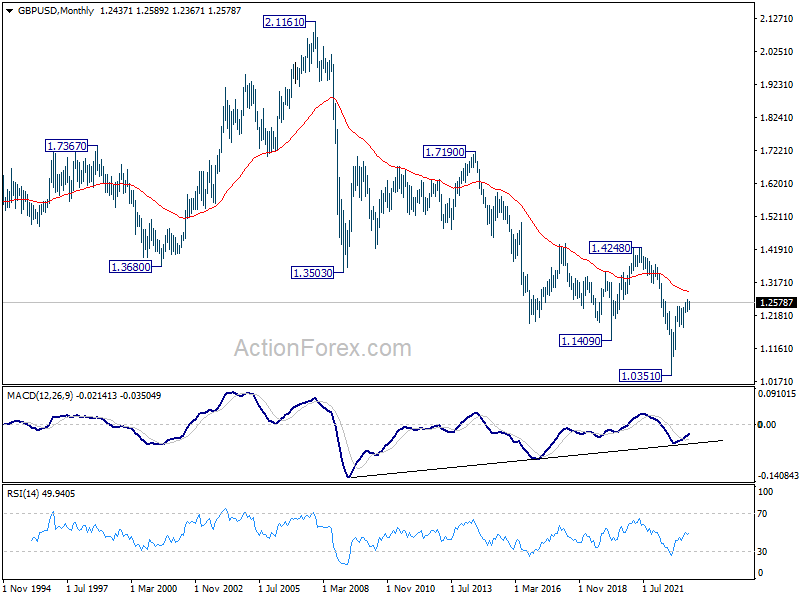
In the long term picture, while the rise from 1.0351 (2022 low) has been strong, there is no clear indicate of long term trend reversal yet. As long as 1.4248 resistance holds (2021 high), long term outlook will remain neutral at best.
USD/CHF Weekly Outlook
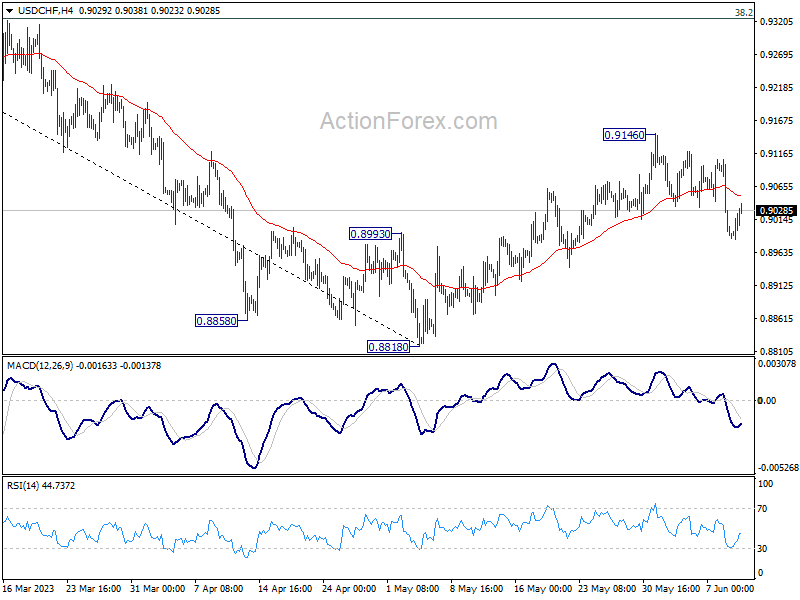
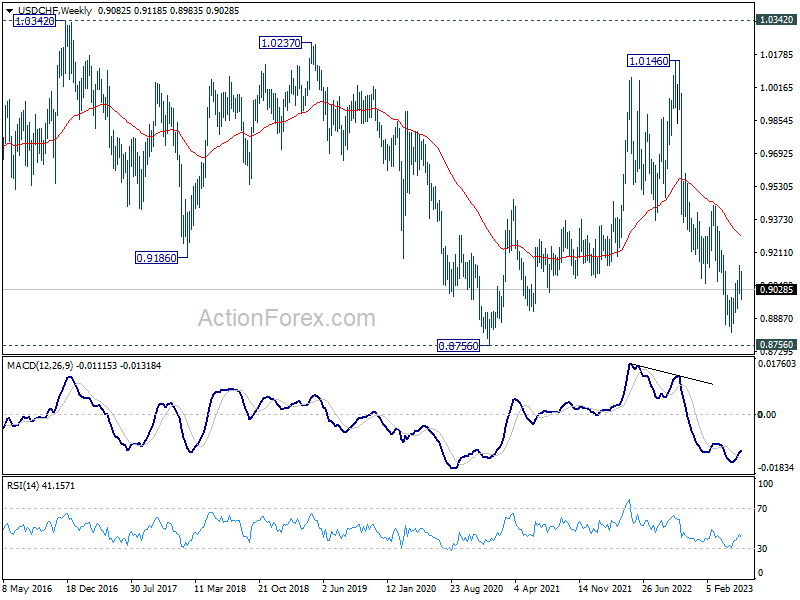
USD/CHF's decline last week argues that corrective recovery from 0.8818 has completed at 0.9146 already. For now, risk will stay on the downside as long as 0.9146 resistance holds. Deeper decline could be seen to 0.8818 support and possibly below. But strong support is still needed at around 0.8756 long term support to bring another rebound.
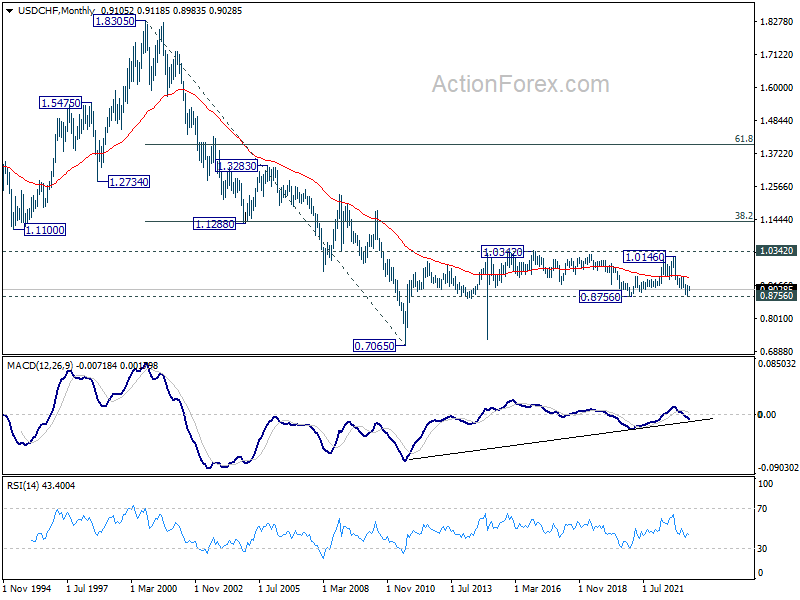
In the bigger picture, fall from 1.1046 (2022 high) is seen as a leg in the long term range pattern from 1.0342 (2016 high), which might have completed at 0.8818 already, just ahead of 0.8756 long term support. Sustained trading above 0.9058 support turned resistance should confirm medium term bottoming. Further break of 0.9439 resistance will confirm bullish trend reversal.
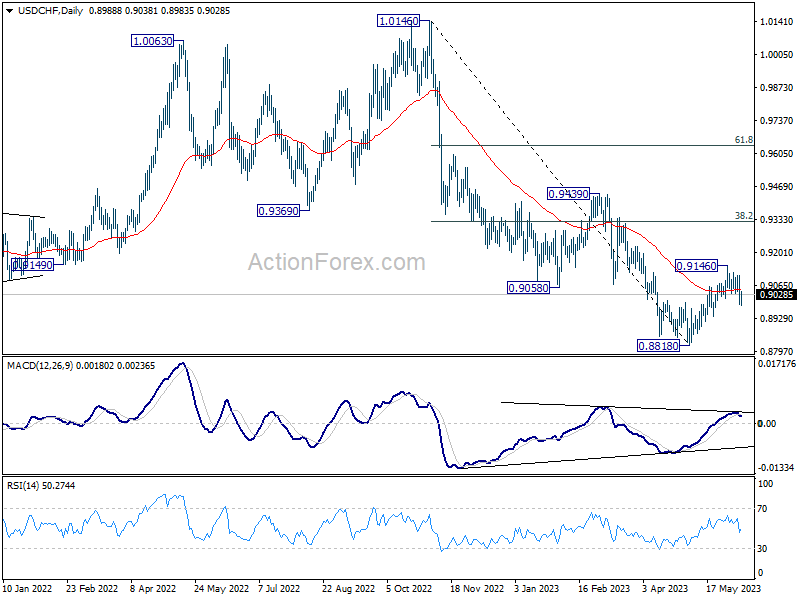
In the long term picture, long term sideway pattern from 1.0342 (2016 high) is expected to continue between 0.8756/1.0342. However, sustained break of 0.8756 will open up deeper fall back towards 0.7065 (2011 low).
AUD/USD Weekly Report
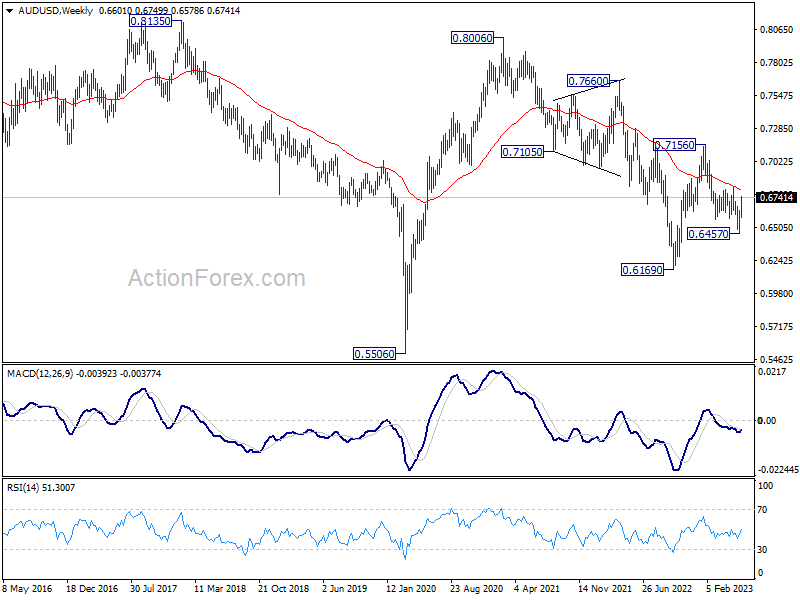
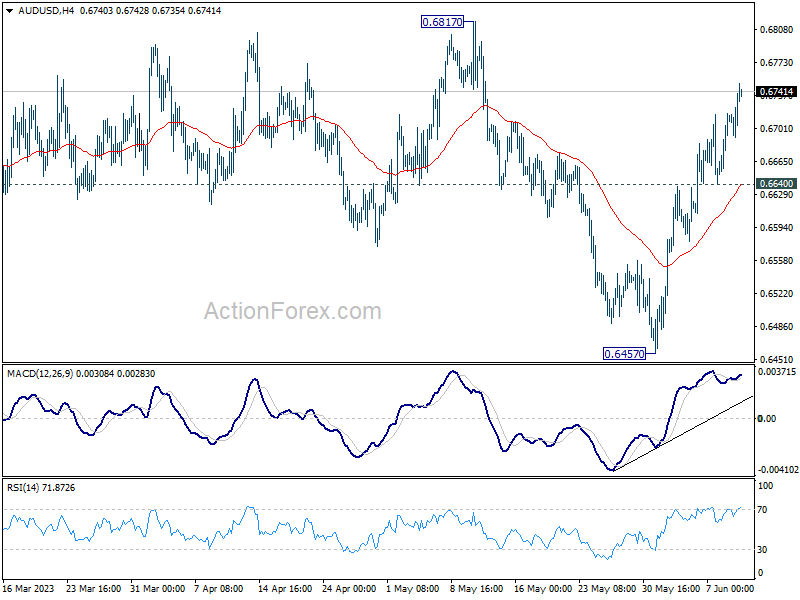
AUD/USD's rebound from 0.6457 extended higher last week and there is no clear sign of topping yet. Initial bias remains on the upside this week for 0.6817 resistance next. Decisive break there will carry larger bullish implications. On the downside, however, break of 0.6640 minor support will turn bias back to the downside for retesting 0.6457 low again.
In the bigger picture, fall from 0.7156 is still in favor to continue as long as 0.6817 resistance holds. Prior rejection by 55 W EMA (now at 0.6801) keeps medium term outlook bearish. Break of 0.6457 will target 0.6169 key support (2022 low). Nevertheless, firm break of 0.6817 will indicate that fall from 0.7156 has completed in a three-wave corrective structure. Rise from 0.6169 would then be ready to resume through 0.7156.
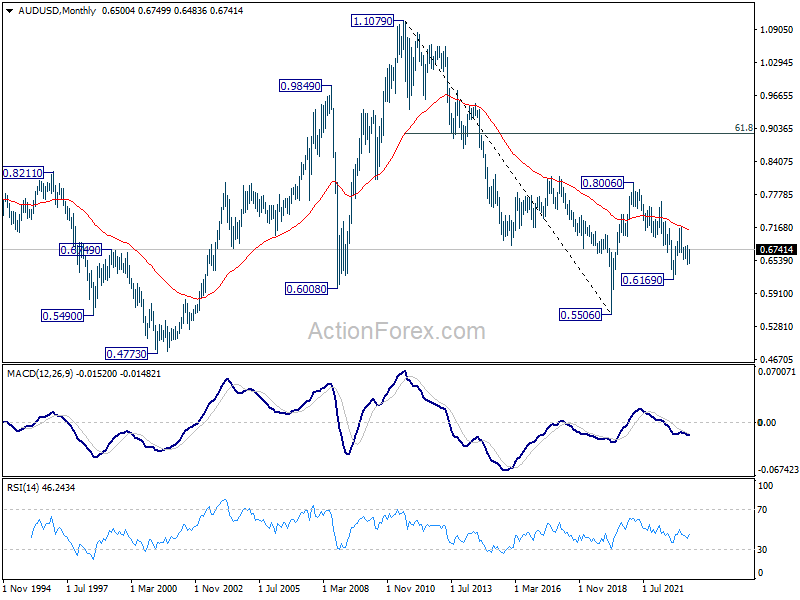
In the long term picture, initial rejection by 55 M EMA (now at 0.7119) retains long term bearishness. That is, down trend from 1.1079 (2011 high) could still resume through 0.5506 (2020 low) on resumption.