

Sample Category Title
US May CPI Inflation The Main Dish Today
Markets
US stock markets retained positive momentum yesterday with the three main indices rising by 0.55% (Dow) to 1.5% (Nasdaq). The S&P 500 rose by almost 1%, closing above the August 2022 top. Tech bell weather Nasdaq cleared that same technical hurdle earlier this month. Stock markets embrace the Fed’s “skip” idea while data simultaneously suggest that the economy and labour market aren’t cooling as rapidly as feared. The latest NY Fed Survey of Consumer Expectations yesterday provided evidence for both Team Skip and Team Hike within the Fed. Inflation expectations declined at the short term horizon to their lowest level in two years (1y; 4.4% to 4.1%), while they increased slightly at the medium- (3y; 2.9% to 3%) and longer-term (5y; 2.6% to 2.7%) horizons. Labor market expectations were mixed as well with expected earnings growth declining (2.8% from 3%), and unemployment expectations and perceived job loss risk improving. Households' perceptions and expectations for credit conditions and their own financial situations all deteriorated slightly. The US Treasury started its mid-month refinancing operation with an average $40bn 3-yr Note auction (awarded almost bang in line with 1:00 PM WI, bid cover in line with previous six auctions at 2.7) and a more difficult $32bn 10-yr Note sale (stopped 1.5 bps through WI with average bid cover at 2.36). The NY Fed Survey and the auctions left no traces on yesterday’s intraday trading pattern which saw US Treasuries advance in lockstep with stocks. US yields fell slightly less than 2 bps at the front end of the curve while ending flat at the very long end. German Bunds underperformed with daily yield changes varying between -0.7 bps (2-yr) and +3.4 bps (30-yr). EUR/USD closed unchanged after testing last week’s top at EUR/USD 1.0787. EUR/GBP bounced off 0.8547 support going into this week’s key data releases to close a tad below 0.86. Labour market data came in extremely hot this morning with more wage pressure, stronger employment growth and a lower unemployment rate. Sterling rises on the figures.
US May CPI inflation is the main dish today. Consensus expects a 0.1% M/M headline increase with the Y/Y-figure declining further from 4.9% to 4.1% mainly driven by energy and base effects. These will continue to play a role in June as well. Core inflation is expected to rise by 0.4% M/M and 5.2% Y/Y (from 5.5% Y/Y). Anything bar an outsized upward surprise should seal the Fed’s skip strategy. Anything in line with or below forecasts will pull US yields and the dollar lower going into tomorrow’s meeting with some still betting on a rate hike. Nearby technical resistance levels (eg 4.64% for the 2y-yield) come into play as well. Risk sentiment should remain constructive. The US Treasury’s $18bn 30-yr bond sale is a wildcard for trading.
News Headlines
The People’s Bank of China (PBOC) today unexpectedly cut its short-term policy interest rate. It reduced the seven day reverse repo rate from 2% to 1.9%. It was the first policy rate cut since August of last year. The rate cut is seen as an indication that the PBOC is acknowledging that the post-pandemic recovery needs additional support. China releases a series of key economic data, including retail sales, investment statistics, production data and money supply data later this week. Markets now also look out for a potential cut in the rate on the 1 year medium term Lending facility on Thursday. The yuan weakened further this morning. USD/CNY jumped to currently trade in the 7.16 area, the lowest level for the Chinese currency since end November of last year.
Data published yesterday by the Central statistics office showed that Indian inflation decelerated further in May. The headline figure dropped from 4.7% Y/Y in April to 4.25% Y/Y in May, the lowest reading since April 2021. Inflation is now firmly within the 2%-6 % target band of the Reserve Bank of India. The decline was broad-based. Food inflation, the biggest component in the index, dropped from 4.2% to 3.29%. However, also components of core inflation remained on a downward trajectory. Last week, the Reserve Bank of India kept its policy rate unchanged at 6.5%. The RBI is expected to maintain a prolonged pause in its policy cycle. The Indian Rupee recently rebounded modestly against the dollar currently trading near USD/INR 82.45.
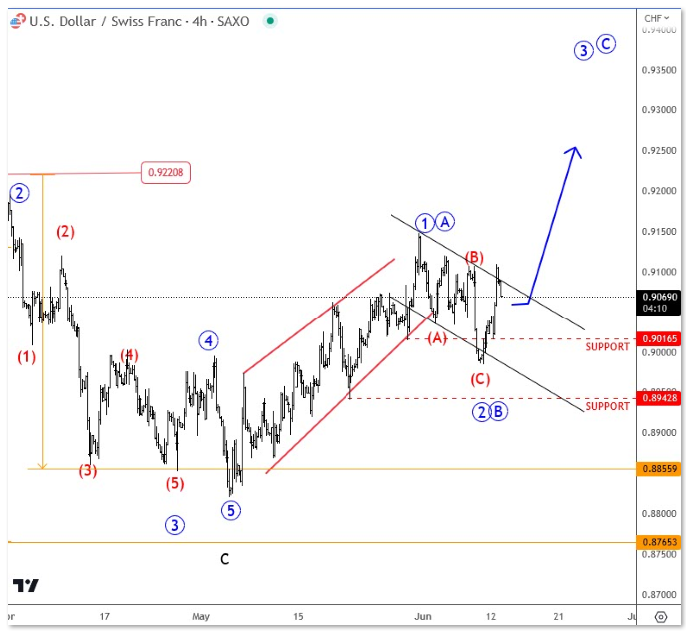
Elliott Wave Forecast: CHF Looking Weak vs USD – More Gains after A-B-C Pullback
USDCHF has been bearish for the last few months but notice that move is coming down from a triangle which we know its then the final leg of a higher degree bearish trend. That said, we should be aware of a potential change in trend, maybe already happening now after a nice recovery back above 0.9. It's not impulse up yet, but more gains can come if we consider that wave 1/A might have unfolded as a leading diagonal. As such, wave 2/B can send prices higher this week, from 0.9 or 0.8940 area, from where we are already seeing some nice push higher. But still need a daily close out of a downward corrective channel to make sure that the third leg up is underway.
All Eyes on US Inflation
The S&P 500 surpassed last summer peak level and recovered to the highest levels since April 2022 on hope that… we could see a sufficiently soft inflation data from the US, which could chase the hawkish Federal Reserve (Fed) clouds away and clear the sky for a Fed pause.
The US inflation data is due today, as the Fed begins its two day policy meeting. Expectations are rather soft – which make them harder to beat. The US headline inflation is expected to have eased from 4.9% to 4.1% in May, core inflation – excluding food and energy – is expected to have soften from 5.5% to 5.3%. On a monthly basis, core CPI is expected to have risen at 0.4%, same speed as last month, as price increases in services and rents remain sticky.
One encouraging piece of data, however, is the falling inflation expectations. The latest survey from the New York Fed showed that the one-year inflation expectation further fell to 4.1%, although we saw an uptick in 3-year expectation to 3%.
What’s interesting here is the idea that consumers get used to the idea that, yes, inflation will slow from the actual levels, but we will not return to the 2%-inflation-era anytime soon. Both the US and Europe should accept and live with inflation levels that are closer to 3-4%, than 2% and below as has been the case for the past decade. In fact, trade war with China, war in Ukraine, energy crisis, energy transition, reindustrialization and onshoring are all inflationary factors, and will make the Fed’s job of reaching a 2% inflation rather complicated.
While equity traders seem optimistic about the end of the Fed tightening, bond traders are more skeptical. The US 2-year yield remains on a positive trajectory. The US sovereign bonds outlook will remain negative until a strong hint that the Fed rate hikes are over.
The US dollar is softer, and a sufficiently soft US inflation could push the EURUSD past its 100-DMA, near 1.08.
Regarding the equity rally
There are diverging opinions about what happens next. Some investors think that the Big Tech led equity rally should continue with the rest of the market due to catch up their technology peers. Some others think that the S&P500’s fresh bull market is just an illusion and doesn’t mean that the bear market is over. In this context, Morgan Stanley points at 1940s when the S&P500 rallied around 24% before falling to a new low. I think the truth is certainly somewhere in between. The S&P500 is now approaching overbought conditions, which will bring some investors to take their profit and walk away. Big Tech, which saw the strongest rally this year, is potentially where the profit-taking will be happening.
Cheap sanctioned Oil
Crude oil was hit by another wave of selloff yesterday which sent the barrel of American crude below the $67 level. News that the discounted Russian oil came to Pakistan backed warnings of increased supply from sanctioned countries, which will increase the level of global oil supply with cheaper oil. Expect further downside pressure in oil prices; the next support is seen at around the $65pb.
Technical Outlook and Review
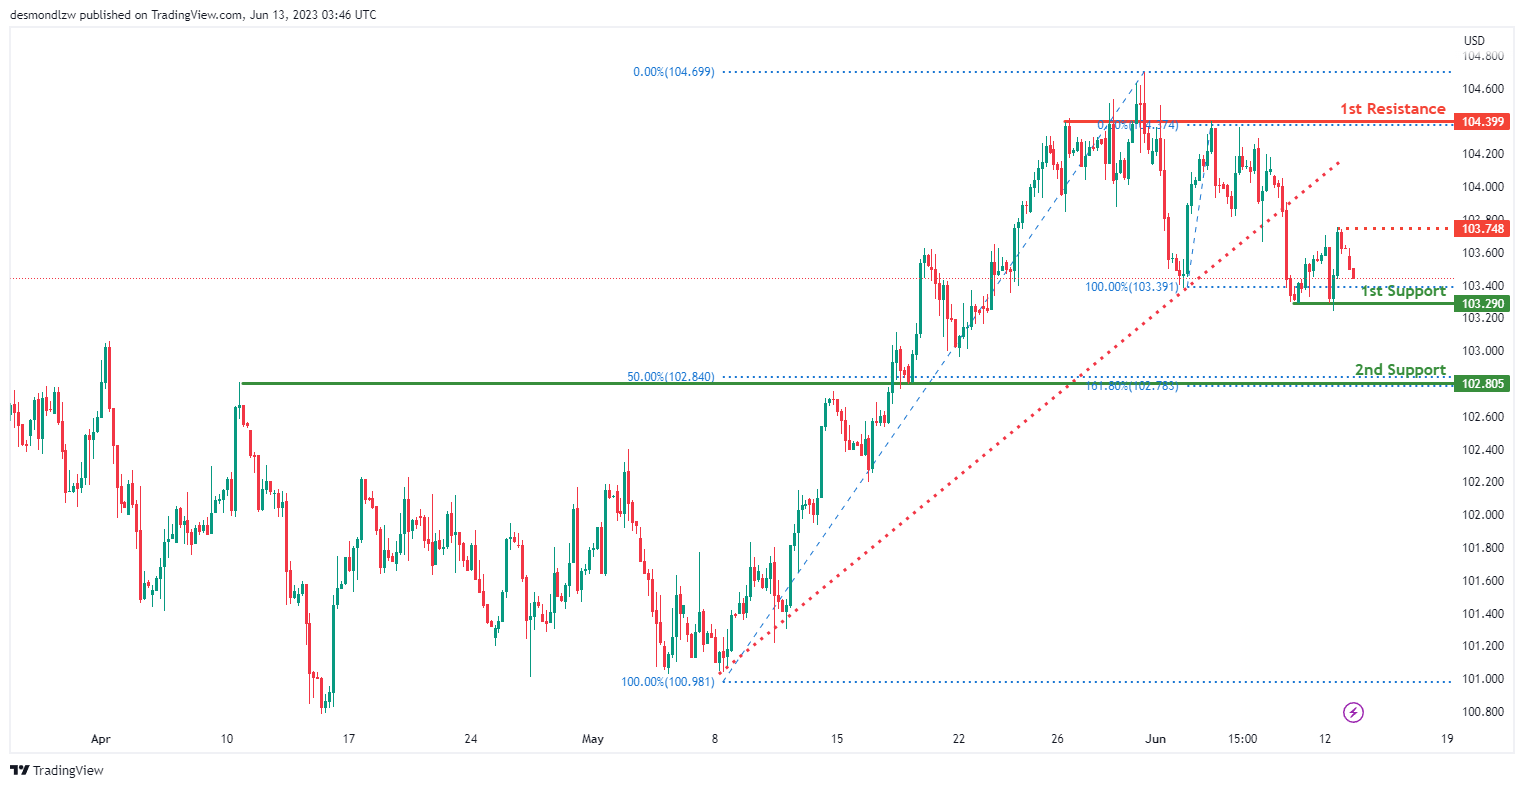
DXY:
The DXY chart currently demonstrates bearish momentum, indicating a downward trend in price.
There is a potential for a bearish continuation towards the first support level at 103.29. This support level represents an area of overlap support, suggesting its significance in potentially halting the downward movement.
Additionally, the second support level at 102.81 reinforces the potential for support. This level coincides with the 50% Fibonacci retracement, further highlighting its importance as a potential area of support.
On the upside, there is an intermediate resistance level at 103.75, representing a swing high resistance. This level may pose a hurdle to upward movement and could potentially act as a point of resistance.
Furthermore, the first resistance level at 104.40 is an area of overlap resistance. It could potentially impede bullish momentum and act as a barrier to further upward movement.
EUR/USD:
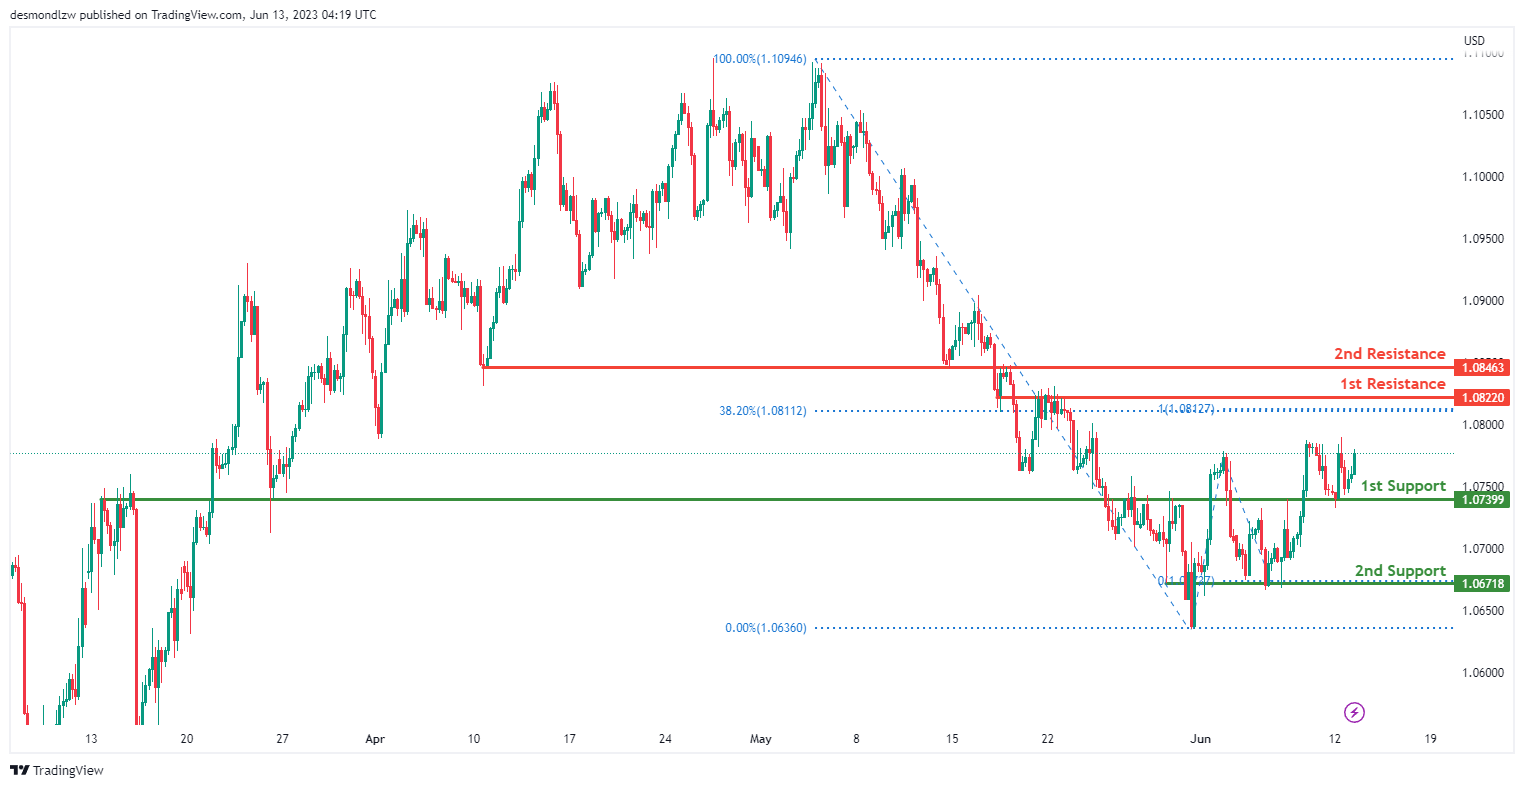
The EUR/USD chart currently exhibits a neutral momentum, indicating a lack of clear direction in price movement.
There is a possibility for price to fluctuate between the first resistance level at 1.0822 and the first support level at 1.0740. The first support level represents an area of overlap support, while the first resistance level acts as an area of overlap resistance. Additionally, the first resistance level is reinforced by the presence of a 38.20% Fibonacci retracement.
Furthermore, the second support level at 1.0672 and the second resistance level at 1.0846 also serve as areas of overlap support and resistance, respectively.
GBP/USD:
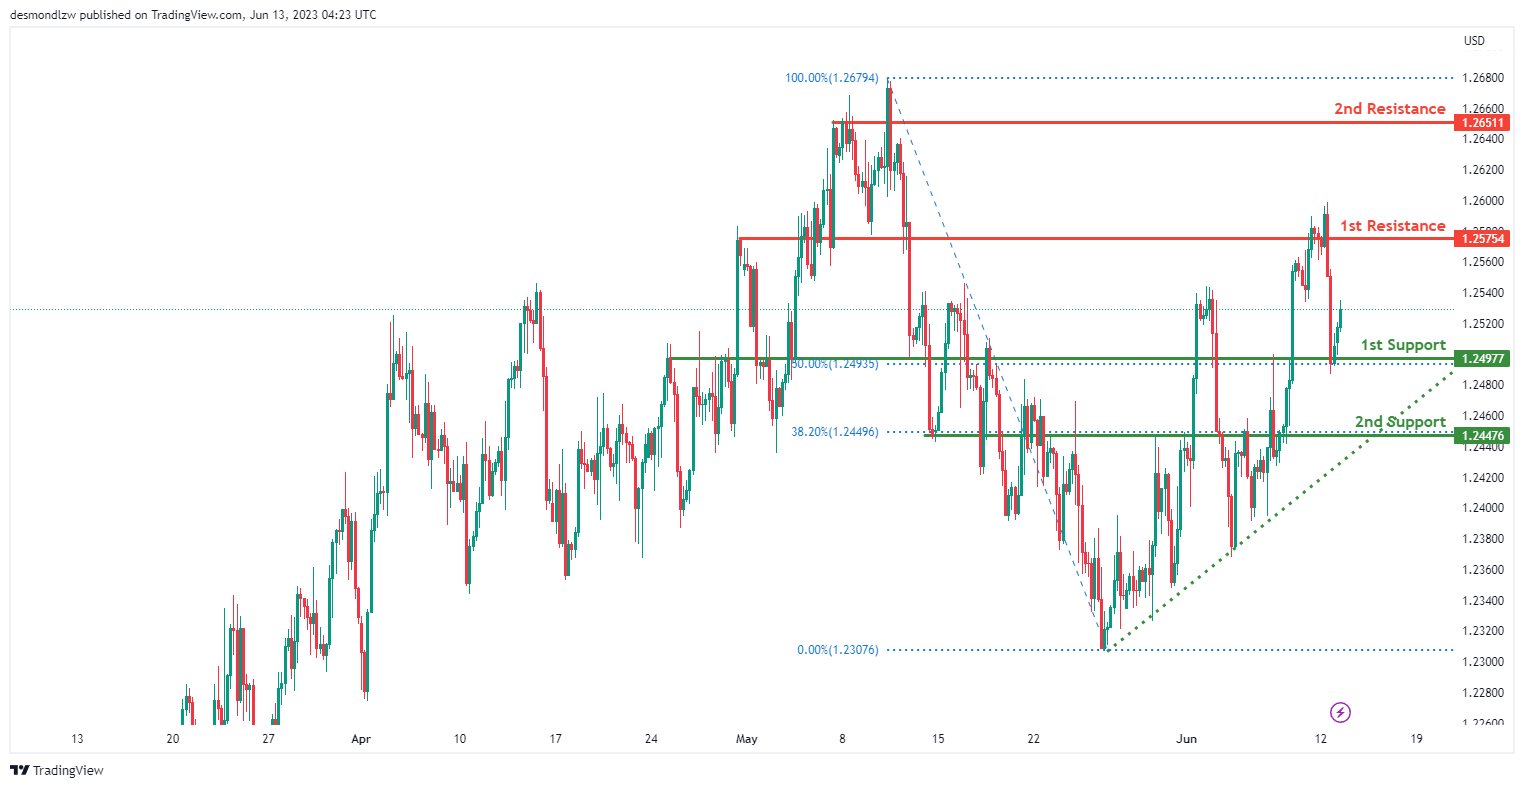
The GBP/USD chart currently exhibits a weak bullish momentum with low confidence, suggesting a tentative upward bias in price movement.
There is a potential for a bullish continuation towards the first resistance level at 1.2575. This resistance level is significant as it represents an area of overlap resistance.
On the downside, the first support level at 1.2498 is an important area to watch. It coincides with a 50% Fibonacci retracement level and provides potential support for the price. Additionally, the second support level at 1.2448 is another area of support, representing an overlap support level along with a 38.20% Fibonacci retracement.
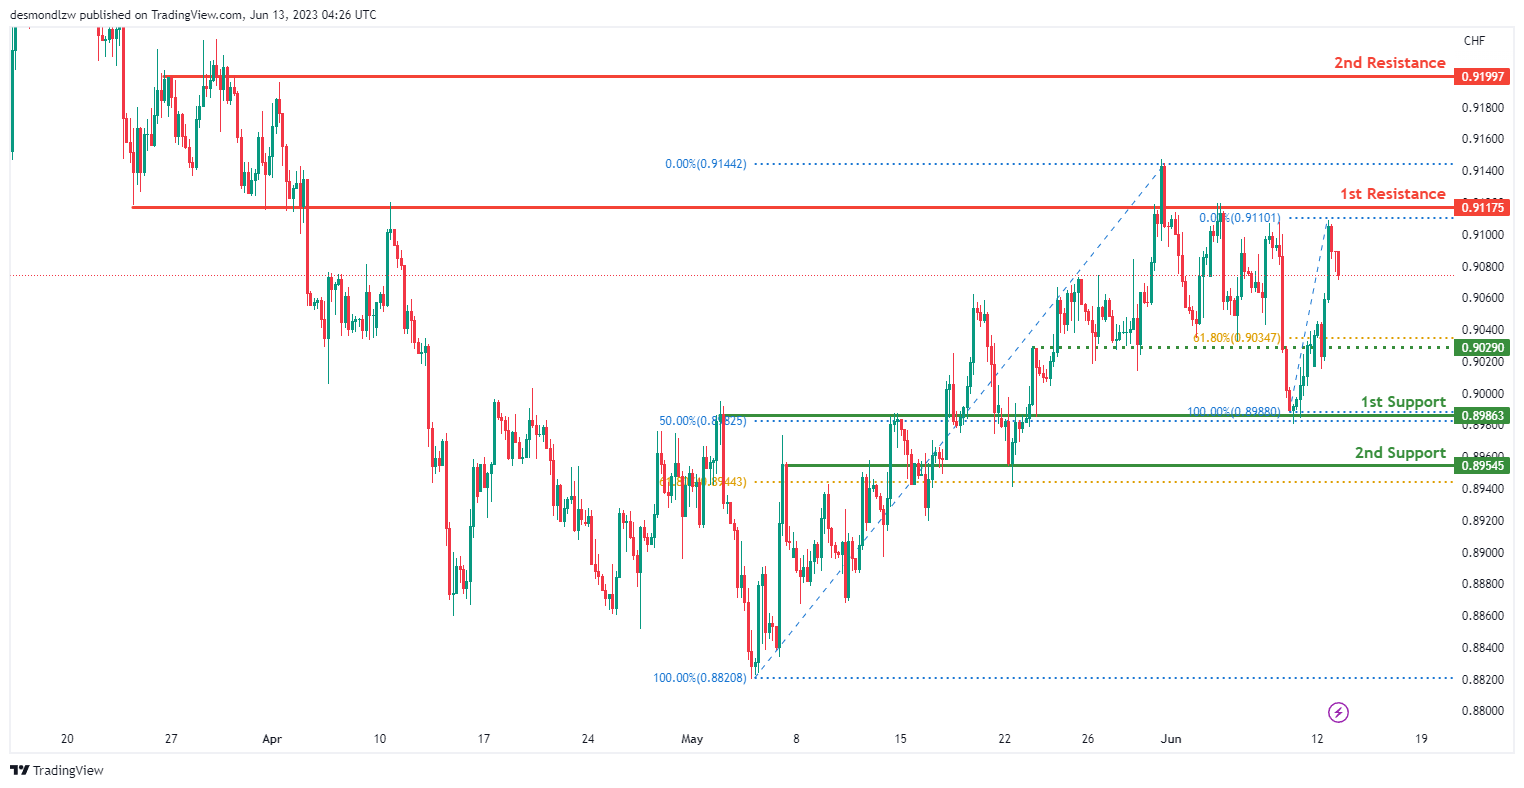
USD/CHF:
The USD/CHF chart currently shows a bearish momentum, indicating a downward bias in price movement.
There is a potential for a bearish continuation towards the first support level at 0.8986. This support level is significant as it represents an area of overlap support and coincides with a 50% Fibonacci retracement level. There is also an intermediate support level at 0.9029 that aligns with the 61.8% Fibonacci retracement level.
Additionally, the second support level at 0.8955 further strengthens the potential for downward movement. It is an area of overlap support and aligns with a 61.80% Fibonacci retracement level.
On the upside, the first resistance level at 0.9118 acts as a level of resistance, representing an area of overlap resistance.
Similarly, the second resistance level at 0.9200 is also an area of overlap resistance, further reinforcing the potential for price to face resistance.
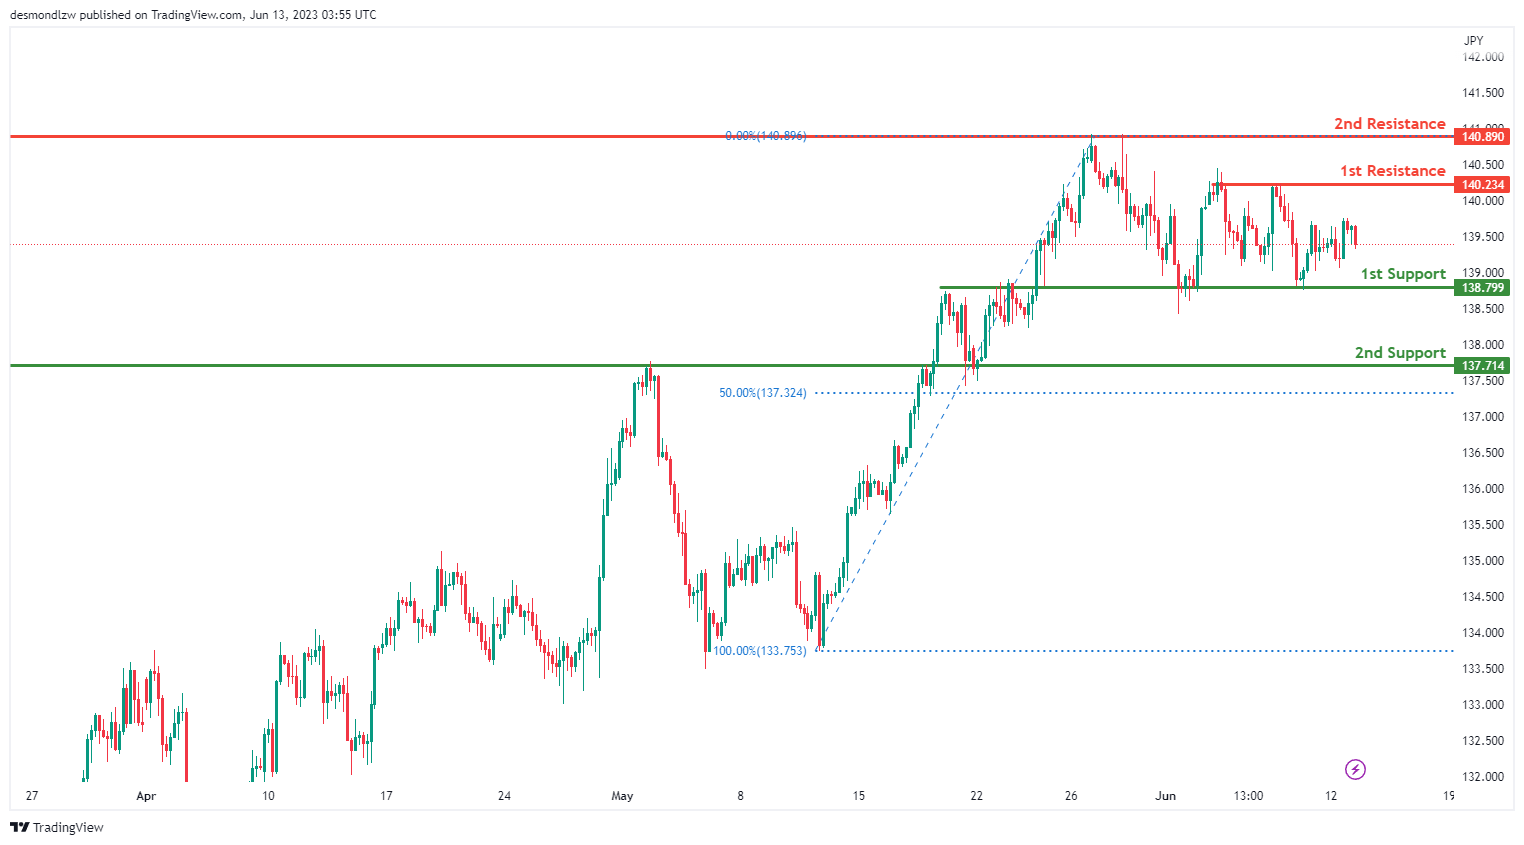
USD/JPY:
The USD/JPY chart currently exhibits a neutral momentum, indicating a lack of clear direction in price movement.
There is a potential for price to fluctuate between the first resistance level at 140.23 and the first support level at 138.80. These levels represent areas of overlap resistance and support, respectively.
Additionally, the second support level at 137.71 coincides with the 50% Fibonacci retracement, further emphasizing its significance as a potential area of support.
Similarly, the second resistance level at 140.89 is an area of overlap resistance, reinforcing its importance as a potential level where price could face resistance
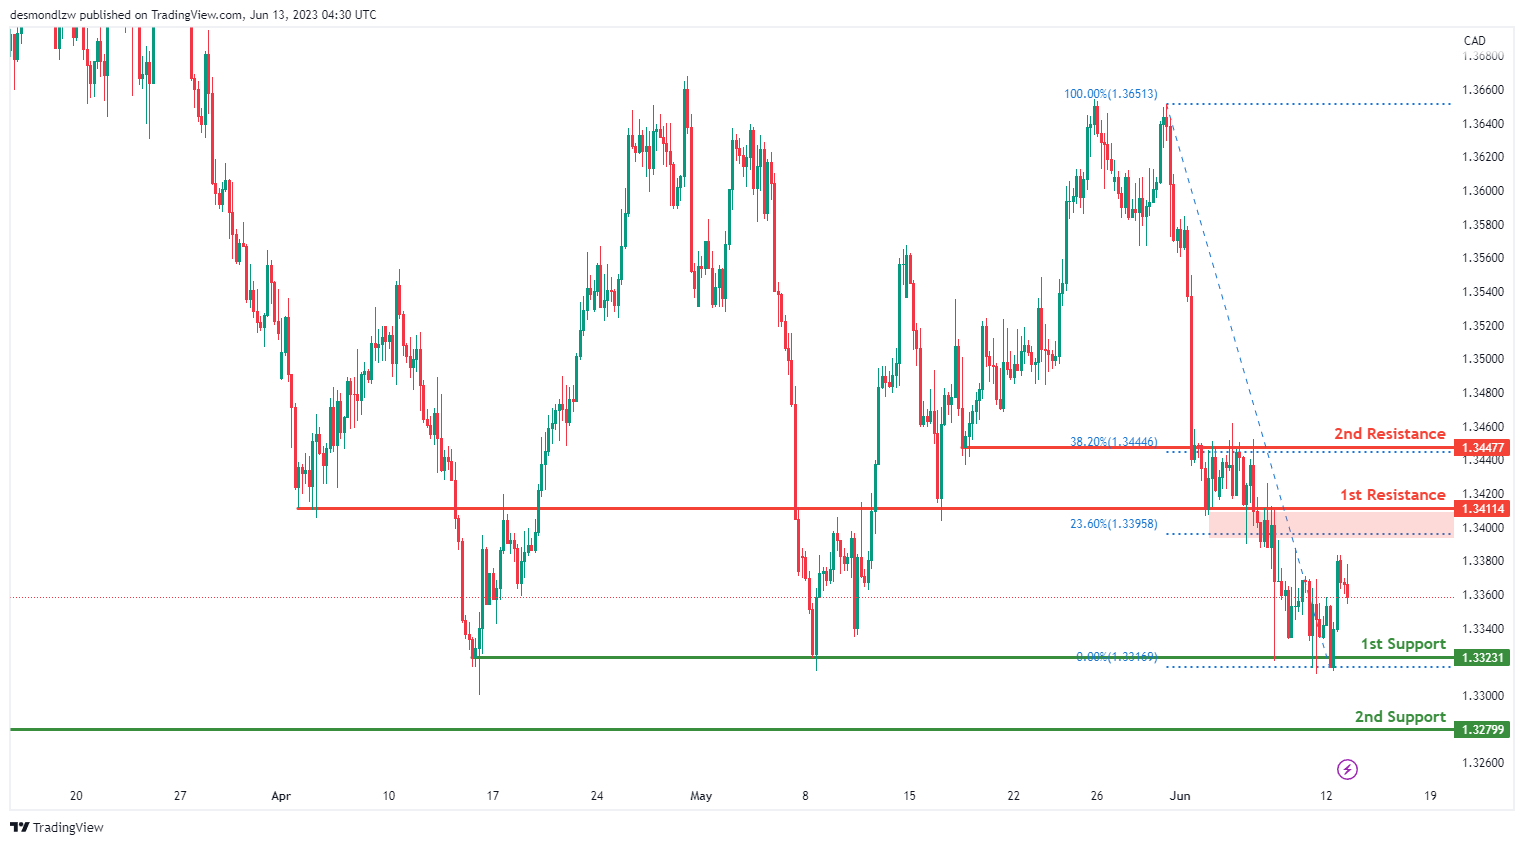
USD/CAD:
The USD/CAD chart currently exhibits a bearish momentum, indicating a downward bias in price movement.
There is a potential for a bearish continuation towards the first support level at 1.3323. This support level is significant as it represents an area of overlap support.
Additionally, the second support level at 1.3280 reinforces the potential for further downward movement, as it also represents an area of overlap support.
On the upside, the first resistance level at 1.3411 acts as a level of resistance. It is an area of overlap resistance and is further supported by the presence of a 23.60% Fibonacci retracement level.
Similarly, the second resistance level at 1.3448 also functions as an area of overlap resistance and aligns with a 38.20% Fibonacci retracement level.
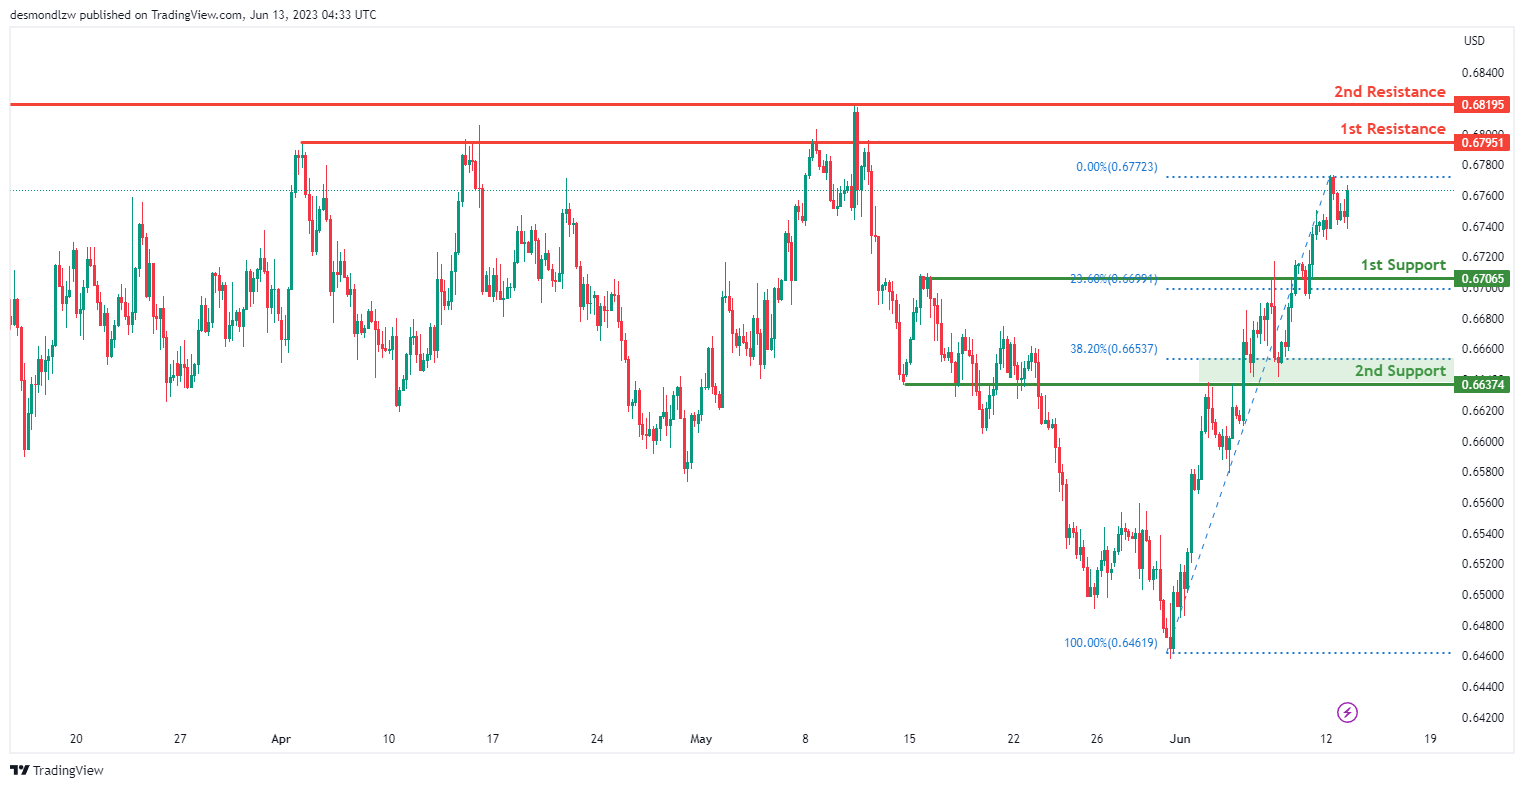
AUD/USD:
The AUD/USD chart currently shows a bullish momentum, indicating an upward bias in price movement.
There is a potential for a bullish continuation towards the first resistance level at 0.6795. This resistance level is significant as it represents an area of overlap resistance.
Furthermore, the second resistance level at 0.6820 further supports the potential for upward movement, as it also represents an area of overlap resistance.
On the downside, the first support level at 0.6707 acts as a level of support. It is an area of overlap support and is reinforced by the presence of a 23.60% Fibonacci retracement level.
Similarly, the second support level at 0.6637 functions as an area of overlap support and aligns with a 38.20% Fibonacci retracement level.
NZD/USD
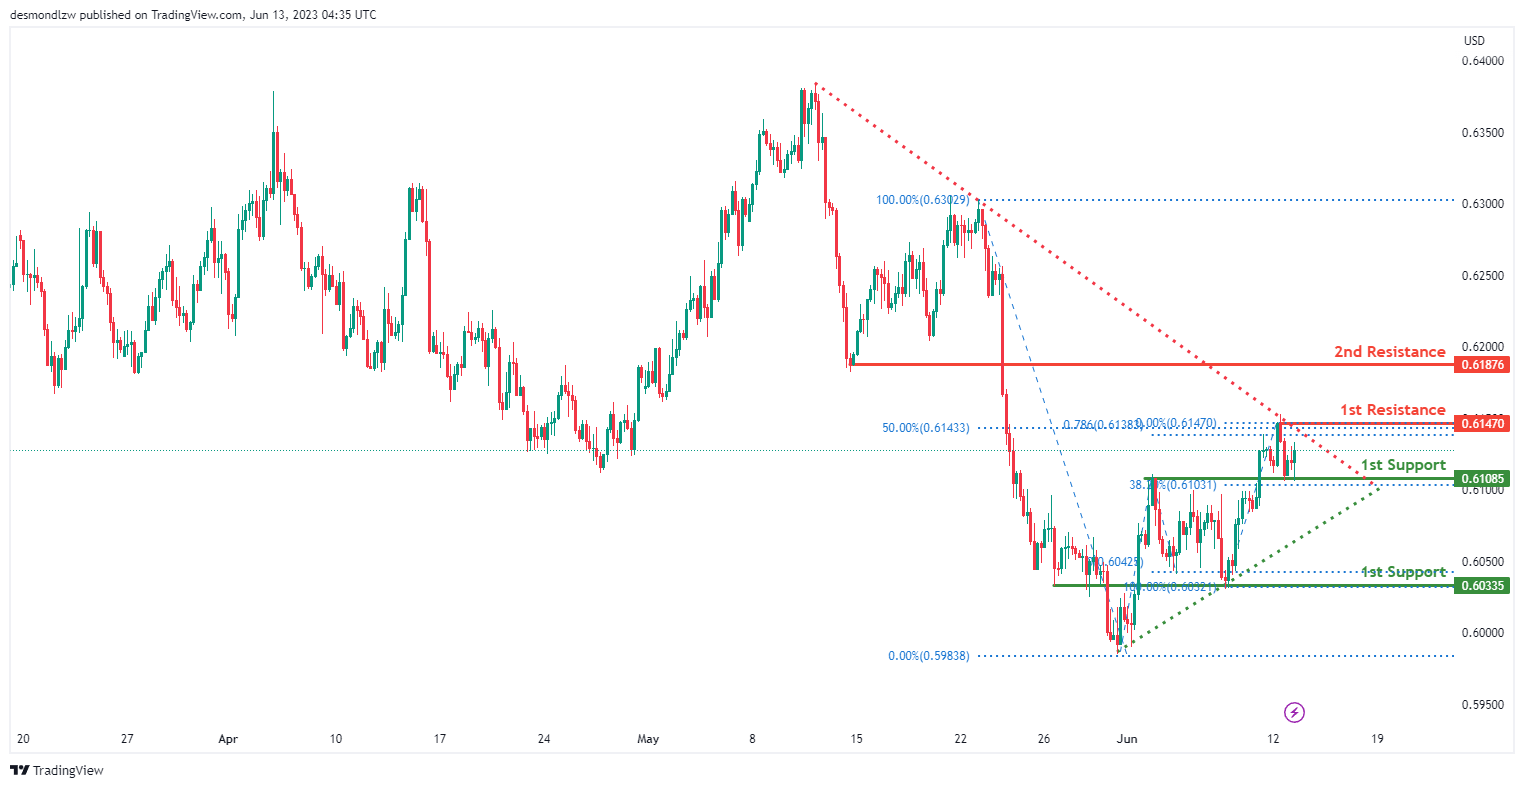
The NZD/USD chart currently shows a weak bullish momentum, indicating a slight upward bias in price movement, although with low confidence.
There is a potential for a bullish continuation towards the first resistance level at 0.6147. This resistance level is significant as it represents an area of overlap resistance and is further reinforced by the presence of a 50% Fibonacci retracement level and a 78.60% Fibonacci projection.
On the downside, the first support level at 0.6109 acts as a level of support. It is an area of overlap support and is also aligned with a 38.20% Fibonacci retracement level.
Similarly, the second support level at 0.6034 functions as an area of overlap support.
DJ30:
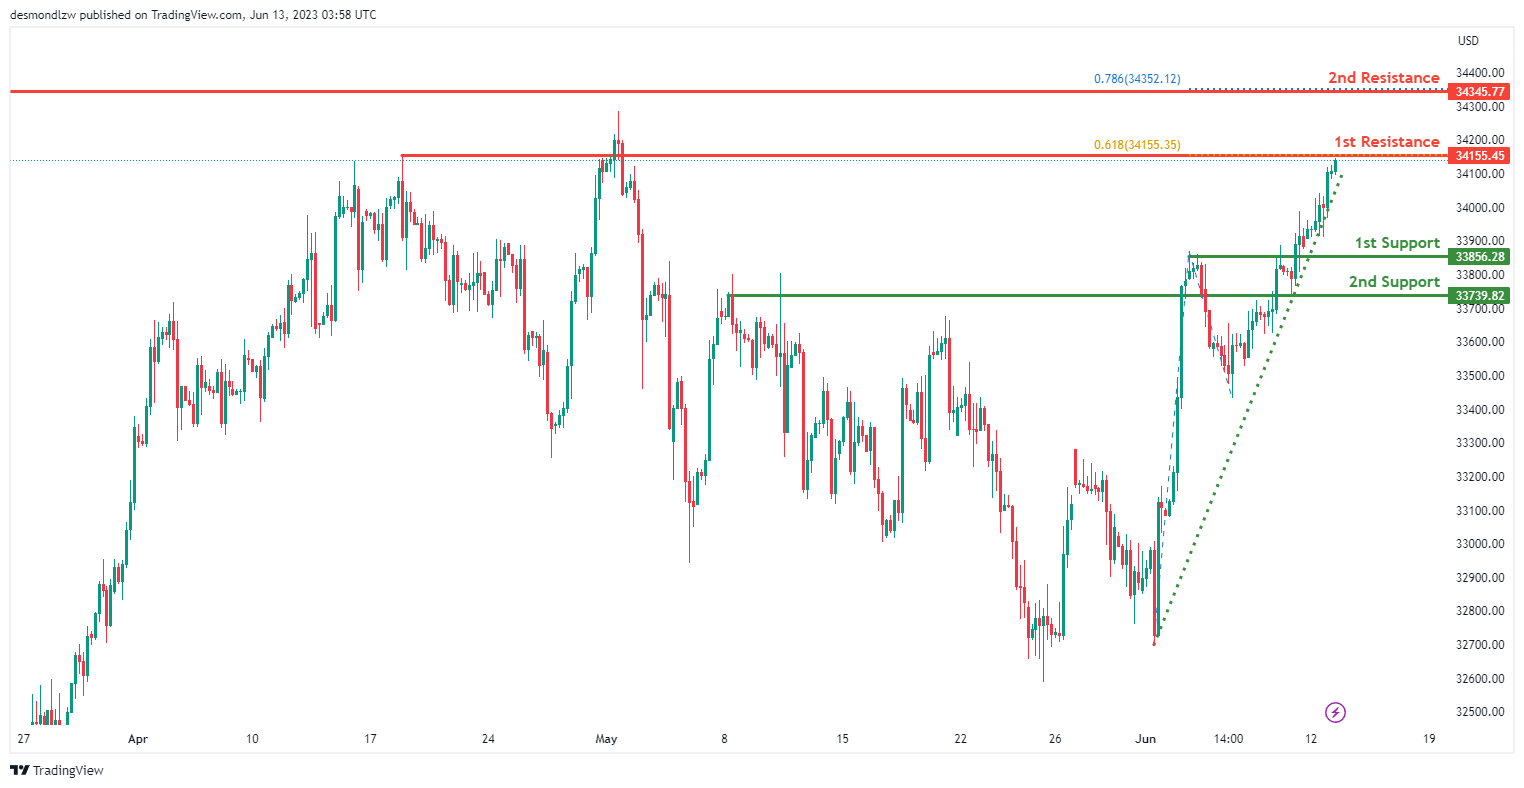
The DJ30 chart currently shows a bullish momentum, indicating a positive bias in price movement.
There is a potential for a bullish continuation towards the first resistance level at 34,155.45. This resistance level is significant as it represents an area of overlap resistance and coincides with the 61.80% Fibonacci projection, adding to its importance.
On the downside, the first support level at 33,856.28 and the second support level at 33,739.82 both act as areas of overlap support, providing potential levels where price could find support.
Furthermore, the second resistance level at 34,345.77 also serves as an area of overlap resistance, reinforcing its significance in potentially halting the upward movement of price.
GER30:
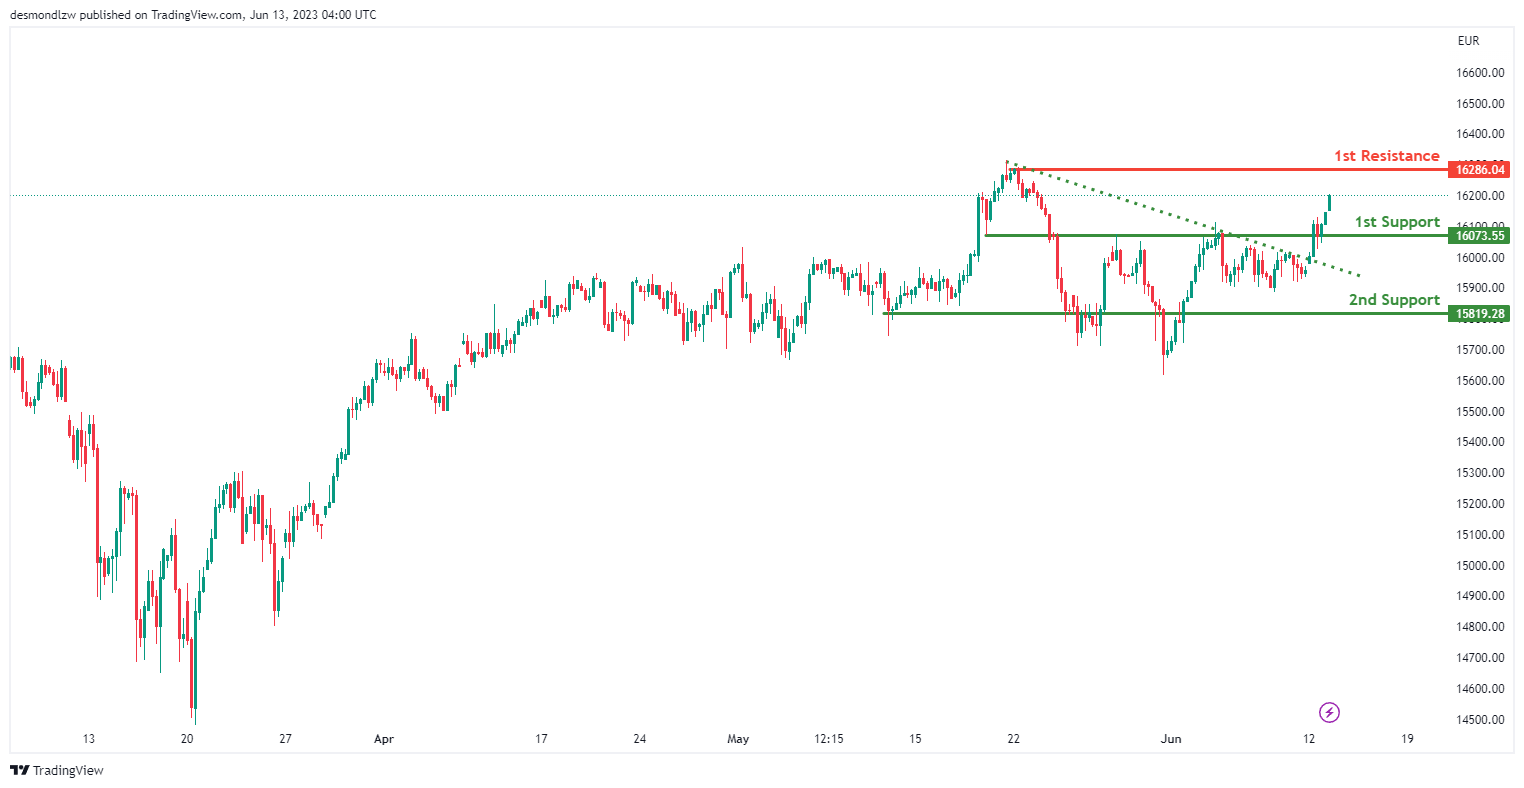
The GER30 chart currently exhibits a bullish momentum, indicating a positive bias in price movement.
There is a potential for a bullish continuation towards the first resistance level at 16,286.04. This resistance level is significant as it represents a swing high resistance, suggesting a potential area where price could face selling pressure.
On the downside, the first support level at 16,073.55 and the second support level at 15,819.28 both act as areas of overlap support, providing potential levels where price could find support during pullbacks..
US500
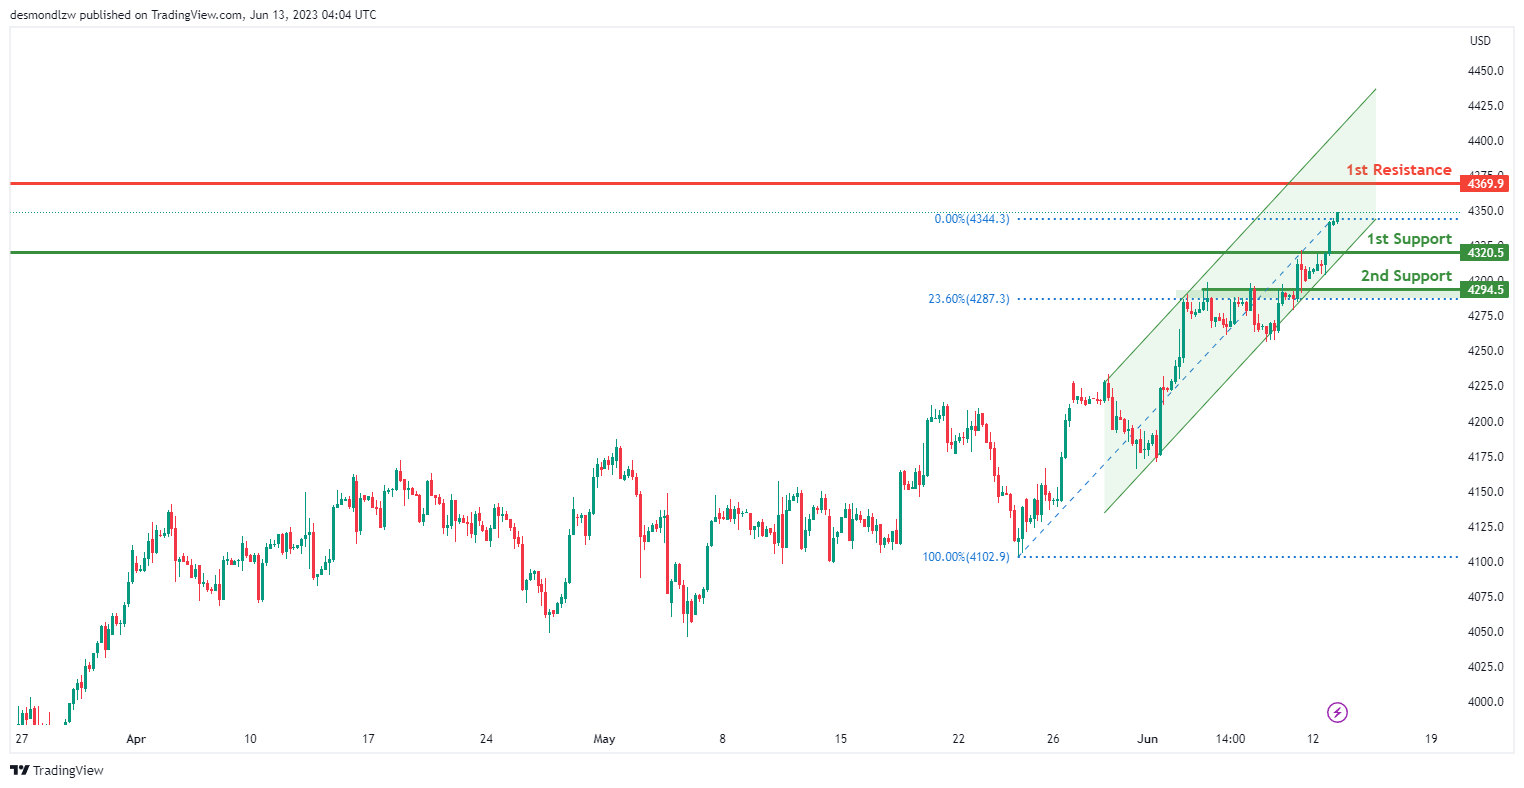
The US500 chart currently shows a bullish momentum, indicating a positive bias in price movement.
There is a potential for a bullish continuation towards the first resistance level at 4369.90. This resistance level is significant as it represents an area of overlap resistance, suggesting a potential area where price could face selling pressure.
On the downside, the first support level at 4320.50 and the second support level at 4294.50 both act as areas of overlap support. These levels provide potential areas where price could find support during pullbacks.
BTC/USD:
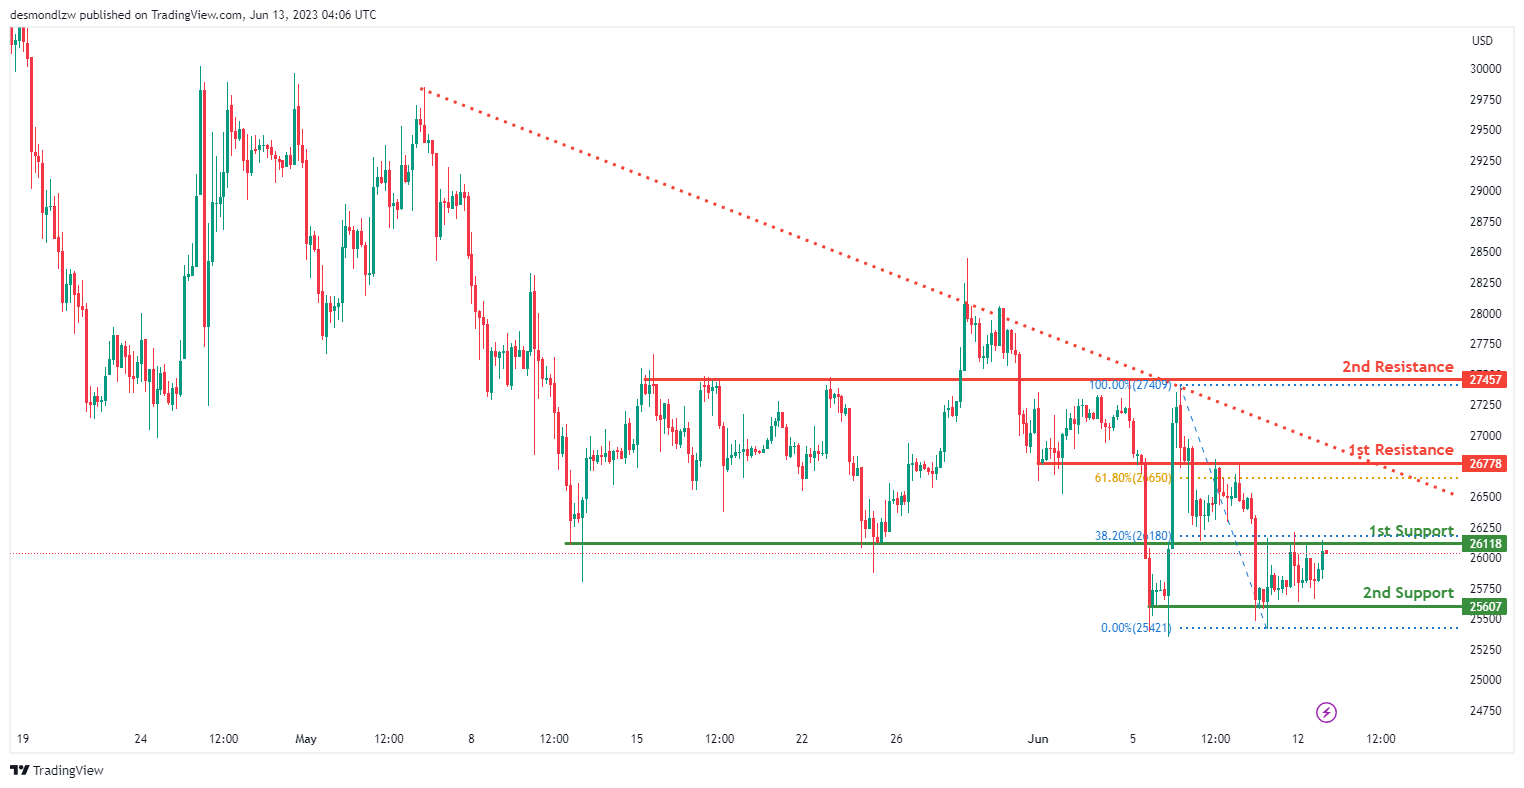
The BTC/USD chart is currently showing a neutral momentum, indicating a lack of strong directional bias in price movement.
There is a potential for price to fluctuate between the first resistance level at 26778.00 and the first support level at 26118.00. These levels are significant as they represent areas of overlap resistance and support, respectively. Additionally, the first support level is aligned with the 38.20% Fibonacci retracement level, adding further importance to this level.
On the upside, the second resistance level at 27457.00 acts as an additional area of overlap resistance, potentially providing a barrier for further upward movement.
ETH/USD:
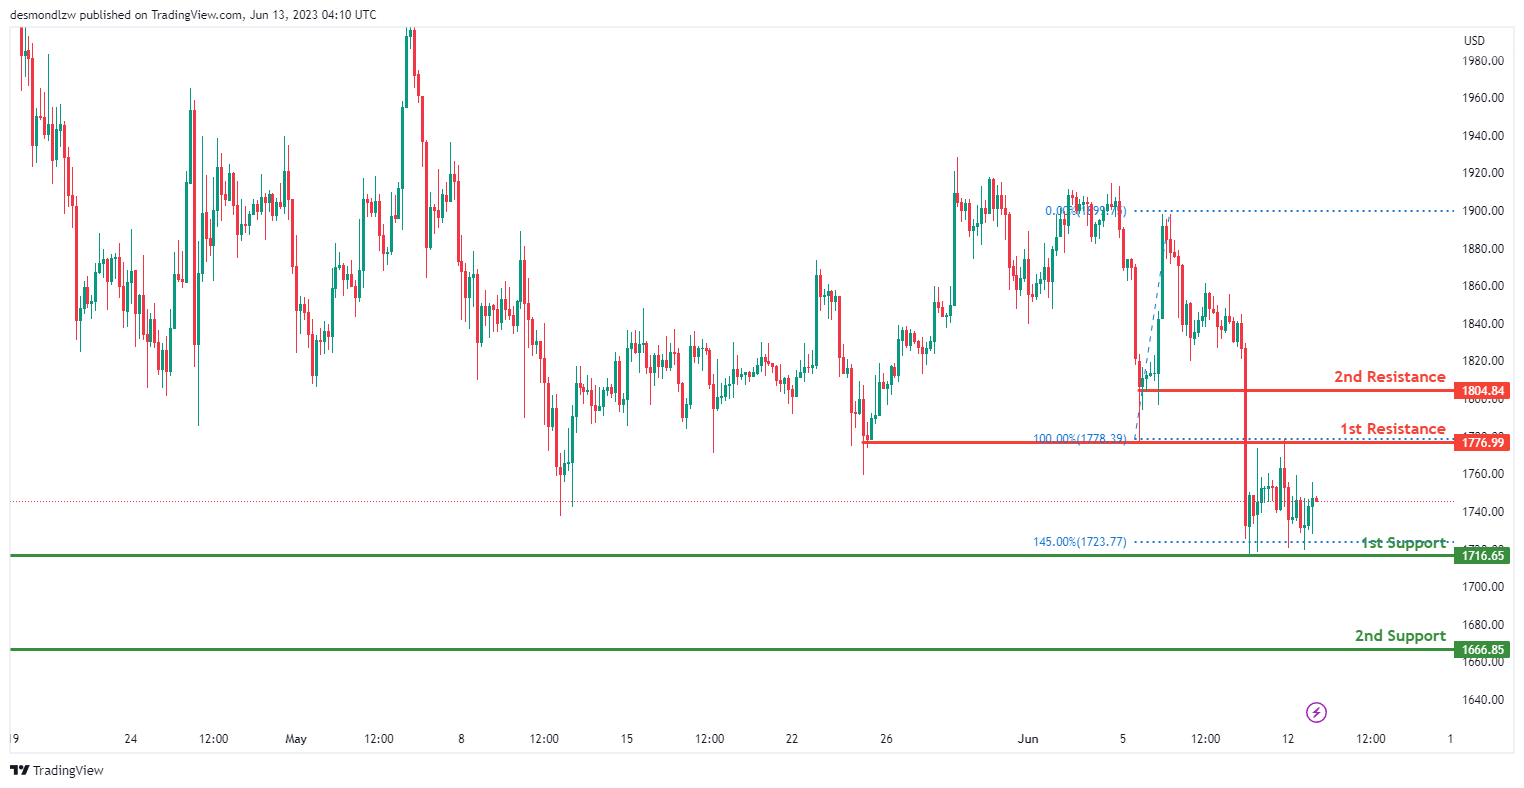
The ETH/USD chart is currently exhibiting a neutral momentum, indicating a lack of strong directional bias in price movement.
There is a potential for price to fluctuate between the first resistance level at 1776.99 and the first support level at 1716.65. These levels are significant as they represent areas of overlap resistance and support, respectively. Additionally, the first support level aligns with the 145.00% Fibonacci extension, which adds further significance to this level.
Furthermore, the second support level at 1666.85 serves as an additional area of overlap support, potentially providing a barrier for further downward movement.
WTI/USD:
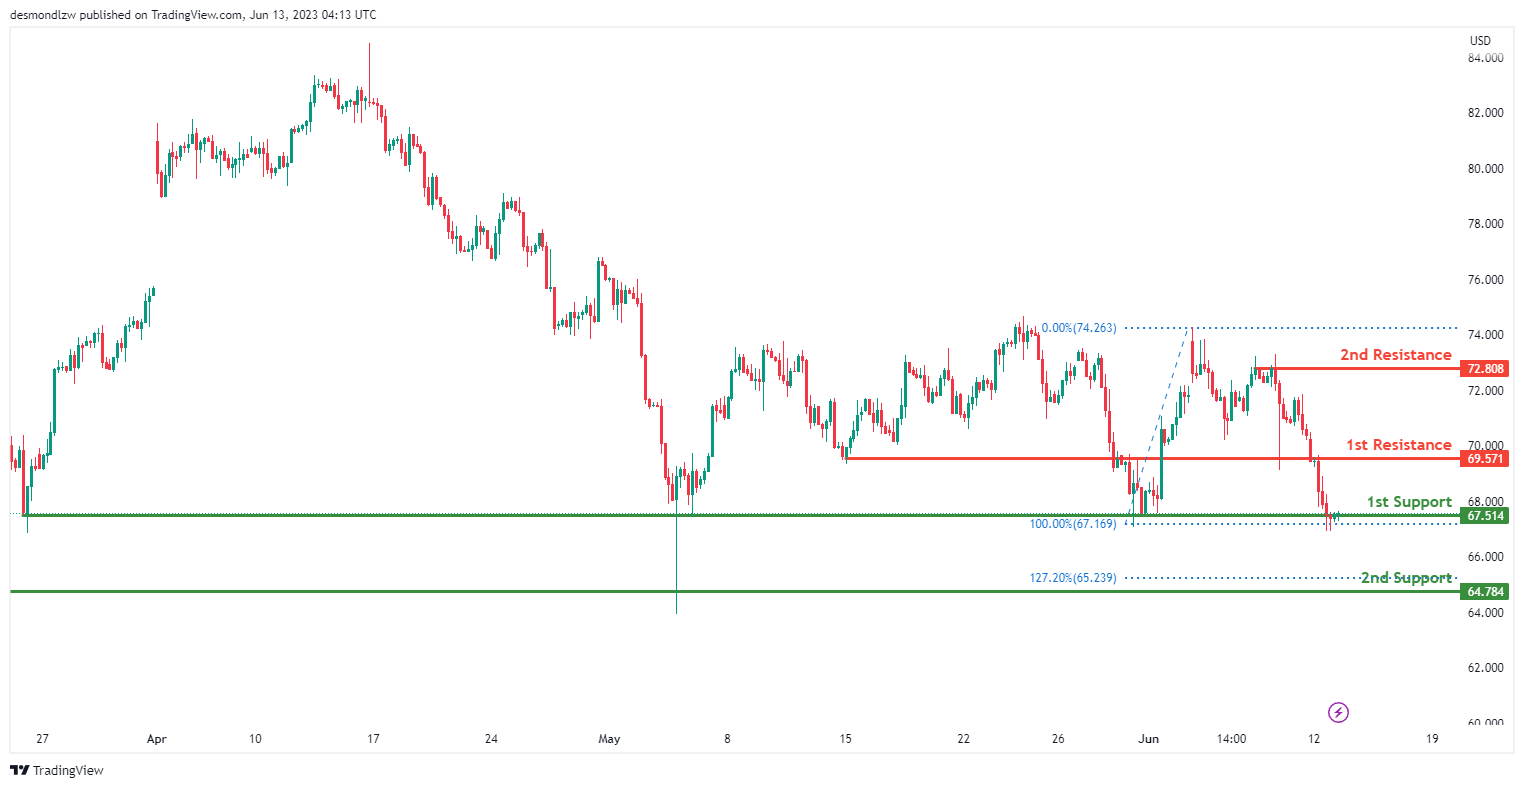
The WTI chart currently shows a bearish momentum, indicating a downward bias in price movement.
There is a potential for the price to make a bearish break below the first support level at 67.51 and drop towards the second support level at 64.78. These support levels are significant as they represent areas of overlap support. Additionally, the second support level aligns with the 127.20% Fibonacci projection, adding further significance to this level.
On the upside, the first resistance level at 69.57 acts as an area of overlap resistance, potentially causing the price to face selling pressure.
Furthermore, the second resistance level at 72.81 serves as an additional area of overlap resistance, potentially acting as a barrier for further upward movement.
XAU/USD (GOLD):
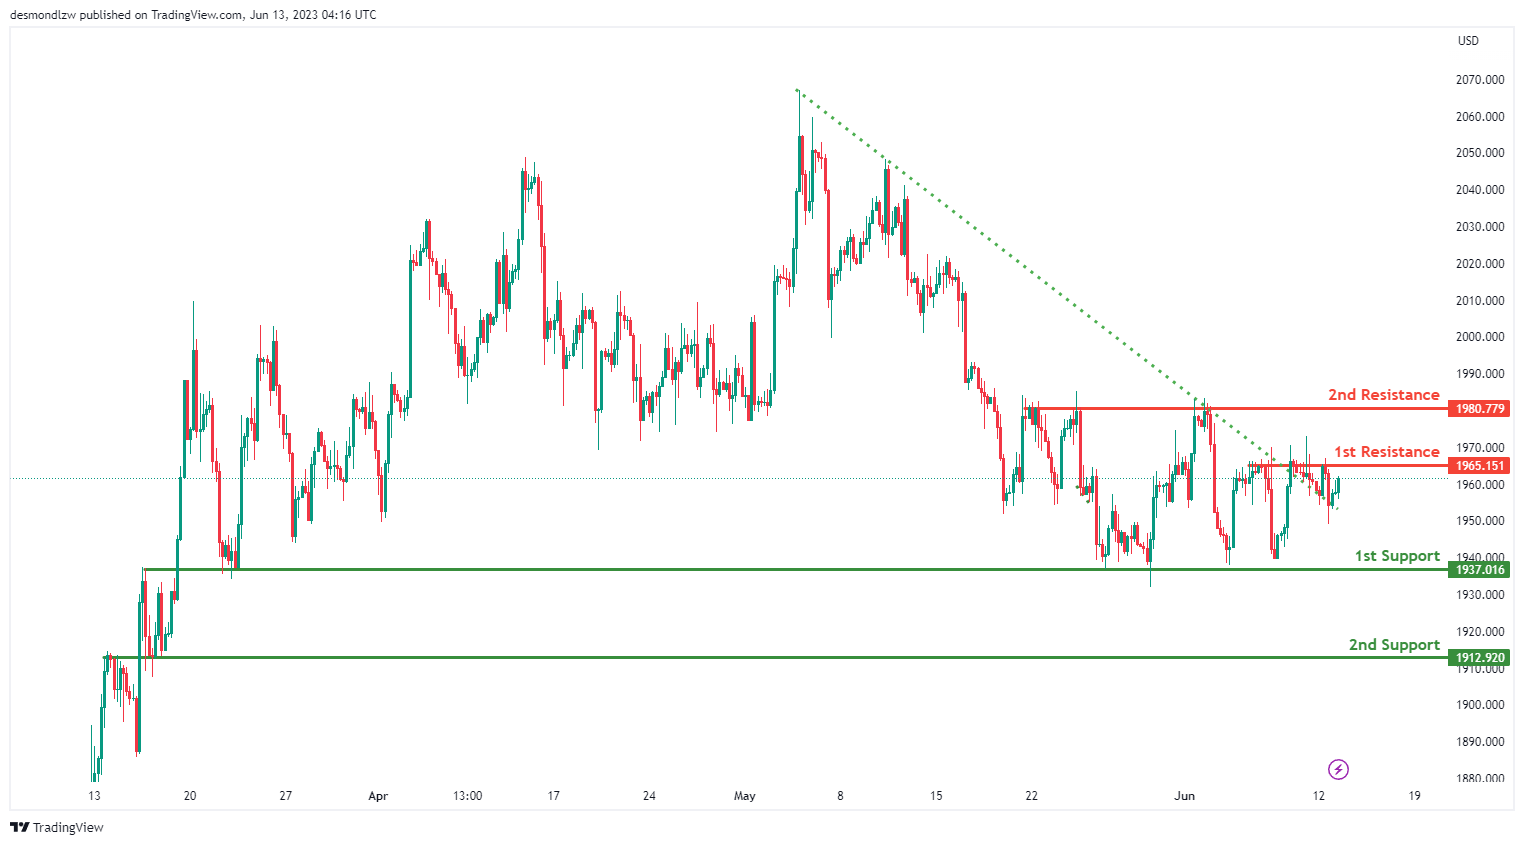
The XAU/USD chart currently exhibits a weak bullish momentum with low confidence, suggesting a cautious outlook for price movement.
There is a potential for a bullish continuation towards the first resistance level at 1965.15. This resistance level is significant as it represents an area of overlap resistance.
On the downside, the first support level at 1937.02 acts as a notable area of support, providing potential buying pressure. Additionally, the second support level at 1912.92 is another area of overlap support, reinforcing its importance as a potential level for price to find support.
It’s important to note that the overall momentum is weak, indicating a lack of strong conviction in the upward movement. Therefore, traders should exercise caution and closely monitor price action for any signs of a sustained bullish trend.
EUR/USD Daily Outlook
Daily Pivots: (S1) 1.0731; (P) 1.0760; (R1) 1.0788; More...
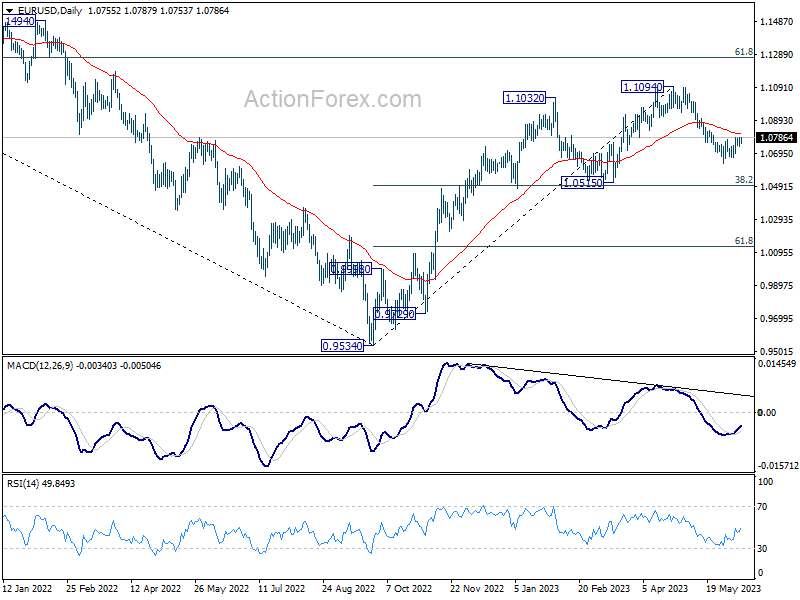
EUR/USD's rebound from 1.0634 short term bottom is still in progress and intraday bias stays on the upside at this point. Sustained trading above 55 EMA (now at 1.0810) will pave the way back to retest 1.1094 high. Nevertheless, break of 1.0732 minor support should resume the fall from 1.1094 through 1.0634 support.
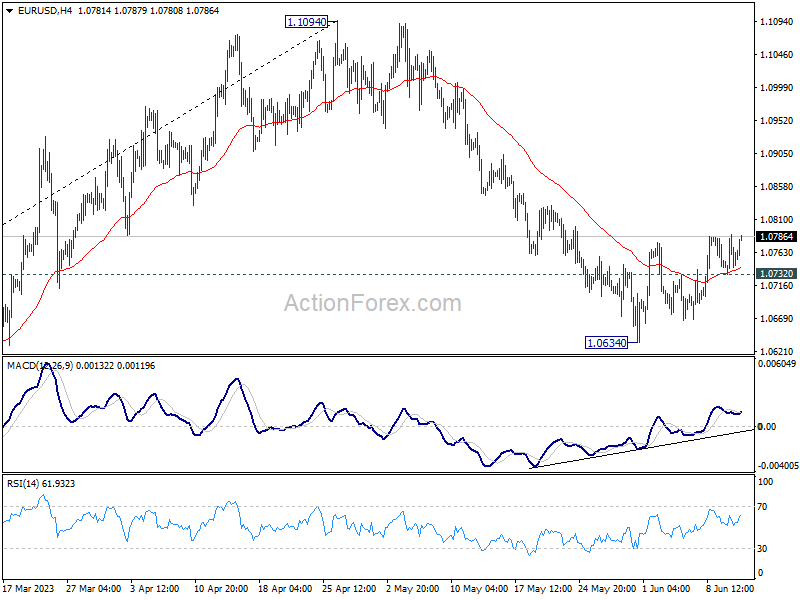
In the bigger picture, as long as 1.0515 support holds, rise from 0.9534 (2022 low) would still extend higher. Sustained break of 61.8% retracement of 1.2348 (2021 high) to 0.9534 at 1.1273 will solidify the case of bullish trend reversal and target 1.2348 resistance next (2021 high).
Risk-On Sentiment Dominates, Euro Jumps as EUR/CHF Takes Off
Financial markets are generally leaning towards a risk-on posture, with significant rise in Asia's Nikkei, following a solid close in the US overnight. However, this momentum will face a series of tests from significant events on the horizon, including today's US CPI data, tomorrow's much-anticipated FOMC rate decision, and ECB's rate decision due on Thursday. Market sentiment will require substantial resilience to weather these potentially market-shifting events.
For the time being, Euro is leading the pack, benefitting from a reversal against both Sterling and Swiss Franc. Meanwhile, the Pound is under pressure and will be seeking some support from today's employment figures and tomorrow's GDP data. Australian Dollar is hot on Euro's heels, with Dollar trailing closely behind. Conversely, Swiss Franc and Sterling are the worse performer. Yen is mixed for now, awaiting guidance from BoJ and bond market developments.
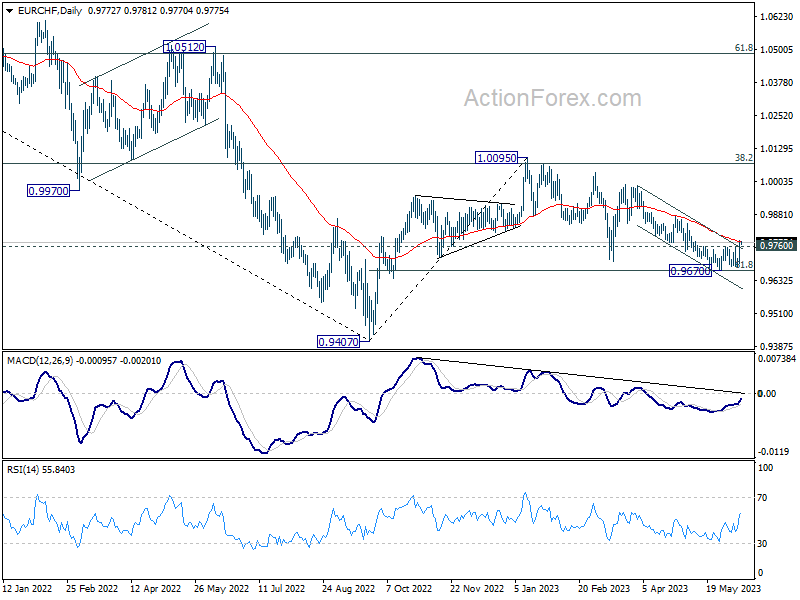
Technically, EUR/CHF's break of 0.9760 resistance suggests short term bottoming at 0.9670, after hitting 61.8% retracement of 0.9407 to 1.0095 at 0.9670. Sustained trading above 55 D EMA (now at 0.9779) will affirm the case that whole correction from 1.0095 has completed too. Stronger rally would then be seen to 0.9878 resistance next. If realized, the strength in EUR/CHF could help lift Euro against Dollar, Yen and Sterling.
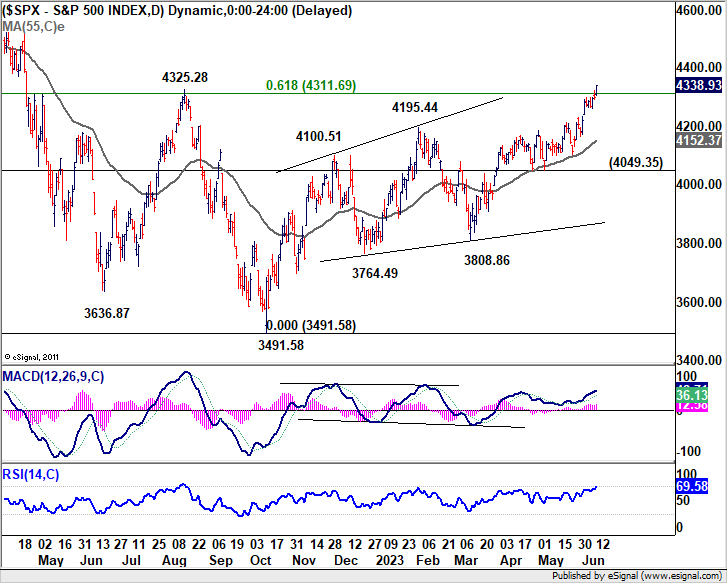
In Asia, at the time of writing, Nikkei is up 1.87%. Hong Kong HSI is up 0.40%. China Shanghai SSE is down -0.06%. Singapore Strait Times is down -0.52%. Japan 10-year JGB yield is down -0.0088 at 0.420. Overnight, DOW rose 0.56%. NASDAQ rose 1.53%. 10-year yield rose 0.020 to 3.765. S&P 500 rose 0.93% and closed above key resistance level at 4325.
Australia Westpac consumer sentiment up 0.2%, dived after RBA hike
Australia Westpac Consumer Sentiment Index rose marginally by 0.2% to 79.2 in June. Nevertheless, the index continues to hover around "recession lows" over the past year, similar to figures recorded during the "deep recessions" of late 1980s/early 1990s.
Significantly, responses gathered within the survey period (June 5-9) reflected the considerable impact of RBA's unexpected rate hike on June 6. Confidence had seen a substantial surge from 79.0 in May to 89.0 prior to the rate hike announcement. However, it experienced a sharp decline post-announcement, plummeting to a severely low level of 72.6.
Westpac pointed out that inflation continues to be the "dominant drag" on consumer confidence, overshadowing even the effects of higher interest rate Nevertheless,confidence in labor market turned as one consistent positive.
In light of the upcoming RBA meeting on July 4, Westpac forecasts another 25 basis point rate hike, taking the rate to 4.35%. It noted, "Given that little further information will be available on expectations and unit labour costs in the near term it seems logical that delaying the tightening for another month, to assess more data, seems unnecessary".
Australia NAB business confidence fell to -4, conditions down to -8
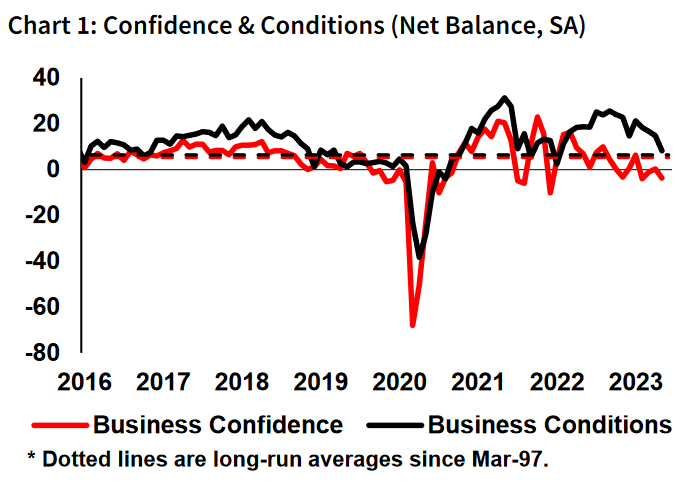
Australia's NAB Business Confidence Index reported a decline in May, dropping from 0 to -4. Furthermore, Business Conditions witnessed a significant drop from 15 to 8. Looking at some details, trading conditions fell from 22 to 14, profitability conditions went down from 12 to 7, and employment conditions also experienced a drop, going from 11 to 4.
"Business conditions recorded a solid decline in May, and it appears the gradual easing we have seen through early 2023 appears to be strengthening," said NAB Chief Economist Alan Oster. "That said, conditions remain above average reflecting just how strong the economy was through 2022."
Oster highlighted that "all three sub-components eased in the month, suggesting that demand growth is now moderating, and trading conditions, profitability and employment are beginning to reflect this."
Business confidence fell back into the negative zone, oscillating within the 0 to -4 index point range in recent months. "Our bigger worry is the sharp decline in forward orders in the month," Oster noted.
Meanwhile, price measures inched upwards again, yet they remain notably below their mid-2022 peaks. "The trend over the coming months will be important as the RBA tries to assess whether it has done enough and if underlying inflation pressures are easing in a timely way," Oster noted.
China cuts key short-term policy rate, Yuan depreciation continues
China's central bank PBOC cut a key short-term policy rate, the seven-day reverse repurchase rate, by -10bps from 2% to 1.9%. The policy change is anticipated to infuse an additional CNY 2B of liquidity into the economy through its seven-day repos.
This marks the first move in the past 10 months, dating back to last August. It follows hot on the heels of the country's major banks slashing deposit rates last week, which included a decrease in interest rate for five-year time deposits from 2.65% to 2.5%.
The timing of this decision is particularly notable, as it precedes PBoC's medium-lending facility interest rate announcement, which is set to be unveiled this Thursday. Moreover, the bank's loan prime rate is scheduled for release on June 20.
Adding to this week's financial developments, China is expected to publish its May credit lending data along with several key activity indicators such as retail sales and industrial production.
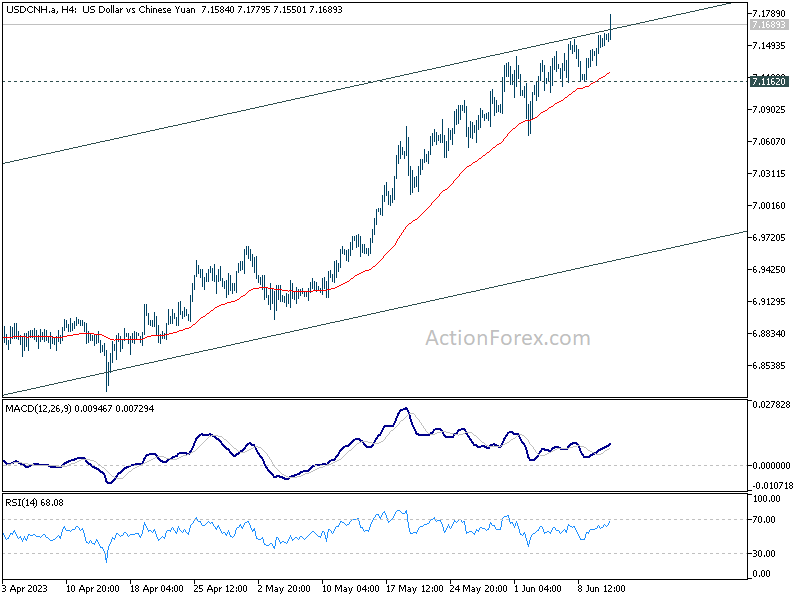
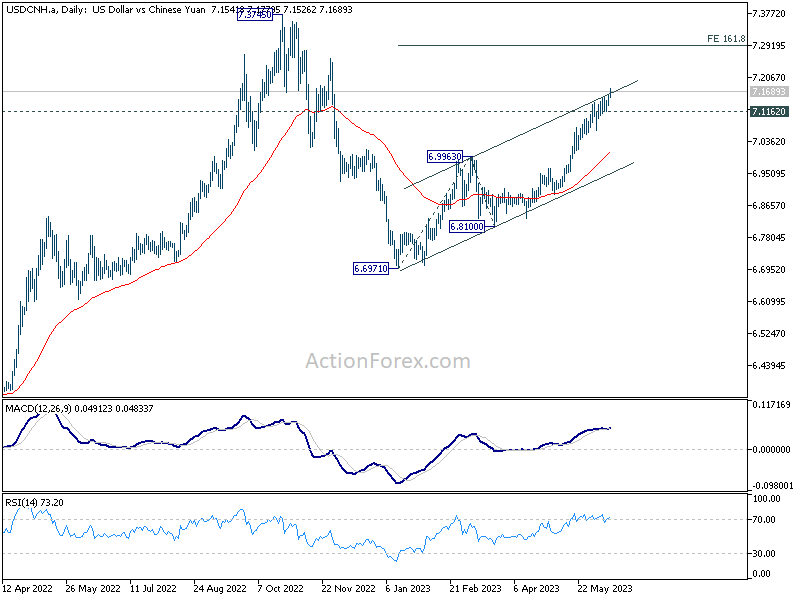
USD/CNH extends recent up trend further to as high as 7.177 after the release, as Yuan's depreciation continues. From a pure technical perspective, the break of medium term channel resistance is taken as a sign of upside acceleration. Near term outlook will stay bullish as long as 7.1162 support holds. Next target is 161.8% projection of 6.6971 to 6.9963 from 6.8100 at 7.2941. For now, there is no hints that the authority would allow Yuan falls through 7.3 handle, which is close to prior trough at 7.3745.
Looking ahead
UK Employment, Germany CPI final and ZEW economic sentiment will be released in European session. US CPI will be the main feature later in the day.
EUR/USD Daily Outlook
Daily Pivots: (S1) 1.0731; (P) 1.0760; (R1) 1.0788; More...
EUR/USD's rebound from 1.0634 short term bottom is still in progress and intraday bias stays on the upside at this point. Sustained trading above 55 EMA (now at 1.0810) will pave the way back to retest 1.1094 high. Nevertheless, break of 1.0732 minor support should resume the fall from 1.1094 through 1.0634 support.
In the bigger picture, as long as 1.0515 support holds, rise from 0.9534 (2022 low) would still extend higher. Sustained break of 61.8% retracement of 1.2348 (2021 high) to 0.9534 at 1.1273 will solidify the case of bullish trend reversal and target 1.2348 resistance next (2021 high).
Economic Indicators Update
| GMT | Ccy | Events | Actual | Forecast | Previous | Revised |
|---|---|---|---|---|---|---|
| 23:50 | JPY | BSI Large Manufacturing Index Q2 | -0.4 | -10.5 | ||
| 00:30 | AUD | Westpac Consumer Confidence Jun | 0.20% | -7.90% | ||
| 01:30 | AUD | NAB Business Conditions May | 8 | 14 | ||
| 01:30 | AUD | NAB Business Confidence May | -4 | 0 | ||
| 06:00 | GBP | Claimant Count Change May | 21.4K | 46.7K | ||
| 06:00 | GBP | ILO Unemployment Rate (3M) Apr | 4.00% | 3.90% | ||
| 06:00 | GBP | Average Earnings Excluding Bonus 3M/Y Apr | 6.90% | 6.70% | ||
| 06:00 | GBP | Average Earnings Including Bonus 3M/Y Apr | 6.10% | 5.80% | ||
| 06:00 | EUR | Germany CPI M/M May F | -0.10% | -0.10% | ||
| 06:00 | EUR | Germany CPI Y/Y May F | 6.10% | 6.10% | ||
| 09:00 | EUR | Germany ZEW Economic Sentiment Jun | -14.7 | -10.7 | ||
| 09:00 | EUR | Germany ZEW Current Situation Jun | -40 | -34.8 | ||
| 09:00 | EUR | Eurozone ZEW Economic Sentiment Jun | -13.1 | -9.4 | ||
| 10:00 | USD | NFIB Business Optimism Index May | 88.8 | 89 | ||
| 12:30 | USD | CPI M/M May | 0.30% | 0.40% | ||
| 12:30 | USD | CPI Y/Y May | 4.20% | 4.90% | ||
| 12:30 | USD | CPI Core M/M May | 0.40% | 0.40% | ||
| 12:30 | USD | CPI Core Y/Y May | 5.30% | 5.50% |
China cuts key short-term policy rate, Yuan depreciation continues
China's central bank PBOC cut a key short-term policy rate, the seven-day reverse repurchase rate, by -10bps from 2% to 1.9%. The policy change is anticipated to infuse an additional CNY 2B of liquidity into the economy through its seven-day repos.
This marks the first move in the past 10 months, dating back to last August. It follows hot on the heels of the country's major banks slashing deposit rates last week, which included a decrease in interest rate for five-year time deposits from 2.65% to 2.5%.
The timing of this decision is particularly notable, as it precedes PBoC's medium-lending facility interest rate announcement, which is set to be unveiled this Thursday. Moreover, the bank's loan prime rate is scheduled for release on June 20.
Adding to this week's financial developments, China is expected to publish its May credit lending data along with several key activity indicators such as retail sales and industrial production.
USD/CNH extends recent up trend further to as high as 7.177 after the release, as Yuan's depreciation continues. From a pure technical perspective, the break of medium term channel resistance is taken as a sign of upside acceleration. Near term outlook will stay bullish as long as 7.1162 support holds. Next target is 161.8% projection of 6.6971 to 6.9963 from 6.8100 at 7.2941. For now, there is no hints that the authority would allow Yuan falls through 7.3 handle, which is close to prior trough at 7.3745.
Australia NAB business confidence fell to -4, conditions down to -8
Australia's NAB Business Confidence Index reported a decline in May, dropping from 0 to -4. Furthermore, Business Conditions witnessed a significant drop from 15 to 8. Looking at some details, trading conditions fell from 22 to 14, profitability conditions went down from 12 to 7, and employment conditions also experienced a drop, going from 11 to 4.
"Business conditions recorded a solid decline in May, and it appears the gradual easing we have seen through early 2023 appears to be strengthening," said NAB Chief Economist Alan Oster. "That said, conditions remain above average reflecting just how strong the economy was through 2022."
Oster highlighted that "all three sub-components eased in the month, suggesting that demand growth is now moderating, and trading conditions, profitability and employment are beginning to reflect this."
Business confidence fell back into the negative zone, oscillating within the 0 to -4 index point range in recent months. "Our bigger worry is the sharp decline in forward orders in the month," Oster noted.
Meanwhile, price measures inched upwards again, yet they remain notably below their mid-2022 peaks. "The trend over the coming months will be important as the RBA tries to assess whether it has done enough and if underlying inflation pressures are easing in a timely way," Oster noted.
Australia Westpac consumer sentiment up 0.2%, dived after RBA hike
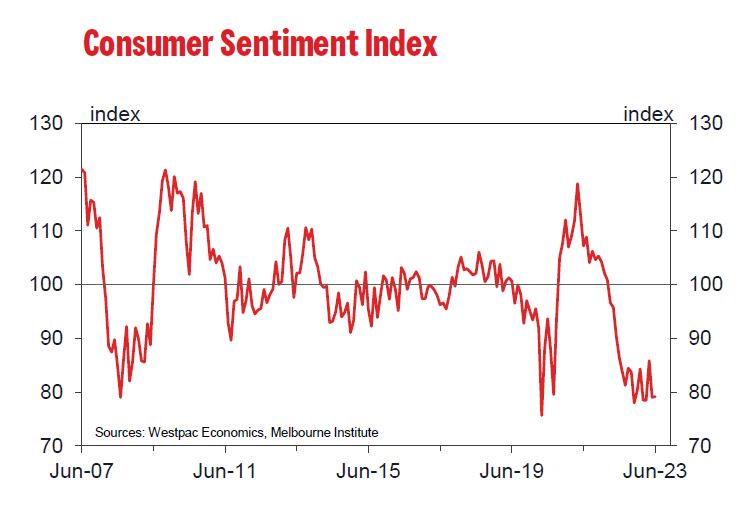
Australia Westpac Consumer Sentiment Index rose marginally by 0.2% to 79.2 in June. Nevertheless, the index continues to hover around "recession lows" over the past year, similar to figures recorded during the "deep recessions" of late 1980s/early 1990s.
Significantly, responses gathered within the survey period (June 5-9) reflected the considerable impact of RBA's unexpected rate hike on June 6. Confidence had seen a substantial surge from 79.0 in May to 89.0 prior to the rate hike announcement. However, it experienced a sharp decline post-announcement, plummeting to a severely low level of 72.6.
Westpac pointed out that inflation continues to be the "dominant drag" on consumer confidence, overshadowing even the effects of higher interest rate Nevertheless,confidence in labor market turned as one consistent positive.
In light of the upcoming RBA meeting on July 4, Westpac forecasts another 25 basis point rate hike, taking the rate to 4.35%. It noted, "Given that little further information will be available on expectations and unit labour costs in the near term it seems logical that delaying the tightening for another month, to assess more data, seems unnecessary".
GBP/USD Starts Correction, US CPI Report Next
Key Highlights
- GBP/USD started a downside correction from the 1.2600 zone.
- It traded below a key bullish trend line with support near 1.2550 on the 4-hour chart.
- EUR/USD is still holding the 1.0710 support zone.
- The US Consumer Price Index could decline from 4.9% to 4.1% in May 2023 (YoY).
GBP/USD Technical Analysis
The British Pound gained pace for a move above 1.2500 against the US Dollar. GBP/USD even broke the 1.2550 resistance before the bears appeared.
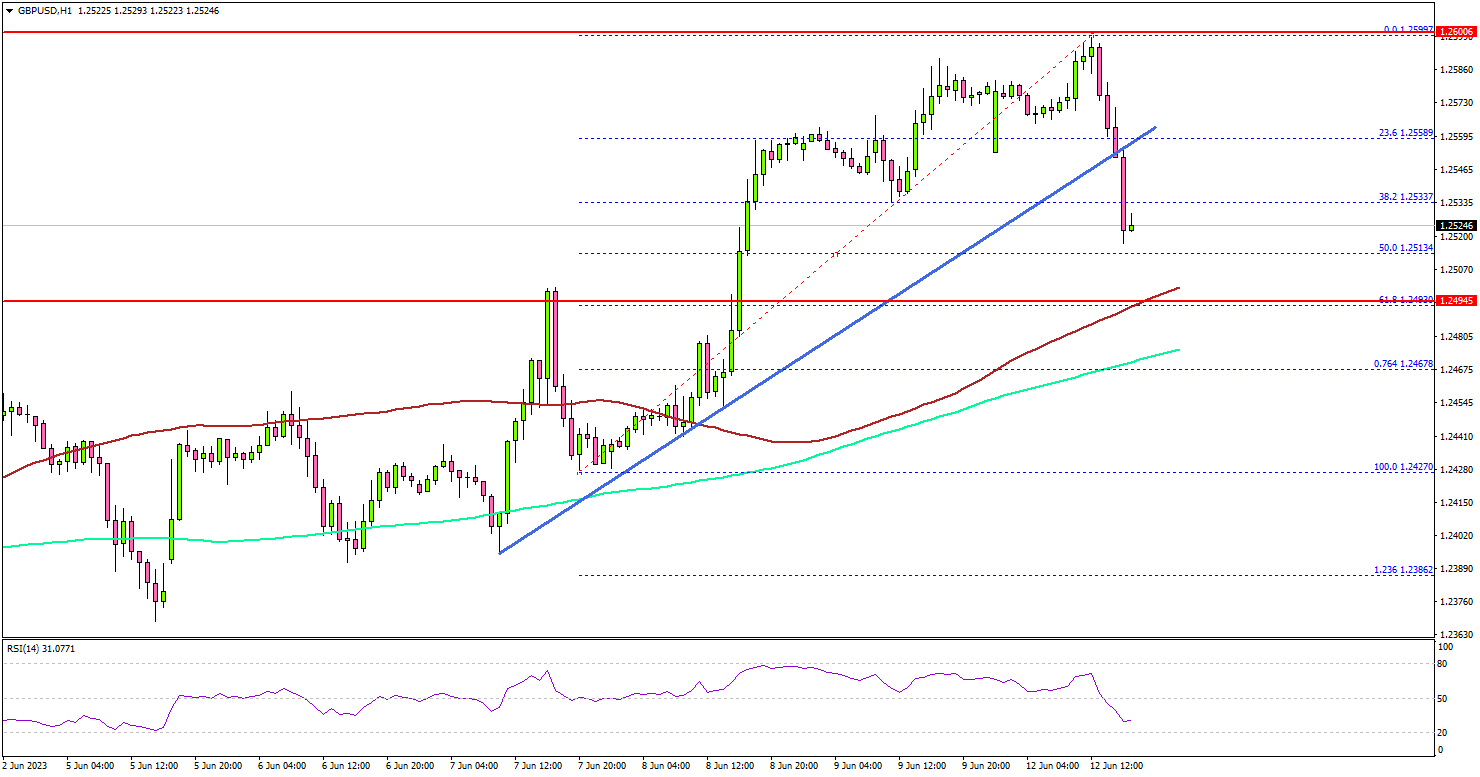
Looking at the 4-hour chart, the pair tested the 1.2600 zone. It recently started a downside correction below the 1.2550 level. The pair traded below a key bullish trend line with support near 1.2550.
It even traded below the 38.2% Fib retracement level of the upward move from the 1.2427 swing low to the 1.2599 high. Immediate support is near the 1.2500 level and the 100 simple moving average (red, 4 hours).
The 61.8% Fib retracement level of the upward move from the 1.2427 swing low to the 1.2599 high is also near 1.2500. The next major support is near the 1.2460 level and the 200 simple moving average (green, 4 hours).
If there is a downside break below the 1.2460 support, the pair could decline toward the 1.2400 support. Any more losses might send EUR/USD toward 1.2320.
If there is a fresh increase, the pair could face resistance near 1.2550. The first major resistance is near the 1.2600 level. If there is a move above the 1.2600 resistance, the pair could drift toward 1.2740.
Looking at EUR/USD, the pair is attempting a recovery wave but the pair could face resistance near the 1.0850 zone.
Economic Releases
- UK Claimant Count Change for May 2023 – Forecast -9.6K, versus 46.7K previous.
- UK ILO Unemployment Rate for April 2023 (3M) – Forecast 4.0%, versus 3.9% previous.
- US Consumer Price Index for May 2023 (MoM) – Forecast +0.2%, versus +0.4% previous.
- US Consumer Price Index for May 2023 (YoY) – Forecast +4.1%, versus +4.9% previous.
- US Consumer Price Index Ex Food & Energy for May 2023 (YoY) – Forecast +5.3%, versus +5.5% previous.