

Sample Category Title
BoJ Ueda: No time frame to achieve inflation target, but not so long as 10 years
In a parliamentary address today, BoJ Governor Kazuo Ueda said "The time it takes for the impact of monetary policy to appear on the economy could move around a lot depending on circumstances."
"We therefore do not have any time frame in mind" in achieving the inflation target, he added.
"Having said that, our baseline view is that it won't take so long as over 10 years. We'll still seek to hit the target at the earliest date possible," he remarked.
Ueda reiterated that the Bank of Japan's purchases of Real Estate Investment Trusts (REITs) form part of their expansive monetary easing strategy. He noted, "We are conducting the purchases (of REITs) as part of our massive monetary easing program. Given it will take more time to achieve our price target, we will maintain the easy policy."
Fed Harker: We are clearly in restrictive, we can sit there for a while
Philadelphia Fed President Patrick Harker recommended a pause in interest rate hikes at the upcoming FOMC meeting, stating. "It's time to at least hit the stop button for one meeting and see how it goes," he said yesterday.
Harker also noted, "I think we are at the point, or very close to the point now, where we are clearly in restrictive territory, and we can sit there for a while," he explained. "We don't have to keep moving rates up, and then have to reverse course quickly."
Looking ahead, Harker expects the US economy to grow less than 1% this year, and anticipates unemployment rate, currently at 3.4%, to increase to around 4.4%. Additionally, he forecasts a decrease in inflation to 3.5% this year and 2.5% next year, predicting it to reach Fed's 2% target only by 2025.
Cliff Notes: Inflation Risks Linger
Key insights from the week that was.
The ABS Monthly CPI Indicator surprised to the upside in April, a solid 0.5% lift raising the annual rate of inflation from 6.3% to 6.8%, well above the consensus estimate for a slight up-tick to 6.4%. Although dwelling prices and rents came in stronger than expected, this was largely offset by a fall in electricity prices, leaving total housing costs up only 0.3% in the month. In our view, the most significant driver for headline inflation was a 7.2% rise in holiday travel/accommodation costs. Highlighting the breadth of the pulse, the annual trimmed mean measure – which was reinstated in April– showed underlying inflation lifting from 6.5% to 6.7%.
The April CPI update poses upside risk to our current Q2 CPI forecast of 1.1% and highlights the need to continue carefully assessing inflation risks.
In the lead-up to next week’s Q1 GDP report, the ABS also released two partial indicators for investment.
Construction work done rose by a solid 1.8% in the three months to March, centred on the continued uptrend in infrastructure investment, public infrastructure up a sizeable 18%yr and private infrastructure 12%yr. Private building experienced mixed fortunes however, with new dwelling construction down 2.6% but renovation work up 2.7%.
The Q1 CAPEX survey subsequently delivered an upside surprise. In the detail for current activity, equipment spending posted a notable 3.7% gain, with strength most apparent in mining. On spending intentions, the second estimate for 2023/24 CAPEX plans remained constructive, up 5.0% compared to the second estimate a year ago. In our view, this implies a 5.9% rise in CAPEX spending over the financial year. While positive for now, we anticipate the investment outlook will soften, with later estimates likely to see firms mark down their plans.
Despite the solid reads on construction work and equipment spending, we have revised down our forecast for Q1 GDP from 0.4% to 0.2%, reflecting a softer read on consumption and a materially weaker contribution from net exports.
Before moving offshore, a quick note on housing. The recent stabilisation in Australia’s housing market continues to reverberate through CoreLogic’s home price (PDF 179KB) data, as evinced by the 1.4% gain in May across the nation’s capital cities, leaving prices up 3% over the last three months alone. Reflective of this progress, private credit growth (PDF 127KB) within housing-related lending segments is also stabilising at a subdued level, tracking a three-month annualised pace of 4%. While developments around the established market were mostly positive, an 8.1% decline in dwelling approvals highlights the hit to new construction from interest rates and construction costs. For a comprehensive update on the sector, see the Westpac Housing Pulse.
Offshore, China’s NBS manufacturing PMI remained in contractionary territory for a second consecutive month in May at 48.8 as the initial wave of re-opening faded. The non-manufacturing PMI also fell, but at 54.5 remained materially above 50, signalling continued expansion.
Lower demand from developed economies and anxiety over the outlook likely contributed to the deceleration, with the new export orders detail for manufacturing weaker than total new orders. For services, despite a material decline in new orders, the employment index held steady. This speaks to confidence in the medium-term outlook amongst the service sector. A historic comparison highlights why: over the 5 years before the pandemic, the non-manufacturing PMI averaged 54.1, 0.4pts below May; during the period, annual GDP averaged 6.7%.
Input and output prices also saw a substantial decline in the month across the economy. The producer price index has been declining on a year ago basis since October 2021 despite the input prices metric in the PMI growing for much of that time. Depressed input prices are flowing through to output prices, contributing to the palsy CPI prints seen since the start of the year – the CPI up just 0.1%yr in April.
Clearly then, the inflation concern of the developed world is not an issue for China. This provides scope for authorities to offer additional support if/ when they feel there is need. We expect data to remain volatile over coming months, but to orbit a strengthening trend. Policy support should only prove necessary at the margin.
Over in the US, the ISM manufacturing PMI ticked down to 46.9 points in May from 47.0 in April. The biggest change was seen in the ‘prices paid’ detail which plunged below 50 to 44.2. Assessed together with the Chinese data, this outcome suggests falling commodity prices and slower demand are resetting price growth globally. New orders and the order backlog also declined, signalling ongoing contraction in coming months. That said, manufacturers look as though they intend to hold onto staff, with the employment index holding above 50.
The desire to hold onto staff is being seen more broadly across the economy. Earlier in the week, the JOLTS survey reported 10,103k job openings in April, up from 9,745k in March, breaking the downtrend present since December 2022. The series tends to be highly volatile, so this result should not be taken as a sign of renewed labour market tightness but rather resilience. Supporting this view, the hiring rate remained stable in April, corroborating reports from the Fed’s beige book that businesses seem less keen on expanding their labour force, with many reporting they are ‘pausing hiring or reducing headcount’. Employees are also clearly of the view that it is better to remain in a known role than chance a new opportunity, the quit and separation rates continuing their downward trend.
Considering economic activity, the Fed’s Beige book also confirmed a slowdown in demand for transport services which likely fed through to input costs. But the Fed also reported “growth in spending on leisure and hospitality” and for economic activity overall, pointing to GDP growth below trend or stagnation instead of recession.
Finally to policy. FOMC committee member Barkin emphasised in a speech this week that he is looking at the employment and inflation data before determining whether demand-side pressures are abating in supporting the case for a pause at the June meeting. Jefferson and Harker however seemed to have a June pause as their base case ahead of tonight’s nonfarm payrolls release, as we do. Importantly, this week also saw the debt ceiling suspended until 2025, the market’s uncertainty fading as the bill moved through Congress.
The monetary policy outlook for Europe is much more uncertain. The flash CPI reported inflation fell to 6.1%yr in May as services inflation decelerated to 5%yr. But core inflation remains uncomfortably high. Indeed, ECB President Lagarde opined this week that "there is no clear evidence that underlying inflation has peaked" and that there is still "ground to cover to bring interest rates to sufficiently restrictive levels".
USD/JPY Starts Downside Correction, US NFP Next
Key Highlights
- USD/JPY started a downside correction from the 140.93 high.
- It traded below a key bullish trend line with support near 139.60 on the 4-hour chart.
- EUR/USD managed to stay above 1.0620 and corrected higher.
- The US nonfarm payrolls could increase by 190K in May 2023, down from 253K.
USD/JPY Technical Analysis
The US Dollar faced resistance near 140.93 after a massive increase against the US Dollar. USD/JPY started a downside correction below the 140.50 level.
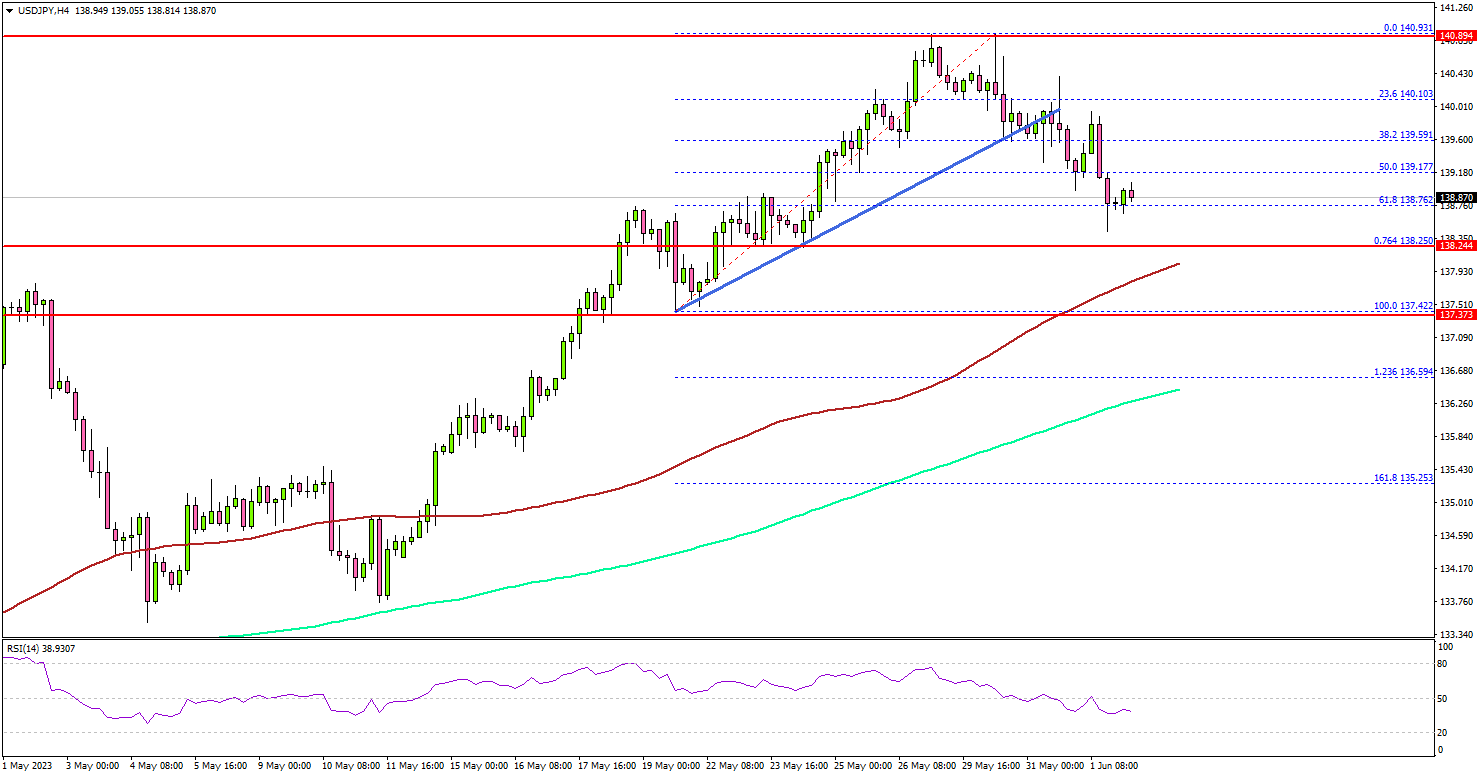
Looking at the 4-hour chart, the pair traded below a key bullish trend line with support near 139.60. There was a sharp move below the 50% Fib retracement level of the upward move from the 137.42 swing low to the 140.93 high.
The pair even spiked below the 138.80 support. Immediate support is near the 138.25 level. It is near the 76.4% Fib retracement level of the upward move from the 137.42 swing low to the 140.93 high.
The next major support is near the 137.90 level or the 100 simple moving average (red, 4 hours). If there is a downside break below the 137.90 support, the pair could decline toward the 200 simple moving average (green, 4 hours).
On the upside, the pair might face resistance near the 139.50 level. The next major resistance is near 140.00, above which the pair could rise toward the 140.80 level.
Looking at EUR/USD, the pair found support near the 1.0620 level and recently started a short-term upside correction.
Economic Releases
- US nonfarm payrolls for May 2023 – Forecast 190K, versus 253K previous.
- US Unemployment Rate for May 2023 - Forecast 3.5%, versus 3.4% previous.
Gold and the Majors ahead of the NFP
Let's dive into the latest developments shaping the global economic landscape. Good news first: the threat of an unprecedented US debt crisis has receded, as US lawmakers passed a bill to raise the debt ceiling and avoid a catastrophic default. Phew! But don't pop the champagne just yet, because storm clouds are still looming. High inflation, rising interest rates, and sluggish growth are challenges that have yet to disappear. Economic growth in the US and China, the world's top two economies, shows signs of stuttering. China's recovery is losing steam, impacting Germany's hopes for an easy exit from its downturn. A slowdown in Europe's largest economy spells trouble for the rest of the region, which narrowly avoided a recession earlier this year. Inflation remains uncomfortably high, prompting central banks to consider further interest rate hikes. These developments have the potential to weigh on consumer spending and business investment. Buckle up, folks, as we navigate these uncertain times and keep a close eye on their impact on forex markets. Stay informed and trade wisely!
US Dollar - Daily Timeframe
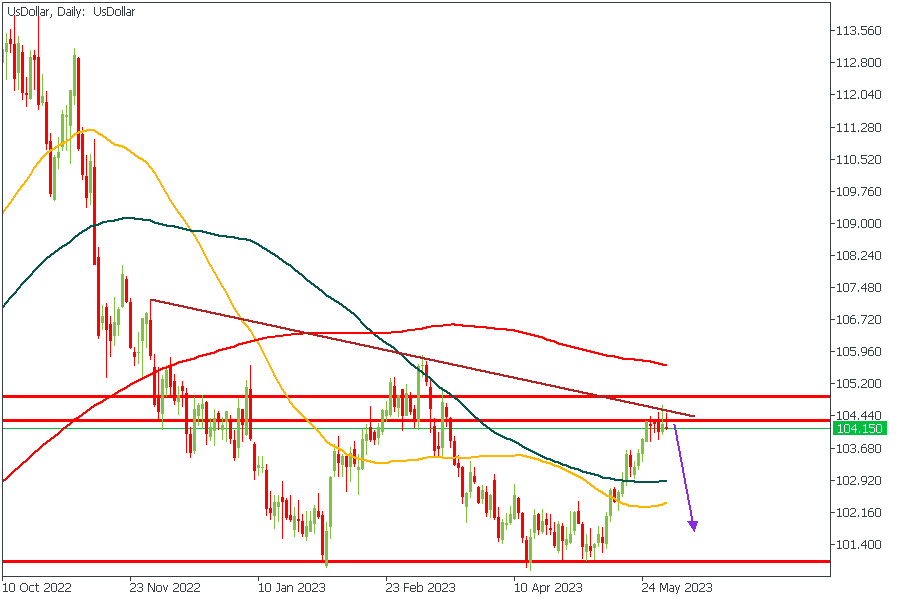
The US Dollar on the daily timeframe has finally given the first signs of rejection from the supply zone, as highlighted above. The additional confluence from the resistance trendline and the descending array of the moving averages seems to lend even more credence to the possibility of a bearish price action on the US Dollar chart.
Analyst’s Expectations:
- Direction: Bearish
- Target: 102.75
- Invalidation: 104.71
XAUUSD - Daily Timeframe
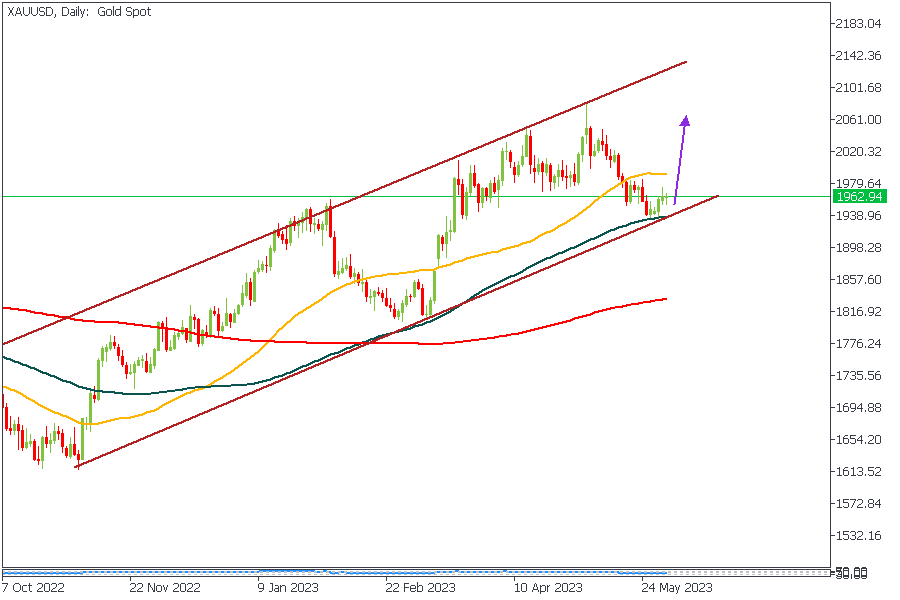
More often than not, Gold tends to correlate inversely to the price of the US Dollar. Based on that fact, we can naturally expect a bullish price action from Gold. Now, let’s combine that with the available confluences we can see from the chart above:
The 100-Day moving average support
The support trendline of the rising channel
The bullish array of the moving averages
Overall, the stars seem readily aligned in favor of bullish price action.
Analyst’s Expectations:
- Direction: Bearish
- Target: 2016.52
- Invalidation: 1949.95
EURUSD - Daily Timeframe
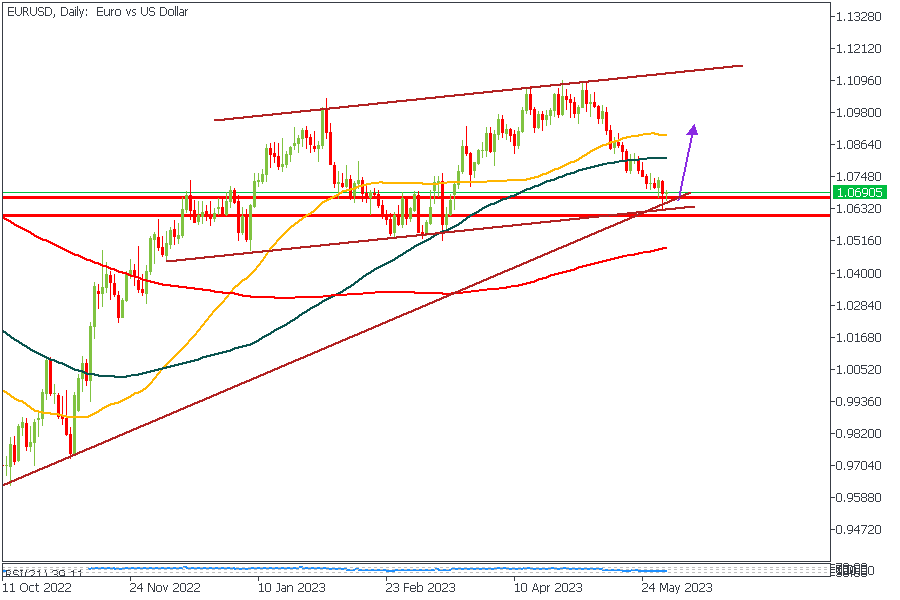
Similar to the case of Gold, bearish price action on the US Dollar usually implies a bullish price action on EURUSD. Considering, however, the confluences based on the support trendline of the rising channel, the pivot zone as highlighted, the support trendline of the wedge pattern, and finally, the bullish array of the moving averages, I believe we should be seeing some bullish price action on EURUSD shortly.
Analyst’s Expectations:
- Direction: Bullish
- Target: 1.08554
- Invalidation: 1.06524
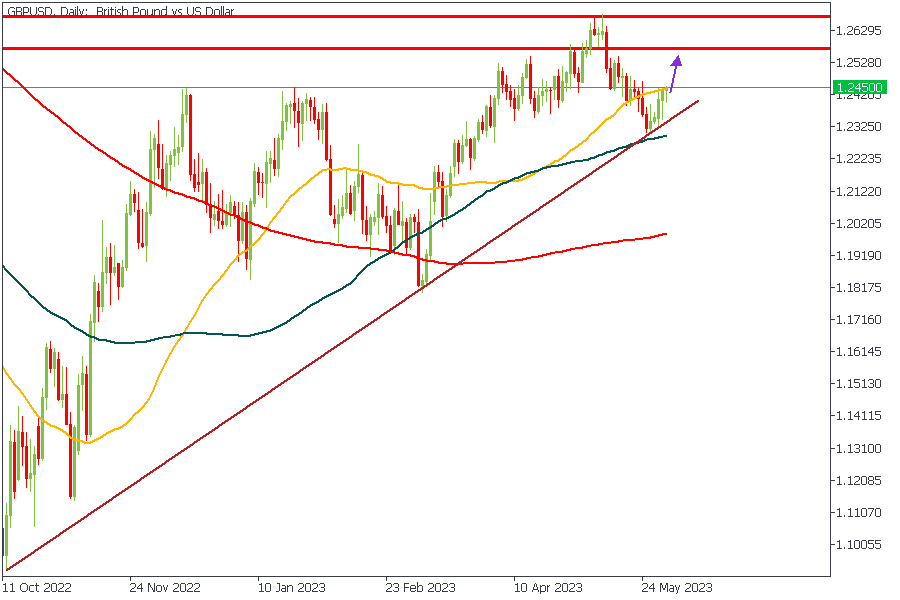
GBPUSD - Daily Timeframe
By now, I’m sure you can already guess my sentiment regarding the direction of GBPUSD. If your guess was ‘bullish,’ you are right! The confluences I have for this sentiment aside from the correlation with the US Dollar price action include; the support trendline, the bullish array of the moving averages, and the rejection from the 100-Day moving average support.
Analyst’s Expectations:
- Direction: Bullish
- Target: 1.25942
- Invalidation: 1.23275
CONCLUSION
The trading of CFDs comes at a risk. Thus, to succeed, you have to manage risks properly. To avoid costly mistakes while you look to trade these opportunities, be sure to do your due diligence and manage your risk appropriately.
Oil Market in the Month of June
Thanks to the incredible advancements in horizontal drilling and fracking technology, the United States has experienced a mind-blowing shale revolution. They've become the heavyweight champion of crude oil production, leaving Saudi Arabia and Russia in the dust. They even turned the tables and became net exporters of refined petroleum products in 2011. Talk about a plot twist! This seismic shift has made the U.S. about 90% self-sufficient in energy consumption, according to the Energy Information Administration. As U.S. oil exports soar, oil imports take a nosedive, which not only helps decrease the trade deficit but also throws the historically strong relationship between oil prices and the U.S. dollar off balance. Buckle up, folks! The oil market is full of surprises. Happy trading!
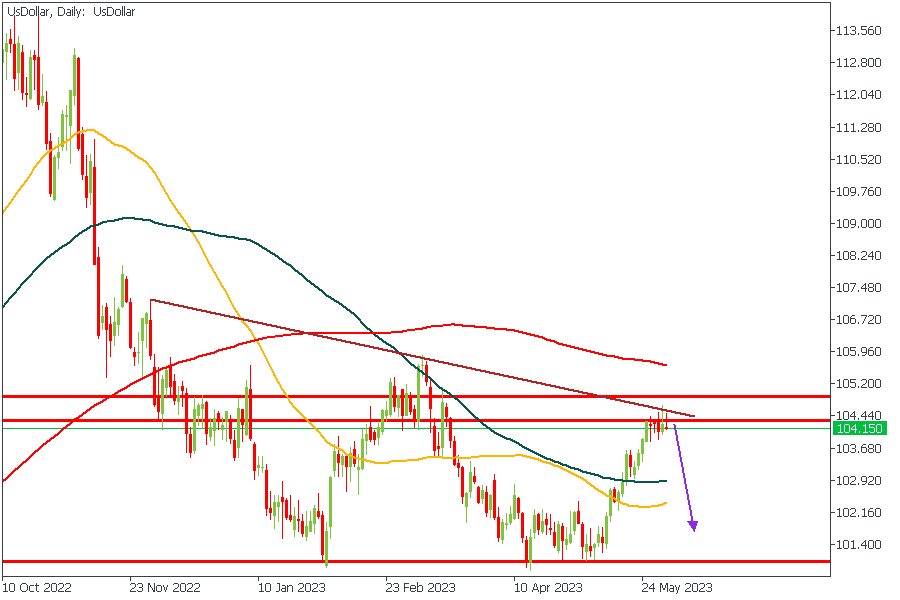
US Dollar - Daily Timeframe
The US Dollar on the daily timeframe has finally given the first signs of a rejection from the supply zone as highlighted above. The additional confluence from the resistance trendline and the descending array of the moving averages seems to lend even more credence to the possibility of a bearish price action on the US Dollar chart.
Analyst’s Expectations:
- Direction: Bearish
- Target: 102.75
- Invalidation: 104.71
XTIUSD - Daily Timeframe
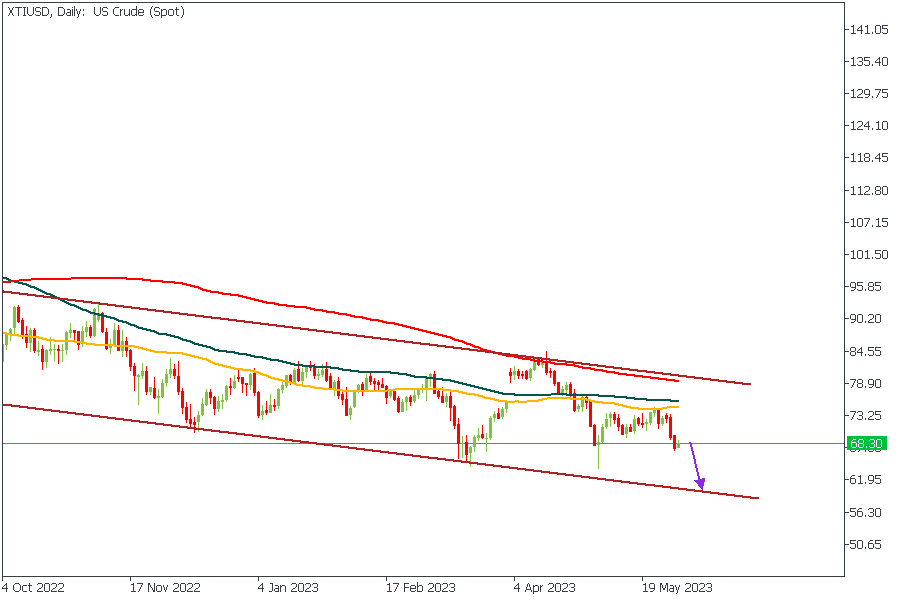
As I earlier explained in the first paragraph, the relationship between the value of the Dollar and the price of Oil has seen some drastic changes in recent times. This indicates the possibility of a positive correlation between both commodities. Based on the price action of US Crude trading within the descending channel, and the bearish array of the moving averages, I believe we should get to see XTIUSD drop even further.
Analyst’s Expectations:
- Direction: Bearish
- Target: 63.28
- Invalidation: 74.49
XBRUSD - Daily Timeframe
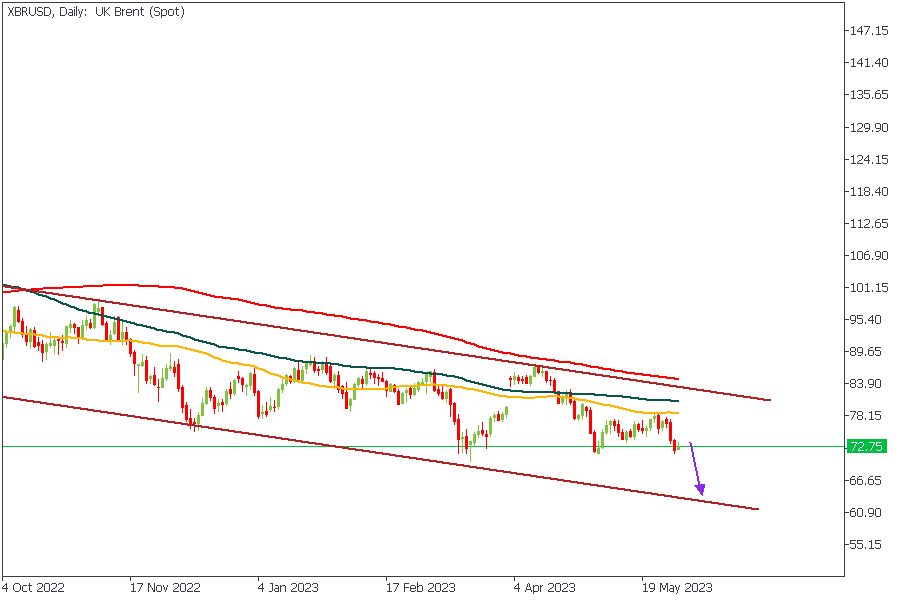
Brent may yet continue on its bearish rally due to the confluence of the descending channel and the bearish moving average array. The latest rejection on XBRUSD also seems to have happened from the 50-Day average. I, therefore, expect to see a continued bearish price action until the trendline support is reached.
Analyst’s Expectations:
- Direction: Bearish
- Target: 66.73
- Invalidation: 78.43
CONCLUSION
The trading of CFDs comes at a risk. Thus, to succeed, you have to manage risks properly. To avoid costly mistakes while you look to trade these opportunities, be sure to do your due diligence and manage your risk appropriately.
USDCAD Wave Analysis
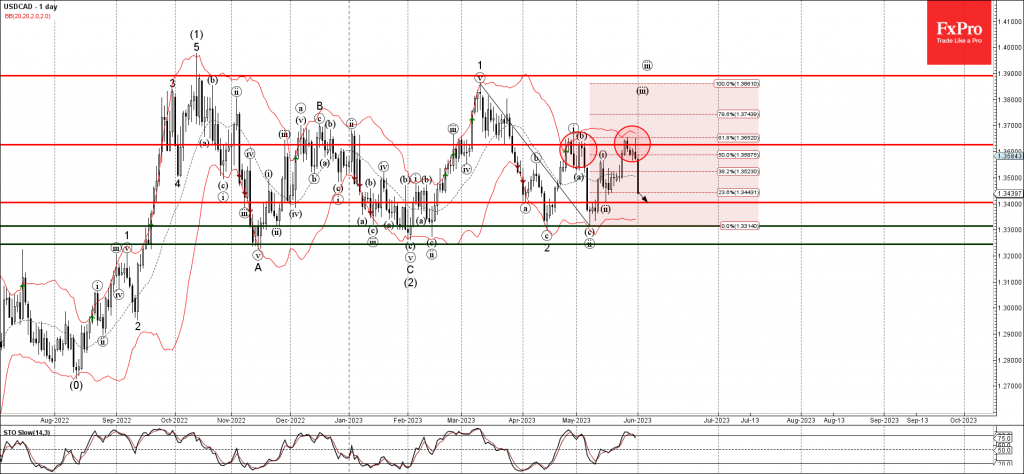
- USDCAD reversed from resistance level 1.3625
- Likely to fall to support level 1.3400
USDCAD currency pair recently reversed down from the key resistance level 1.3625 (which stopped the previous waves (i) and (b)).
The downward reversal from the resistance level 1.3625 stopped the previous impulse waves (iii), 3 and (3).
USDCAD can be expected to fall further toward the next support level 1.3400 (which stopped the previous minor correction (ii) in the middle of May).
AUDCHF Wave Analysis
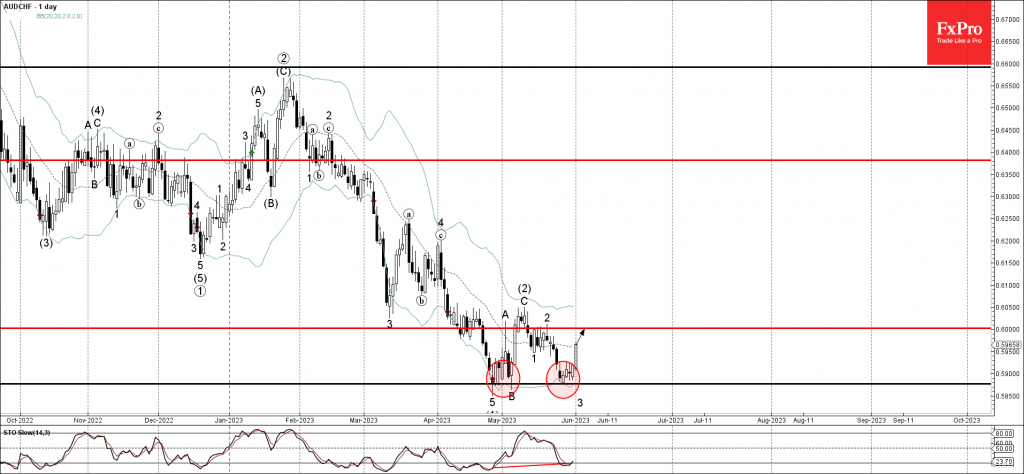
- AUDCHF reversed from key support level 0.5875
- Likely to rise to resistance level 0.6000
AUDCHF currency pair recently reversed up from the key support level 0.5875 (which has been steadily reversing the pair from the end of April).
The support level 0.5875 was strengthened by the lower daily Bollinger Band.
Given the bullish divergence on the daily Stochastic indicator, AUDCHF can be expected to rise further toward the next round resistance level 0.6000.
British Pound: A Silent Power Among the Majors
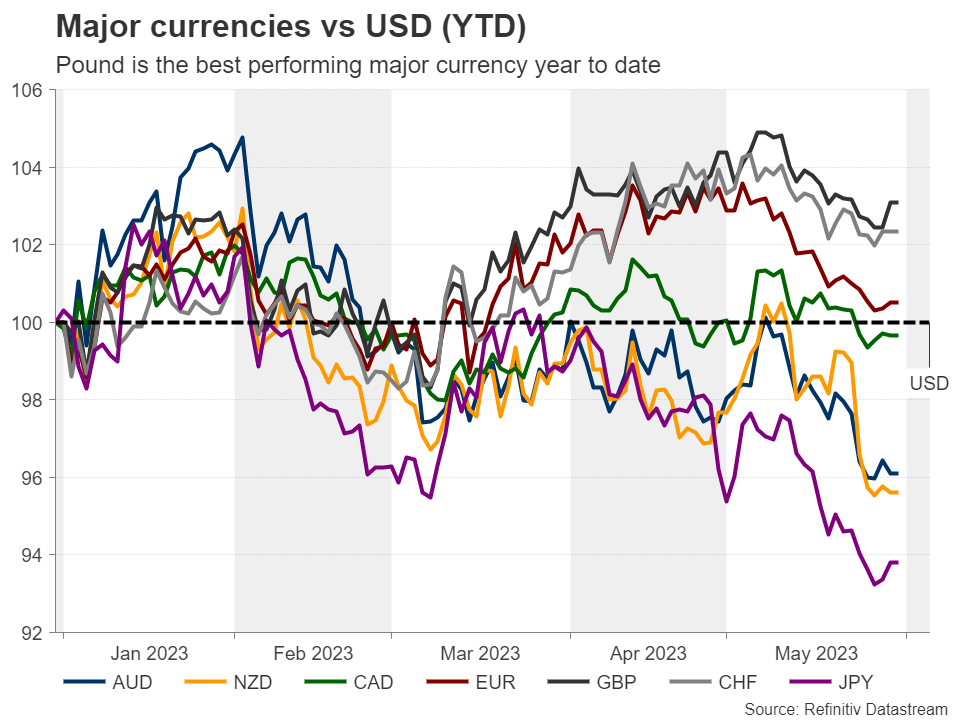
Despite coming under some pressure against its US counterpart lately, the British pound remains the best performing currency year-to-date. Will it continue performing well henceforth? With underlying inflation creeping up again in April, investors are hoping that the Bank of England will intensify its efforts to bring it to heel. But will policymakers rise to the occasion?
UK inflation slows, but core unexpectedly accelerates
With the BoE abandoning its recession call and signaling that they will not hesitate to raise rates further should inflation pressures persist, market participants remained convinced that officials could deliver two more quarter-point increases by the end of the year.
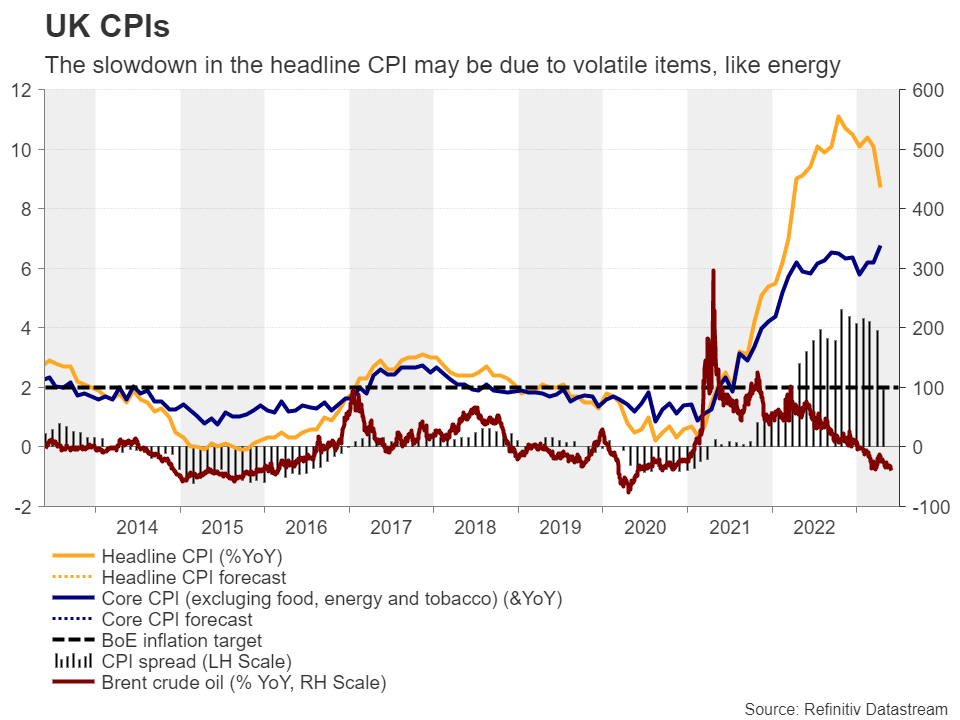
However, that was the case before May 24, the day when the inflation numbers for April were released. The data revealed that the headline CPI slowed by less than expected, to 8.7% year-on-year from 10.1%, but what was much more worrisome was the unexpected acceleration in underlying inflation to 6.8% y/y from 6.2%. This suggested that price pressures are becoming more embedded in the broader economy, and that the decline in the headline rate was just the result of a slowdown in the prices of volatile items like energy.
With no recession calls, investors double their BoE hike bets
With that in mind, investors have doubled their bets, now almost 100bps worth of additional rate increments by December, with a first quarter-point cut being nearly fully priced in for May 2024. And all this even after preliminary PMIs for May disappointed last week. Perhaps investors are content with the fact that the composite index is still pointing to expansion, which enhances the view that the UK economy may have avoided a recession.
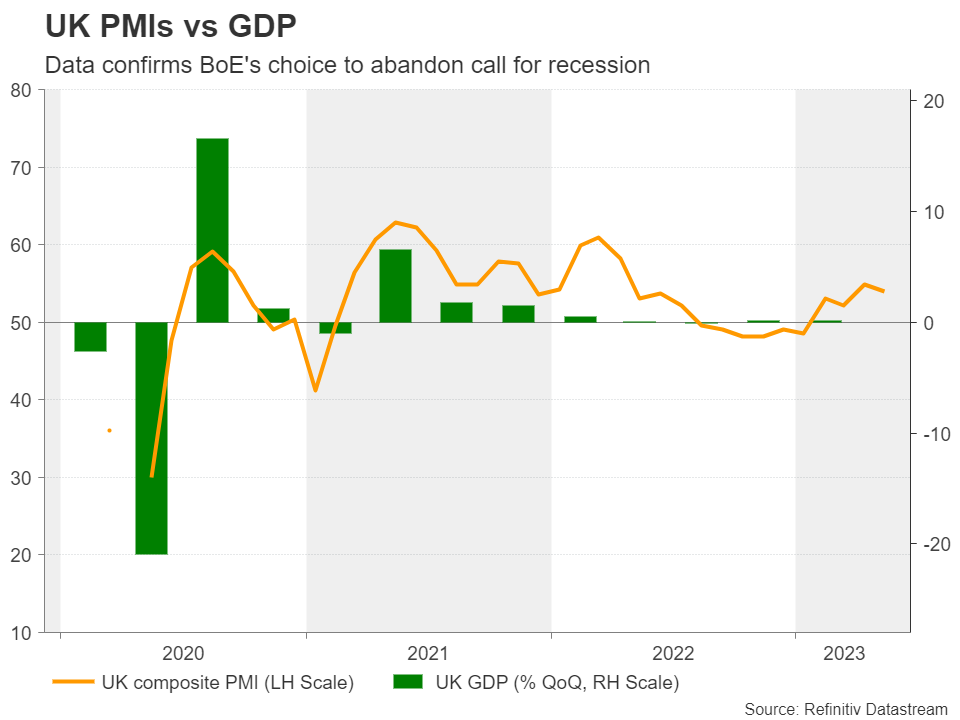
After November, when the BoE predicted the longest recession in the UK economy’s history, the financial community viewed the Bank’s slow and cautious tightening as a wise choice, but with all the economic engines performing better than feared then and inflation remaining out of control, market participants are now hoping for, or even demanding, more aggressive action by the Bank.
Will Bailey and co rise to the occasion?
Bailey and his fellow policymakers may have no other choice than to signal that more tightening is needed. Although the PMIs came in weaker than expected, they revealed that output charges continued to rise, and although they eased to the slowest in three months, they remained elevated by the survey’s historical standards. What’s more, average weekly earnings accelerated in March, which means that consumer demand could stay strong in the months to come and thereby keep inflation elevated.
Consequently, a 25bps hike at the BoE’s upcoming gathering may not constitute an adequate reason for celebration. Pound traders may feel satisfied and willing to add to their long positions if the Bank appears willing to keep raising rates as forcefully as needed to tame the inflation beast.
The pound may benefit heading into the June meeting by the fact that investors are taking a leap of faith and trust that the BoE may continue raising interest rates more aggressively than any other major central bank, while the currency may strengthen even more if policymakers appear determined to do whatever it takes to bring inflation to heel.
Pound remains the best performing major currency year-to-date
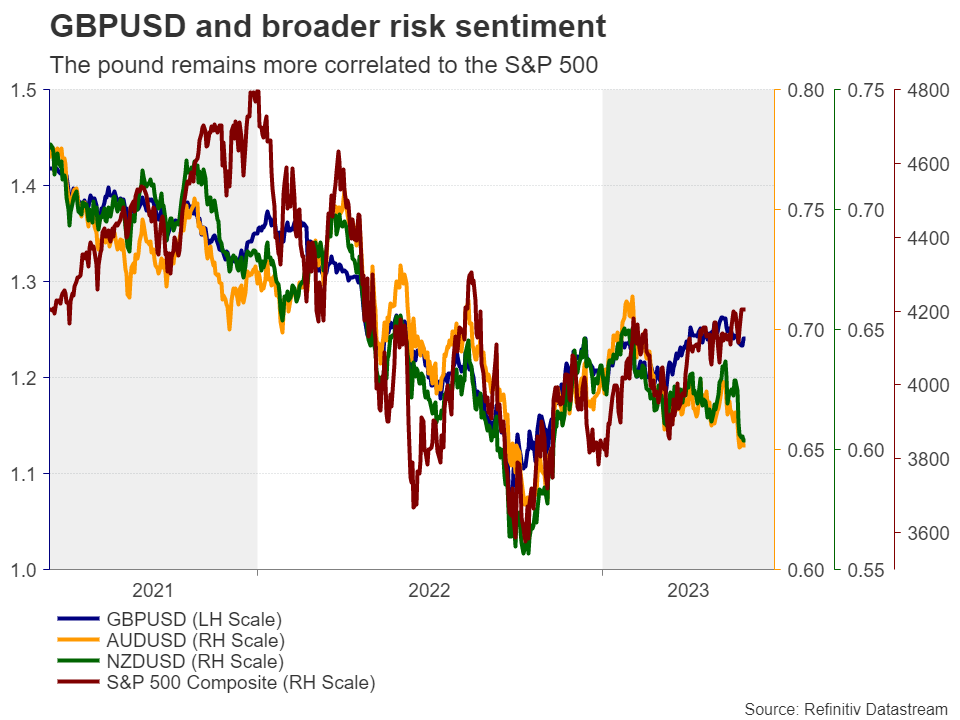
Although it pulled back against its US counterpart recently, the British currency remains the top performer among the majors since the beginning of the year, and monetary policy may have not been the only source of fuel. Due to the UK’s twin deficit, sterling has turned into a risk-linked currency the last few years, strengthening when equities rise and vice versa.
With Wall Street in an uptrend mode, it seems that the pound may have indeed benefited from investors’ willingness to keep increasing their risk exposure. But why didn’t the other traditional risk-linked currencies aussie and kiwi follow suit? Perhaps due to Chinese data suggesting that after the post-reopening boost, Australia’s and New Zealand’s main trading partner is losing momentum.
Currently, equity traders seem to be indifferent, or less interested, to Chinese data, preferring to ride the artificial intelligence (AI) trend as optimism and better forecasts of tech firms are probably on top of their lists.
Putting everything together, with the dollar staging a decent comeback lately due to the market reevaluating its implied Fed rate path, pound/dollar may not be the best choice for exploiting further gains in the pound, at least in the short run. The yen and the kiwi may be more appropriate candidates as the BoJ is sticking to its ultra-loose monetary policy and the RBNZ seems to be over with this tightening cycle.
Pound may continue to benefit the most against the kiwi
Having said that, choosing the yen carries more risks as the BoJ may eventually proceed with more normalizing steps, while an unexpected turbulent market episode will not only weigh on the pound, but also benefit the safe-haven yen. So, ultimately, the best option could be the pound/kiwi pair as the risk-on characteristics of both currencies are somewhat offsetting each other and thus, the probability of violent swings when sentiment changes may be smaller. Even if the sentiment-related forces are not equal, the current market landscape suggests that the pound has an advantage either way. It gains more in risk-on episodes and loses less in risk-off.
Indeed, since last Wednesday, when the RBNZ hinted that it is probably done raising interest rates, pound/kiwi has been in a fly mode, breaking above the high of April 26 just this Tuesday and signaling the continuation of the prevailing uptrend.
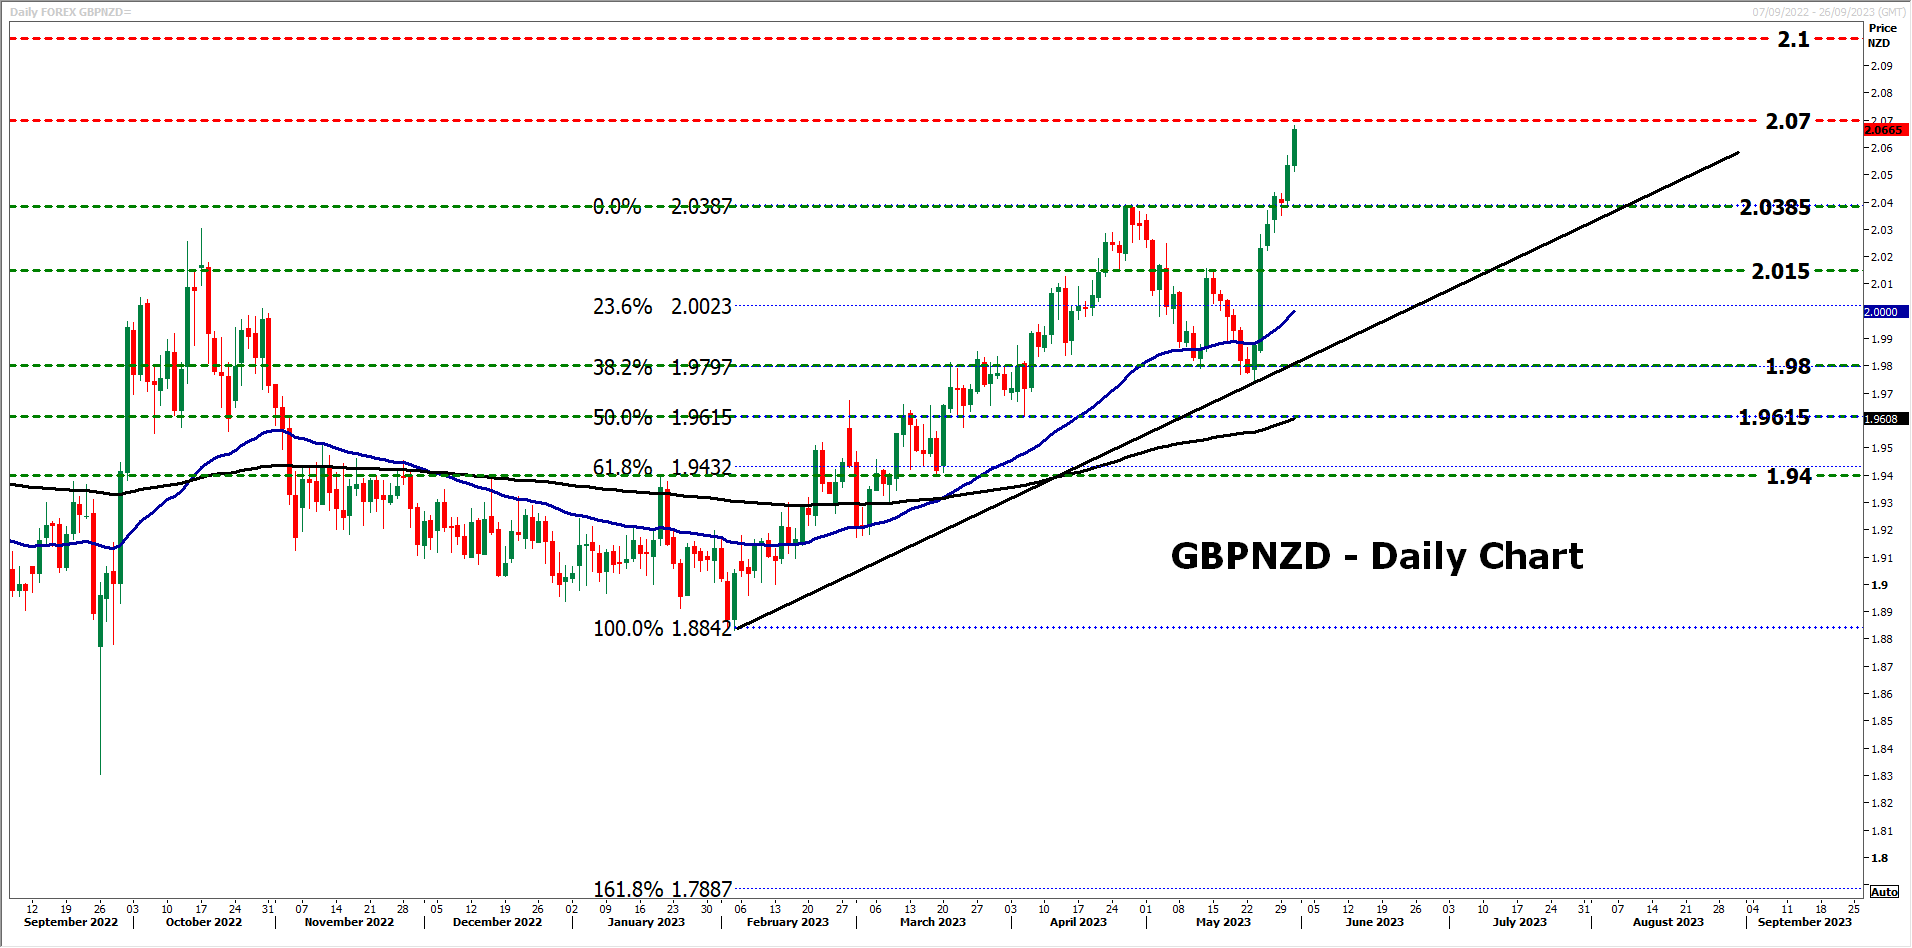
The pair now looks to be headed towards the 2.0700 territory, marked by the highs of May 2020, the break of which could carry extensions towards the 2.1000 zone, which acted as a ceiling between mid-March and mid-April of that same year.
For the outlook to turn bearish, the bears may have to drive the action all the way down and below the 1.9800 area, which offered strong support this month and coincided with the 38.2% Fibonacci retracement level of the February 3 – April 26 upleg.