

Sample Category Title
USD/CHF Mid-Day Outlook
Daily Pivots: (S1) 0.9034; (P) 0.9076; (R1) 0.9097; More...
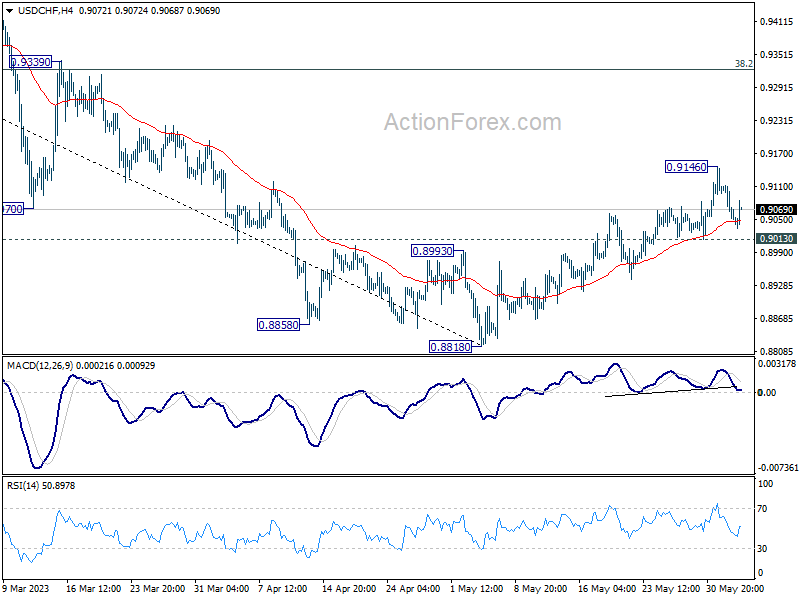
USD/CHF recovers ahead of 0.9013 minor support but stays below 0.9146 temporary top. Intraday bias remains neutral first. On the upside, break of 0.9146 will resume the rebound from 0.8818 to 38.2% retracement of 1.0146 to 0.8818 at 0.9325. On the downside, however, break of 0.9013 will turn bias back to the downside for retesting 0.8818 low instead.
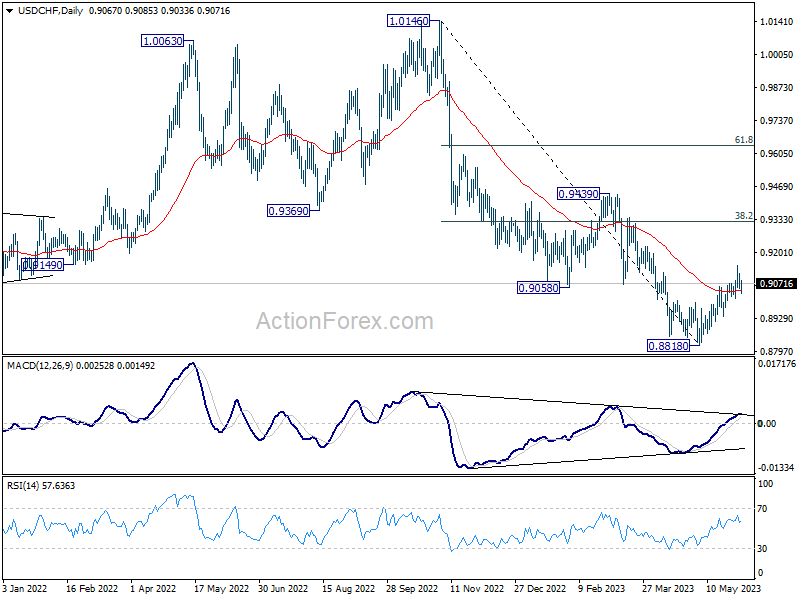
In the bigger picture, fall from 1.1046 (2022 high) is seen as a leg in the long term range pattern from 1.0342 (2016 high). So, downside should be contained by 0.8756 to bring reversal. Sustained break of 0.9058 support turned resistance will be the first sign of medium term bottoming. However, decisive break of 0.8756 will carry larger bearish implications.
Dollar Recovering after Strong NFP Growth, But Upside Capped
Dollar is trying to recover in early US session after much stronger than expected non-farm payroll job growth. Nonetheless, upside is capped so far, considering the surprised jump in unemployment rate too. For now, Aussie remains the strongest one for the day, followed by other commodity currencies. Yen is the worst performer, followed by Swiss Franc and then Euro.
In Europe, at the time of writing, FTSE is up 1.10%. DAX is up 1.10%. CAC is up 1.39%. Germany 10-year yield is up 0.0490 at 2.298. Earlier in Asia, Nikkei rose 1.21%. Hong Kong HSI rose 4.02%. China Shanghai SSE rose 0.79%. Singapore Strait Times rose 0.24%. Japan 10-year JGB yield dropped -0.0048 to 0.416.
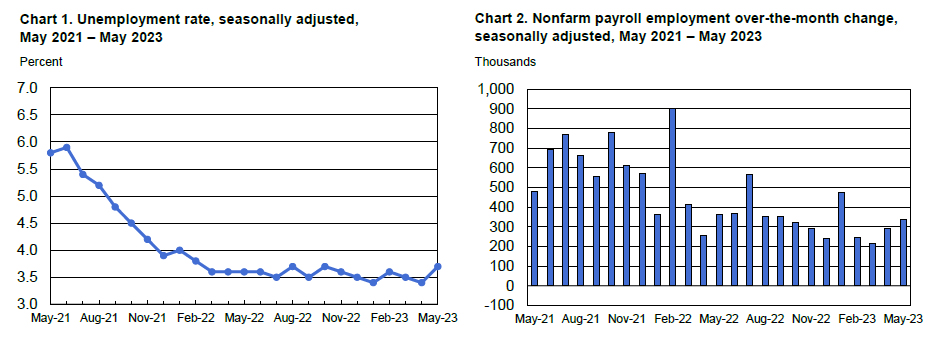
US NFP rose 339k, unemployment rate rose to 3.7%
US non-farm payroll employment grew 339k in May, well above expectation of 180k. The figure was in line with the average monthly gain of 341k over the prior 12 months.
Unemployment rate rose from 3.4% to 3.7%, above expectation of 3.5%. Labor force participation rate was unchanged at 62.6%. Number of unemployed persons rose by 440k to 6.1m.
Average hourly earnings rose 0.3% mom, matched expectations. Average workweek edged down by -0.1 hour to 34.3 hours.
ECB Panetta: Policy debate to shift from 'how high?' to 'how long?'
In an interview with Le Monde, ECB Executive Board Fabio Panetta noted, "Given the extraordinary level of economic uncertainty, estimating the terminal rate is challenging."
"I don't think this is the time to be too hasty in raising rates, given the considerable ground we have already covered." He added "my intuition suggests that we have not reached the end of our rate-hike cycle, though we're not far away from it."
As for the future of ECB's monetary policy, Panetta indicated a shift in focus. "I think the policy debate will soon shift away from 'how high?' to 'how long?'," he stated.
He identified the strength of the labour market and firms' profit strategies as the main threats to price stability but pointed out, "so far there are no clear indications of a self-sustained wage-price spiral."
In addressing core inflation's lagging pattern behind headline inflation, Panetta observed, "it (core inflation) is now proving to be persistent even after energy inflation has gone down. But we can expect it to come down eventually too. In this respect, yesterday's figures are encouraging."
He concluded by warning that the effects of ECB's monetary tightening could potentially lead to "a prolonged weakness in economic activity or even a technical recession" if domestic demand continues to falter.
BoJ Ueda: No time frame to achieve inflation target, but not so long as 10 years
In a parliamentary address today, BoJ Governor Kazuo Ueda said "The time it takes for the impact of monetary policy to appear on the economy could move around a lot depending on circumstances."
"We therefore do not have any time frame in mind" in achieving the inflation target, he added.
"Having said that, our baseline view is that it won't take so long as over 10 years. We'll still seek to hit the target at the earliest date possible," he remarked.
Ueda reiterated that the Bank of Japan's purchases of Real Estate Investment Trusts (REITs) form part of their expansive monetary easing strategy. He noted, "We are conducting the purchases (of REITs) as part of our massive monetary easing program. Given it will take more time to achieve our price target, we will maintain the easy policy."
USD/CHF Mid-Day Outlook
Daily Pivots: (S1) 0.9034; (P) 0.9076; (R1) 0.9097; More...
USD/CHF recovers ahead of 0.9013 minor support but stays below 0.9146 temporary top. Intraday bias remains neutral first. On the upside, break of 0.9146 will resume the rebound from 0.8818 to 38.2% retracement of 1.0146 to 0.8818 at 0.9325. On the downside, however, break of 0.9013 will turn bias back to the downside for retesting 0.8818 low instead.
In the bigger picture, fall from 1.1046 (2022 high) is seen as a leg in the long term range pattern from 1.0342 (2016 high). So, downside should be contained by 0.8756 to bring reversal. Sustained break of 0.9058 support turned resistance will be the first sign of medium term bottoming. However, decisive break of 0.8756 will carry larger bearish implications.
Economic Indicators Update
| GMT | Ccy | Events | Actual | Forecast | Previous | Revised |
|---|---|---|---|---|---|---|
| 22:45 | NZD | Terms of Trade Index Q1 | -1.50% | -1.10% | 1.80% | 1.50% |
| 23:50 | JPY | Monetary Base Y/Y May | -1.10% | -1.40% | -1.70% | |
| 06:45 | EUR | France Industrial Output M/M Apr | 0.80% | 0.30% | -1.10% | |
| 12:30 | USD | Nonfarm Payrolls May | 339K | 180K | 253K | 294K |
| 12:30 | USD | Unemployment Rate May | 3.70% | 3.50% | 3.40% | |
| 12:30 | USD | Average Hourly Earnings M/M May | 0.30% | 0.30% | 0.50% |
US NFP rose 339k, unemployment rate rose to 3.7%
US non-farm payroll employment grew 339k in May, well above expectation of 180k. The figure was in line with the average monthly gain of 341k over the prior 12 months.
Unemployment rate rose from 3.4% to 3.7%, above expectation of 3.5%. Labor force participation rate was unchanged at 62.6%. Number of unemployed persons rose by 440k to 6.1m.
Average hourly earnings rose 0.3% mom, matched expectations. Average workweek edged down by -0.1 hour to 34.3 hours.
Will USDCHF Start a New Bullish Wave?
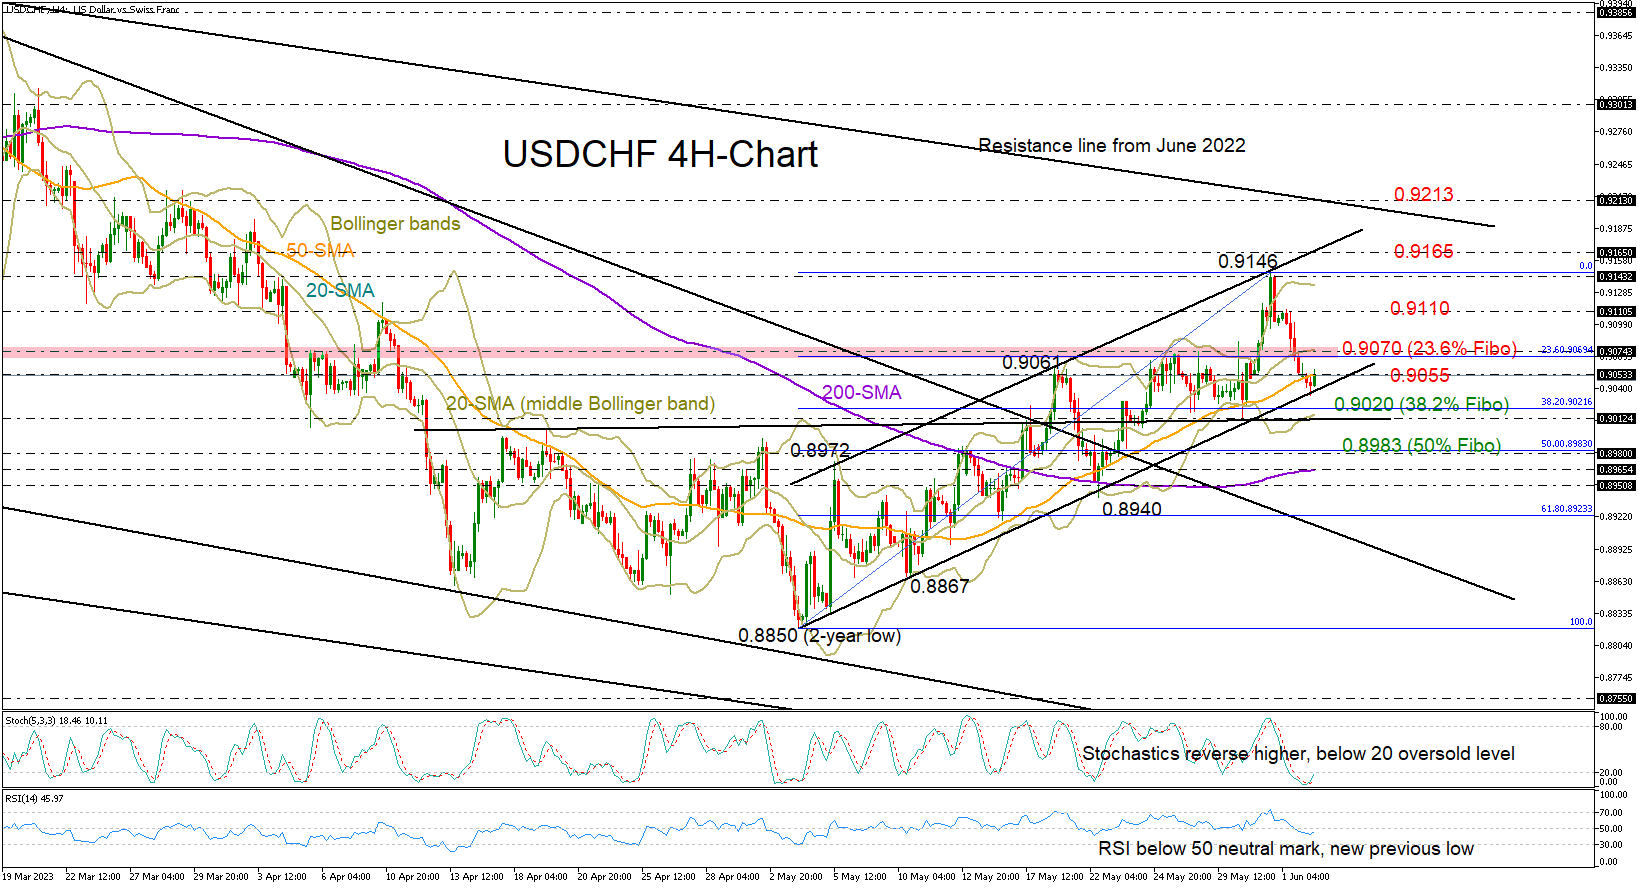
USDCHF is trading at the bottom of an upward-sloping channel, increasing speculation that the pair is preparing for its next bull run as traders are eagerly waiting for the US nonfarm payrolls release.
The Stochastic oscillator on the four-hour chart rotated northwards, but it has yet to exit the oversold region above 20, suggesting that some patience is still necessary. In other warning signals, the pair is still comfortably above the lower Bollinger band, questioning the case for an upside reversal.
A step above the 50-period simple moving average (SMA), which is currently acting as resistance around 0.9050, could navigate the pair towards the 23.6% Fibonacci retracement level of the 0.8850-0.9146 upleg and the 20-period SMA (middle Bollinger band), both at 0.9070. If the bulls breach that border, the price may advance towards 0.9110, while higher, it will attempt to crawl above May’s high of 0.9146 with scope to reach the channel’s upper boundary seen around 0.9165.
If sellers press the pair below the channel, immediate support could occur around the 38.2% Fibonacci mark of 0.9020. A close lower could intensify downside pressure towards the 50% Fibonacci of 0.8983, while the 200-period SMA around 0.8965 may also attract interest in the event of a more aggressive decline.
Summing up, even though USDCHF seems to have found an ideal pivot point, the technical indicators cannot warrant an upturn in the price. For a proper rebound, the price will need to rise sustainably above 0.9075.
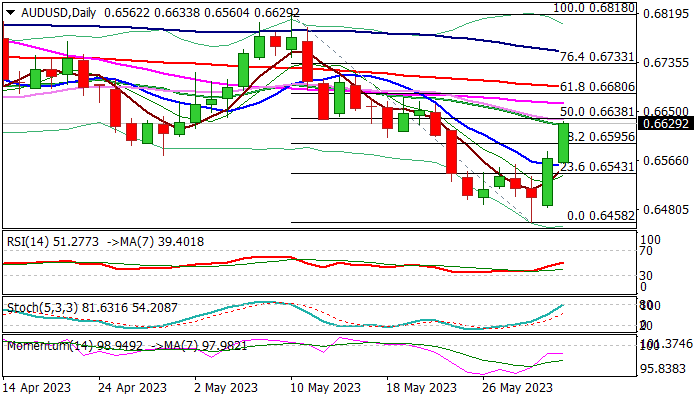
AUD/USD: Strong Recovery Extends into Second Straight Day
Australian dollar extends strong rally into second straight day, lifted by weaker US dollar on debt ceiling deal, signals that China is working on new property market support package, expected wage raise as from July 1 and higher than expected April inflation which adds to bets about further rate hikes.
Strong bullish acceleration reached nearly 50% retracement of 0.6818/0.6458 bear-leg, improved near-term structure, although 14-d momentum indicator is still in the negative territory a stochastic is entering overbought zone, which may slow bulls on approach to pivotal barriers at 0.6680 (Fibo 61.8% / daily cloud base).
Potential dips should offer better buying opportunities while holding above broken Fibo 38.2% barrier at 0.6595.
Caution on extension and close below 10DMA (0.6557) which will sideline bulls.
Res: 0.6638; 0.6680; 0.6694; 0.6733.
Sup: 0.6595; 0.6557; 0.6543; 0.6490.
GBP/USD: Cable at Two-Week High above 1.25 ahead of US Labor Report
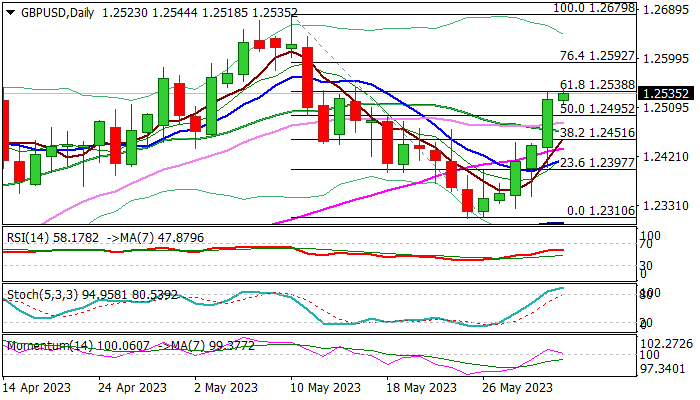
Cable is establishing above 1.2500 mark, in extension of six-day rally from 1.2310 higher base, boosted by hawkish BoE outlook, with the latest acceleration sparked by fresh weakness of the US dollar, as tensions about debt ceiling eased.
Bulls cracked pivotal Fibo barrier at 1.2538 (61.8% of 1.2679/1.2310 pullback) with break here to add to positive signals and unmask key barrier at 1.2679 (2023 high of May 10), although strongly overbought stochastic and fading bullish momentum warn that bulls may take a breather.
Near-term bias is expected to remain bullish while the action stays above 1.2500 handle.
Markets focus on US labor data for fresh signals, with weak May numbers to relax bets on Fed rate hikes and raise pressure on greenback.
Conversely, the pound would face increased headwinds on upbeat US job numbers.
Res: 1.2550; 1.2592; 1.2640; 1.2679.
Sup: 1.2544; 1.2500; 1.2451; 1.2414.
ECB Panetta: Policy debate to shift from ‘how high?’ to ‘how long?’
In an interview with Le Monde, ECB Executive Board Fabio Panetta noted, "Given the extraordinary level of economic uncertainty, estimating the terminal rate is challenging."
"I don't think this is the time to be too hasty in raising rates, given the considerable ground we have already covered." He added "my intuition suggests that we have not reached the end of our rate-hike cycle, though we're not far away from it."
As for the future of ECB's monetary policy, Panetta indicated a shift in focus. "I think the policy debate will soon shift away from 'how high?' to 'how long?'," he stated.
He identified the strength of the labour market and firms' profit strategies as the main threats to price stability but pointed out, "so far there are no clear indications of a self-sustained wage-price spiral."
In addressing core inflation's lagging pattern behind headline inflation, Panetta observed, "it (core inflation) is now proving to be persistent even after energy inflation has gone down. But we can expect it to come down eventually too. In this respect, yesterday's figures are encouraging."
He concluded by warning that the effects of ECB's monetary tightening could potentially lead to "a prolonged weakness in economic activity or even a technical recession" if domestic demand continues to falter.
AUD/USD and NZD/USD Start Steady Increase
AUD/USD is moving higher and might climb further higher above 0.6615. NZD/USD is also rising and might surge toward the 0.6145 resistance zone.
Important Takeaways for AUD USD and NZD USD Analysis Today
- The Aussie Dollar started a fresh increase above the 0.6520 and 0.6550 levels against the US Dollar.
- There was a break above a major bearish trend line with resistance near 0.6520 on the hourly chart of AUD/USD at FXOpen.
- NZD/USD is gaining bullish momentum above the 0.6060 support.
- There was a break above a key bearish trend line with resistance near 0.6020 on the hourly chart of NZD/USD at FXOpen.
AUD/USD Technical Analysis
On the hourly chart of AUD/USD at FXOpen, the pair started a fresh increase from the 0.6460 support. The Aussie Dollar was able to clear the 0.6500 resistance to start a steady uptrend against the US Dollar.
It cleared the 50-hour simple moving average and a major bearish trend line with resistance near 0.6520. The upward move was such that the bulls pumped the pair above the 61.8% Fib retracement level of the downward move from the 0.6660 swing high to the 0.6462 low.
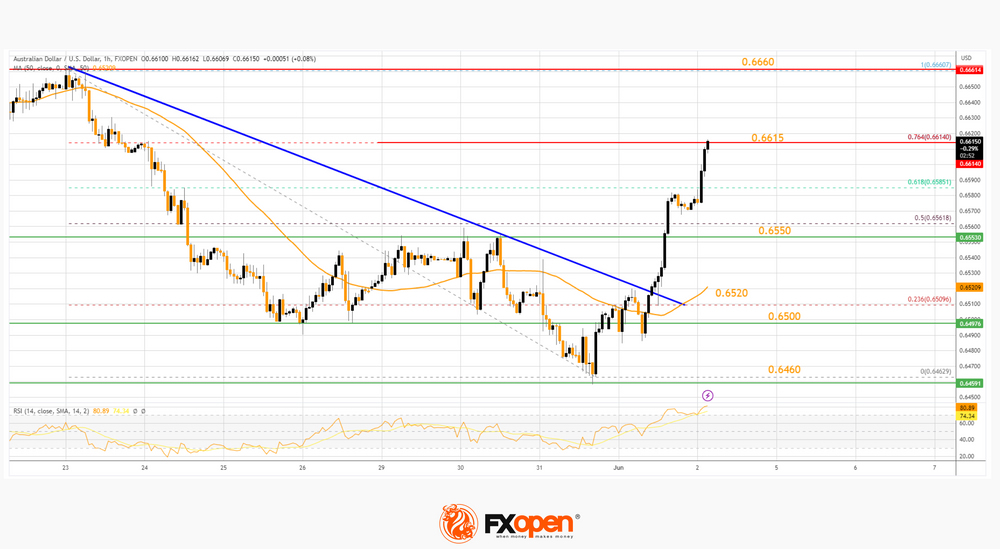
The AUD USD chart indicates that the pair is now facing resistance near 0.6615. It is close to the 76.4% Fib retracement level of the downward move from the 0.6660 swing high to the 0.6462 low.
An upside break above the 0.6615 resistance might send the pair further higher. The next major resistance is near the 0.6660 level. Any more gains could open the doors for a move toward the 0.6700 resistance zone.
On the downside, initial support is near 0.6550. The next support could be the 0.6520 level and the 50-hour simple moving average. If there is a downside break below the 0.6520 support, the pair could extend its decline toward the 0.6460 level. Any more losses might signal a move toward 0.6400.
NZD/USD Technical Analysis
On the hourly chart of AUD/USD on FXOpen, the pair formed a base above the 0.5990 level. The New Zealand Dollar started a decent upward move above the 0.6020 resistance against the US Dollar.
There was also a break above a key bearish trend line with resistance near 0.6020. The pair is now trading above the 50-hour simple moving average and the 23.6% Fib retracement level of the main decline from the 0.6302 swing high to the 0.5988 low.
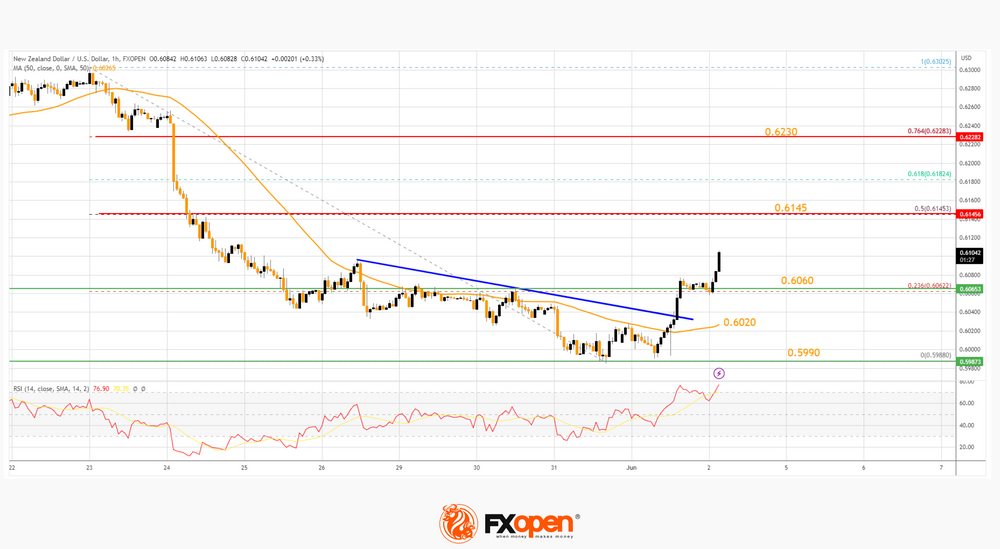
The NZD USD chart suggests that the RSI is rising and might lead the pair toward the 0.6145 resistance. It coincides with the 50% Fib retracement level of the main decline from the 0.6302 swing high to the 0.5988 low.
The next major resistance is near the 0.6230 level. A clear move above the 0.6230 level might even push the pair toward the 0.6300 level. Any more gains might open the doors for a move toward the 0.6350 resistance zone in the coming days
On the downside, there is a key support forming near 0.6060. The next major support is near the 50-hour simple moving average at 0.6020.
If there is a downside break below the 0.6020 support, the pair might slide toward the 0.5990 support. Any more losses could send NZD/USD toward 0.5950.
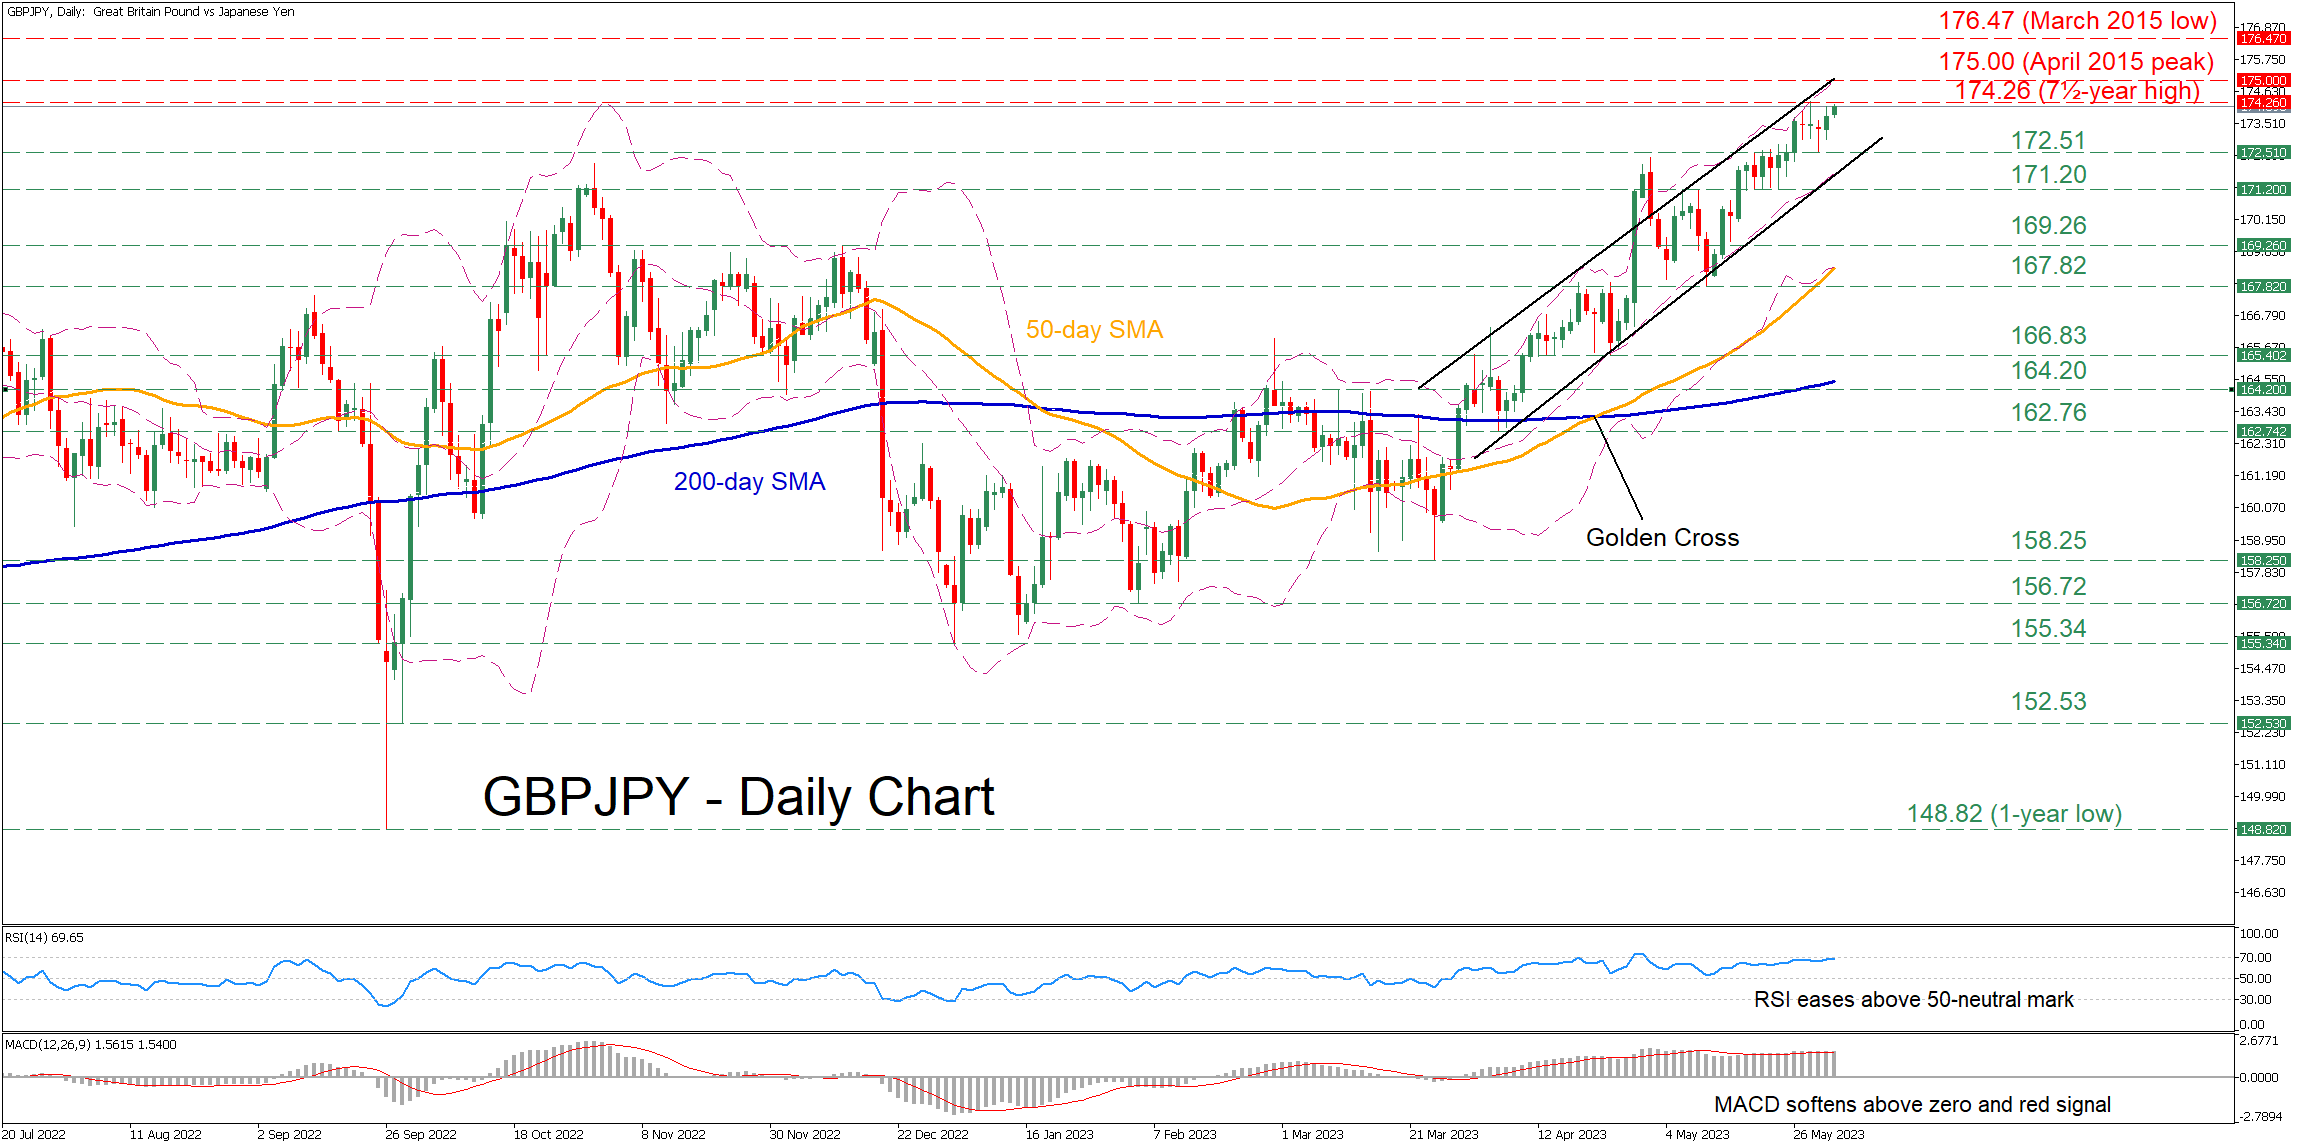
GBPJPY Extends Advance to 7½-Year High
GBPJPY has been stuck in an upward sloping channel since early April, generating a structure of higher highs and creating a fresh 7½-year peak of 174.26 last Tuesday. Even though the pair experienced a minor correction after that, it quickly stormed back higher to challenge its recent multi-year high.
The short-term oscillators currently suggest that bullish forces retain the upper hand. Specifically, the RSI has flatlined slightly below its 70-overbought zone, while the MACD histogram is holding above both zero and its red signal line.
Should buying pressures intensify, the 7½-year high of 174.26 could be the first barricade for the bulls to clear. Slicing through that wall, the pair could ascend towards levels not seen in years, where the April 2015 peak of 175.00 could curb any upside attempts. If that barrier fails, the bulls might then attack the March 2015 low of 176.47.
Alternatively, if the positive momentum wanes and the price reverses lower, the recent support of 172.51 could act as the first line of defence. Further declines could then cease at 171.20 before the December resistance of 169.26 comes under examination. A dive beneath that zone could trigger a decline towards the 167.82 support.
In brief, GBPJPY has adopted a bullish short-term pattern, posting consecutive multi-year highs in the past two weeks. However, a downside correction should not be ruled out as the price has approached overbought conditions.
USDCAD Shifts Focus to the Downside After Deep Fall
USDCAD plunged by 1.2% in the first trading day of June, sliding back below its simple moving averages (SMAs) to mark a new two-week low of 1.3417 on Friday.
The fast downside correction follows the double top creation around the tough resistance of 1.3650, which raised the risk of a bearish continuation. Overall, there are barely any bullish signs in the market, although a pause or a rebound near the 1.3400 level cannot be excluded as the stochastic oscillator is quickly approaching its 20 oversold level. The RSI has crossed back below its 50 neutral mark, while the MACD has inched below its red signal line. Moreover, the price is trading some distance above the lower Bollinger band, suggesting that the decline has still some room to run.
In trend signals, a bearish cross between shorter and longer SMAs is in progress. If successfully completed, traders may start to worry about a broad negative trend reversal, especially if the price breaks its six-month range below the 1.3340 floor. This is where the 38.2% Fibonacci retracement of the 1.4667-1.2007 downleg intersects the support line from November. Hence, a decisive close lower and below 1.3300 could see a depreciation towards the key 1.3225 handle. Another breakdown here may drive the pair towards the 1.3135 barrier.
Conversely, a bounce back above the SMAs at 1.3500 might lift the price up to the 1.3650 ceiling. A move higher could initially stall around the constraining zone of 1.3740 before targeting the tough 1.3800-1.3820 resistance territory. The bulls will need to climb that wall to clear the way towards the 2022 top of 1.3976.
In brief, USDCAD could stay under sellers’ control in the short term, with the confirmation signal expected to come below 1.3400.