

Sample Category Title
GBP/JPY Weekly Outlook
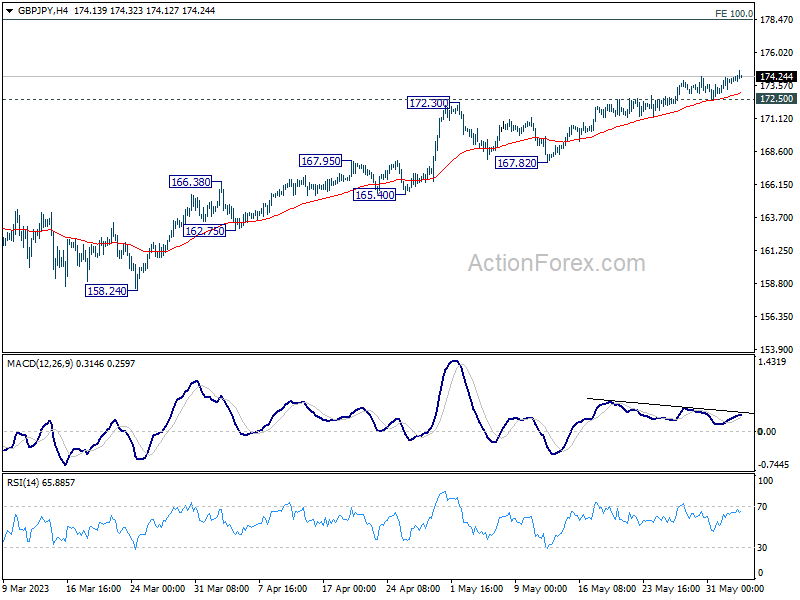
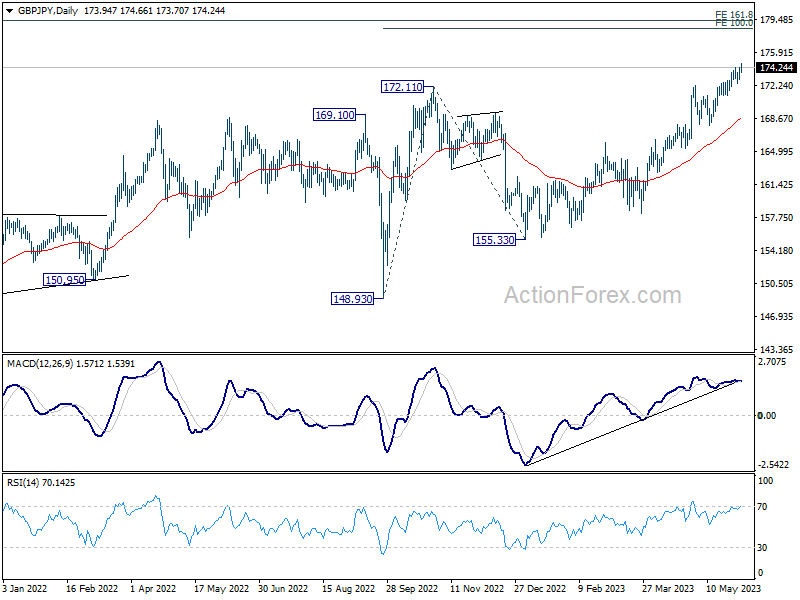
GBP/JPY's uptrend continued last week despite some jittery. Initial bias stays on the upside this week. Next target is 100% projection of 148.93 to 172.11 from 155.33 at 178.51. On the downside, break of 172.50 support will turn bias neutral and bring consolidations first, before staging another rally.
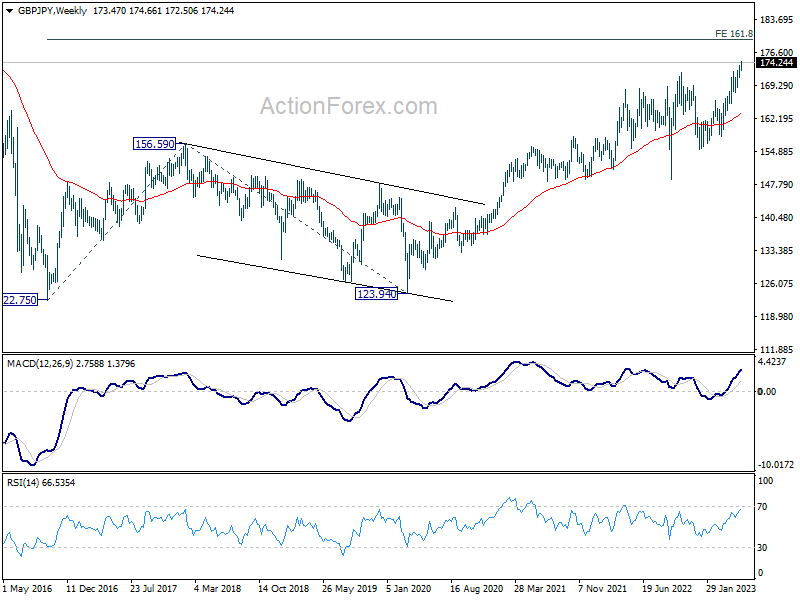
In the bigger picture, up trend from 123.94 (2020 low) is extending. Next target will be 161.8% projection of 122.75 (2016 low) to 156.59 (2018 high) from 123.94 at 178.69. For now, medium term outlook will remain bullish as long as 165.99 resistance turned support holds, even in case of deep pull back.
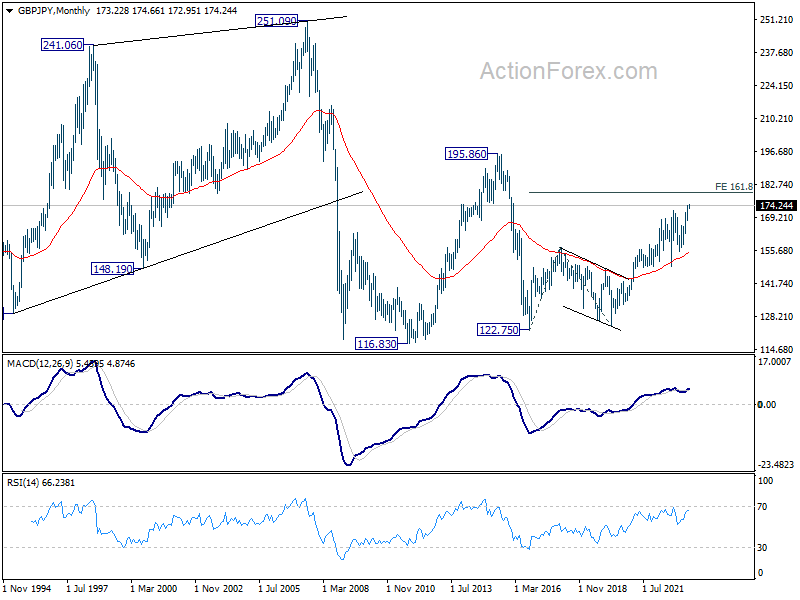
In the longer term picture, as long as 55 M EMA (now at 155.22) holds, rise from 122.75 (2016 low) could still extend higher to 195.86 (2015 high).
EUR/JPY Weekly Outlook
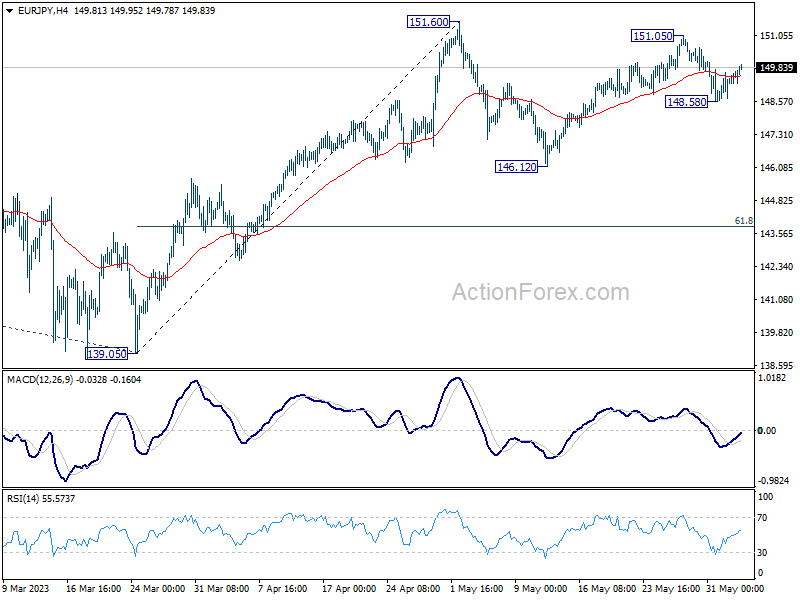
EUR/JPY failed to break through 151.60 resistance last week, and retreated. Initial bias remains neutral this week first. On the downside, below 148.58 temporary low will extend the corrective pattern from 151.60 with another falling leg. Deeper fall would be seen to 146.12 support and possibly below. On the upside, however, above 151.05 will target 151.60 high. Firm break there will resume larger up trend to 153.64 projection level.
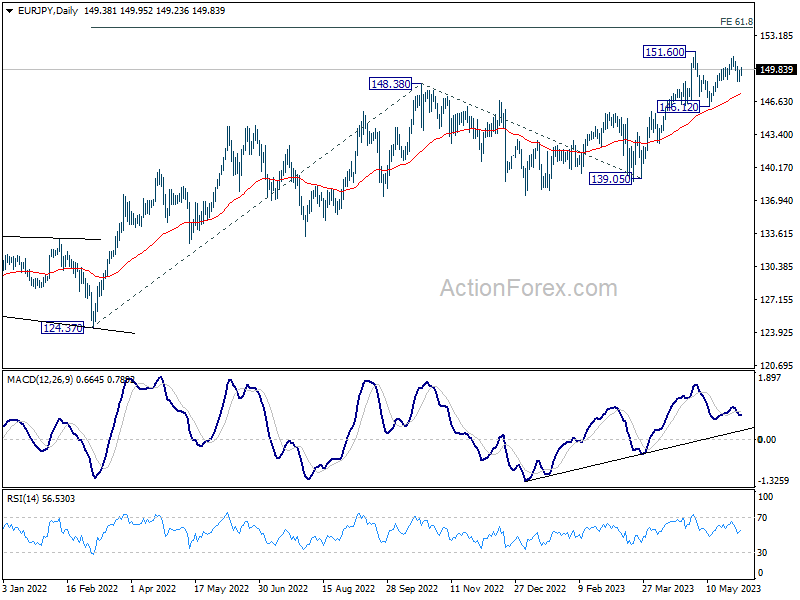
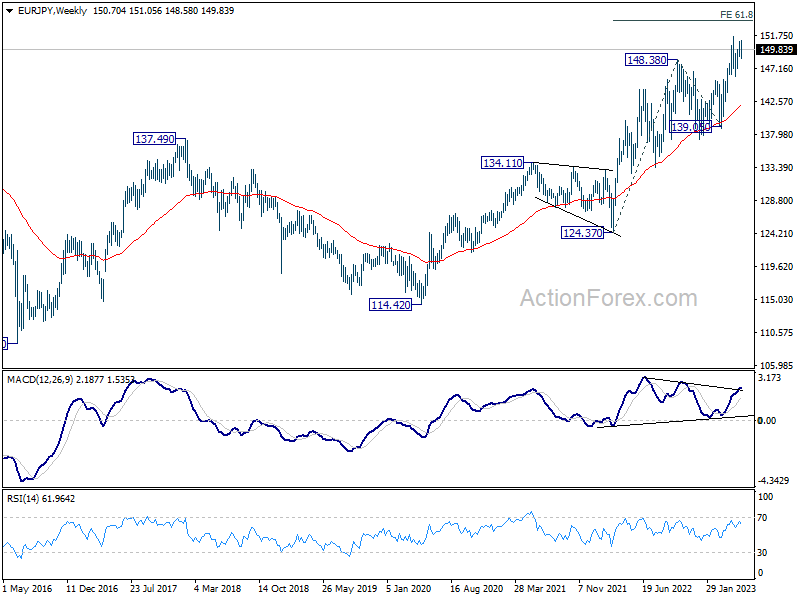
In the bigger picture, rise from 114.42 (2020 low) is in progress. Next target is 61.8% projection of 124.37 to 148.38 from 138.81 at 153.64. Sustained break there will pave the way to 100% projection at 162.82. For now, medium term outlook will remain bullish as long as 139.05 support holds, even in case of deep pull back.
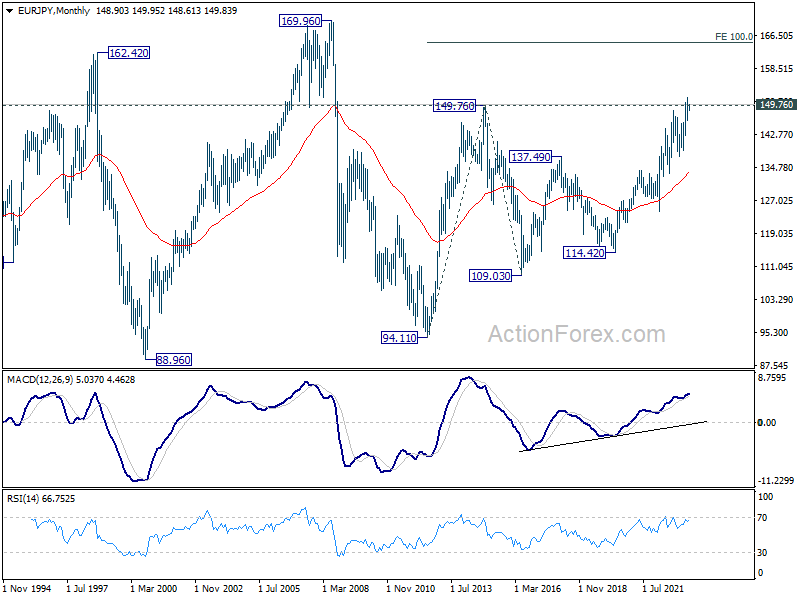
In the long term picture, break of 149.76 (2014 high) argues that whole up trend form 94.11 (2012 low) is resuming. Sustained trading above 149.76 will pave the way to 100% projection of 94.11 to 149.76 from 109.03 at 164.68, which is close to 169.96 (2008 high).
EUR/GBP Weekly Outlook
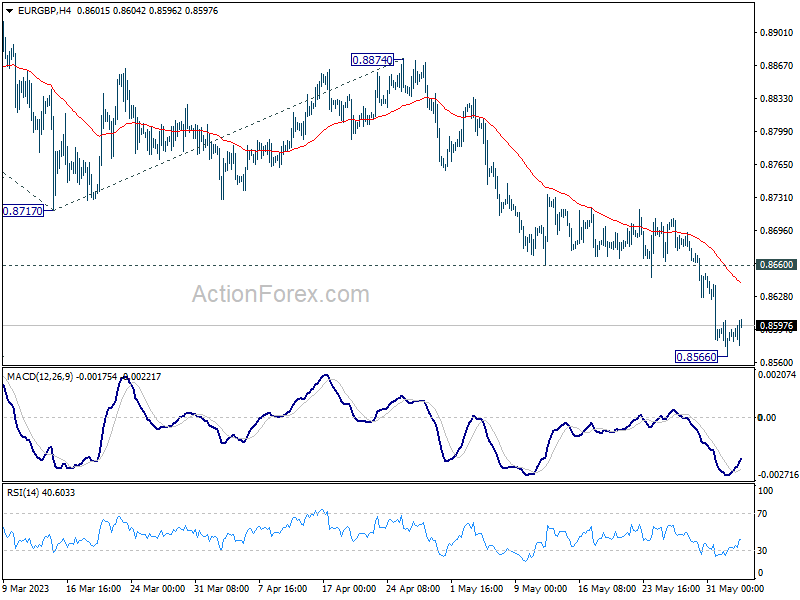
EUR/GBP's decline from 0.8977 continued last week and hit as low as 0.8566. As a temporary low was formed there, initial bias is neutral this week for some consolidations first. But recovery should be limited by 0.8660 support turned resistance and bring another fall. Break of 0.8566 will target 161.8% projection of 0.8977 to 0.8717 from 0.8874 at 0.8453.
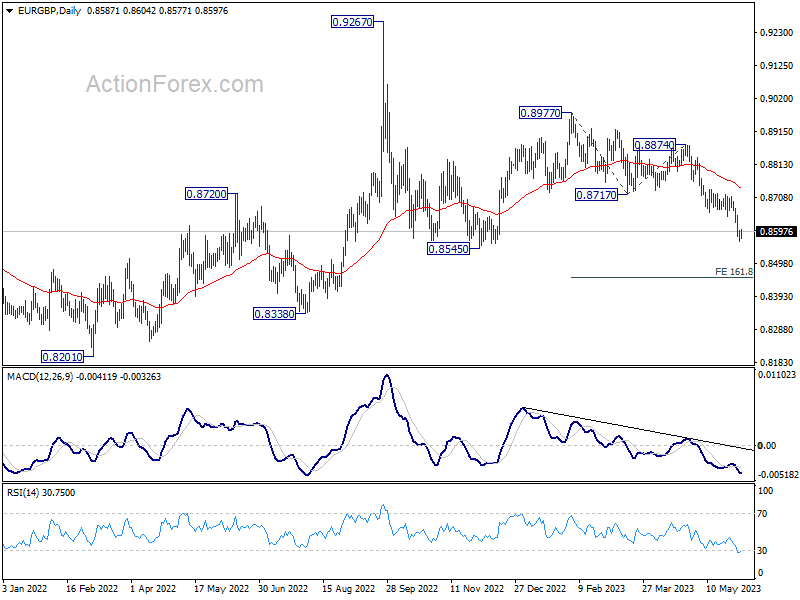
In the bigger picture, current development argues that whole decline from 0.9267 (2022 high) is still in progress. This is part of the long term range pattern from 0.9499 (2020 high). Deeper fall would be seen through 0.8545 support. This will now remain the favored case as long as 0.8717 support turned resistance holds.
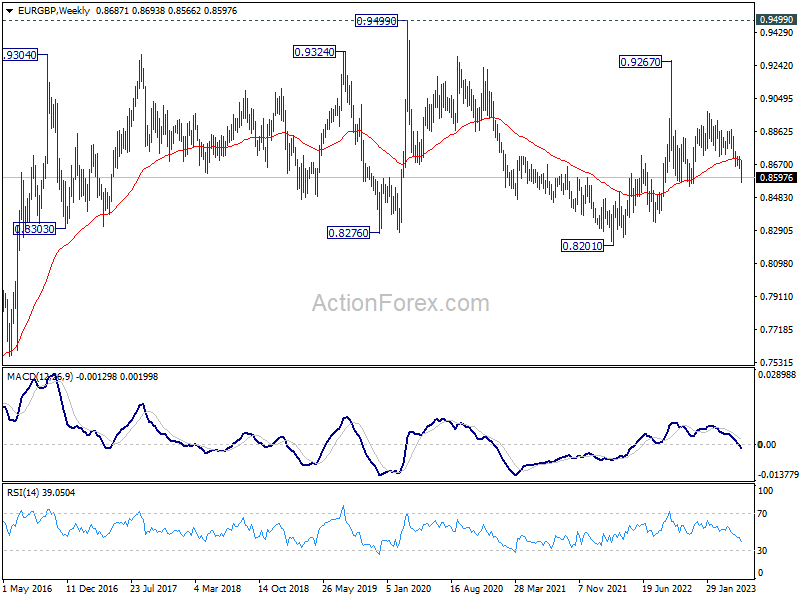
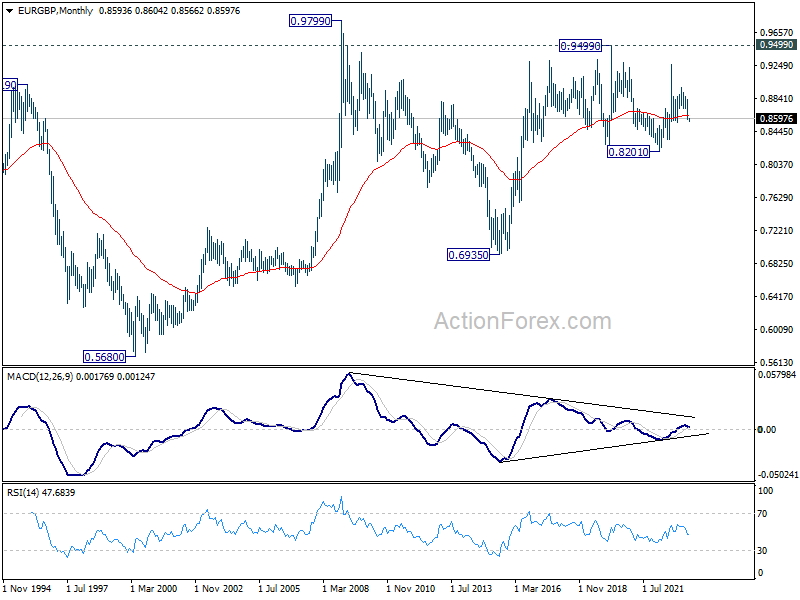
In the long term picture, long term range pattern is extending. But rise from 0.6935 (2015 low) is expected to extend at a later stage, to 0.9799 (2009 high).
EUR/AUD Weekly Outlook
EUR/AUD's late decline last week indicates that recovery from 1.6134 has completed at 1.6513 already. Initial bias is now on the downside this week for 1.6134 first. Firm break there will resume whole fall from 1.6785, and target 100% projection of 1.6785 to 1.6134 from 1.6513 at 1.5862. On the upside, above 1.6296 minor resistance will turn intraday bias neutral first.
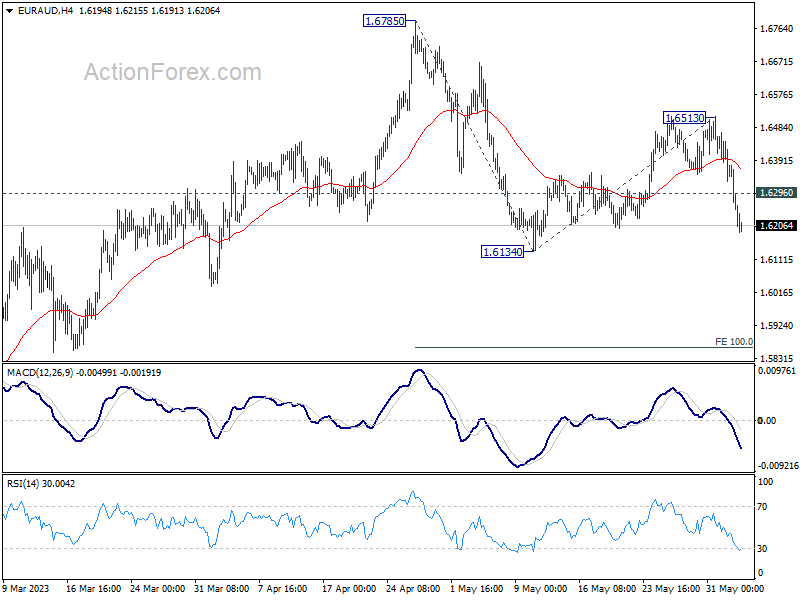
In the bigger picture, a medium term is possibly in place at 1.6785 already, on bearish divergence condition in D MACD. Fall from there is seen as corrective whole up trend from 1.4281 (2022 low). Deeper decline is expected as long as 1.6513 resistance holds, to 38.2% retracement of 1.4281 to 1.6785 at 1.5828.
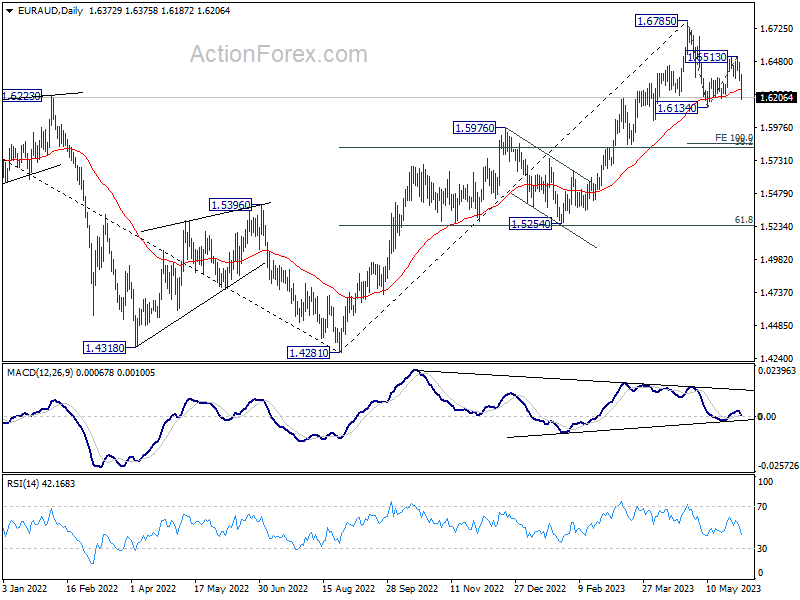
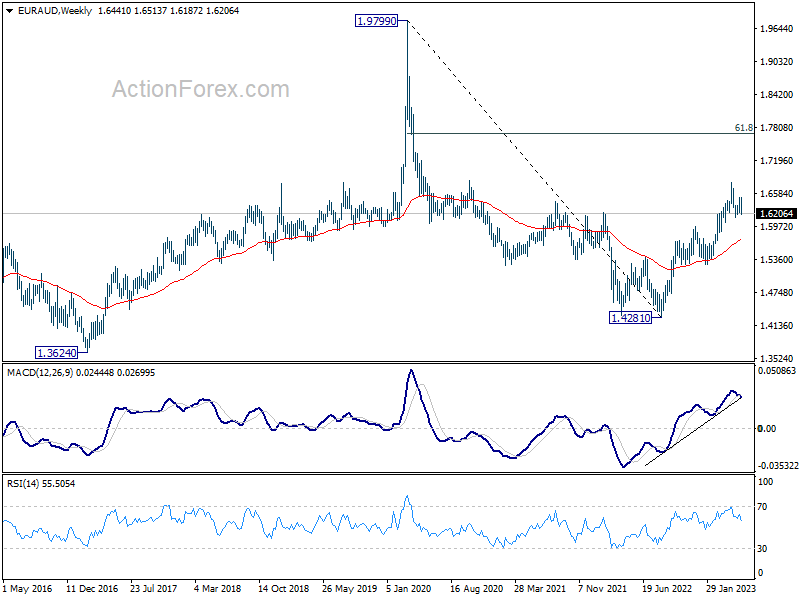
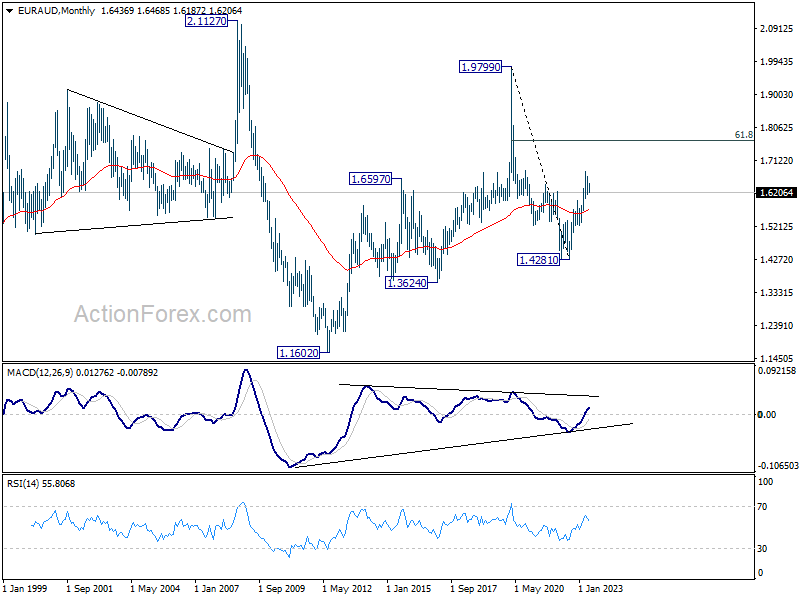
In the longer term picture, it's still early to decide if rise from 1.4281 is resuming whole up trend from 1.1602 (2012 low). But in either case, further rally is in favor as long as 1.5254 support holds. Next target is 61.8% retracement of 1.9799 to 1.4281 at 1.7691.
EUR/CHF Weekly Outlook
EUR/CHF rebounded again after dipping to 0.9670, but failed to break through 0.9760 resistance. Initial bias remains neutral this week first. On the upside, firm break of 0.9760 should confirm short term bottoming after hitting 61.8% retracement of 0.9407 to 1.0095 at 0.9670. Intraday bias will be back on the upside for 0.9878 resistance next. However, sustained break of 0.9670 will extend the whole decline from 1.0095 towards 0.9407 low instead.
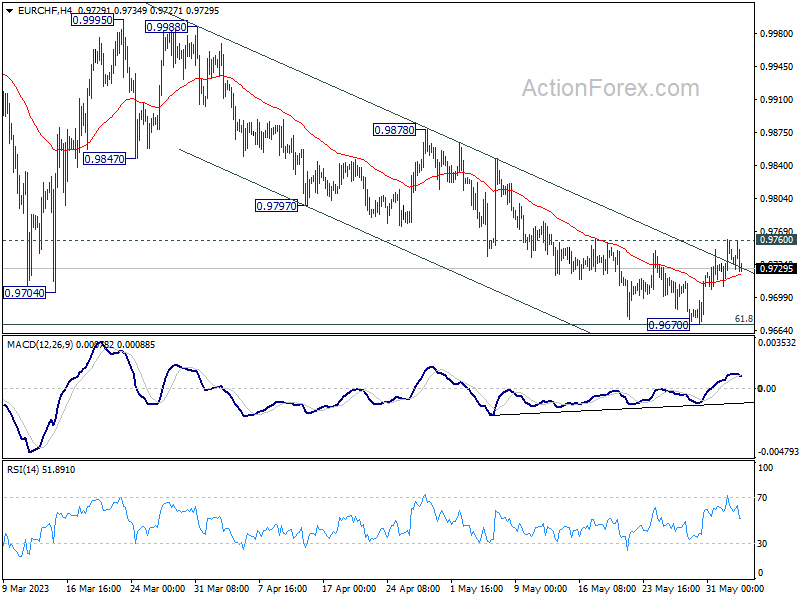
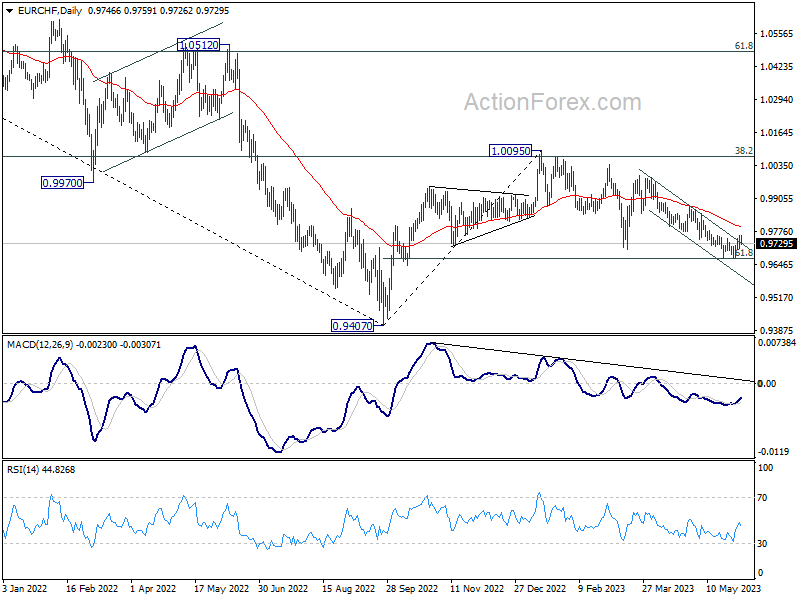
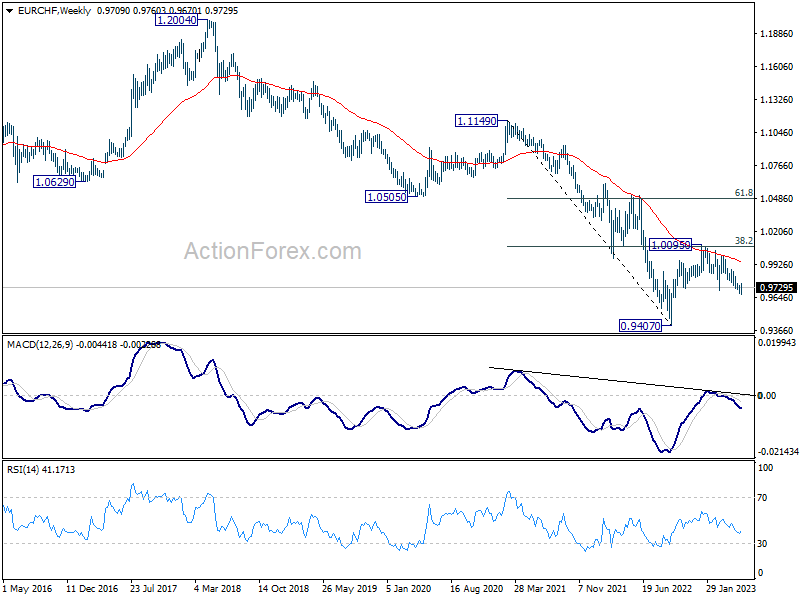
In the bigger picture, prior rejection by 38.2% retracement of 1.1149 to 0.9407 at 1.0072 suggests that medium term outlook is staying bearish. The pair is also capped below 55 W EMA (now at 0.9938). Down trend from 1.2004 (2018 high) is not completed yet and is in favor to resume through 0.9407 at a later stage. However, decisive break of 1.0095 resistance will raise the chance of bullish trend reversal. Rise from 0.9407 should then target 1.0505 cluster resistance (2020 low at 1.0505, 61.8% retracement of 1.1149 to 0.9407 at 1.1484).
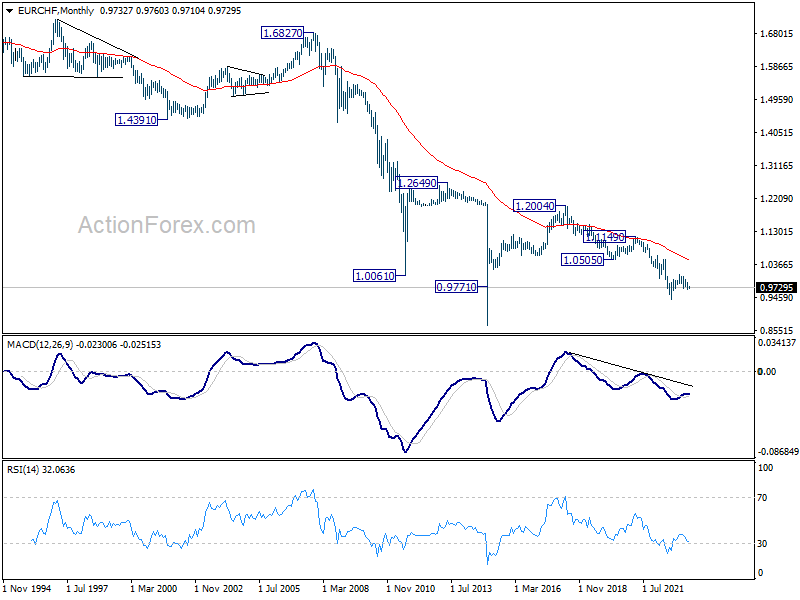
In the long term picture, it's still way too early too call for bullish trend reversal with upside capped well below 55 M EMA (now at 1.0484) and 1.0505 support turned resistance (2020 low). The multi-decade down trend could still continue.
RBA Board to Hold the Line at the June Meeting
The Reserve Bank Board meets next week on June 6. The meeting is live in that the case for a further rate increase is likely to be seriously discussed. However, we expect the Board to decide to hold the cash rate steady at 3.85% while continuing to emphasise its tightening bias.
The line: "Some further tightening of monetary policy may be required to ensure that inflation returns to target in a reasonable time frame, but that will depend on how the economy and inflation evolve" is likely to be repeated in the Governor's statement following the meeting.
Note that the qualifier "may be required" was used despite the Minutes for the May meeting showing that the Board had become more concerned about range of issues including: immigration; house prices; and the inflation forecast being to only reach the top of the target range by mid-2025.
Since the May Board meeting the Governor has been publicly voicing more concerns about inflation risks, particularly relating to wages.
However, it seems unlikely that he will choose to use stronger language than we saw in May. For example, stronger language would see "may be required" be replaced with "will be required".
There are still too many uncertainties for him to choose to strengthen the guidance.
In particular, the March quarter national accounts are set to be released on June 7 – the day after the Board meeting.
The May Board Minutes correctly highlighted concerns about household spending, members observing that "the outlook for consumption was weak."
Consumer spending slowed from 1% in the September quarter to 0.3% in the December quarter. Westpac notes that real retail sales contracted by 0.6% in the March quarter (compared to a decline of 'only' 0.3% in the December quarter) and vehicle sales have been flat while we have seen a marked deterioration in Westpac's debit and credit card activity.
Overall we are expecting consumer spending to be flat in the March quarter, held up by services spend, but there are clearly some downside risks. Even a flat outcome will be a disturbing result and something that the Board should treat with care.
Due to upside surprises for construction and equipment investment, the headline GDP result is still expected to be positive but come in at a tepid 0.2% growth for the quarter – only just avoiding a contraction. With uncertainty, particularly around net exports, inventories and services spend, the Board should be deliberating on the basis that a negative GDP result is entirely possible.
With Board meetings every month and given the rapid increase in rates since May last year waiting for the national accounts report seems to be the most prudent approach.
This report will also provide important updates on other areas of concern for the Board, including the savings rate; productivity; labour costs and inflation.
Other data since the May Board meeting also emphasises uncertainty – most notably, a surprise lift in the unemployment rate in April, from 3.5% to 3.7% . We assess that this increase has been due to seasonal anomalies in April associated with the timing of Easter but, once again, it would be prudent for the Board to wait for further information to clarify the employment data.
The quarterly growth rate of the Wage Price Index held at 0.8% in the March quarter – the same as December, which had slowed from 1.1% in the September quarter. That came as a surprise to most commentators who were expecting a modest lift in wage momentum. The contribution from wages set by 'individual arrangement' – a highly cyclical segment – also slowed. Against this, the just-announced 5.75% increase to the national minimum and award wage rates is higher than last year's average increase of 4.7% (and looks to be materially higher than Treasury's assumptions) but is broadly in line with what our aggregate wage growth forecasts were already implying for 2023.
The monthly inflation indicator showed an increase in annual inflation to 6.8% up from 6.3% in March. The average monthly increase in the indicator in the first three months of 2023 was 0.1% compared to the 0.8% for April. A significant part of the increase in annual inflation was explained by fuel – reflecting the temporary halving in excise duty introduced in April last year. However, the strong April month rise came from rents; house purchase costs; and holiday travel and accommodation.
Because the Board has discussed the stickiness of services as an issue offshore the 7.2% increase in travel and accommodation might raise a few eyebrows but this highly volatile series follows +27% in December; and -7.2%; -14.6%; and +1.5% in the following months. Some of the April rise is also clearly seasonal – even with COVID effects, the monthly history back to 2019 shows a consistent pattern of price gains in April (averaging +7%) and falls in May (averaging –5.7%).
Volatile month to month moves mean the April result is not sufficiently definitive to trigger an immediate rate response. The full picture for inflation in the quarter will be released on July 26, ahead of the August Board meeting.
We suspect the Board is still not recognising the full extent of the impact of rate tightening to date. It discusses the lagged effect of the rate hikes since May last year but does not set out just how much of this is yet to come through. As at March (the latest month available), the average mortgage rate on outstanding loans has only lifted by just over 225bps since the start of the cycle, despite a cash rate rise of 325bps (with a further 50bps in tightening since then). About 25bps of this gap reflects lags in the pass-through of official rate moves to borrowers on standard variable rates. The rest reflects the high proportion of borrowers, around 30%, on fixed rate loans.
Many of these borrowers are still only rates of 2-3% due to extraordinary fixed-rate offers that were available when the RBA was providing lenders with three-year money at 0.1%.
As these fixed rate loans mature and are rolled over into floating rate at 5-6%, the average mortgage rate will continue to increase. The combination of lagged effects from official passthrough and this roll-over effective mean average mortgage rates will lift close to 100bps by year end, with more modest rises coming in 2024. In effect even once the RBA goes on hold mortgage borrowers on average will still see significant effective rate increases through the rest of this year and next.
Another concerning drag on households has been the surge in rents. There appears to be angst in the Board about the impact of sharply rising rents on inflation but our estimates indicate that wider housing cost inflation is likely to moderate as growth in construction costs cools rapidly – outright price declines even possible given the downturn in new residential building (note the 8.1% drop in dwelling approvals in April, now down a steep 24.1% for the year).
With around 30% of households being renters, sharp increases in rents are likely to further constrain household spending. That said, rents are largely a transfer between households – hence rises will provide some offset to the cost of living and interest rate pressures bearing down on other households.
Overall, these developments still make a strong case for the Board to take an extended pause, to get a clearer picture on demand and inflation, and to allow the automatic further increases in average mortgage rates and the financial squeeze on renters to work their way through the economy.
From the perspective of inflation, weakening demand will put significant downward pressure on inflation and eventually ease the demand for labour and therefore the more persistent pressure on services inflation.
We remain comfortable with our 4% inflation forecast by year's end with no need for any further increases in the cash rate.
Markets are now pricing in a 100% chance of a further rate increase by August. The odds should probably be more evenly balanced than that given the extraordinary in-built lags in the system. Market pricing has already been wildly out of line on three occasions in this unique cycle: in June, October and May.
In terms of the global policy backdrop, FOMC speakers have effectively ruled out another move by the FOMC in June but markets are already speculating on a July move. In this cycle the FOMC is using a less effective instrument (the federal funds rate) than the RBA's cash rate given that US household borrow is typically on fixed-rate terms of 20-30 years - the federal funds rate operates primarily through business lending; credit card rates and asset market channels rather than directly through the cash-flow of the household sector. In this cycle, US households have been more resilient than we are seeing in Australia, allowing the RBA to achieve its objectives with a more moderate tightening cycle. Despite the significant gap that is opening up between the federal funds rate and the cash rate, the RBA should not be seeking to chase the FOMC.
Conclusion
There is too much uncertainty for the RBA Board to raise the cash rate again next week. In particular the outlook for household spending is very worrying especially with inbuilt lags associated with this unique cycle. An extended pause to allow full evaluation of these lags is the best policy.
Weekly Economic & Financial Commentary: The U.S. Avoids Default
Summary
United States: The U.S. Avoids Default
- This week, Congress and the president prevented what would have been the first default in U.S. history by agreeing to suspend the debt ceiling through the end of 2024. Despite a bewildering jobs gain that defied market expectations, data on balance continued to suggest that economic activity is slowing, albeit gradually.
- Next week: ISM Services (Mon), Trade Balance (Wed)
International: Canadian Growth Rebounds, Eurozone Inflation Trends Lower
- The Canadian economy advanced at a 3.1% annualized rate in the first quarter of 2023, boosted by household spending and strong exports. Meanwhile, Eurozone CPI data showed that headline and core inflation slowed more than consensus expectations. The headline rate slowed to 6.1% year-over-year, while the core measure that excludes more volatile items, such as food and fuel, decelerated to 5.3%.
- Next week: RBA Policy Rate & Australia GDP (Tue/Wed), BoC Policy Rate (Wed), Mexico CPI (Thu)
Credit Market Insights: Beige Book May Be Flashing Red Lights in the Future
- The Federal Reserve System's latest Beige Book showed that regional economies generally chugged along with little change over April and early May, but a slowdown is evident on the horizon, with some sectors already in decline.
Topic of the Week: The Mountains vs. Miami: Stacking Up the NBA and NHL Finalists
- This year's NBA and NHL finals are a mirror matchup between a top-seeded team from the Mountain West and an underdog team from Miami. Shiny hardware and eternal glory aside, how are the local economies poised to benefit from the finals festivities?
The Weekly Bottom Line: Hot GDP Report Adds to Case for a Rate Hike
U.S. Highlights
- Congress passes a deal to suspend the debt limit, averting the “worst case scenario” of a default.
- Today’s Nonfarm Payrolls Report featured a big jobs gain (+339k) and a pop in the unemployment rate (+0.3 percentage points).
- The health in the labor market is consistent with our view that policy easing won’t come until at least the first quarter of next year.
Canadian Highlights
- First quarter GDP growth expanded at an impressive 3.1% quarter-on-quarter (q/q) annualized pace, above consensus and the Bank of Canada’s April projection. Growth was powered by a surge in household spending.
- Monthly GDP growth was also better-than-expected in March, while Statcan’s preliminary estimate for April pointed to a surprisingly strong 0.2% month-on-month gain. Still, this leaves second quarter growth on track to slow to around 1% (q/q).
- The hotter-than-expected GDP print, alongside earlier indications of persistent inflation and labour market strength, signals that further action on rates by the Bank of Canada could be in the cards.
U.S. - Labor Market Stays Hot Despite Rising Unemployment Rate
With Congress passing a deal to suspend the debt limit and avoiding a default, all eyes were focused on this morning’s non-farm payrolls report. Hiring rose by a robust +339k, which came in well above the consensus forecast of 195k. Looking forward, markets are now expecting the Fed will have to keep rates higher for longer to cool the economy and inflation.
Turning to the specifics of debt ceiling deal, Congress passed the Fiscal Responsibility Act of 2023 which will suspend the debt ceiling for two years and avert a default on U.S. debt. The deal caps discretionary spending for 2024-2025 and will have a modest effect on reducing the deficit over that time horizon. Moreover, the overall impact on the economy should be modest with the peak impact coming in 2024 and the possibility of shaving 0.1% off GDP growth.
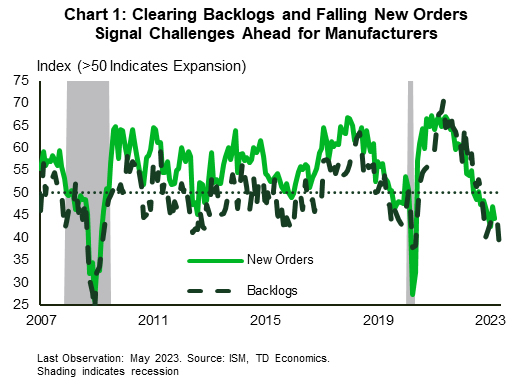
The economic data out this week showed U.S. manufacturing activity continues to feel the pinch from higher rates and a pullback in demand. The ISM manufacturing index registered a 46.9 reading – well short of the 50 print indicating growth. This is now the seventh consecutive month of contraction for the sector and the outlook in the coming months is decidedly gloomy. New orders contracted again (at a faster pace than the month prior) and the backlogs in business that have helped keep factories humming cleared at their fastest pace since the Global Financial Crisis (Chart 1). There was a silver lining to the report as the transportation sector did report an expansion for the month of May – helping it continue its recovery amid ongoing tight supplies. Indeed, despite vehicle sales in May coming in slightly below expectations (15.1 million annualized vs. the 15.3 million annualized expected) the details of the report show that pent-up demand is still being cleared and the industry remains undersupplied.
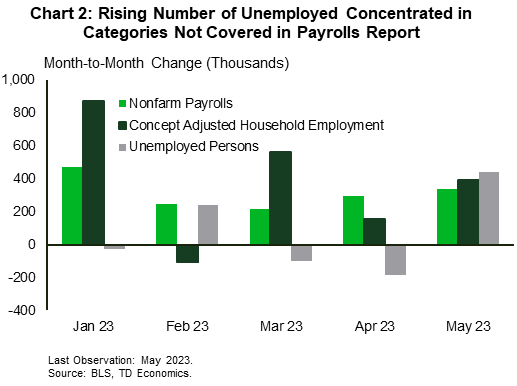
The weakness in the manufacturing sector was expected and stands in stark contrast to what’s happening across the rest of labor market. Nonfarm payrolls grew by 339k position in May, blowing past expectations for a more modest expansion of 195k. The bulk of the growth came from the services side – adding 257k positions in May – though construction (+25k) and government (+56k) all chipped in with healthy gains. However, this blowout print was accompanied by a 440k increase in the number of unemployed in the household survey – lifting the unemployment rate 30 basis points to 3.7%. Excluding the lockdown phase of the pandemic, this is the steepest rise in the jobless rate since November 2010. However, take the rise with a grain of salt, as the concept adjusted household employment that excludes categories like agricultural and household workers and adds in multiple job holders to make it comparable to the payrolls numbers, showed a still healthy 394k gain (Chart 2).
With this backdrop markets are as bracing for the possibility of another Fed hike by mid-summer and a delayed start to rate cuts. The need for rates to remain in restrictive territory for longer is in line with our view that policy easing won’t come until 2024Q1.
Canada – Hot GDP Report Adds to Case for a Rate Hike
Even with the significant tailwind of a new U.S. debt ceiling deal, Canadian equities were tracking lower (as of writing). Oil was an important part of this story. Indeed, the benchmark WTI oil price slid lower for much of the week (at one point pushing below $70/barrel), as Russia has made little progress on pledged output cuts and Chinese growth concerns continued to swirl. However, it did retrace a large portion of these losses at the end of the week on the strength of the debt ceiling pact.
A hotter-than-anticipated Canadian first quarter GDP report was the main data event of the week. GDP expanded at a 3.1% quarter-on-quarter annualized (q/q) pace - well above the 2.3% q/q rate for potential output growth estimated by the Bank of Canada in their latest Monetary Policy Report. This implies that the economy moved even further into excess demand in the early part of the year.
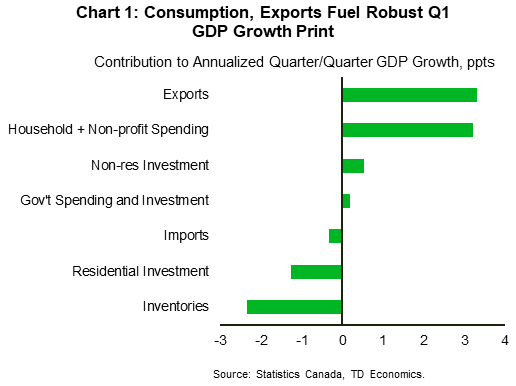
In the first quarter, the economy received a big helping hand from consumption, which vaulted higher by nearly 6% q/q. Passenger car sales surged, as rising auto production (amid improving global supply chains) fed pent-up demand for cars. Importantly, several expenditure categories identified by the Bank of Canada in past research as being sensitive to interest rates (like furniture, transportation services, food beverage/accommodation services, and communications spending) had solid performances.
The other big growth contributor was exports. Here too, the impact of better-functioning auto supply chains showed, as shipments of motor vehicles and parts soared 71% annualized, although gains across other categories were relatively broad-based. Elsewhere, positive contributions came from non-residential spending categories, although residential investment contracted significantly (Chart 1). The latter category is poised to turn from weighing on growth to adding to it in the second quarter, as both housing starts and home sales grew robustly in April.
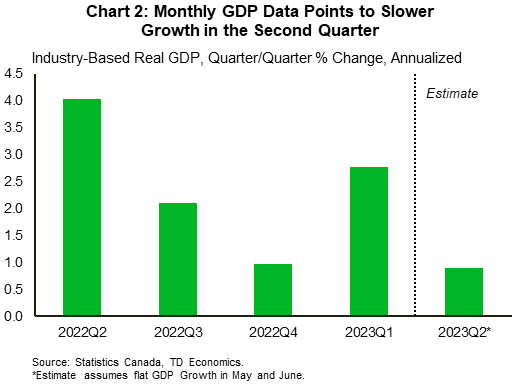
The other important part of the GDP report was the monthly, industry-based GDP data. In March, GDP growth was flat, which was better-than-the early estimate calling for a small dip. Meanwhile, Statcan’s preliminary estimate is that GDP expanded by 0.2% month-on-month in April – a positive surprise given the significant growth hit coming from the public sector workers strike that month. This data would point to second quarter growth slowing to around 1% q/q (Chart 2), which is more consistent with the Bank of Canada’s latest projection.
Earlier in the month we received data indicating that inflation is showing more persistence than anticipated, while strength in the labour market just won’t quit. Along with these data points, the hotter-than-expected GDP report swings the pendulum further towards action on rates by the Bank of Canada. Although it may be too early for policymakers to pull the trigger on another rate hike at next week's meeting (especially with another reading on the country’s employment situation due out just a few days after), if the data keep coming in hot, another move sometime this year is certainly on the table.
Forward Guidance: Canada May be in for Another Rate Hike—But July More Likely than June
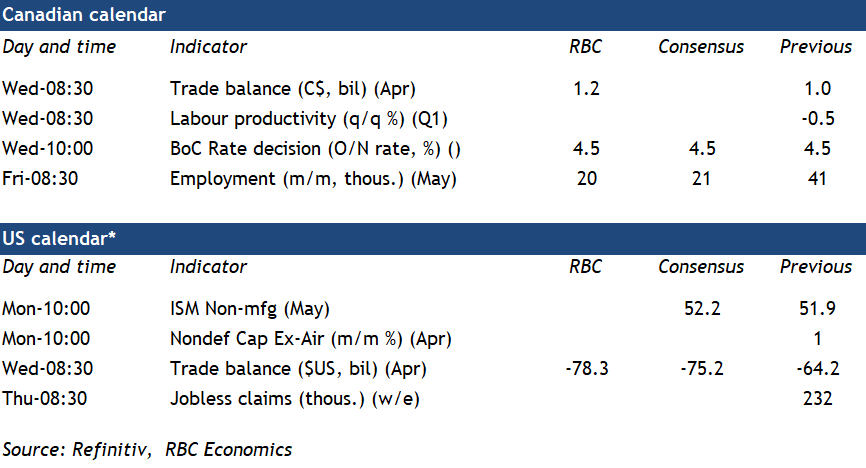
The economy’s resilient start to 2023 likely has the Bank of Canada actively considering raising interest rates next week. But we think it will ultimately maintain the pause in hikes that began in January, keeping the overnight rate steady at 4.5% for now. The advance estimate of April GDP bounced back sharply after little growth in February and March (controlling for the impact of the large federal workers strike in April). Growth in the first quarter also came in slightly firmer than expected this week thanks to still strong consumer spending and a big boost from exports. So far this year, unemployment hasn’t budged from exceptionally low levels. Home resale markets look like they bottomed out earlier than previously feared, and inflation surprised on the upside in April.
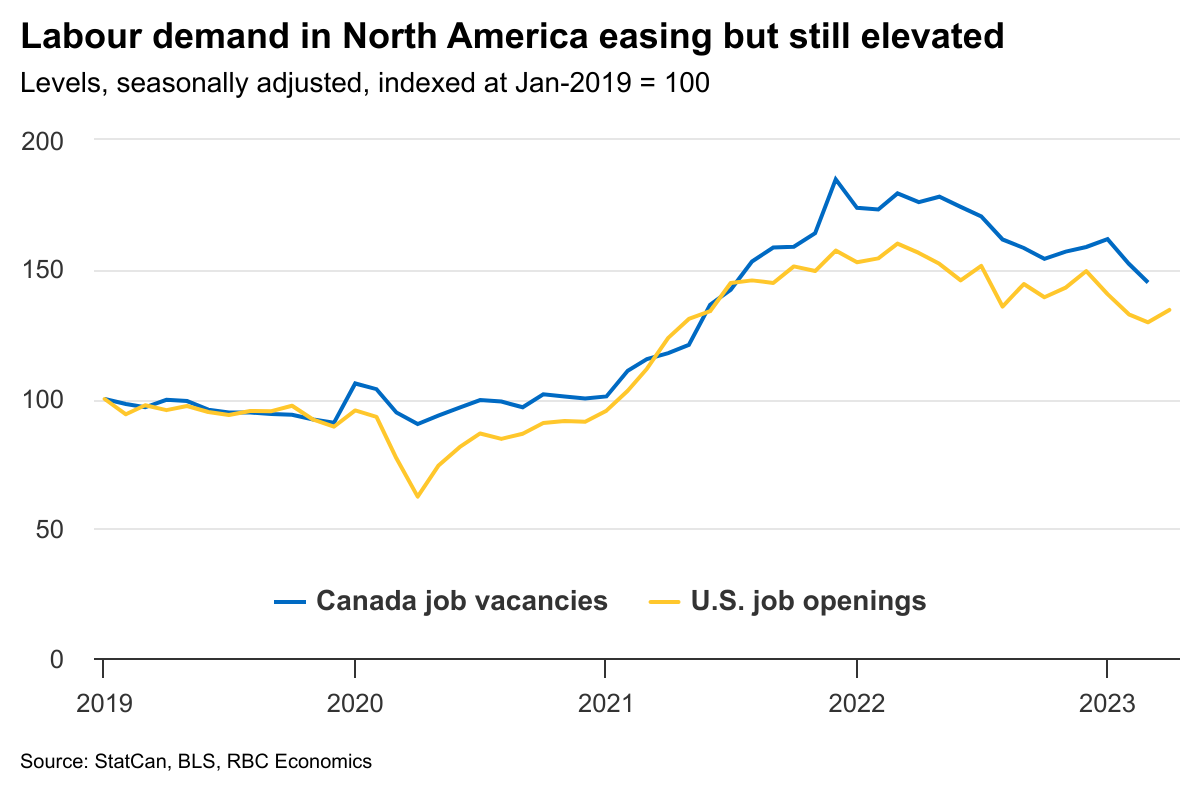
Still, there are signs that cracks are forming under the surface. Labour markets are still running strong, partly due to a surge in population growth that’s increasing both consumer demand and available labour supply. We expect May employment in Canada to post another increase of 20,000, building on the ~250,000 surge between January and April. But the unemployment rate is still expected to tick higher, as the amount of ‘excess’ labour demand continues to ease. Job vacancies are down almost 20% from peak levels as of March, consumer delinquencies have been edging higher, and worker quit rates have been slowing in recent months..
The 425 basis points worth of BoC rate hikes since March 2022 will ultimately take a broader toll in the form of higher unemployment and lower GDP—even if it’s taking longer than previously thought. But with inflation still running hot, the BoC won’t be able to wait too long if recent positive momentum persists. Two additional employment reports, one more inflation report, and the always closely-watched Business Outlook Survey will all be released in between policy decisions in June and July. Further signs that higher interest rates aren’t slowing the economy as expected would tip the scales towards a hike in July, even if the BoC opts to stick with its pause next week.
Week ahead data watch
The Canadian trade surplus likely edged slightly higher in April. An increase in oil prices (subsequently reversed in May) will raise the value of April exports more than imports. Imports of consumer goods (soft in March, but in part due to reversal of an earlier surge in pharmaceutical imports) and equipment imports will be watched closely for any signs domestic demand is softening.
Previously released advance estimates for the U.S. goods trade balance showed a widening deficit, from US$82.7B in March to US$96.8B in April driven by lower exports. We look for a wider U.S. trade deficit in April, with total exports declining by 3.7% and imports rising 1.4%.
Week Ahead – Will OPEC+ Announce Another Cut? Deflationary Spiral in China?
OPEC+
Oil prices are rallying at the end of the week, perhaps a sign of nerves appearing before the OPEC+ meeting this weekend. While there seems to be a widely held view that the group won’t announce any further cuts, it’s worth noting that the same was true at the last meeting when it announced cuts of roughly another million barrels.
And while there have been comments to suggest the alliance isn’t likely to cut output this weekend, it’s hard to ignore the warnings from the Saudi energy minister to “watch out”, threatening more “ouching” for short speculators. This may be playing into the mind of traders fearing another surge on the open next week.
US
The US Federal government will not run out of cash and can pay its bills on Monday. Now that the debt ceiling drama is over, the focus shifts back to how resilient this economy is and will the disinflation process resume.
Economic data for the week will focus on the service sector, trade deficit, and jobless claims. The ISM services index is expected to show service sector activity improved from 51.9 to 52.5. Trade data should show the deficit widened. Jobless claims are expected to surge at some point and that will lead to cooling wage pressures and support the case that disinflation trends are firmly entrenched.
The Fed’s blackout period is here, so appearances will stop until the June 14 FOMC decision.
Eurozone
Next week offers plenty of economic data but nothing that will move the needle as far as the ECB is concerned. ECB speak may be of more interest ahead of the next meeting on 15 June when the central bank may hike rates for the final time. The inflation data for May was surprisingly good but the next few months may be less so given some of the more unfavourable base effects.
UK
There’s very little on the agenda next week with the final services PMI the only notable release. All the focus now is on the inflation data and BoE rate decision a couple of weeks after.
Russia
The Russian central bank is expected to leave rates unchanged on Friday. The decision comes hours before the release of the May CPI inflation data which is expected to be marginally higher than the previous month at 2.4%.
South Africa
GDP data is released on Tuesday and will tell us whether the economy is already in recession after an aggressive tightening cycle. The data has been very volatile in recent quarters.
Turkey
With the Presidential election behind us, focus switches back to the economy and the CBRT’s ongoing unorthodox monetary policy approach. Next week we get inflation data which is expected to slip back below 40% but remain extraordinarily high.
Switzerland
A couple of economic releases of note next week, CPI for May being the standout. Inflation is expected to slip back to 2.2% which remains above the SNB target but only marginally so. Markets are pricing in a more than 80% probability of a hike at the next meeting on 22 June.
China
With another month of weak official NBS Manufacturing PMI data for May, market participants will turn their attention towards the Caixin Services PMI (consists of more data from small and medium enterprises) out on Monday; the forecast is pegged at 55, a dip from 56.4 in April. If it turns out as forecast, it will mark two consecutive months of growth slowdown from March’s 28-month high of 57.8.
On Wednesday, we will have trade and foreign exchange reserves data for May. Another month of lackustre trade numbers is expected, exports growth is seen slowing further to 7% year-on-year from 8.5% in April while a slight improvement is anticipated in imports to narrow its contraction to -5% year-on-year from -7.9% printed in April. If these trade data come in as forecasted, it is likely to cement a weakening global and internal demand environment.
A further decline in the respective input and output prices sub-components of the latest NBS Manufacturing and Non-Manufacturing PMIs data for May has increased the risk of a deflationary spiral taking shape in China. The paramount focus will be on May’s consumer inflation and PPI (factory gate prices) to be released on Friday. Another month of weak readings are expected, 0.2% year-on-year for consumer inflation rate vs. 0.1% in April and -2.8% year-on-year for PPI vs. -3.6% in April.
If this latest set of key economic data continues to come in below expectations it points to a further growth deceleration in China. Policymakers may need to rethink their current targeted expansionary and accommodative fiscal and monetary policies stances.
India
The services PMI will be out on Monday and is forecast at 60.5, a dip from 62.0 recorded in April which was the strongest reading since June 2010.
India’s central bank, the RBI, will release its latest monetary policy decision on Thursday, the consensus is expecting no change in the benchmark policy repo rate at 6.5% after a surprise pause in April that came after six consecutive interest rate hikes.
On Friday, we will get industrial production for April where a slight dip to 1% year-on-year is being forecasted from 1.1% in March, its lowest growth since October 2022.
Australia
Several key data and events to focus on. On Monday, Melbourne Institute (MI) will release its latest monthly inflation gauge report for May where it is expected to show an increase to 0.4% month-on-month after a dip to 0.2% in April, a four-month low.
Australia’s central bank, the RBA, will release its latest monetary policy decision on Tuesday. No change is expected leaving the cash rate at 3.85% after a surprise hike of 25 basis points during the prior meeting in May that pushed up borrowing costs to their highest level since April 2012.
Q1 GDP growth will be released on Wednesday, expected to be 0.3% quarter-on-quarter vs. 0.5% in Q4 2022 and 2.4% year-on-year vs. 2.7% in Q4 2022. To round off the week, trade data for April will be released on Thursday; a decline is forecast for its trade surplus to A$11.7 billion from A$15.27 billion recorded in March, its largest surplus since June 2022.
New Zealand
A quiet week where we will have two key data to focus on; Q1 manufacturing sales on Tuesday where the forecast is set for a return to growth at 1.5% year-on-year from a contraction of -9.9% recorded in Q4 2022.
On Friday, we will have manufacturing PMI for May where a slight improvement is being forecasted at 49.9 vs. 49.1 printed in April.
Japan
Several key data to focus on to determine whether the ongoing growth recovery is sustainable following robust surveys on the manufacturing and services sectors for May.
On Tuesday, we will have household spending for April where an improvement is being forecasted; -0.9% year-on-year from -1.9% in March, -0.2% month-on-month from -0.8% in March. Data on average cash earnings will also be released on the same day, forecast is set for a slight improvement to 0.9% year-on-year for April from 0.8% recorded in March.
On Wednesday, the preliminary reading for the leading economic index for April is expected to show an improvement at 98.2 from 97.7 in March.
On Thursday, the current account for April, finalised Q1 GDP, and bank leading for May will be released. A slight improvement is forecast for bank lending at 3.3% year-on-year in May from 3.2% in April. If it turns out as forecasted, it will be a retest on its 22-month high of 3.3% in loans growth recorded in February.
Singapore
Two key data to focus on. Firstly, retail sales for April where a further decline in growth is being forecast; 3.1% year-on-year vs. 4.5% in March and 0.5% month-on-month from 2.2% in March.
Secondly, foreign exchange reserves data for May is forecast to be almost the same at S$416 billion from S$416.3 billion recorded in April; its largest figure since June 2022.
Economic Calendar
Sunday, June 4
Economic Events
- OPEC+ production meeting: Expected to keep output at current levels or slightly lower them.
Monday, June 5
Economic Data/Events
- US factory orders, ISM services
- China Caixin services PMI
- Eurozone Services PMI, PPI
- Singapore retail sales
- ECB President Lagarde appears at European Parliament’s Committee on Economic and Monetary Affairs
- Apple’s Worldwide Developers week-long conference begins
- Week-long maintenance starts for the Turkstream pipeline, which carries Russian gas to Turkey and southeastern Europe
Tuesday, June 6
Economic Data/Events
- RBA rate decision: Expected to keep rates steady at 3.85%
- Australia current account
- Eurozone retail sales
- Germany factory orders
- Japan household spending
- Mexico international reserves
- Poland rate decision: Expected to keep rates steady at 6.75%
- South Africa GDP
- Spain industrial production
- Thailand CPI
Wednesday, June 7
Economic Data/Events
- US trade, consumer credit
- BOC rate decision: Expected to keep rates steady at 4.50%
- Australia GDP
- Chile copper exports, trade
- China forex reserves, trade
- France trade
- Germany industrial production
- Greece GDP
- UK PM Rishi Sunak visits President Biden in Washington
- EIA crude oil inventory data
- OECD releases latest global economic outlook
- ECB’s Holzmann presents the Austrian financial stability report
- RBA Gov Lowe delivers a speech at Morgan Stanley Australia Summit in Sydney
- RBA Deputy Governor Bullock speaks at Australian Banking Association Annual Conference
Thursday, June 8
Economic Data/Events
- US wholesale inventories, initial jobless claims
- Australia trade balance
- Bulgaria GDP
- Chile CPI
- Eurozone GDP
- India rate decision: Expected to keep rates steady at 6.50%
- Japan GDP
- Mexico CPI
- Peru rate decision
- Saudi Arabia GDP
- South Africa manufacturing production, current account
- Bank of Italy reports on balance sheet aggregates
Friday, June 9
Economic Data/Events
- Canada unemployment
- China aggregate financing, PPI, CPI, money supply, new yuan loans
- Italy industrial production
- Japan M2 money stock
- Mexico industrial production
- Russia rate decision: Expected to keep rates steady at 7.50%
- Russia CPI
- Turkey industrial production
Sovereign Rating Updates
- Greece (Fitch)
- Spain (DBRS)