Sample Category Title
EUR/CHF Daily Outlook
Daily Pivots: (S1) 0.9716; (P) 0.9744; (R1) 0.9760; More...
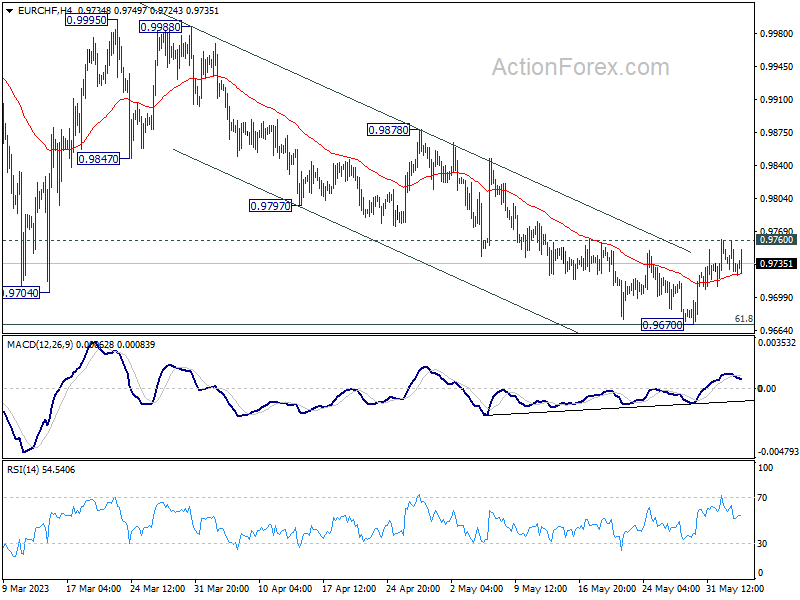
Intraday bias in EUR/CHF stays neutral at this point. On the upside, firm break of 0.9760 should confirm short term bottoming after hitting 61.8% retracement of 0.9407 to 1.0095 at 0.9670. Intraday bias will be back on the upside for 0.9878 resistance next. However, sustained break of 0.9670 will extend the whole decline from 1.0095 towards 0.9407 low instead.
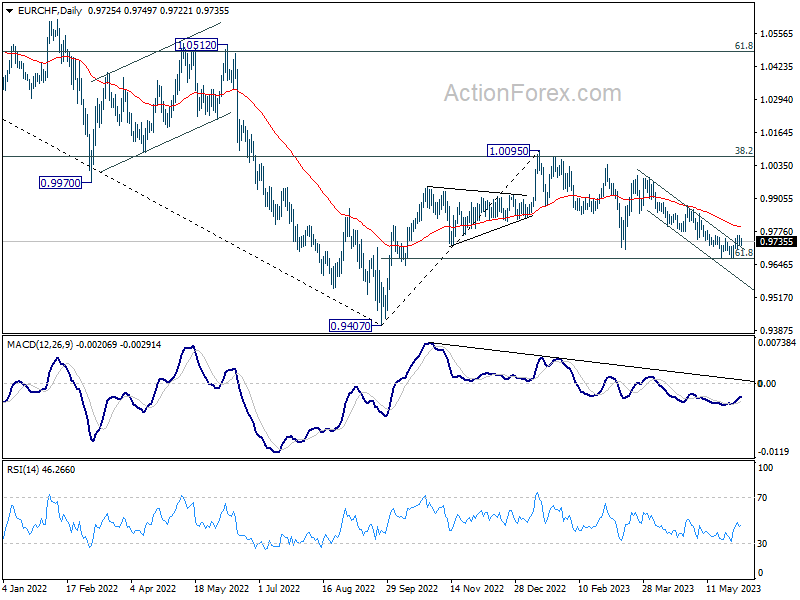
In the bigger picture, prior rejection by 38.2% retracement of 1.1149 to 0.9407 at 1.0072 suggests that medium term outlook is staying bearish. The pair is also capped below 55 W EMA (now at 0.9938). Down trend from 1.2004 (2018 high) is not completed yet and is in favor to resume through 0.9407 at a later stage. However, decisive break of 1.0095 resistance will raise the chance of bullish trend reversal. Rise from 0.9407 should then target 1.0505 cluster resistance (2020 low at 1.0505, 61.8% retracement of 1.1149 to 0.9407 at 1.1484).
EURUSD Slips Below 1.07 Again as Rebound Falters
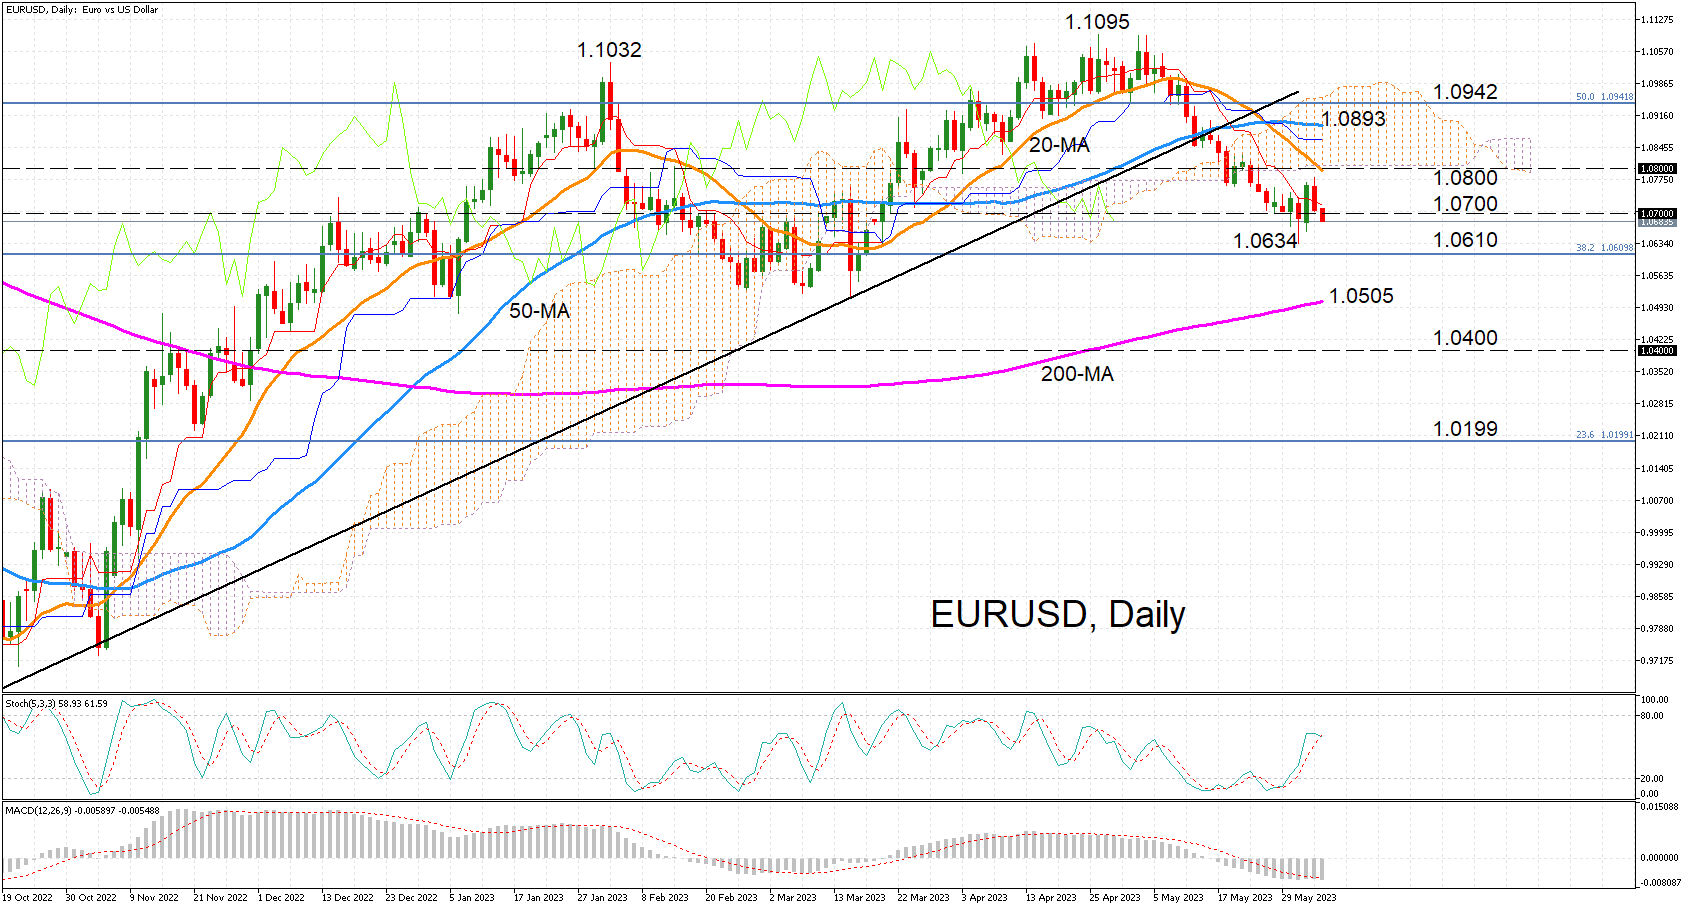
EURUSD is back under selling pressure as the rebound from last week’s two-month low of 1.0634 has suffered an early setback. The 1.0700 handle is in danger of being surrendered again as the momentum indicators aren’t looking very encouraging right now.
The fast stochastic oscillator (%K) is about to cross below the slow stochastic (%D), while the MACD has slid back below its red signal line.
If the bearish bias persists in the short term, the 38.2% Fibonacci retracement of the January 2021-September 2022 at 1.0610 is the next major support that could prop up prices. But should it fail, attention would quickly turn to the 200-day simple moving average (SMA) just above 1.0500, which also coincides with the lows from January and March. Even lower, the 1.0400 level could be targeted, before the 23.6% Fibonacci of 1.0199 comes into range.
However, if the pair is able to find its footing and bounces higher, there could be trouble in the 1.0800 region as both the 20-day SMA and the bottom of the Ichimoku cloud are barricading this area. A successful entry into the cloud would not be problem free as the 50-day SMA is hovering around 1.0893 and the 50% Fibonacci is positioned slightly higher at 1.0942.
To sum up, EURUSD’s downside correction doesn’t appear to be over yet, and should it extend all the way until the 200-day SMA, the bullish medium-term outlook would be at risk of switching to bearish. Moreover, unless the price can top the April peak of 1.1095 soon, the pair could be stuck in a consolidation phase.
Gold Price and Crude Oil Price Weekly Chart Outlook
Gold price remains supported for more gains above $2,000. Crude oil price is declining and might dive if there is a break below $65.00.
Important Takeaways for Gold and Oil Prices Analysis Today
- Gold price rallied toward $2,080 before it started a downside correction against the US Dollar.
- It is now trading above a connecting bullish trend line with support near $1,940 on the weekly chart of gold at FXOpen.
- Crude oil prices are moving lower below $83.75 support.
- There was a break below a major bullish trend line with support near $90.00 on the weekly chart of XTI/USD at FXOpen.
Gold Price Technical Analysis
On the weekly chart of Gold at FXOpen, the price started a fresh increase above the $1,870 resistance. The price gained pace and rallied above the $2,000 level.
There was a close above the 50-week simple moving average. It even surpassed $2,050 and tested $2,080. A high was formed near $2,081 before there was a downside correction. There was a move below the 23.6% Fib retracement level of the upward move from the $1,804 swing low to the $2,081 high.
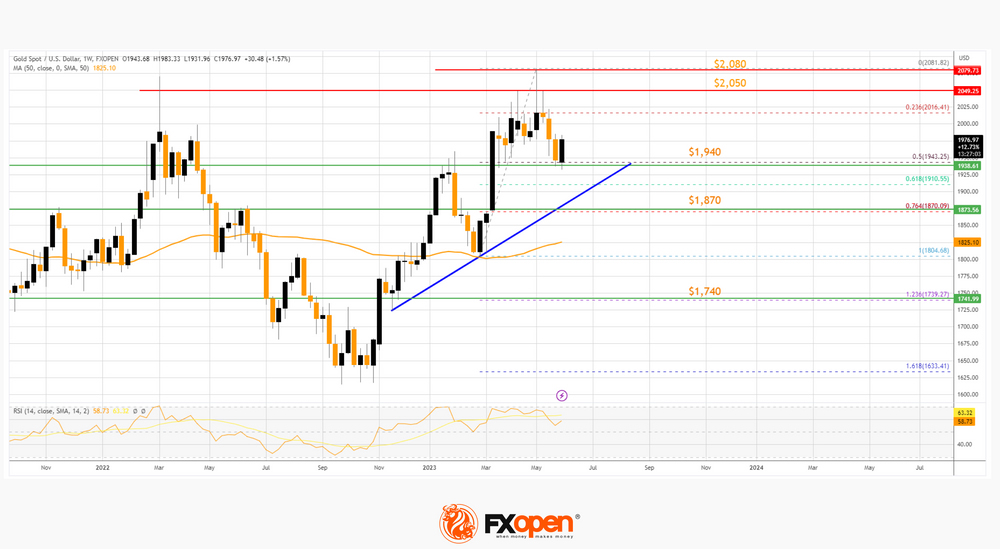
The price tested the 50% Fib retracement level of the upward move from the $1,804 swing low to the $2,081 high at $1,940.
The price is also trading above a connecting bullish trend line with support near $1,940. If there is a downside break, the price might decline toward the $1,870 support. The next major support is near $1,740, below which the bulls could aim for a test of $1,660.
On the upside, the price might face resistance near the $2,050 level. The next major resistance is near the $2,080 level. An upside break above the $2,080 resistance could send Gold price toward $2,120. Any more gains may perhaps set the pace for an increase toward the $2,200 level.
Oil Price Technical Analysis
On the weekly chart of WTI Crude Oil at FXOpen, the price climbed higher steadily above the $83.75 resistance against the US Dollar. It even broke the $100 barrier before the bears appeared near $120.
A high was formed near $126.37 and there was a downward move. There was a break below a major bullish trend line with support near $90.00. The price declined below the 50-week simple moving average and RSI dropped below 50.
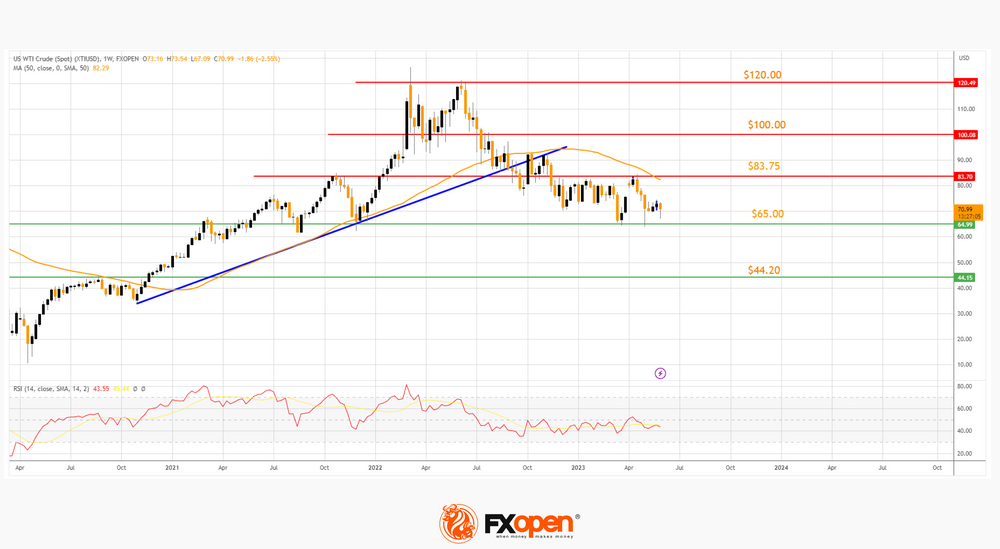
There was a move below the 23.6% Fib retracement level of the key increase from the $10.42 swing low to the $126.37 high. It is now consolidating above $65.
The bulls are protecting the 50% Fib retracement level of the key increase from the $10.42 swing low to the $126.37 high. On the upside, the first major resistance is near the 50-week simple moving average at $83.75.
The next major resistance is near the $100.00 level. Any more gains might send the price toward the $120.00 level in the coming weeks.
On the downside, support is near the $65.00 level. The next major support on the WTI crude oil chart is near $44.20. If there is a downside break, the price might decline toward $38.00. Any more losses may perhaps open the doors for a move toward the $25.00 support zone.
AUD/USD Technical Analysis
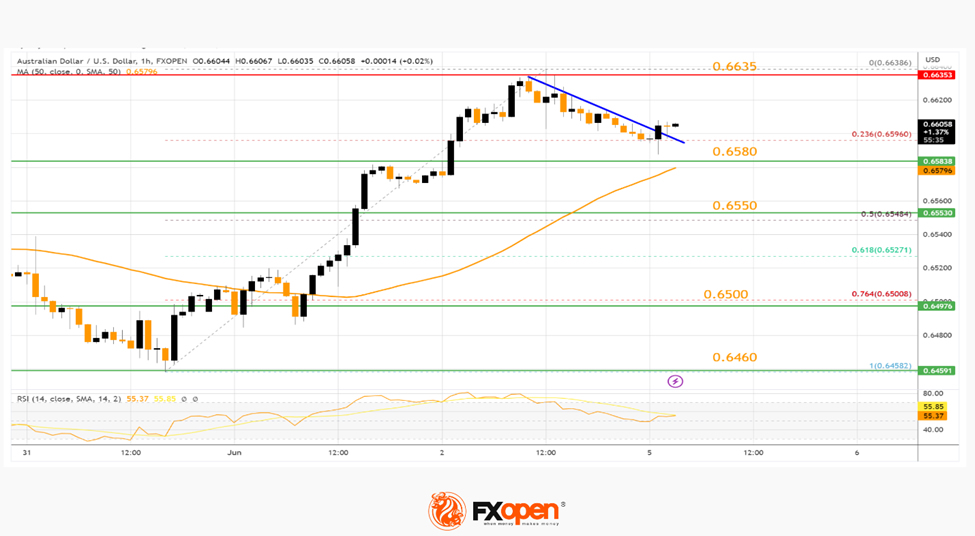
On the hourly chart of AUD/USD at FXOpen, the pair started a fresh increase from the 0.6460 support. The Aussie Dollar traded above the 0.6500 resistance to move into a positive zone.
The pair climbed above the 0.6580 resistance zone and the 50-hour simple moving average. It traded as high as 0.6638 and is currently consolidating gains. It is attempting another increase from the 0.6580 support zone.
The first key resistance is near 0.6635. If there is an upside break above the 0.6635 zone, the pair could rise steadily toward the 0.6660 level. Any more gains might send AUD/USD toward 0.6700.
On the downside, there is a decent support near the 0.6580 level. A downside break below the 0.6580 support might open the doors for a test of the 0.6550 support. Any more losses might send AUD/USD toward the 0.6500 support.
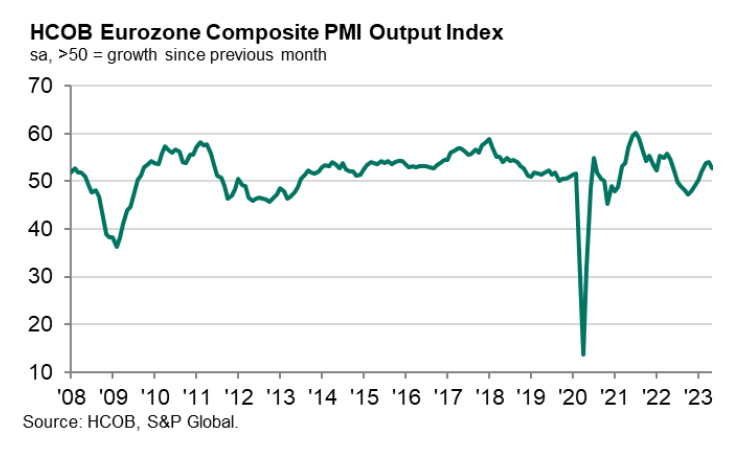
Eurozone PMI composite finalized at 52.8, manufacturing downside to be reflected in services slowdown
Eurozone PMI Services was finalized at 55.1 in May, down from April's 56.2. PMI Composite was finalized at 52.8, down notably from April's 54.1. HCOB noted that services activity growth stayed strong, but factory output fell at the quickest pace in six months.
Looking at some countries, Spain PMI Composite (55.2), Italy (52.0) and France (51.2) were at 4-month low. Germany was at 53.9, a 2-month low.
Cyrus de la Rubia, Chief Economist at Hamburg Commercial Bank, said: "Relatively resilient services activity growth should ensure that the eurozone regains some footing and shows a positive rate of expansion in the second quarter after GDP stagnated in the October - March period.
"However, the downturn in manufacturing is a drag on economic growth and is likely to be reflected in a further slowdown in the services sector in the coming months. We do not anticipate an overall economic recession, though."
USD/CAD Daily Outlook
Daily Pivots: (S1) 1.3405; (P) 1.3430; (R1) 1.3454; More....
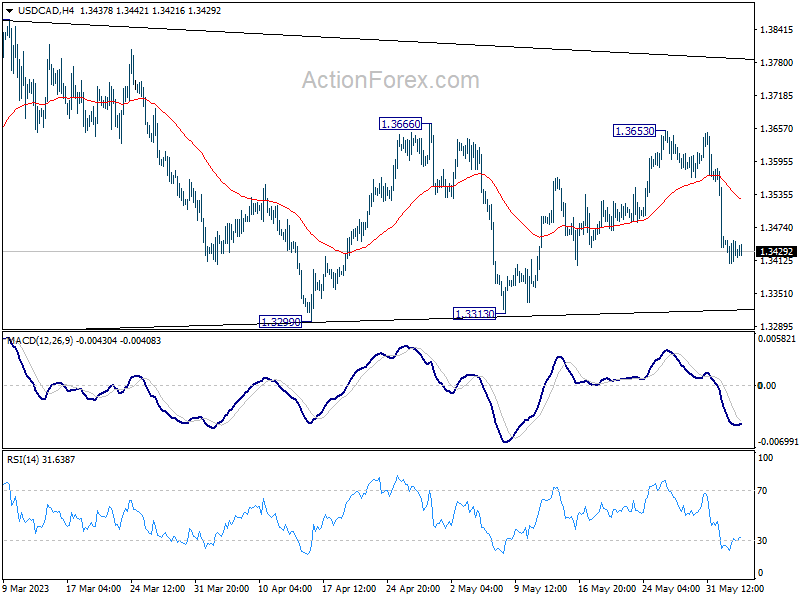
Intraday bias in USD/CAD stays neutral for the moment. Price actions from 1.3976 are seen as a triangle consolidation pattern. Above 1.3666 will target 1.3860 resistance first. Firm break of 1.3860 will argue that larger up trend is ready to resume through 1.3976 high. Nevertheless, sustained break of 1.3229 will dampen this view and turn near term outlook bearish.
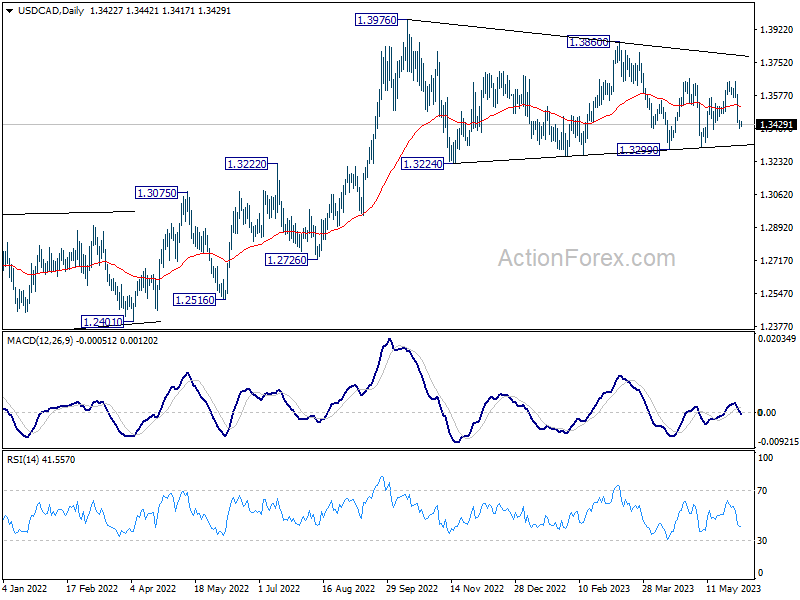
In the bigger picture, rise from 1.2005 (2021 low) is expected to resume through 1.3976 after consolidation from there completes. On decisive break of 1.3976, next target will be 1.4667/89 long term resistance zone. This will remain the favored case as long as 38.2% retracement of 1.2005 to 1.3976 at 1.3233 holds.
AUD/USD Daily Report
Daily Pivots: (S1) 0.6566; (P) 0.6602; (R1) 0.6643; More...
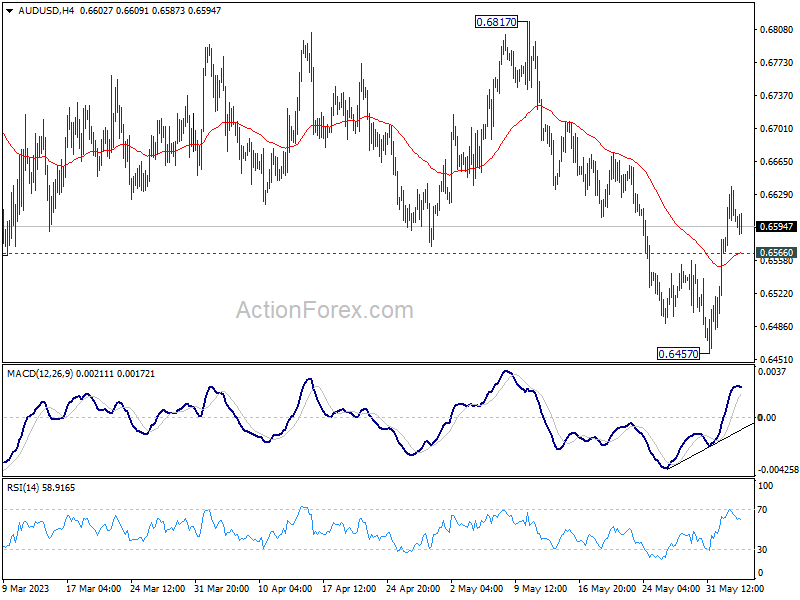
Intraday bias in AUD/USD stays mildly on the upside at this point. Rebound from 0.6457 would target 55 D EMA (now at 0.6659). Sustained break there will target 0.6817 resistance next. Nevertheless, rejection by 55 D EMA will keep near term outlook bearish. Below 0.6566 minor support will turn bias back to the downside for retesting 0.6457 low.
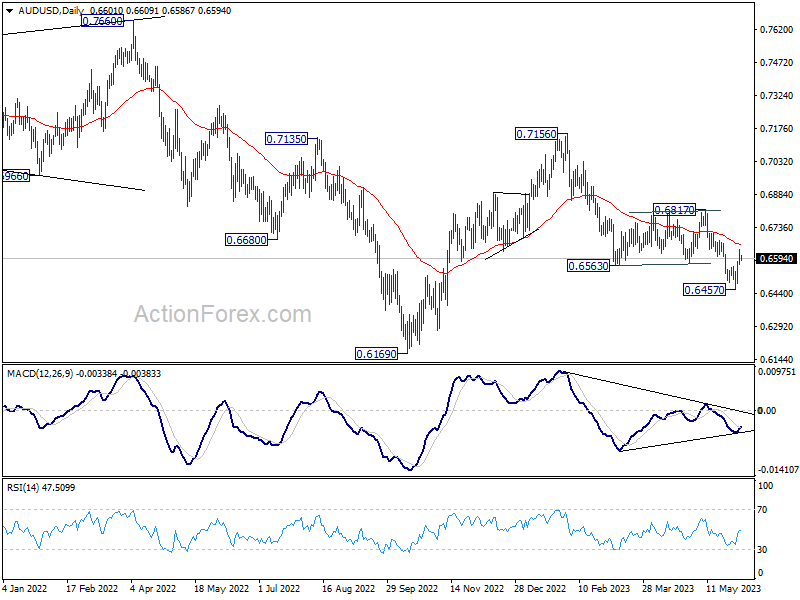
In the bigger picture, rejection by 55 W EMA (now at 0.6811) keeps medium term outlook bearish. Current development suggests that down trend from 0.8006 (2021 high) is possibly still in progress. Retest of 0.6169 (2022 low) should be seen next. Firm break there will confirm down trend resumption. For now, this will remain the favored case as long as 0.6817 resistance holds.
EUR/USD Daily Outlook
Daily Pivots: (S1) 1.0682; (P) 1.0731; (R1) 1.0756; More...
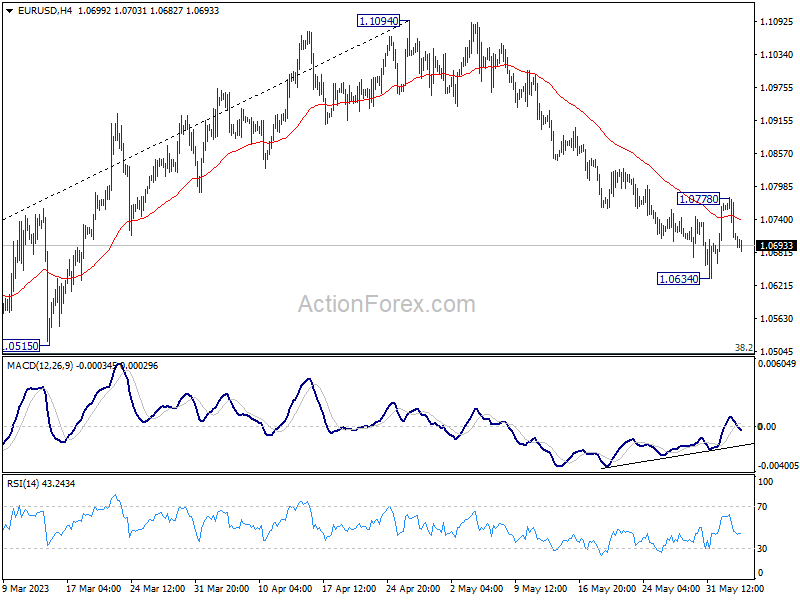
Intraday bias in EUR/USD remains neutral for the moment. On the downside, break of 1.0634 will resume the corrective decline from 1.1094. Deeper fall should then be seen to 1.0515 cluster support, 38.2% retracement of 0.9534 to 1.1094 at 1.0498. On the upside, however, above 1.0778 will resume the rebound from 1.0634 short term bottom to 55 D EMA (now at 1.0829).
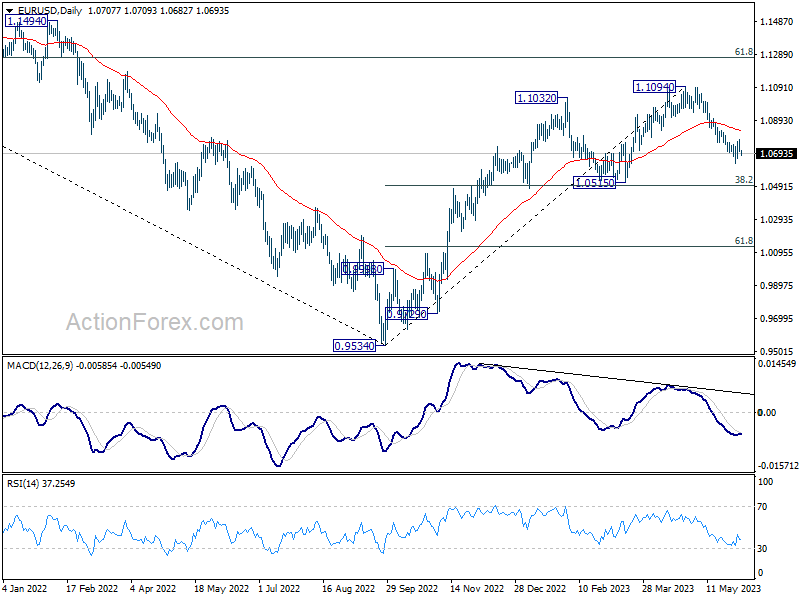
In the bigger picture, as long as 1.0515 support holds, rise from 0.9534 (2022 low) would still extend higher. Sustained break of 61.8% retracement of 1.2348 (2021 high) to 0.9534 at 1.1273 will solidify the case of bullish trend reversal and target 1.2348 resistance next (2021 high).
GBP/USD Daily Outlook
Daily Pivots: (S1) 1.2414; (P) 1.2480; (R1) 1.2517; More...
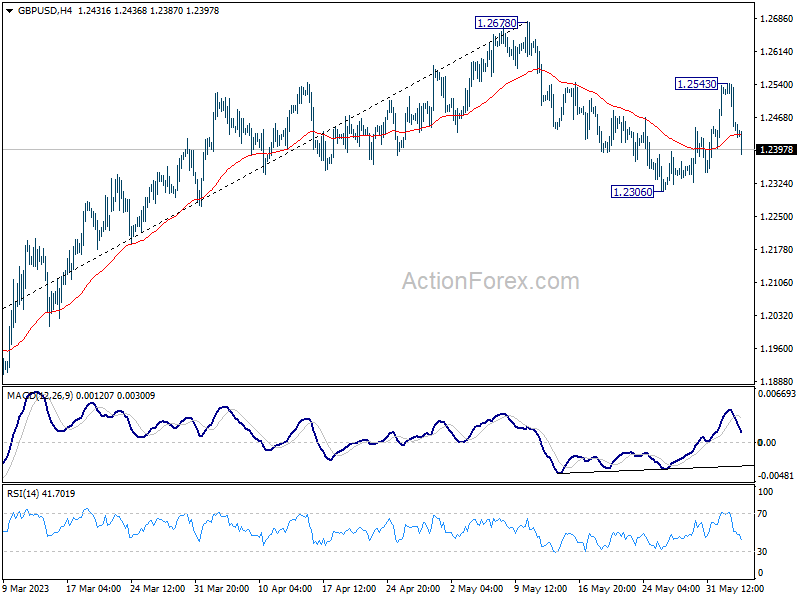
Intraday bias in GBP/USD remains neutral for the moment. on the downside, break of 1.2306 will resume the correction from 1.2678. Deeper decline would then be seen to 1.1801 cluster support (38.2% retracement of 1.0351 to 1.2678 at 1.1789). On the upside, above 1.2543 will resume the rebound from 1.2306 to retest 1.2678 high.
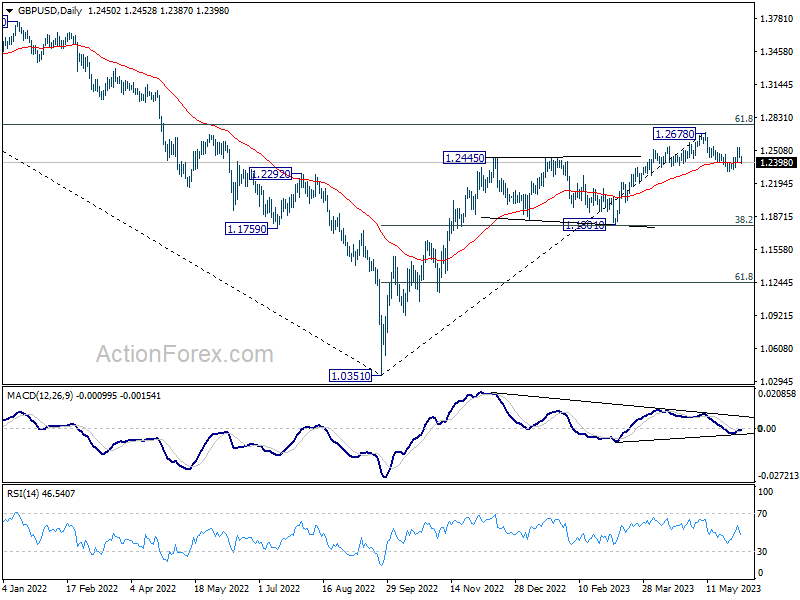
In the bigger picture, as long as 1.1801 support holds, rise from 1.0351 medium term bottom (2022 low) is expected to extend further. Sustained break of 61.8% retracement of 1.4248 (2021 high) to 1.0351 at 1.2759 will add to the case of long term bullish trend reversal. However, firm break of 1.1801 will indicate rejection by 1.2759, and bring deeper decline, even as a correction.
USD/CHF Daily Outlook
Daily Pivots: (S1) 0.9052; (P) 0.9072; (R1) 0.9110; More...
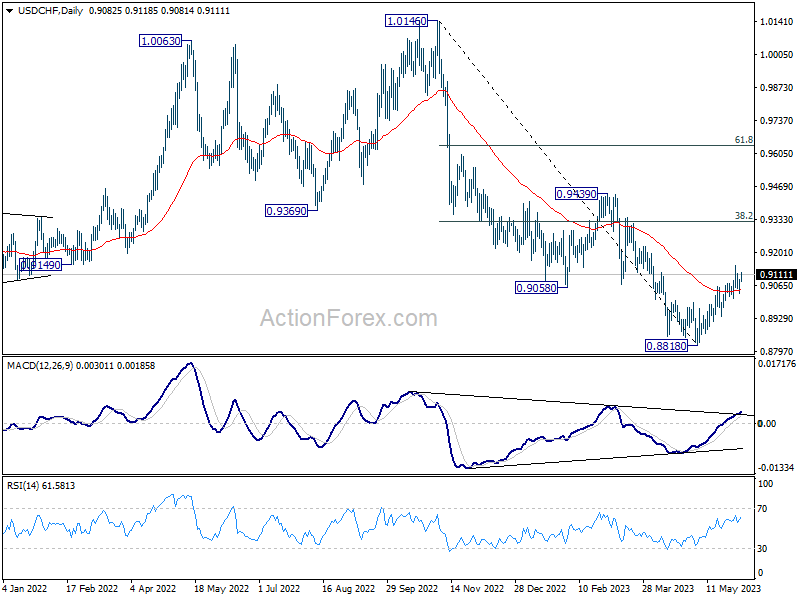
Intraday bias in USD/CHF remains neutral as consolidations from 0.9146 could extend. But further rally is expected as long as 0.9013 minor support holds. Rise from 0.8818 short term bottom is seen as corrective whole down trend from 1.0146. Above 0.9146 will target 38.2% retracement of 1.0146 to 0.8818 at 0.9325. On the downside, however, break of 0.9013 will turn bias back to the downside for retesting 0.8818 low instead.
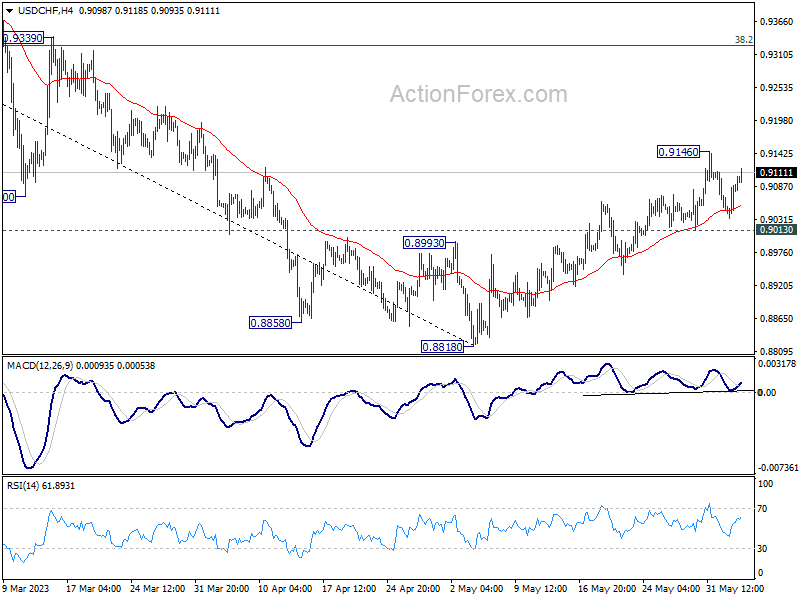
In the bigger picture, fall from 1.1046 (2022 high) is seen as a leg in the long term range pattern from 1.0342 (2016 high), which might have completed at 0.8818 already, just ahead of 0.8756 long term support. Sustained trading above 0.9058 support turned resistance should confirm medium term bottoming. Further break of 0.9439 resistance will confirm bullish trend reversal.