Sample Category Title
Gold Breaches Trendline as Sentiment Sours
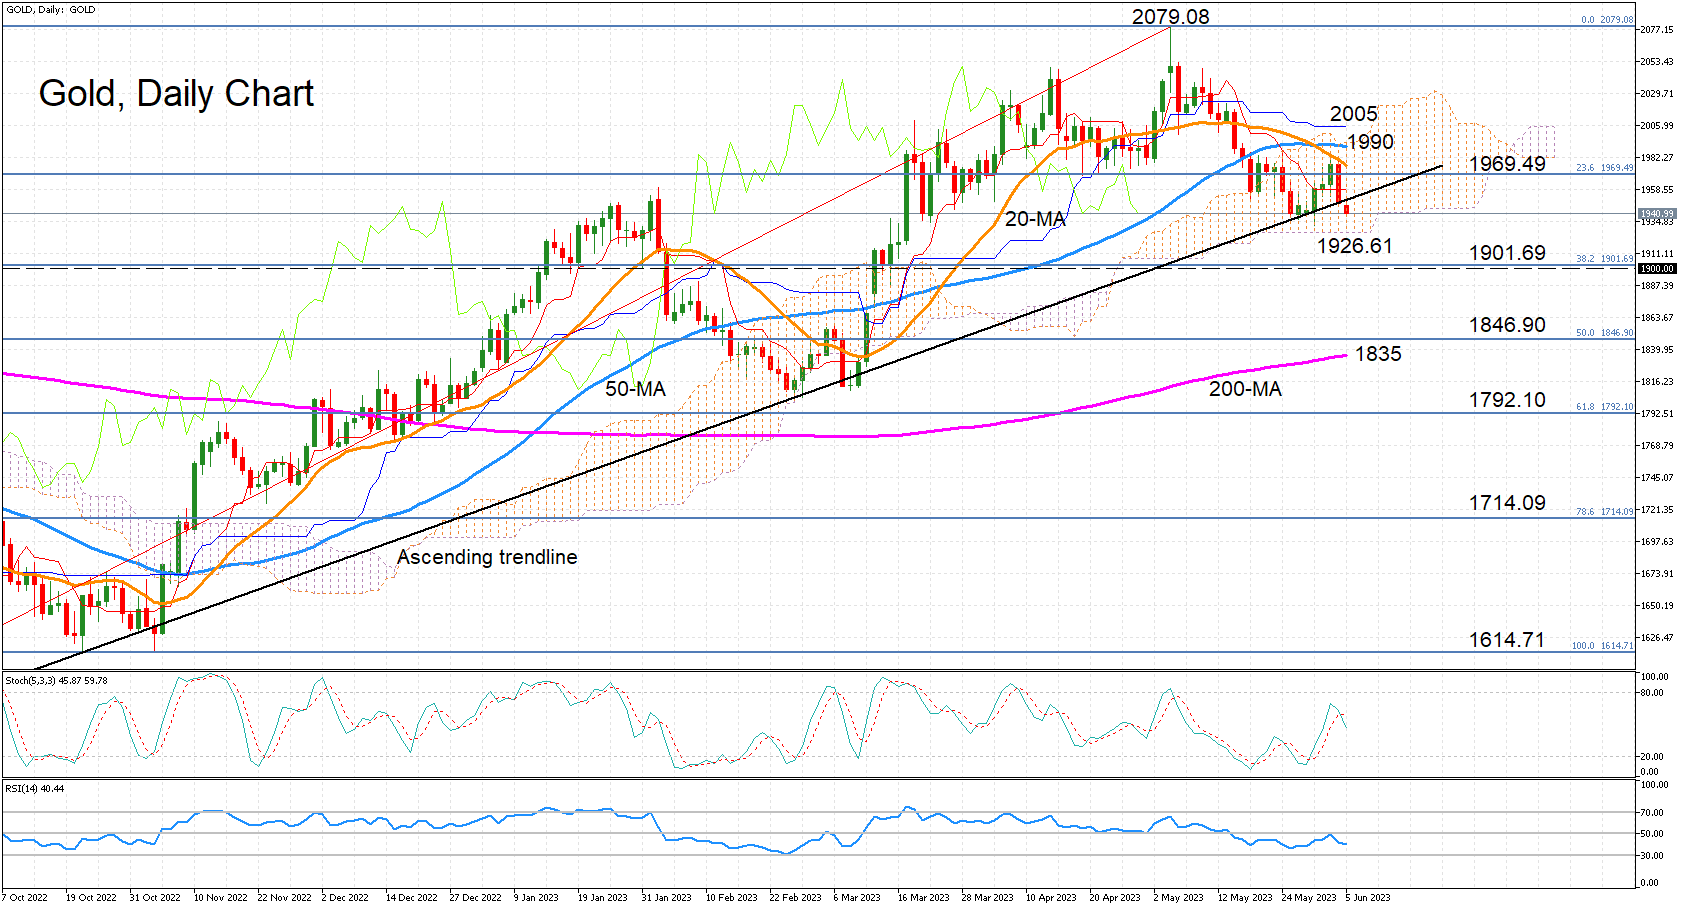
Gold has breached its ascending trendline and could soon drop below the Ichimoku cloud as well, as the short-term momentum indicators are pointing down. The %K and D% lines of the stochastic oscillator have posted a bearish crossover, while the RSI is heading lower after failing to climb above the 50 neutral threshold.
Immediate support is likely to come at the cloud bottom just above 1,926, while the crucial 1,900 barrier is not that far below and is being reinforced by the 38.2% Fibonacci retracement of the September 2022-May 2023 uptrend. If the selling pressure deepens and gold plummets below 1,900, the bears are likely to set their sights on the 200-day simple moving average (SMA) around 1,835. Although, they would first have to get through the 50% Fibonacci of 1,846.90.
In the event that the precious metal is able to claw back above the trendline, there are several obstacle ahead. The 20-day SMA is inclining downwards and about to intersect the 23.6% Fibonacci of 1969.49, the 50-day SMA is blocking the exit from the cloud at 1,990 and the Kijun-sen line is waiting at 2,005.
Even if gold is able to clear those hurdles, it is some distance away from the May peak of 2,079.08, which it needs to surpass to put its uptrend back on track. Otherwise, there’s a risk that the slide will eventually hit the 200-day SMA, which breaching it would endanger the longer-term bullish picture.
AUD/USD Edges Lower ahead of RBA Rate Announcement
- US nonfarm payrolls surge, unemployment climbs
- RBA expected to pause at Tuesday’s meeting
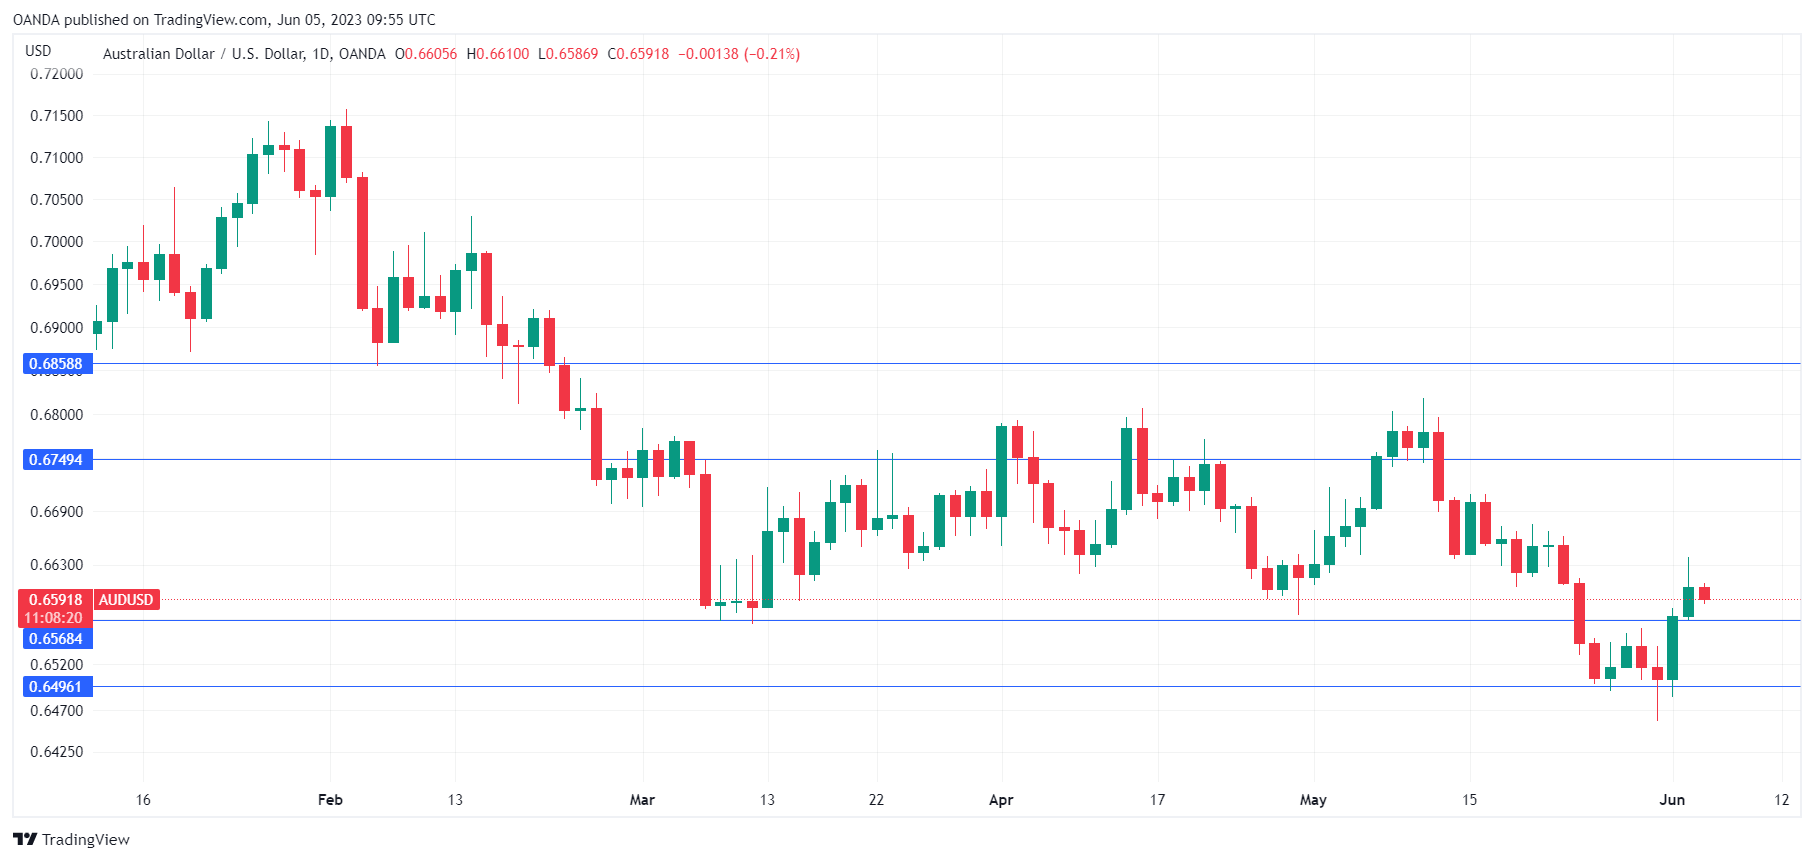
The Australian dollar is coming off a strong week, with gains of 1.35%. AUD/USD has edged lower on Monday, trading at 0.6594, down 0.17%.
US nonfarm payrolls surge
Friday’s US employment report was a reminder that the labour market remains robust. Payrolls surged by 339,000 in May, crushing the estimate of 195,000. The April reading was revised upwards to 294,000 from 253,000, another sign of a strong labour market. However, this was not the entire story. The unemployment surprised to the upside, rising from 3.4% to 3.7%, while wage growth ticked lower to 0.3%, down from 0.4%.
The takeaway from the mixed jobs report is that job growth remains surprisingly strong, but at the same time, there are signs the labour market is losing some steam. The pockets of softness in the report could be enough for the Fed to opt for a pause at the June 14th meeting, after ten straight rate increases.
Market expectations have been all over the place, as it has been a tricky task to pin down what the Fed has planned. A month ago, the markets put the probability of a pause at 91%. This fell to 36% a week ago and has bounced back up to 78%. With a blackout period starting today, we won’t have any Fed speak to provide insights on the Fed’s thinking ahead of the meeting.
Will RBA take a pause?
The Reserve Bank of Australia meets on Tuesday and the meeting is live, with the markets pricing in a pause at 67% and a 25-basis point hike at 33%. Just a week, ago, the markets had priced in a pause at a massive 97%.
The RBA is in a pickle, as inflation remains high and the employment market is tight but growth has cooled down. Inflation is at 7%, well above the RBA’s target of 2-3%. Governor Lowe has been hawkish and said last week that the Bank will do whatever it takes to bring inflation back down to target and Lowe shocked the markets with a rate hike in May. A pause seems the more likely move, but as we have seen, Lowe has a habit of surprising the markets.
AUD/USD Technical
- AUD/USD is putting pressure on support at 0.6568, followed by support at 0.6496
- There is resistance at 0.6568 and 0.6496
WTI Oil: Oil Price Jumps on Saudi Big Oil Cuts
WTI oil opened with 2.6% gap higher on Monday, lifted by decision of Saudi Arabia to reduce production to 9 million barrels per day in July from 10 million in May, the biggest reduction in years.
The Saudi Arabia’s cut comes on top of OPEC+ agreement to limit oil supply in 2024, aiming to boost prices, in a broader attempt to stabilize oil market, hurt by persisting concerns about global economy weakness and impact on oil demand.
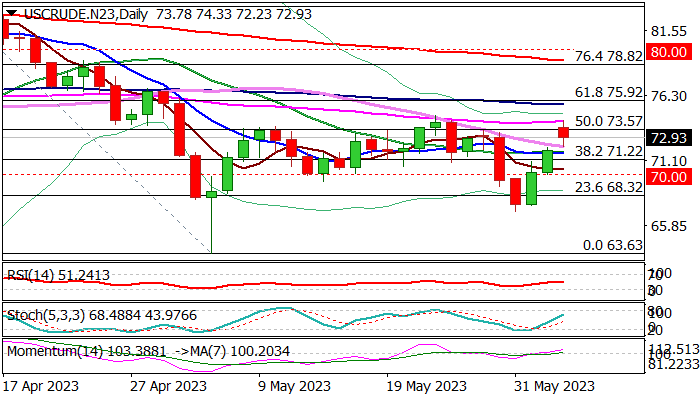
Monday’s jump broke through Fibo resistance at $73.57 (50% retracement of $83.51/$63.63) but faced strong headwinds from the base of daily cloud ($73.99).
Extension of strong bounce last Thu/Fri requires clear break of $73.57 and penetration of daily cloud to signal continuation and expose targets at$74.70 (May 24 high) and $75.58/92 (100DMA / Fibo 61.8%).
Rising bullish momentum on daily chart and MA’s (10,20,30) in bullish setup support the action, with bulls to stay intact while today’s gap remains unfilled.
Dips should remain contained by 30DMA ($72.22) to keep bullish bias, while dip and close below converged 10/20DMA’s ($71.76) would weaken near-term structure.
Res: 73.57; 73.99; 74.70; 75.58.
Sup: 72.22; 71.76; 71.22; 70.86.
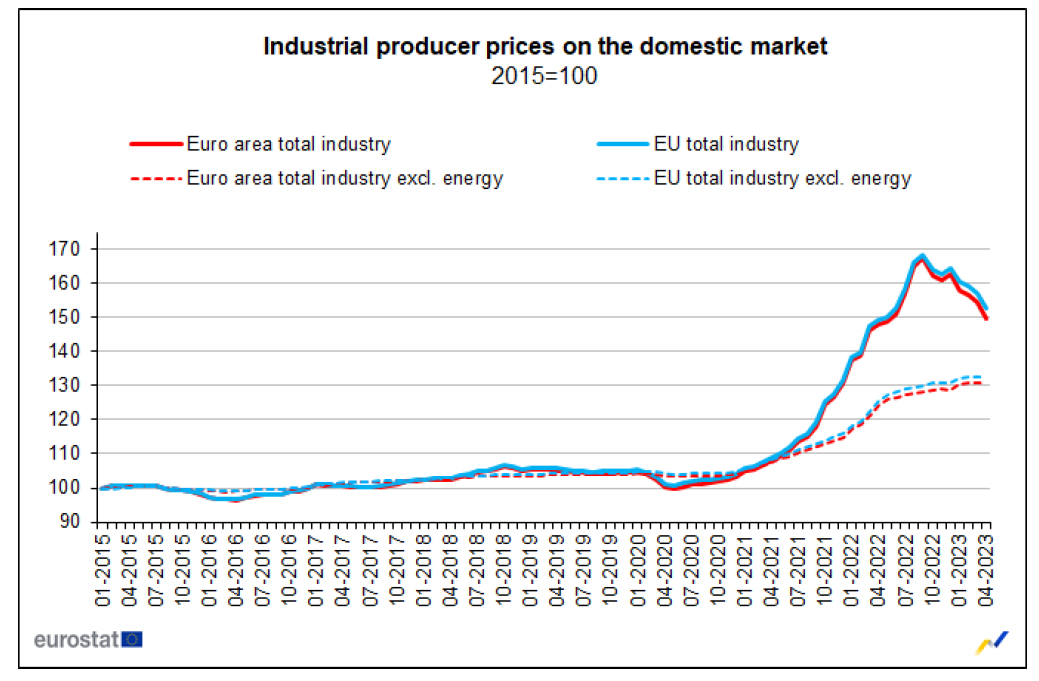
Eurozone PPI at -3.2% mom, 1.0% yoy in Apr
Eurozone PPI came in at -3.2% mom, 1.0% yoy in April, versus expectation of -2.7% mom, 0.8% yoy. For the month, industrial producer prices decreased by 10.1% mom in the energy sector and by -0.6% mom for intermediate goods, while prices increased by 0.2% mom for durable consumer goods, by 0.3% mom for non-durable consumer goods and by 0.4% mom for capital goods. Prices in total industry excluding energy decreased by -0.1% mom.
EU PPI was at -2.9% mom, 2.3% yoy. The largest monthly decreases in industrial producer prices were recorded in Belgium (-9.1%), Italy (-6.5%) and Ireland (-6.3%), while increases were observed in Germany (+0.3%), Denmark (+0.2%) as well as Greece, Cyprus, Malta and Slovenia (all +0.1%).
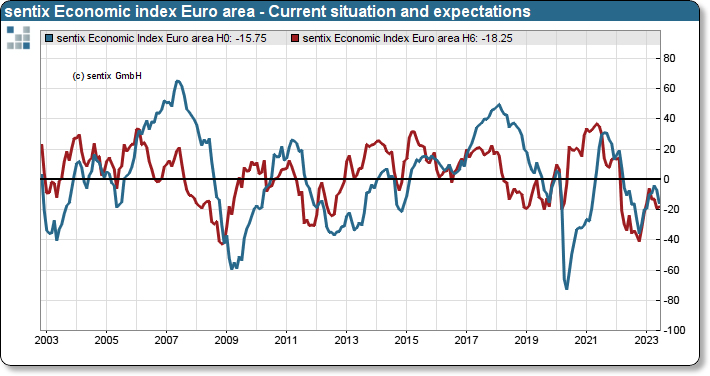
Eurozone Sentix fell to -17, Germany the biggest problem child
Eurozone Sentix Investor Confidence dropped from -13.1 to -17 in June, well below expectation of -9.2. Current Situation index dropped from -7.0 to -15.8. But Expectations index ticked up from -19.0 to -18.3.
Sentix noted: "The biggest problem child in the Eurozone remains Germany, which plummets dramatically in the sentix economic indices. The situation collapses to -22 points, expectations fall again slightly to -20.3 points. The overall index plunges to -21.1 points. All lows since Nov/Dec 2022."
Sentix also said, "Eurozone economy continues to send weak signals at the beginning of June", and "the clear slump in the assessment of the economic situation is particularly striking".
Meanwhile, inflation expectations rose to -6, comparing to -44.25 a year ago. "Thus, positive inflation surprises are on the horizon," Sentix said.
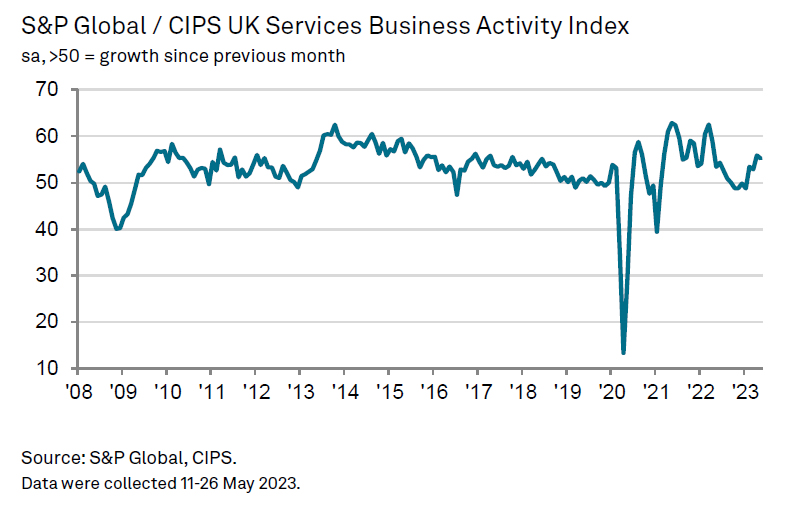
UK PMI services finalized at 55.2, strong growth so far in Q2
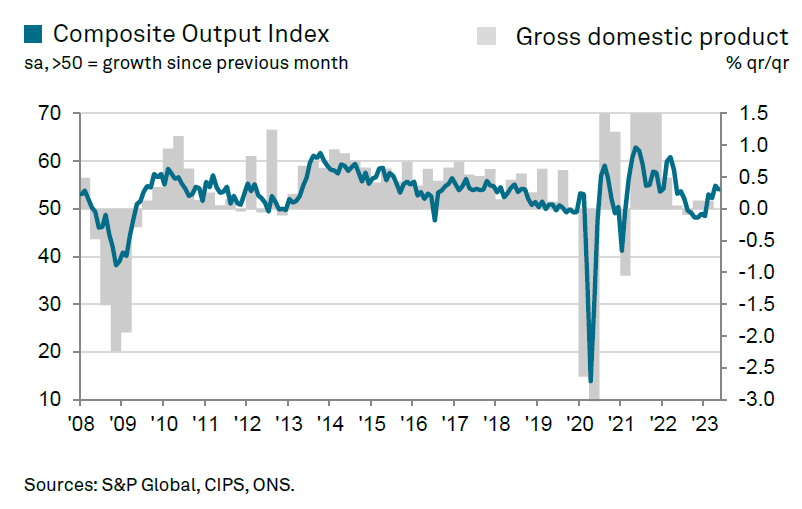
UK PMI Services was finalized at 55.2 in May, down slightly from April's 55.9. S&P Global said there were robust rises in output and incoming new work. Staffing numbers increased for the fifth month running. Wage pressures pushed up cost inflation to a new three-month high. PMI Composite was finalized at 54.0, down from prior month's 54.9.
Tim Moore, Economics Director at S&P Global Market Intelligence: "Service sector businesses have experienced strong growth so far in the second quarter of 2023... Rising export sales were also reported... Job creation was maintained... Intense wage pressures continued across the service economy... Average prices charged by service sector companies nonetheless increased at the second-weakest pace since August 2021."
GBP/JPY Daily Outlook
Daily Pivots: (S1) 173.77; (P) 174.22; (R1) 174.71; More...
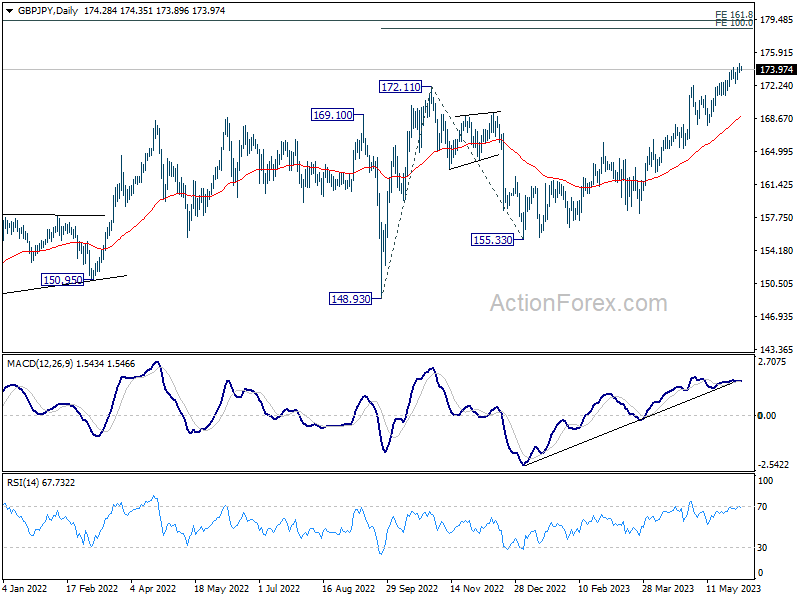
Intraday bias in GBP/JPY remains mildly on the upside for the moment. Current rally should target 100% projection of 148.93 to 172.11 from 155.33 at 178.51. On the downside, break of 172.50 support will turn bias neutral and bring consolidations first, before staging another rally.
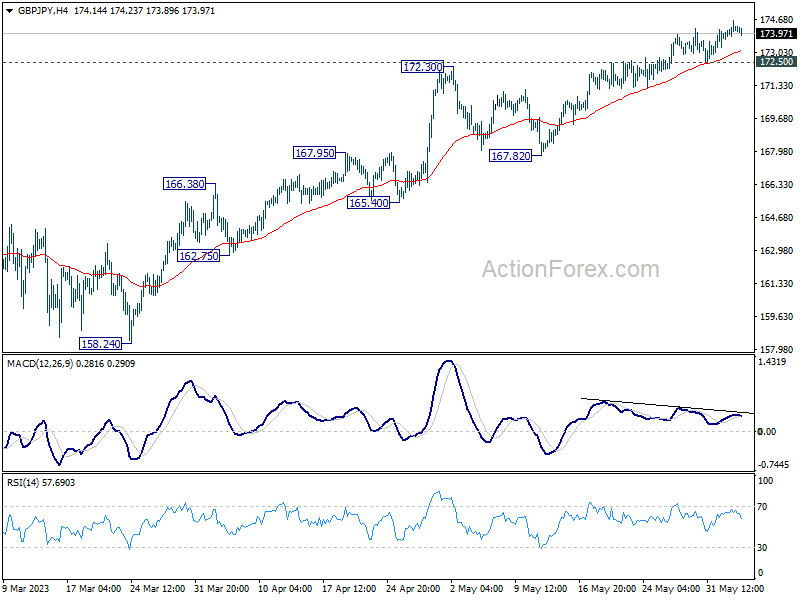
In the bigger picture, up trend from 123.94 (2020 low) is extending. Next target will be 161.8% projection of 122.75 (2016 low) to 156.59 (2018 high) from 123.94 at 178.69. For now, medium term outlook will remain bullish as long as 165.99 resistance turned support holds, even in case of deep pull back.
EUR/JPY Daily Outlook
Daily Pivots: (S1) 149.39; (P) 149.67; (R1) 150.16; More....
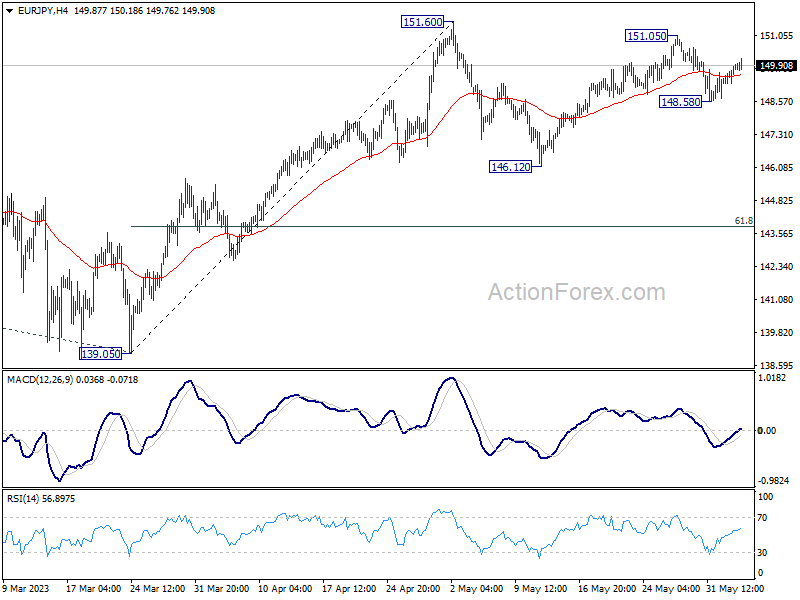
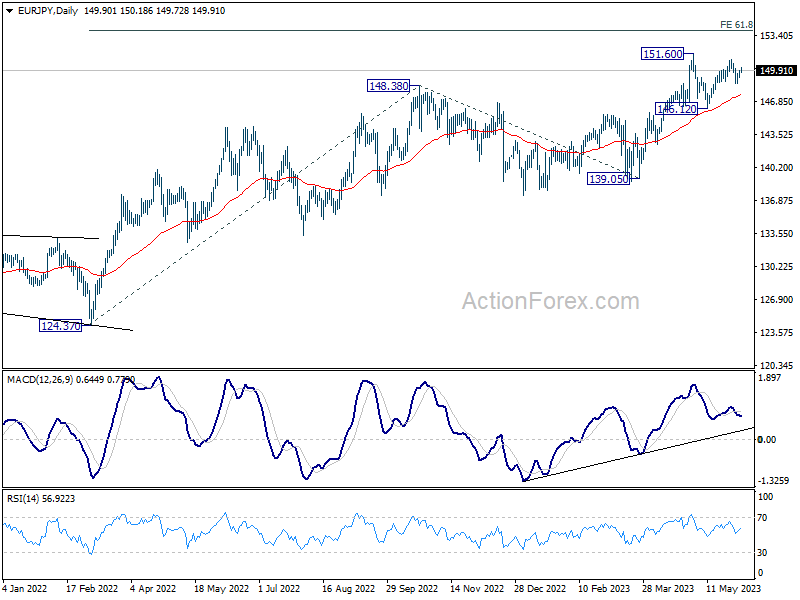
Intraday bias in EUR/JPY remains neutral for the moment. On the downside, below 148.58 temporary low will extend the corrective pattern from 151.60 with another falling leg. Deeper fall would be seen to 146.12 support and possibly below. On the upside, however, above 151.05 will target 151.60 high. Firm break there will resume larger up trend to 153.64 projection level.
In the bigger picture, rise from 114.42 (2020 low) is in progress. Next target is 61.8% projection of 124.37 to 148.38 from 138.81 at 153.64. Sustained break there will pave the way to 100% projection at 162.82. For now, medium term outlook will remain bullish as long as 139.05 support holds, even in case of deep pull back.
EUR/GBP Daily Outlook
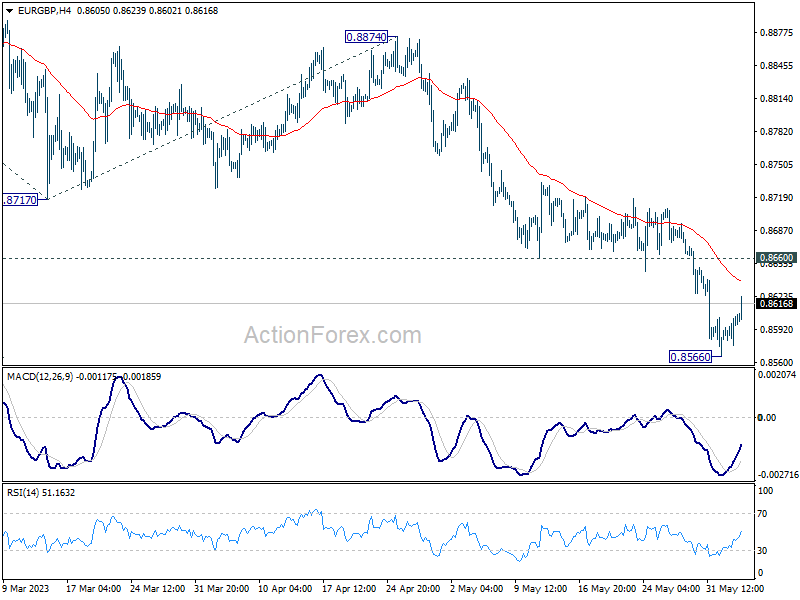
Daily Pivots: (S1) 0.8584; (P) 0.8594; (R1) 0.8611; More...
Intraday bias in EUR/GBP remains neutral for consolidation above 0.8566. Upside of recovery should be limited by 0.8660 support turned resistance and bring another fall. Break of 0.8566 will resume the fall from 0.8977, and target 161.8% projection of 0.8977 to 0.8717 from 0.8874 at 0.8453.
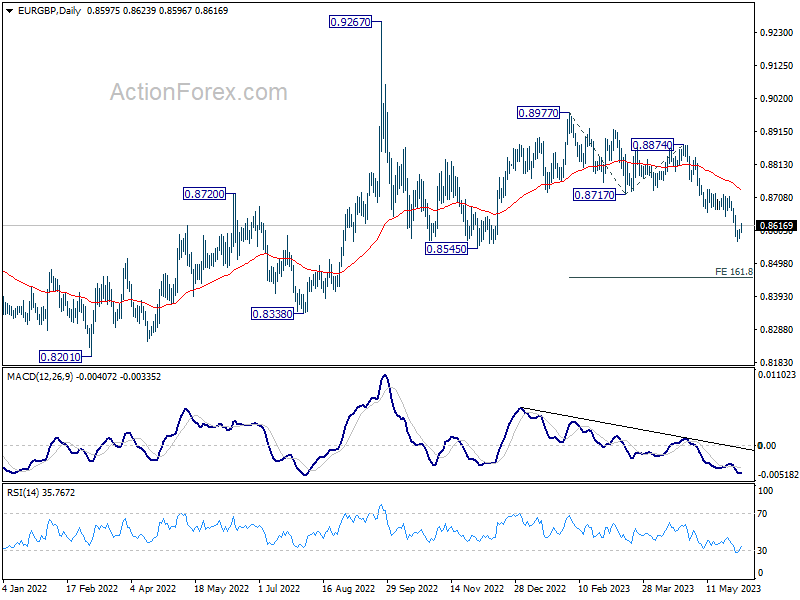
In the bigger picture, current development argues that whole decline from 0.9267 (2022 high) is still in progress. This is part of the long term range pattern from 0.9499 (2020 high). Deeper fall would be seen through 0.8545 support. This will now remain the favored case as long as 0.8717 support turned resistance holds.
EUR/AUD Daily Outlook
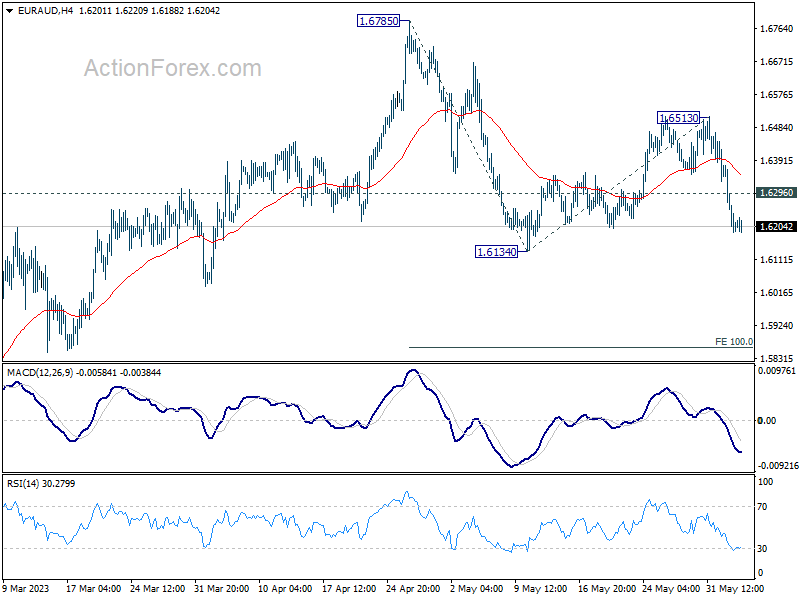
Daily Pivots: (S1) 1.6138; (P) 1.6262; (R1) 1.6335; More...
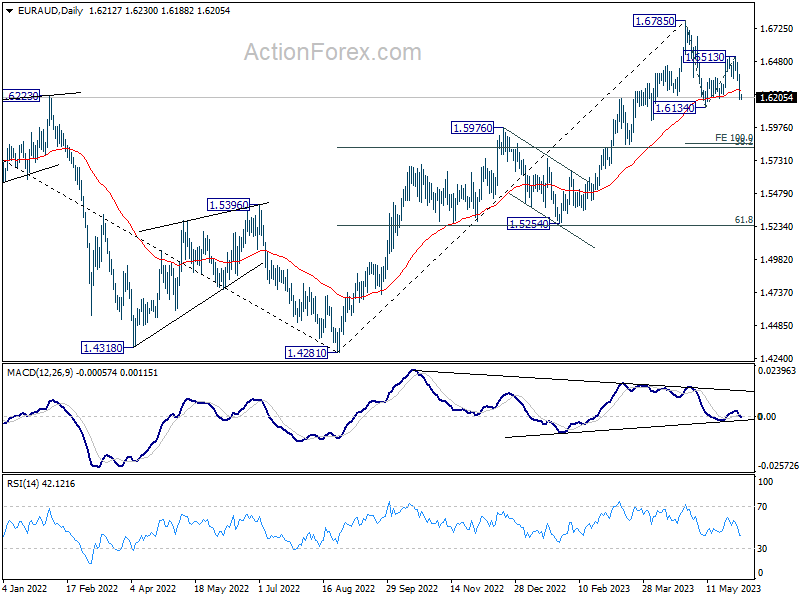
Intraday bias in EUR/AUD remains on the downside for 1.6134 support. Firm break there will resume whole fall from 1.6785, and target 100% projection of 1.6785 to 1.6134 from 1.6513 at 1.5862. On the upside, above 1.6296 minor resistance will turn intraday bias neutral first.
In the bigger picture, a medium term is possibly in place at 1.6785 already, on bearish divergence condition in D MACD. Fall from there is seen as corrective whole up trend from 1.4281 (2022 low). Deeper decline is expected as long as 1.6513 resistance holds, to 38.2% retracement of 1.4281 to 1.6785 at 1.5828.