

Sample Category Title
FOMO Regime Change for US Stock Market
- The laggards, Dow Jones Industrial Average & Russell 2000 have recorded stellar single-day outperformances on Friday, 2 June against the Nasdaq 100; at least a three-month high.
- Market breadth has improved but fundamental structure remains weak due to stagflation risk.
- Positive FOMO (“fear of missing out”) flows may persist at least in the short to medium term due to relatively low levels of positioning, exposure, and sentiment.
On Friday, 2 June, we witnessed a significant flow of rotation among the benchmark US stock indices ahead of the key 16 June “Triple Witching” US options expiration; prior laggards, the Dow Jones Industrial Average and Russell 2000 have recorded one of the best single day outperformance in at least three months against the leading mega-cap tech & AI concentrated Nasdaq 100.
Dow Jones Industrial Average & Russell 2000 recorded their highest single-day outperformance against Nasdaq 100 since February 2023 & October 2022
The ongoing medium-term uptrend of the Nasdaq 100 started on 13 October 2022, outperforming the Dow Jones Industrial Average and Russell 2000 in the past seven months. Interestingly, the Dow Jones Industrial Average / Nasdaq 1000 ratio recorded its strongest single-day performance on Friday since 3 Feb 2023 (1.38) while the Russell 2000 / Nasdaq 1000 ratio notched its strongest single-day performance since 26 October 2022 (2.81) supported by strong rallies seen in cyclical, industrial and banking stocks such as 3M (+8.7%), Caterpillar (+8.4%) and US regional banks (KRE ETF +6.2%) on Friday.
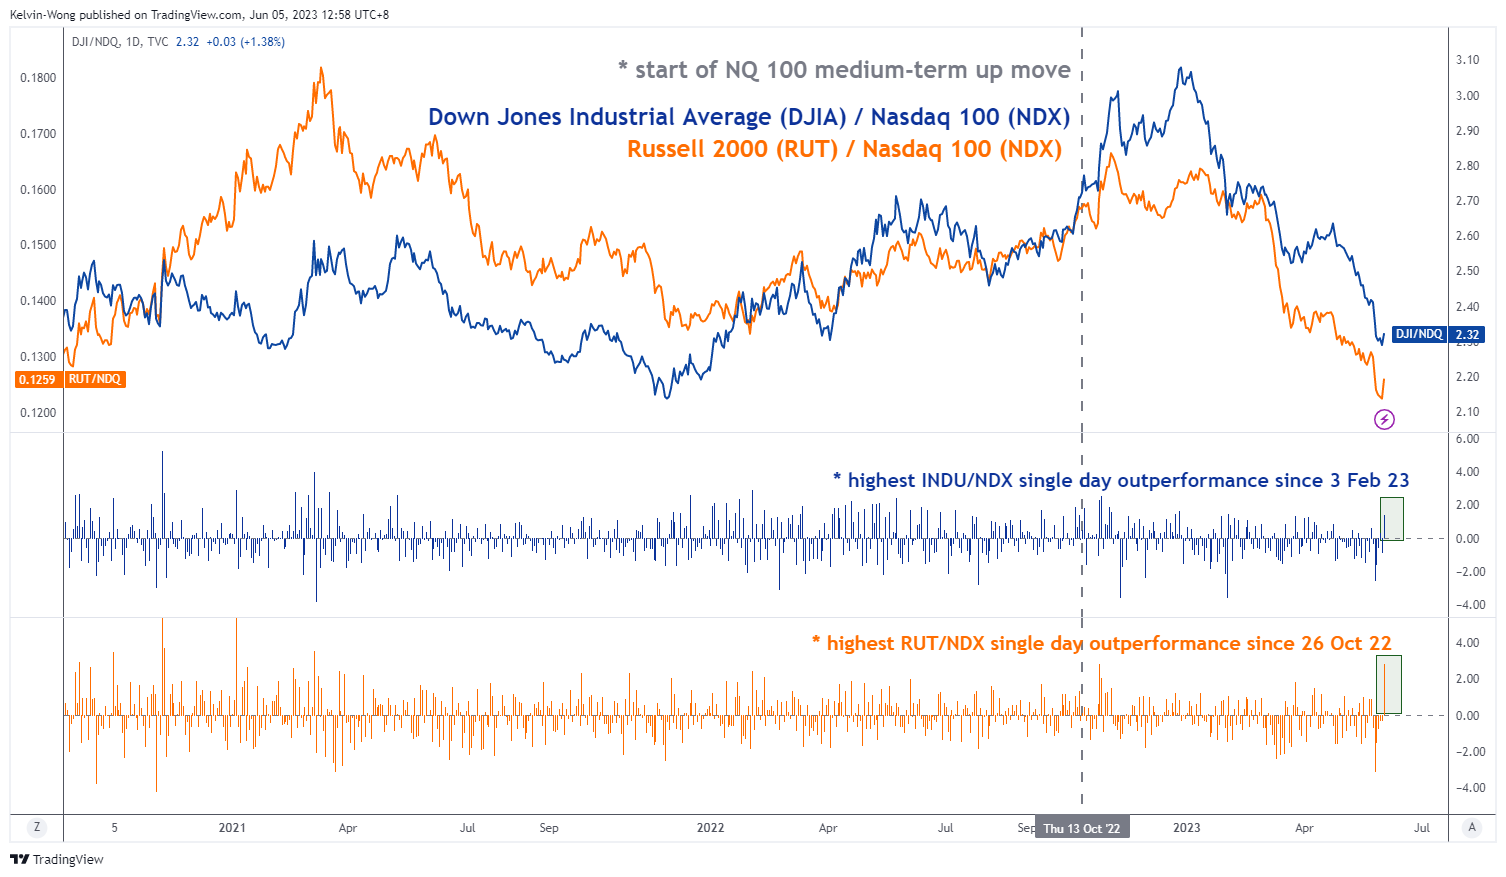
Fig 1: Performances of DJIA & Russell 2000 against Nasdaq 100 measured by their respective ratios as of 2 June 2023
(Source: TradingView, click to enlarge chart)
On the surface, these positive observations can be considered as an improvement in market breadth as rotation is being spread from the high-flying eight mega-cap tech stocks (FAANG plus MNT; Facebook/Meta, Apple, Amazon, Netflix, Google/Alphabet, Microsoft, Nvidia, and Tesla) that are leading the rally since late October 2022 towards the cyclical laggards.
A higher cost of funding environment cannot be ruled out
However, a higher cost of funding environment amid a lingering risk of stagflation may put a damper on earnings growth. The 10-year US Treasury yield has recovered above its 200-day moving ex-post US debt ceiling deal and is looking for a test on a key resistance at 3.90% with positive momentum.
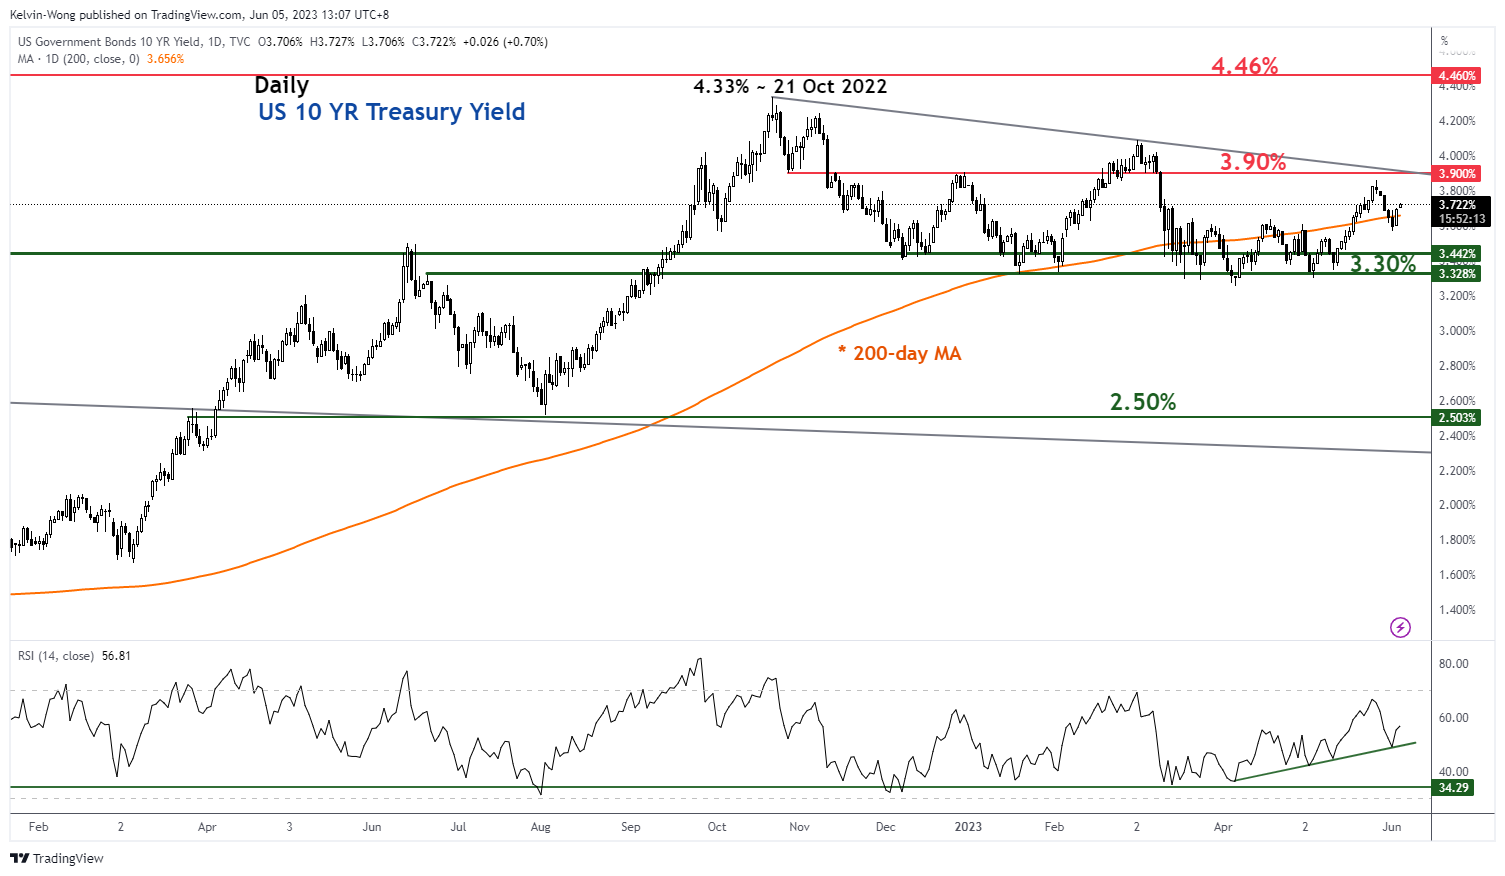
Fig 2: 10-year US Treasury yield trend as of 5 Jun 2023 (Source: TradingView, click to enlarge chart)
The leading inverted US Treasury yield curve is pointing to a potential imminent global recession
In addition, we cannot rule out an impending global recession as the leading US Treasury yield curve, the difference between the 10-year and 2-year is now at -0.81%; it’s the most inverted state in almost 42 years.
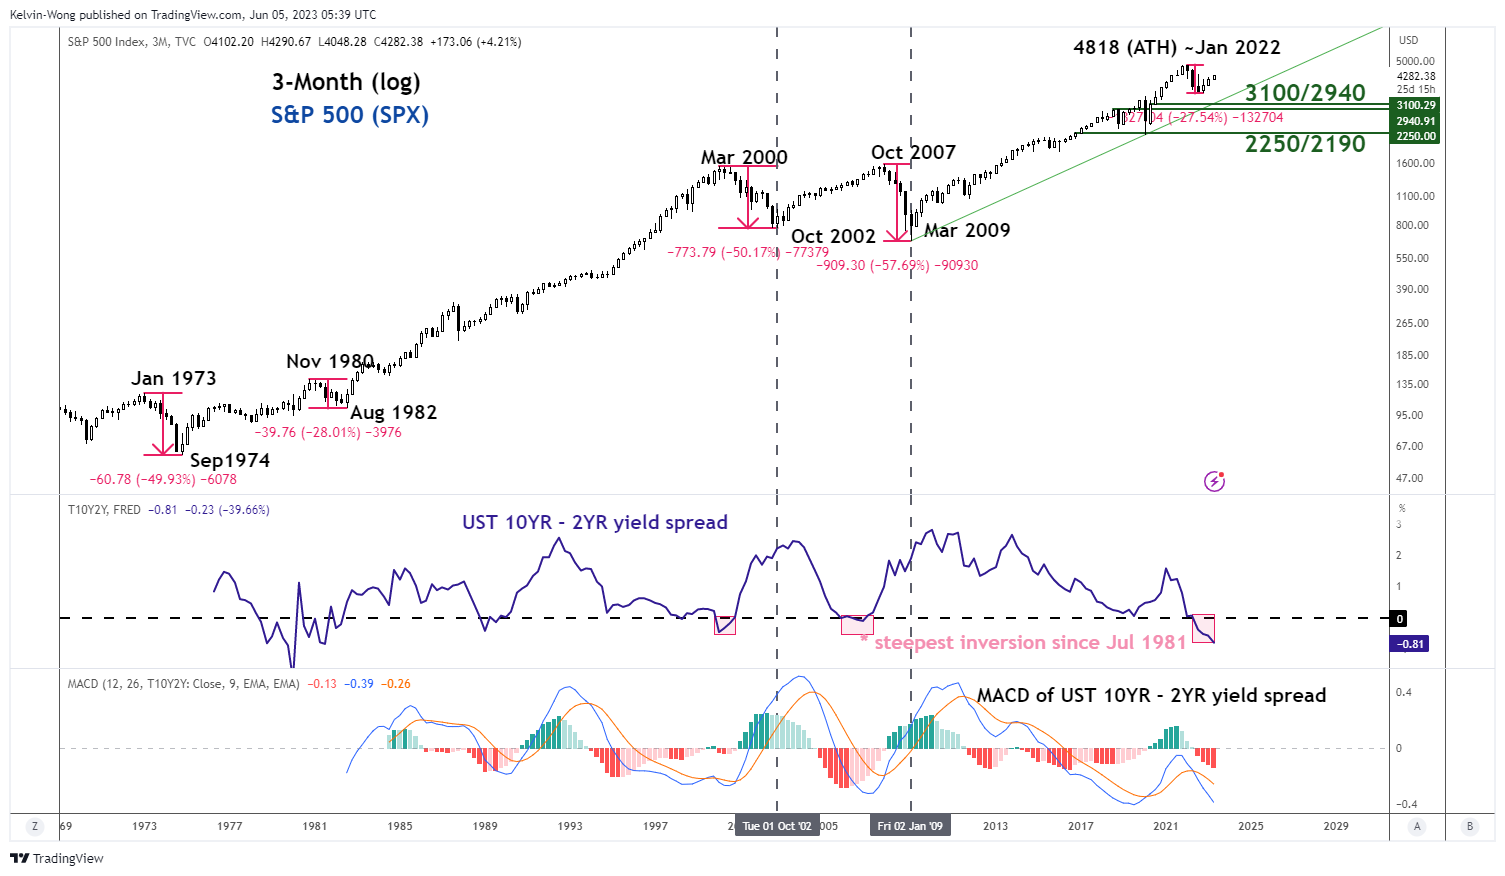
Fig 3: US Treasury yield curve (10-year over 2-year) trend as of 5 June 2023 (Source: TradingView, click to enlarge chart)
However, in a nutshell, the trend is always your friend until its ends so do not be surprised by such positive FOMO irrational behaviour that can persist in the short to medium-term time horizons which in turn may take the US stock market higher due to a relatively low level of positioning, exposure, and sentiment since the start of the year.
Dollar Profited from the Rate Support
Markets
US payrolls delivered once more in May. The Bureau of Labour Statistics reported a 339k net job gain for May. Payrolls beat consensus by a wide margin (237k!!), also taking into account upward revisions to the March and April data (+93k). The employment increase was nevertheless at odds with a significant increase in the unemployment rate (5.7% from 5.4% despite stable participation rate) with the latter being derived from the separate Household Survey which pointed at a >300k net job… loss in May! Average hourly earnings came in as expected at 0.3% M/M (4.3% Y/Y). Markets had to digest the numbers coming from a week long dovish repositioning after future Fed vicechair Jefferson and voting Fed Harker pulled the plug on a June rate hike. It’s skip and go when it comes to them and probably the majority within the Fed. Markets now fully discount a 25 bps July rate hike while the odds of the US central bank hiking already next week are further reduced. US yields rose by 7.3 bps (30-yr) to 15.8 bps (2-yr) in a daily perspective. US Treasuries underperformed German Bunds with German yields closing 3.3 bps (30-yr) to 9.5 bps (2-yr) higher. The dollar profited from the rate support, but as for US yields, last week’s highs were untested. The trade-weighted dollar (DXY) closed at 104.02 from 103.56 and a May high at 104.70. EUR/USD closed at 1.0708 from 1.0762 and compared to the May low of 1.0635. US stock markets didn’t bother the higher US interest rates as the ongoing labour market strength once again underpins the resilience of the economy. Key indices closed 1% (Nasdaq) to 2% (Dow) higher. Talk that China weighs new property spending to help the economy benefited risk sentiment as well. Asian risk sentiment remains bullish this morning with China underperforming despite a strong services PMI. Higher oil prices (see below) offer part of the explanation. They weigh on core bonds as well.
Today’s agenda contains US non-manufacturing ISM. We expect the global divergence between weakness in manufacturing and strength in domestic services to persist in the US as well. This should avoid a nasty, negative surprise. The eco calendar contains second tier eco data this week with US and European central bankers in their blackout period ahead of key policy meetings next week. This sets the stage for more sideways action with May highs in US rates and the dollar being important resistance levels. We keep a close eye at US Treasury funding statements/action as well. They ran down their general account at the Fed to a rock-bottom $23bn against the background of the debt ceiling debate and have to replenish in coming weeks/months.
News and views
At the OPEC+ meeting on Sunday in Vienna, Saudi Arabia announced that it will cut its production by 1 mln barrels per day as the country aims to stabilize the market, amid persistent downward pressure on the oil price. Other members of the group didn’t engage to a further reduction, but agreed to maintain current cuts till the end of 2024. Russia also didn’t commit to deeper cuts. The United Arab Emirates even are allowed a higher production quotum for 2024. The oil price this morning gains modestly with Brent trading close to $77/b.
Rating agency S&P kept the French AA credit rating unchanged on Friday. The outlook remains negative. The agency expects tighter financial conditions and high core inflation to restrain the country’s activity in 2023 and 2024. It expects France’s budget deficit to decline to 3.8% of GDP in 2026 from about 5% in 2023. Government debt is expected to stay above 110% of GDP, with the forecasts still subject to risks related to growth and the implementation of the government’s economic and fiscal policy. Rating agency Fitch affirmed its AA- UK rating and also kept a negative outlook. The agency expects the UK general government debt to GDP ratio to reach 104.8% of GDP by 2024 from 101% in 2022. The negative outlook signals macroeconomic challenges, including weak growth and suborn inflation, higher borrowing costs and expenditure pressures due to the cost of living crisis and the upcoming elections. Fitch expects the UK to enter a mild recession in 2023 with a 0.1% contraction of GDP in 2023 and a weak recovery of 1.0% in 2024. Finally, Fitch kept the US AAA credit rating on watch negative, even after the political agreement to raise to US debt ceiling, avoiding a default as the rating agency will ‘consider the full implications of the most recent brinkmanship episode and the outlook for medium-term fiscal and debt trajectories’.
OPEC-led Oil Rally Remains Short-Lived
The week kicked off with a jump in oil prices, after Saudi announced that it will cut its production by another 1mbpd starting from July, pulling its production to the lowest levels since years.
The UAE will be given higher quotas, as African countries - which repeatedly fell below their production quotas– will see their upper production limit lessened.
Saudi will continue doing the heavy lifting of production cuts, hoping that its efforts will reverse the falling price trend in oil markets and boost prices, but the gifts to some OPEC members in expense of the others hint that we could see further cracks within the cartel in the next few months, and that’s not a winning setup for OPEC, and oil bulls.
US crude gapped 3.5% higher on Monday open, while Brent crude traded past $78pb. But the rally remained short-lived, and below the peak reached after Saudi Prince bin Salman had told oil bears to watch out a couple of weeks ago.
Oil bears – decidedly daring, rushed in to sell the rally triggered by the Saudi decision, as expected. Most of the gains are gone even before Europeans woke up.
The short-term price risks remain tilted to the upside as OPEC meeting continues today, but any price rally continues to be seen as interesting top selling opportunity by oil traders, as Chinese post-Covid reopening doesn’t gather the pace investors expected, while above-target global inflation and tight monetary policies threaten global growth. Any further price rally will likely hit resistance at 50/100-DMA range, between $74.90/75.50 area, and the 200-DMA will likely act as an ultimate stop at $78.90.
Seeing the glass half full
Asian equities were mostly in the green this Monday, to catch up with the US session rally following Friday’s jobs data. The US economy beat expectations for the 14th straight month and printed another blowout NFP data. The US economy added 339K new nonfarm jobs in May, far above the 180K expected by analysts. That would’ve been bad news for the Federal Reserve (Fed), if the wages growth hadn’t eased – though slightly, and the unemployment rate hadn’t jumped to 3.7% from 3.4% printed a month earlier.
As a result, investors preferred seeing the glass half full, betting that the Fed will likely pause hiking rates in June. The probability of a no hike in June rose to 75%, but activity on Fed funds futures still price in more than 50% chance for a July action, if inflation remains sticky and economic data strong enough.
The idea of a June skip & July hike keeps the US short-end of the US yield curve tilted to the upside. The US 2-year yield jumped past 4.50% on Friday, after the solid NFP read, and stabilizes above that level this morning.
The US dollar remains well bid against most majors, as the EURUSD is offered into the 1.07 level, and the USDJPY easily finds buyers below the 140 level, as yield spread between the US Japan 10-year bond spread remains favourable for buying the pair.
The US dollar remains under pressure against the Canadian dollar, on the other hand, as the OPEC-fueled oil prices leads to some inflows into the Loonie, while the AUDUSD spiked on Friday, boosted by a rally in iron ore futures, and defying a broadly bid US dollar.
The Reserve Bank of Australia (RBA) and Bank of Canada (BoC) will deliver their next policy decisions this week, and both are expected to keep the rates steady at this week’s meetings. But swap contracts showed a better chance for a rate hike on Friday, than a pause. A surprise rate hike from the RBA should give a further strength to the AUDUSD, but the deteriorating macroeconomic environment, the slowing China and falling raw material prices would normally be expected to soften the RBA’s hand. If that’s the case, we shall see AUDUSD remain under pressure for some more weeks.
Liquidity drain
In equities, the rising yields haven’t yet translated into selling pressure. The S&P500 rallied 1.45% on Friday, and is now approaching last summer peak, as the US debt ceiling agreement, and strong jobs data hinted that the US is still far from recession levels. The problem is that the US Treasury will issue a ton of new bonds from now to refill the Treasury’s General Account which got almost emptied during the debt ceiling crisis, and that will hit the market liquidity along with the Fed which will continue pulling away liquidity from the market within its QT program. Lower liquidity will likely lead to a decent downside correction in equities in the coming weeks.
Technical Outlook and Review
DXY:
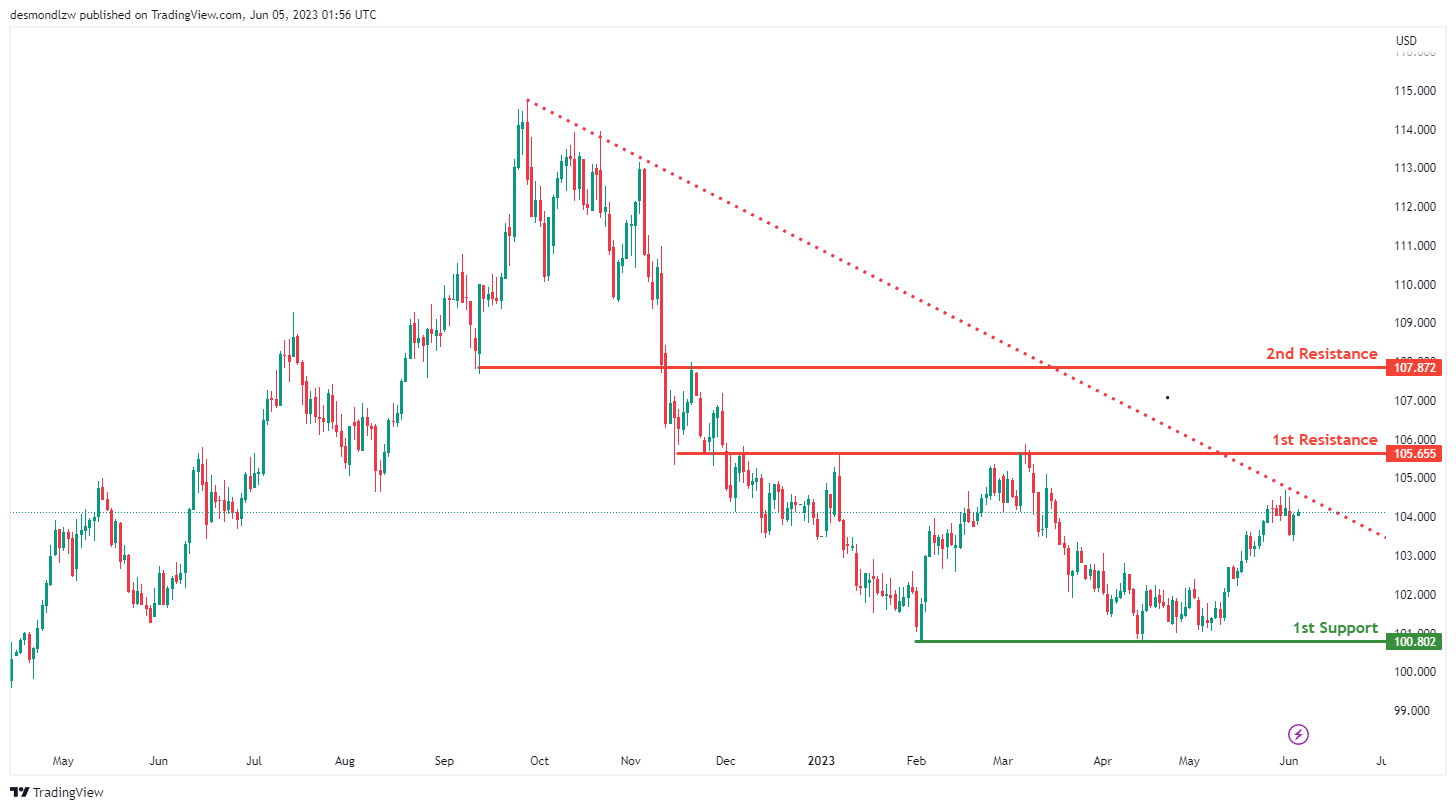
The DXY instrument is currently demonstrating bearish momentum, with the price falling below a significant descending trend line, suggesting that a continuation of bearish momentum is likely.
The price may potentially make a bearish reaction off the first resistance level and fall to the first support level. The first support level is located at 100.80 and is significant due to its role as a multi-swing low support.
The first resistance level is at 105.65, which is significant due to its status as an overlap resistance, meaning it could potentially halt or reverse any bullish price movement.
The second resistance level is at 107.87, which is also an overlap resistance, serving as another potential obstacle for bullish price movements.
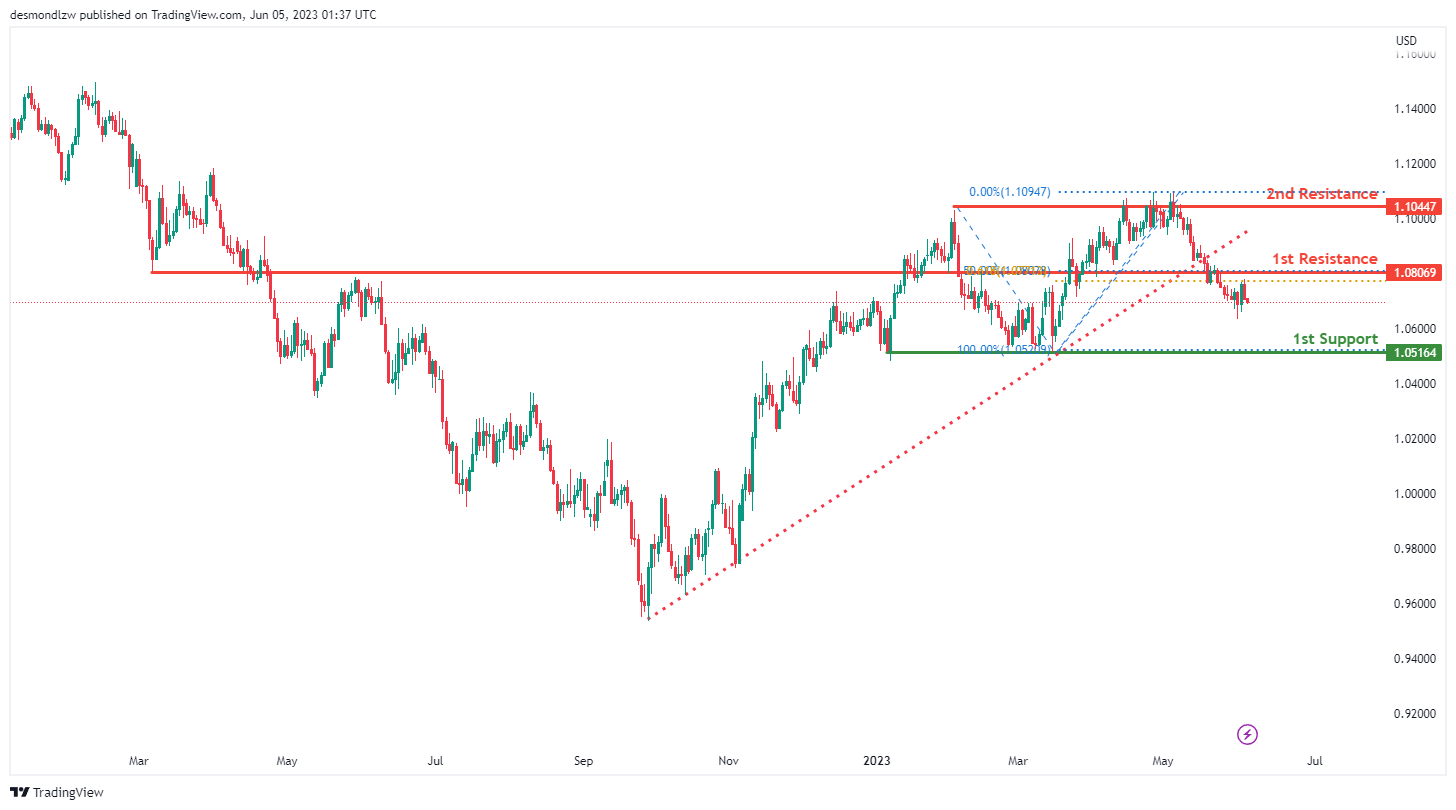
EUR/USD:
The EUR/USD instrument currently exhibits a bearish momentum. This has been triggered by the price breaking below an ascending support line, suggesting a potential continuation of the bearish move.
The price could potentially continue its bearish trend towards the first support level. This support, located at 1.0080, has a multi-swing low support status, making it a potentially significant level where buyers might enter the market and halt or reverse the bearish trend.
On the other side, the first resistance level is at 1.0806. This level is an overlap resistance and aligns with the 50% Fibonacci retracement level, giving it additional significance as a potential barrier to any bullish price movements.
The second resistance level is at 1.1044, identified as a multi-swing high resistance. This suggests it’s a significant level where sellers have previously entered the market and could do so again, potentially halting or reversing any bullish price movements.
GBP/USD:
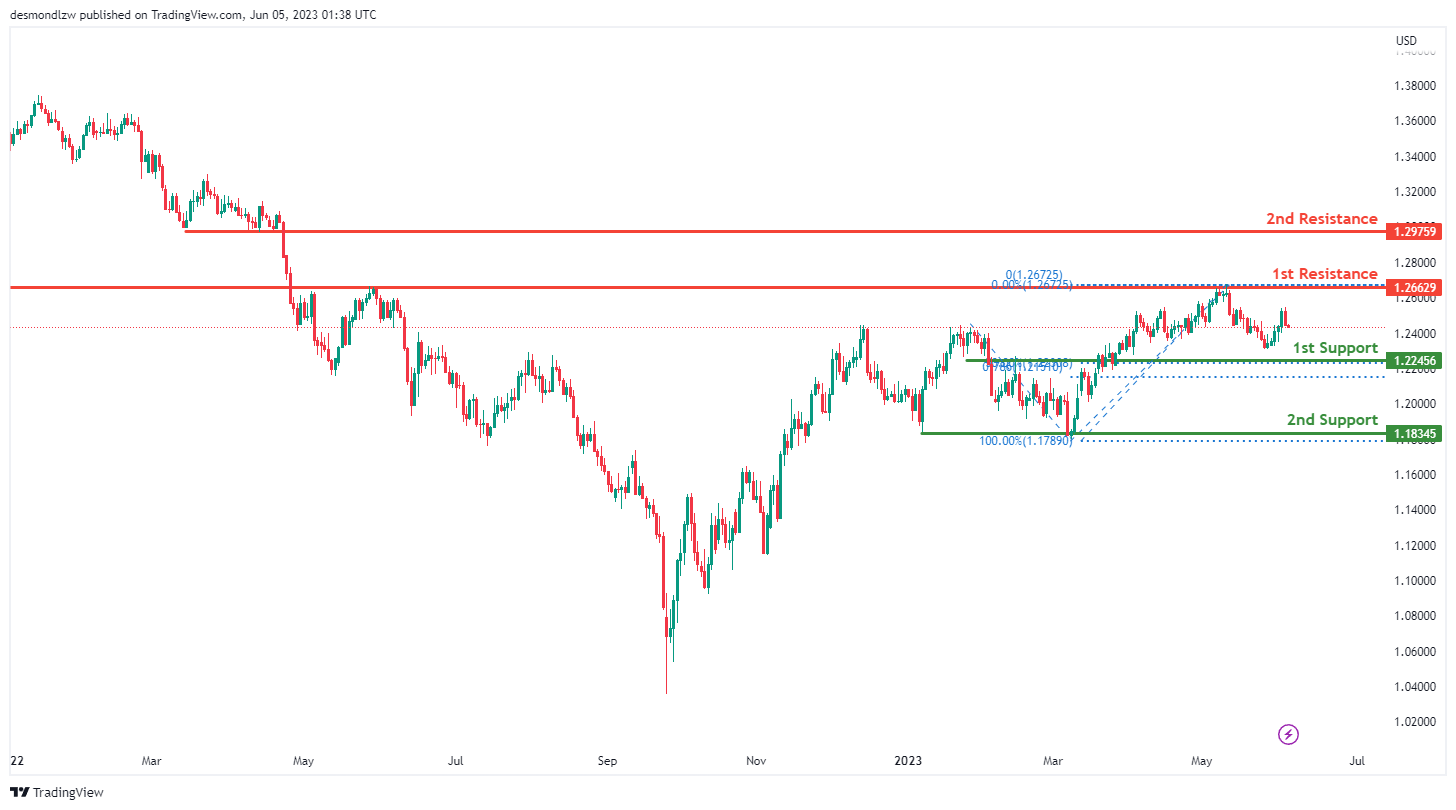
The GBP/USD instrument is currently demonstrating bearish momentum. There is potential for the price to continue its bearish trend, moving towards the first support level.
The first support is located at 1.2245, acting as an overlap support. Additionally, this level coincides with both the 50% Fibonacci retracement and the 61.80% Fibonacci projection levels, indicating significant potential for market activity and possible trend reversal.
Further down, the second support stands at 1.1834, serving as a multi-swing low support. This level could potentially attract buyers, providing a robust defense against further price drops.
On the flip side, the first resistance level is positioned at 1.2662, functioning as an overlap resistance. This could potentially pose challenges for any upward price movement.
Moreover, the second resistance level is located at 1.2975, identified as a pullback resistance. This level might act as a significant barrier to upward price momentum, with sellers likely to enter the market at this point.
USD/CHF:
The USD/CHF chart is currently showing a bullish momentum. This suggests that the price could potentially break through the first resistance level and rise towards the second resistance.
The first level of support is at 0.8977, which serves as an overlap support. This level might serve as a significant area where buyers could enter the market, thereby preventing the price from falling further.
The second level of support is at 0.8827, serving as a multi-swing low support. This level could also attract buyers, providing a robust defense against further price dips.
On the other hand, the first level of resistance is at 0.9088, which serves as an overlap resistance. This level could potentially act as a temporary barrier to the upward price movement.
The second resistance level is at 0.9197. This level serves as a pullback resistance and aligns with the 61.80% Fibonacci Retracement and the 100% Fibonacci Projection. This confluence of technical indicators might strengthen its significance, potentially posing a significant challenge to further upward price movement.
USD/JPY:
The USD/JPY chart is currently exhibiting a bullish momentum. This can be attributed to the price being above a significant ascending trendline, which indicates that further bullish momentum may be expected.
Based on this momentum, the price could potentially continue to rise towards the first resistance level.
The first support level is located at 137.65 and is seen as an overlap support as well as aligning with the 50% Fibonacci retracement level. This adds to its significance as a potential area where buyers might enter the market, thus preventing further price declines.
Should the price break below this level, the second support level is located at 134.31 and is identified as a multi-swing low support. This level could also attract buyers, further preventing the price from falling.
On the other hand, the first resistance level is located at 142.11 and is identified as an overlap resistance, also aligning with the 61.80% Fibonacci retracement level. This level could pose a challenge to any potential upward price movements.
The second resistance level is situated at 144.99 and is seen as a pullback resistance. This level could also act as a barrier to further price increases.
USD/CAD:
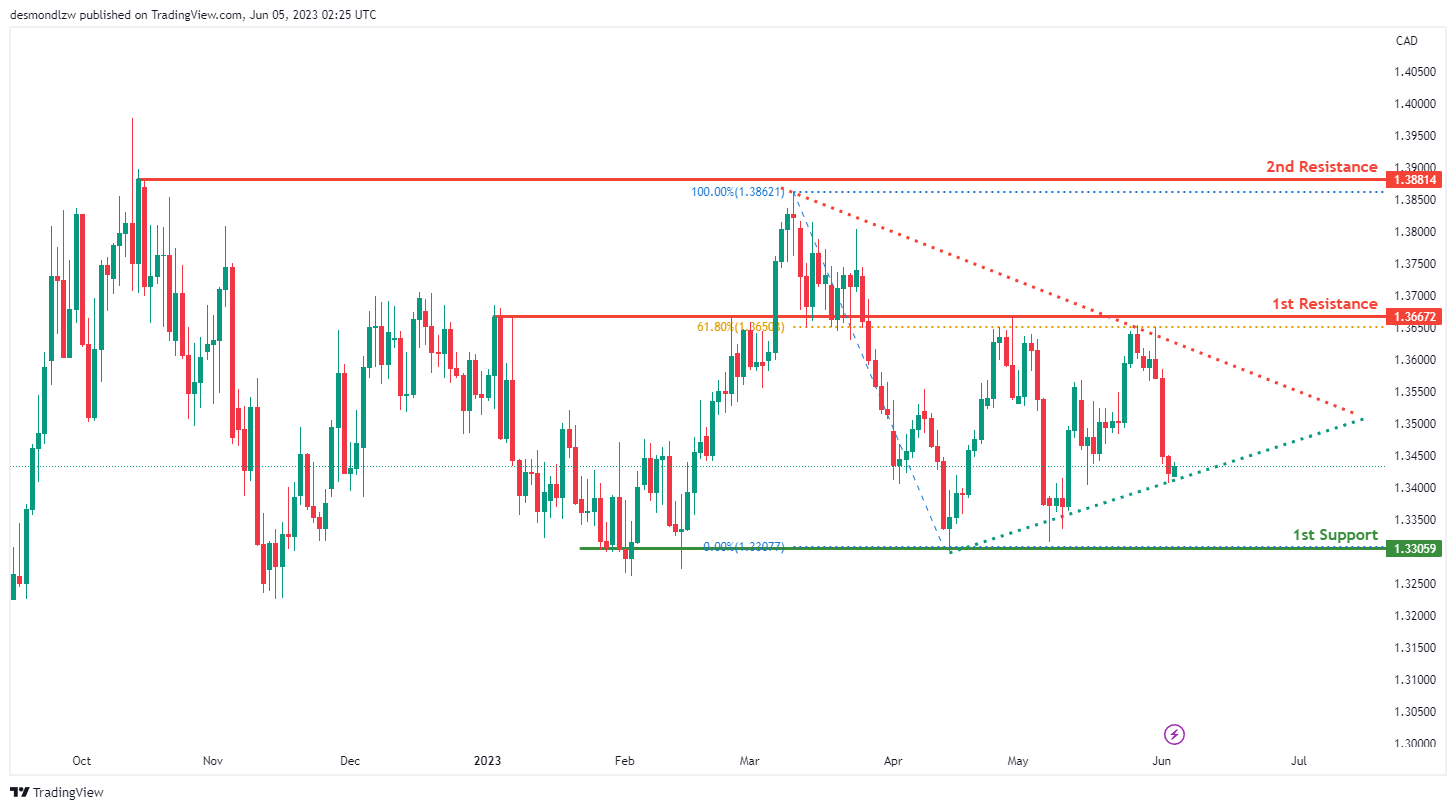
The USD/CAD chart is currently displaying a neutral momentum, suggesting an indecisive market.
The price could potentially fluctuate between the first resistance and first support levels due to this uncertainty.
The first support level is at 1.3305 and is identified as a multi-swing low support. This level represents an area of significant buying interest, which could prevent further price declines.
On the other hand, the first resistance level is at 1.3667. This level serves as an overlap resistance and aligns with the 61.80% Fibonacci retracement, enhancing its potential to halt upward price movements.
The second resistance level is at 1.3881 and is recognized as a swing high resistance. This level could also serve as a hurdle to further price increases.
A noteworthy observation is the presence of a symmetrical triangle chart pattern. This pattern typically represents a period of consolidation before the price is forced to breakout or breakdown. A break above the pattern’s upper trendline could signal a bullish breakout, while a break below the lower trendline might indicate a bearish breakdown.
AUD/USD:
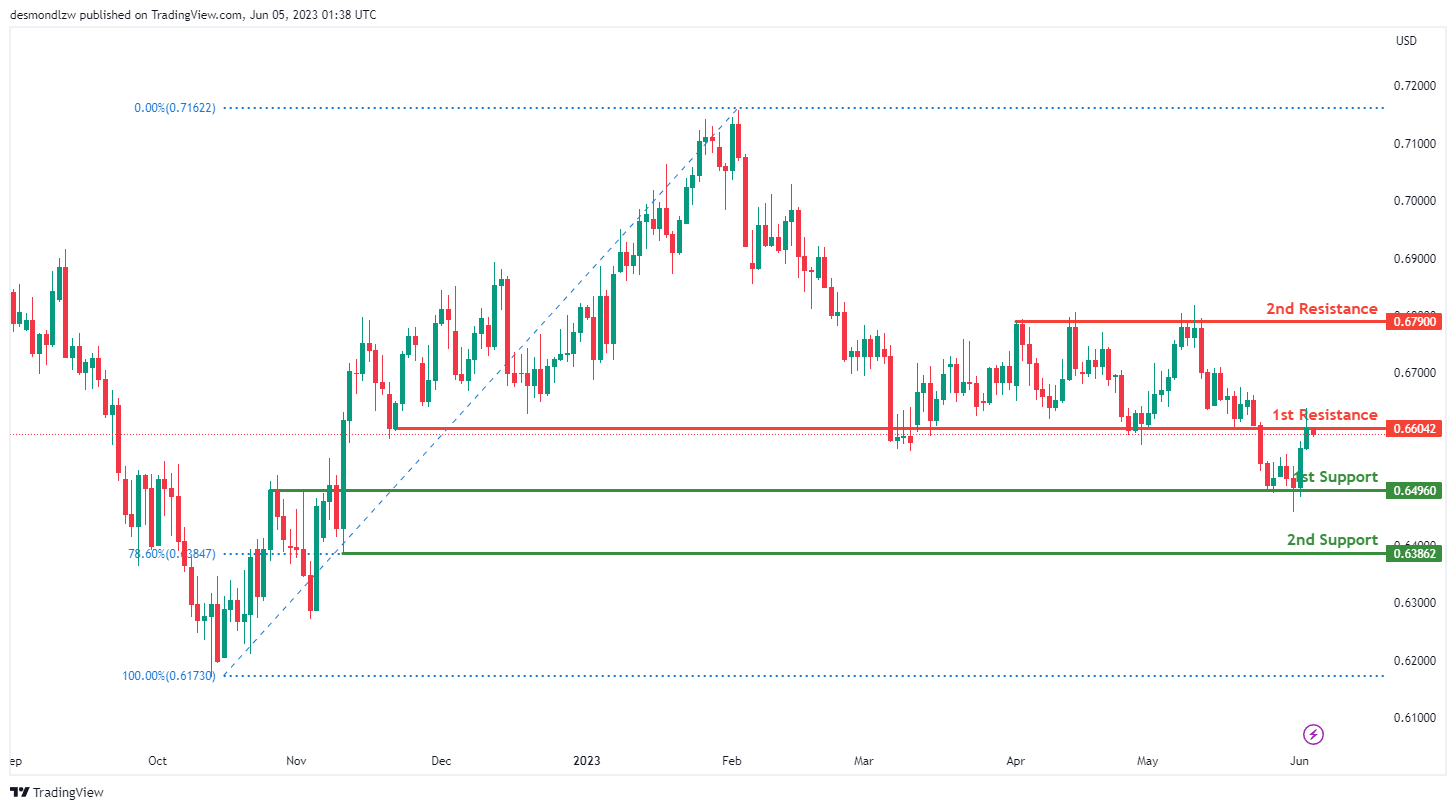
The AUD/USD chart is currently demonstrating a bearish momentum, suggesting a downward trend in the market.
Considering this bearish momentum, it’s plausible that the price may react bearishly off the first resistance level and drop towards the first support level.
The first support level is located at 0.6496. This is identified as an overlap support, an area in the market structure that has previously attracted buyers.
The second support level is at 0.6386, serving as a swing low support and aligning with the 78.60% Fibonacci retracement. This enhances its significance as a potential buying zone.
On the contrary, the first resistance level is at 0.6604. Recognized as an overlap resistance, this level could temporarily halt any bullish price movements.
Additionally, the second resistance level is at 0.6790. This multi-swing high resistance level could pose a significant challenge to further price increases.
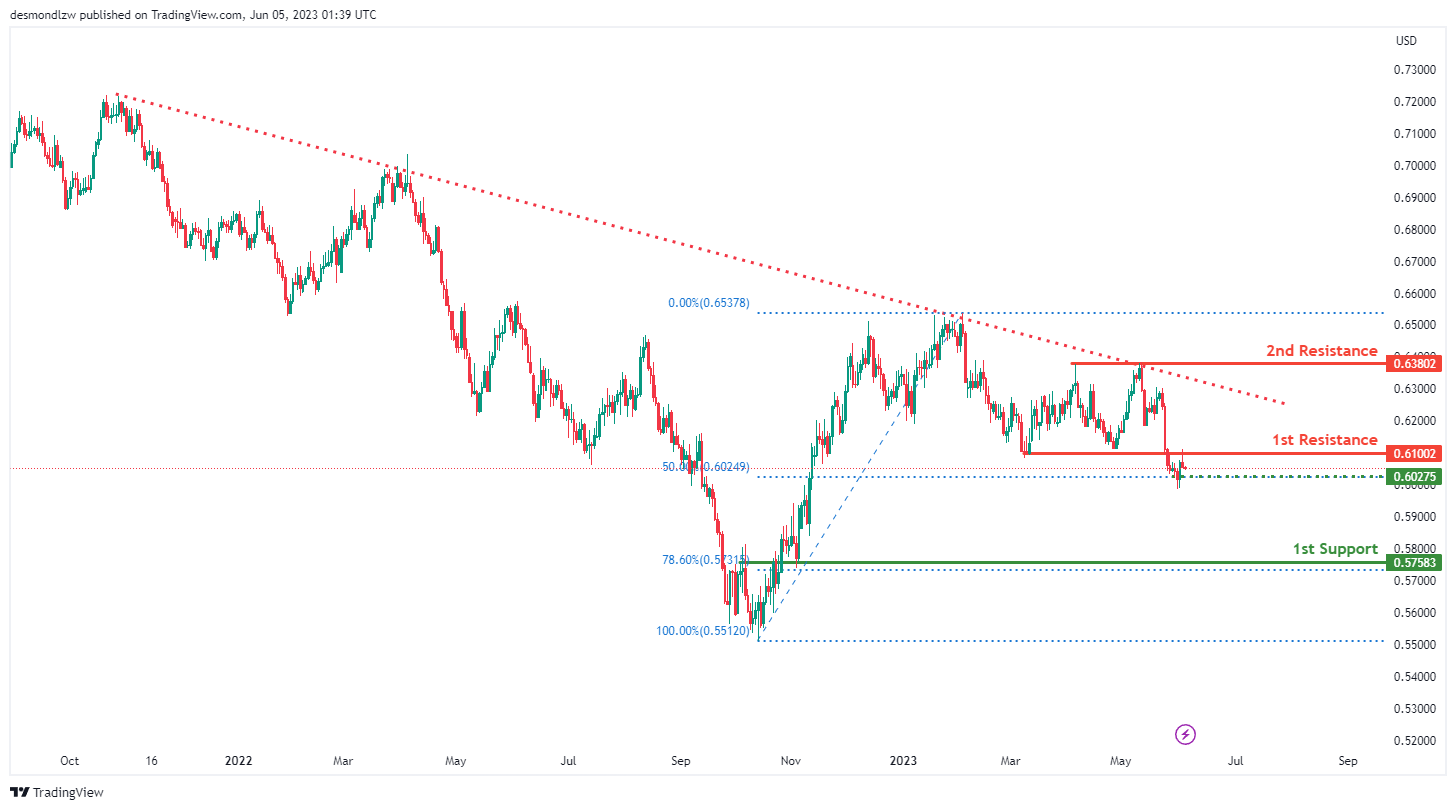
NZD/USD
The NZD/USD chart is currently demonstrating bearish momentum, with the price being below a major descending trend line which suggests a continuation of the bearish trend.
In light of this bearish momentum, it’s possible that the price may react bearishly off the first resistance level and drop towards the first support level.
The first support level is at 0.5758, identified as an overlap support and aligning with the 78.60% Fibonacci retracement. This adds to its significance as a potential buying zone in the market structure.
An intermediate support level is also present at 0.6027, serving as a swing low support and aligning with the 50% Fibonacci retracement, further reinforcing its potential significance.
In contrast, the first resistance level is at 0.6100, recognized as an overlap resistance. This level could act as a barrier to potential bullish price movements.
Finally, the second resistance level is at 0.6380, identified as a multi-swing high resistance, which could pose a challenge to further price increases.
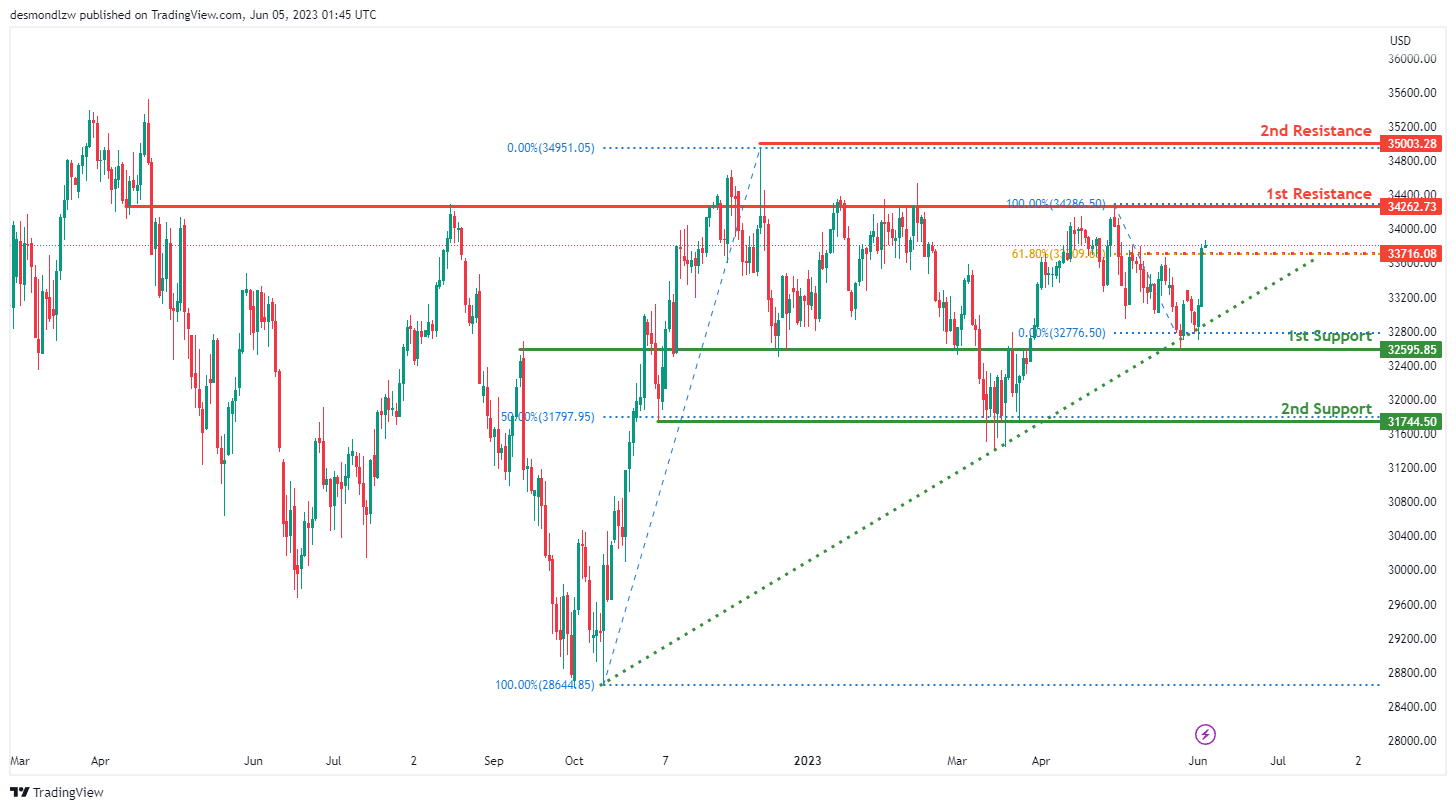
DJ30:
The DJ30 (Dow Jones Industrial Average) chart is currently exhibiting bullish momentum, which is reinforced by the fact that the price is above a significant ascending trend line, suggesting that further bullish movement is on the horizon.
Given this momentum, it’s possible that the price might continue to rise towards the first resistance level. The first support level is found at 32595.85, serving as an overlap support and aligns with the 78.60% Fibonacci retracement level, reinforcing its importance.
An intermediate support level is located at 31744.50. This multi-swing low support is significant and is associated with the 50% Fibonacci retracement level.
The first resistance level is at 34267.73 and is identified as an overlap resistance, which could act as a temporary barrier to further price increases.
The second resistance level is at 35003.28 and is categorized as a swing high resistance, suggesting that it could pose a challenge to further bullish momentum.
An intermediate resistance level is at 33716.08, which is a swing high resistance and coincides with the 61.80% Fibonacci retracement level, suggesting that it might act as a temporary barrier to price increases.
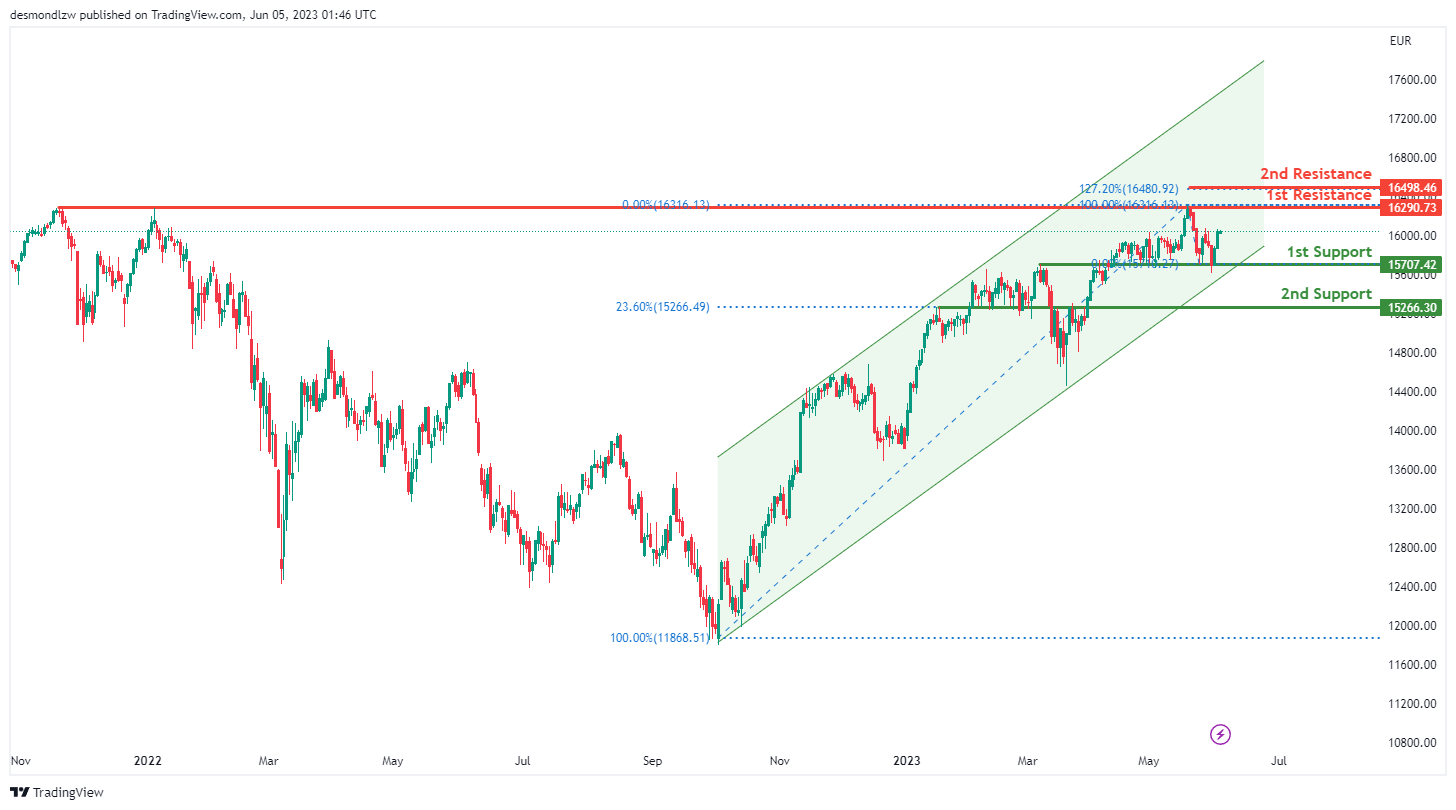
GER30:
The GER30 (Germany 30) chart currently shows bullish momentum, supported by the fact that the price is within a bullish ascending channel, indicating potential for further upward movement.
Given this momentum, the price might potentially continue its ascent towards the first resistance level. The first support level is set at 15707.42, defined as an overlap support, enhancing its significance in the chart.
An intermediate support level is located at 15266.30, acting as a pullback support and coinciding with the 23.60% Fibonacci retracement level, reinforcing its importance.
The first resistance level is placed at 16290.73. This level is considered a multi-swing high resistance and could act as a temporary barrier to further price increases.
The second resistance level is found at 35003.28, aligning with the 127.20% Fibonacci extension. This suggests that it could provide a considerable challenge to continued bullish momentum.
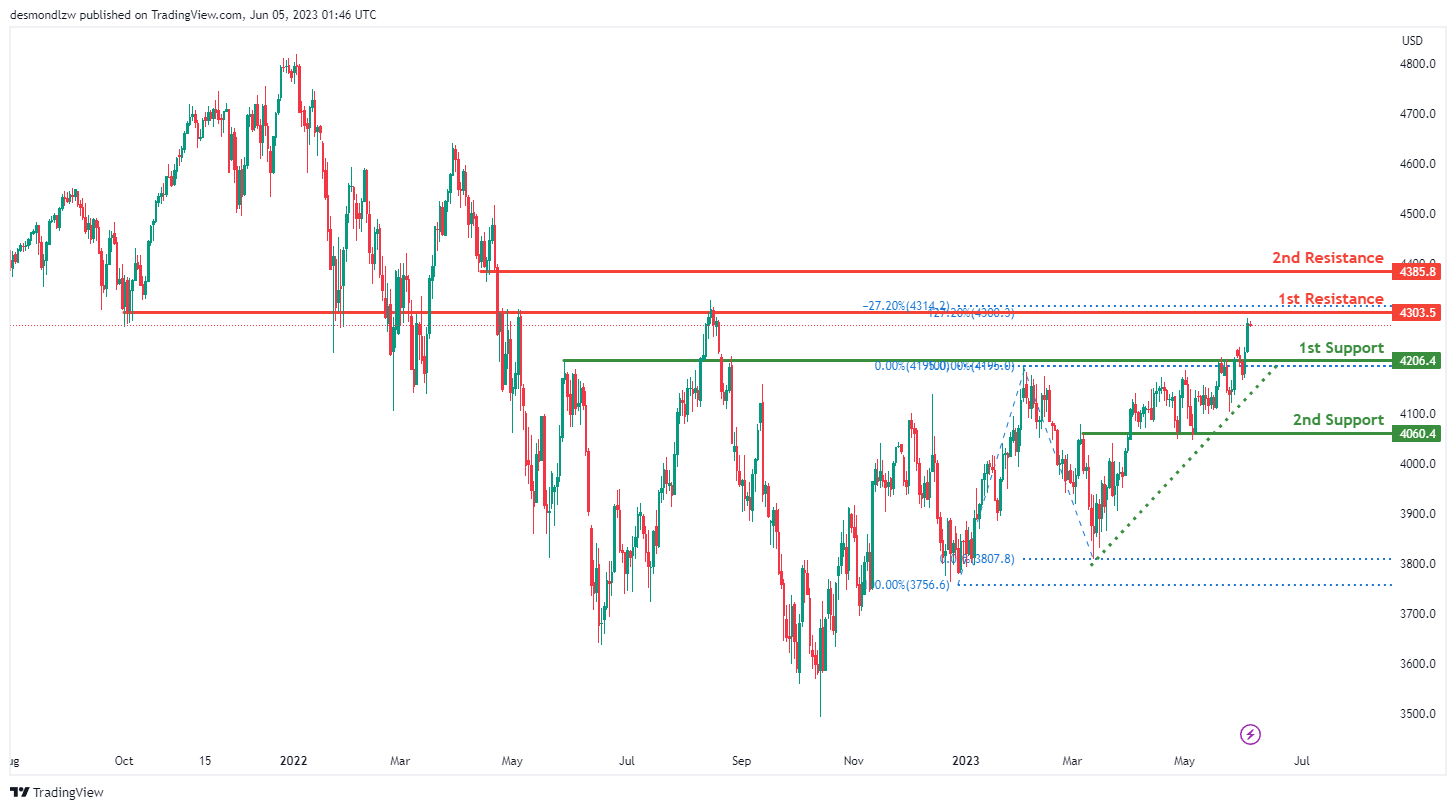
US500
The US500 chart currently displays bullish momentum, as the price is above a significant ascending trend line, indicating the potential for further bullish momentum.
Given the current momentum, the price could potentially drop to the first support level in the short term before bouncing back and rising to the first resistance level.
The first support level is at 4206.4 and is identified as a pullback support, which strengthens its significance in the chart.
An intermediate support level is at 4060.4 and is identified as an overlap support, which further emphasizes its significance.
The first resistance level is at 4303.5. This level is seen as an overlap resistance and aligns with the 127.20% Fibonacci Extension and -27% Fibonacci Expansion. This alignment, known as Fibonacci confluence, can add to the level’s credibility as a potential resistance point.
The second resistance level is at 4385.8, recognized as a pullback resistance, which could potentially act as a temporary barrier to further price increases.
BTC/USD:
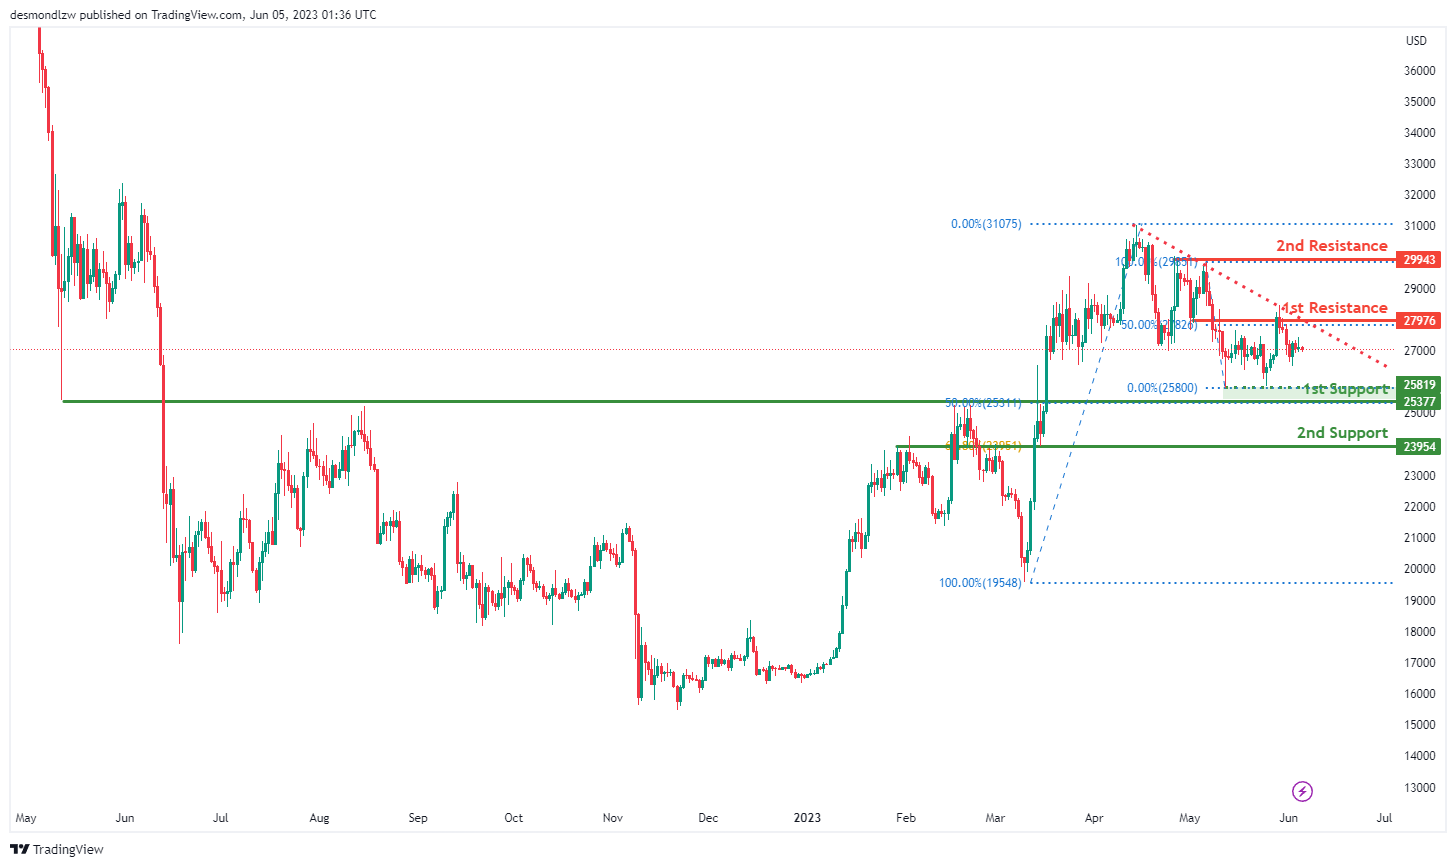
The BTC/USD chart currently exhibits a bearish momentum, with the price below a significant descending trend line, suggesting potential further bearish movements.
In light of this bearish momentum, the price could potentially continue its downward movement towards the first support level.
The first support level is at 25377, identified as a pullback support. This level aligns with the 50% Fibonacci Retracement, reinforcing its significance.
A second support level is at 23954, identified as an overlap support, which also aligns with the 61.80% Fibonacci Retracement, enhancing its significance.
The first resistance level is at 27976. This level is identified as an overlap resistance and coincides with the 50% Fibonacci Retracement, adding to its importance as a potential resistance point.
The second resistance level is at 29943, recognized as a multi-swing high resistance, potentially acting as a temporary barrier to further price increases.
There is also an intermediate support level at 25819, recognized as a swing low support, which could provide additional support to the price.
ETH/USD:
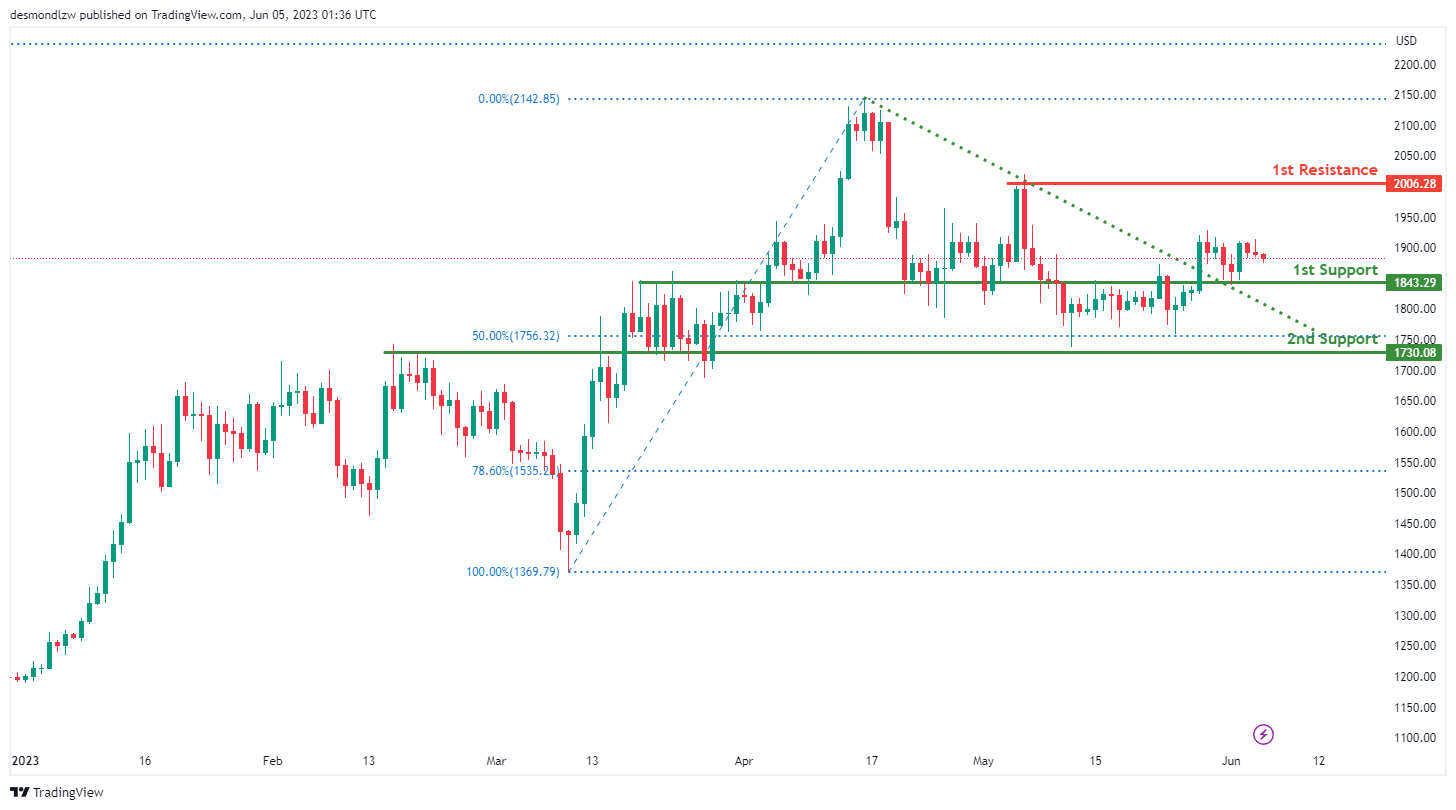
The ETH/USD chart currently shows a bullish momentum, with the price having broken above a significant descending resistance line, suggesting potential further bullish movements.
Given this bullish momentum, the price could potentially continue its upward trend towards the first resistance level.
The first support level is at 1843.29, identified as an overlap support. This level serves as a significant area where buyers have previously entered the market, adding to its significance.
The second support level is at 1730.08, also identified as an overlap support. This level also aligns with the 50% Fibonacci Retracement, enhancing its importance as a potential support area.
The first resistance level is at 2006.28. This level is recognized as a swing high resistance, indicating its historical significance as a price level where selling pressure has emerged, potentially acting as a temporary barrier to further price increases.
WTI/USD:
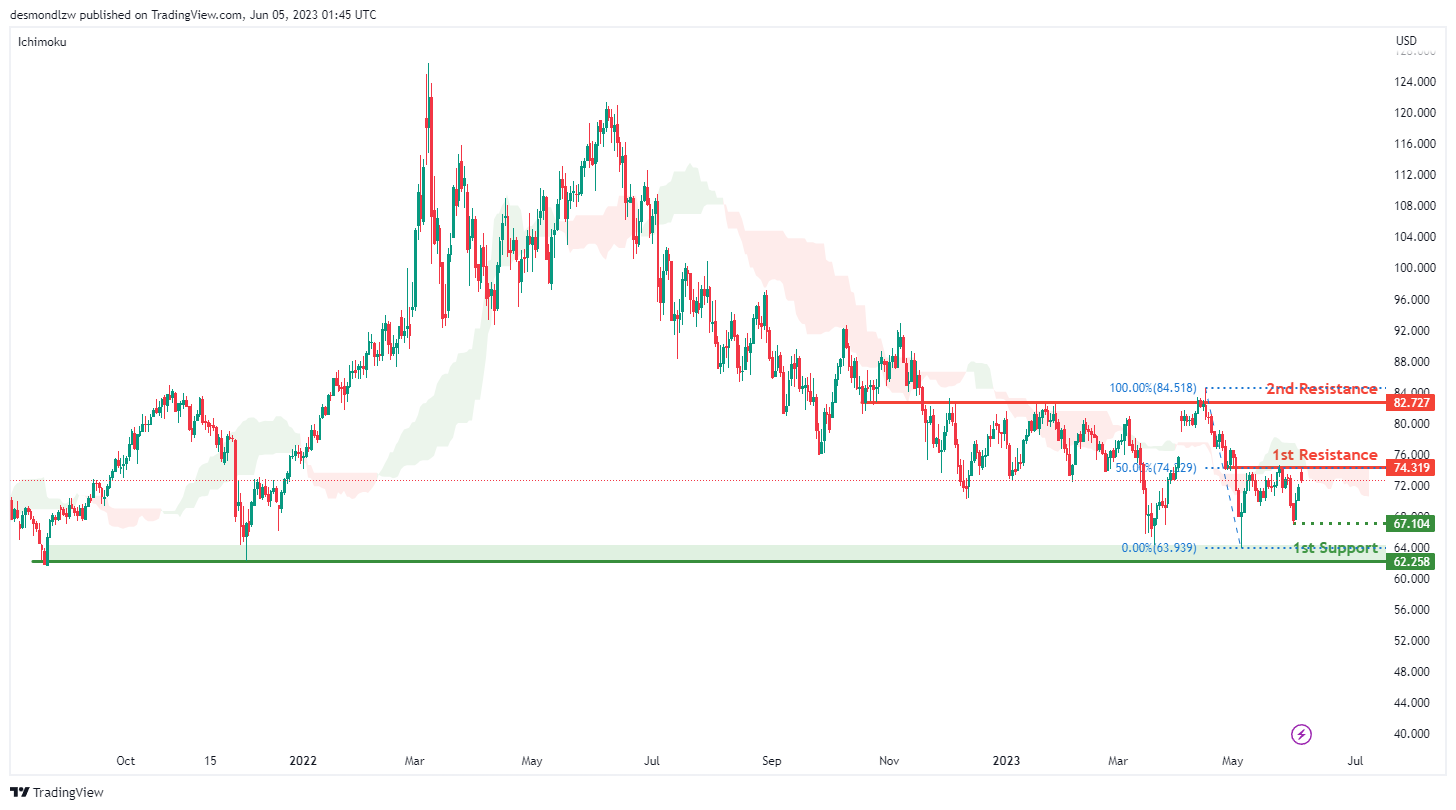
The WTI chart currently exhibits a bearish momentum, as the price is below the bearish Ichimoku cloud, suggesting potential further downward movements.
Given this bearish momentum, the price could potentially react off the first resistance level and continue its downward trend towards the first support level.
The first support level is at 62.25, identified as a multi-swing low support. This level has historically served as a significant area where buyers have entered the market, adding to its importance as a potential support area.
The first resistance level is at 74.31, recognized as an overlap resistance. This level also coincides with the 50% Fibonacci retracement, enhancing its significance as a potential barrier to further price increases.
The second resistance level is at 82.72, identified as an overlap resistance. This level represents a price point where sellers have previously entered the market, potentially acting as another barrier to upward price movements.
XAU/USD (GOLD):
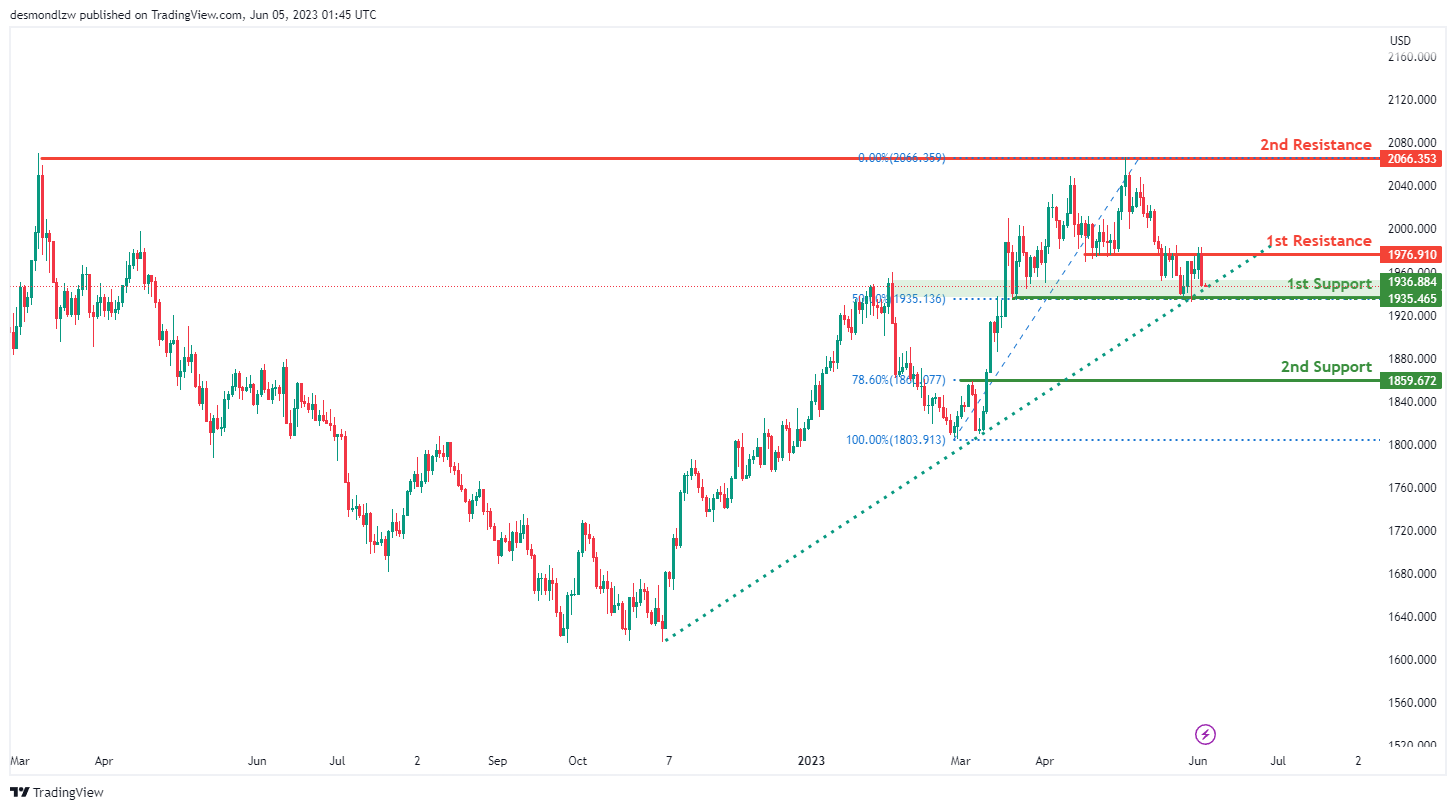
The XAU/USD chart currently exhibits a bullish momentum, with the price above a major ascending trend line. This implies that there’s potential for further upward movements.
In this bullish context, the price could potentially continue its upward trend towards the first resistance level.
The first support level is at 1935.46. This level, recognized as a multi-swing low support, also coincides with the 50% Fibonacci retracement level, strengthening its significance as a potential area where buyers may enter the market.
The second support level is at 1859.67. This pullback support level is also at the 78.60% Fibonacci retracement level, enhancing its importance as a potential price floor.
The first resistance level is at 1976.91, identified as an overlap resistance. This is an area where sellers have previously entered the market, possibly acting as a barrier to further price increases.
The second resistance level is at 2066.35, noted as a multi-swing high resistance. This level could serve as another significant barrier to further upward price movement.
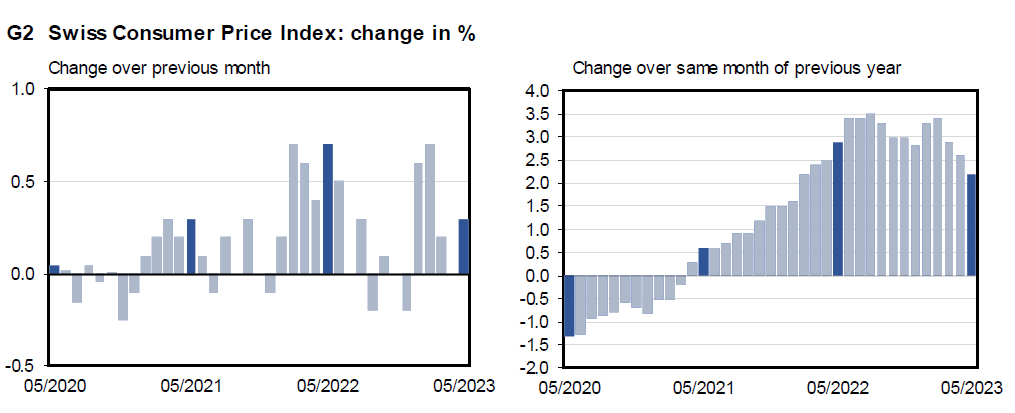
Swiss CPI slowed to 2.2% yoy in May, slightly above expectations
Swiss CPI rose 0.3% mom in May, slightly below expectation of 0.4% mom. Core CPI (excluding fresh and seasonal products, energy and fuel) rose 0.2% mom. Domestic products prices rose 0.3% mom. Imported products prices rose 0.1% mom.
Comparing with May 2022, CPI slowed from 2.6% yoy to 2.2% yoy, above expectation of 2.1% yoy. Core CPI was unchanged at 2.2% yoy. Domestic products prices slowed from 2.6% yoy to 2.4% yoy. Imported products prices fell notably from 2.4% yoy to 1.4% yoy.
USD/JPY Daily Outlook
Daily Pivots: (S1) 139.03; (P) 139.55; (R1) 140.49; More...
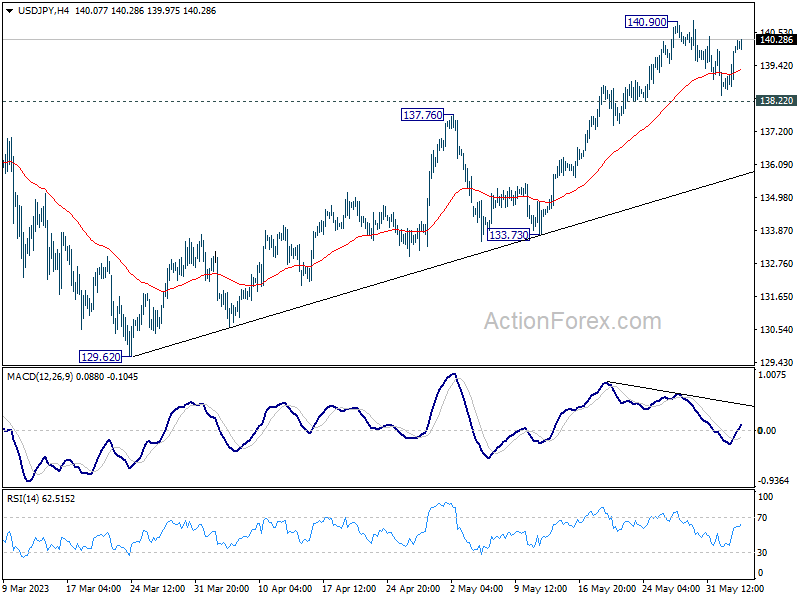
Intraday bias in USD/JPY stays neutral as consolidation from 140.90 is extending. Further rally is expected as long as 138.22 minor support holds. On the upside, break of 140.90 will resume larger rise from 127.20 to 142.48 fibonacci level. However, considering bearish divergence condition in 4 hour MACD, break of 138.22 will confirm short term topping, and turn bias back to the downside for 55 D EMA (now at 136.27).
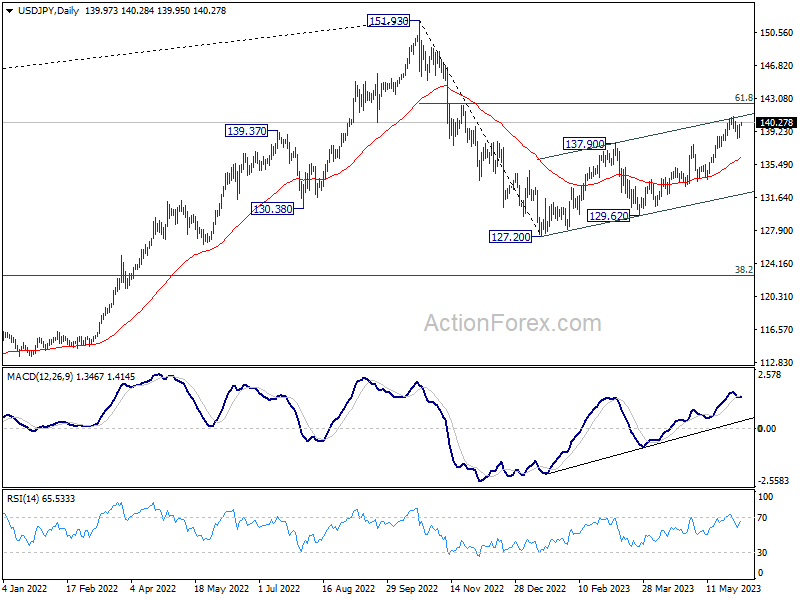
In the bigger picture, rise from 127.20 is seen as the second leg of the corrective pattern from 151.93 high. Stronger rally would be seen to 61.8% retracement of 151.93 to 127.20 at 136.34. Sustained break there will pave the way back to retest 151.93. On the downside, however, break of 133.73 support will argue that the pattern could have started the third leg through 127.20 low.
Japan Stocks Skyrocket to 33-Year High; Commodity Currencies Display Strength
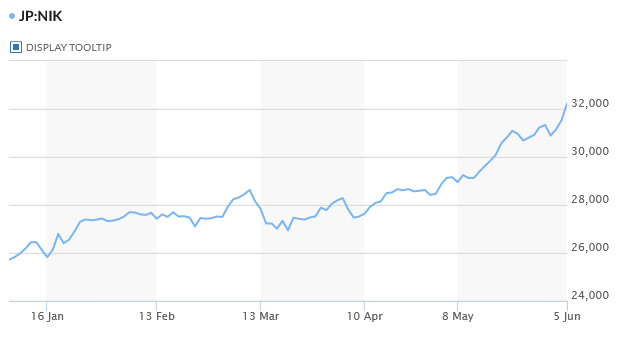
In a remarkable rally during Asian session, Japanese stocks surged sharply, with Nikkei index smashing through the 32k mark, reaching a high not seen in 33 years. This surge followed the bullish trend seen in US markets last week, further buoyed by robust services data emanating from Japan and China. However, it's important to note that outside Japan, stock markets are experiencing a more sluggish performance.
Turning our attention to the currency markets, commodity currencies are exhibiting notable strength, with US Dollar performing well, albeit lagging slightly behind Australian Dollar and New Zealand Dollar. Both Australian Dollar and Canadian Dollar are looking forward to potential hawkish holds by their respective central banks - RBA and BoC - later in the week.
Interestingly, Dollar continues to show a decoupling from risk sentiment, displaying strength even as risk appetite seems to be strongly on the "on"side. European currencies, along with Japanese Yen, are generally underperforming.
The week ahead promises to be exciting, with crucial monetary policy decisions from RBA and BoC that could influence the path of commodity currencies and, by extension, global currency dynamics.
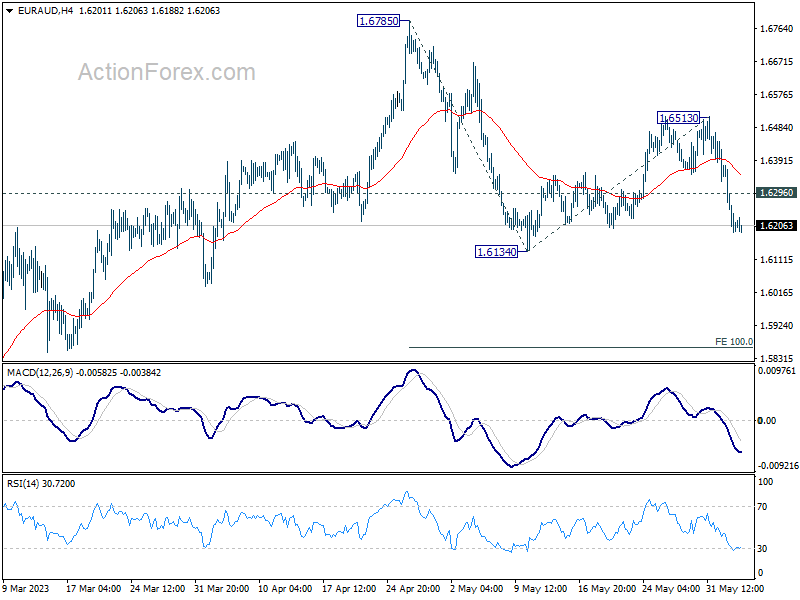
Technically, EUR/AUD would be a focus in the next 24-hours with RBA a feature. Based on current downside momentum, fall from 1.6513 is possibly resuming whole decline from 1.6785. Deeper fall is in favor as long as 1.6296 minor resistance holds. Break of 1.6134 will confirm this bearish case and target 100% projection of 1.6785 to 1.6134 from 1.6513 at 1.5862.
In Asia, Nikkei closed up 2.12% at 32192.32. Hong Kong HSI is up 0.33%. China Shanghai SSE is down -0.04%. Singapore Strait Times is up 0.63%. Japan 10-year JGB yield is up 0.0175 at 0.433.
Oil prices surge as Saudi Arabia pledges additional production cut
Oil prices shot up in response to an announcement from Saudi Arabia, the world's leading exporter, to slash production by an additional 1 million barrels per day starting in July. This voluntary reduction from the Saudis comes on the heels of an agreement by OPEC and their allies, including Russia, to curtail supply into 2024.
Collectively referred to as OPEC+, this group accounts for approximately 40% of the world's crude oil production. The group currently has cuts of 3.66 million barrels per day in place, which translates to about 3.6% of global demand.
The latest move by Saudi Arabia may take many by surprise, given that the most recent adjustments to quotas were implemented just a month ago. Consequently, the oil market is poised to tighten even further in the second half of 2023.\
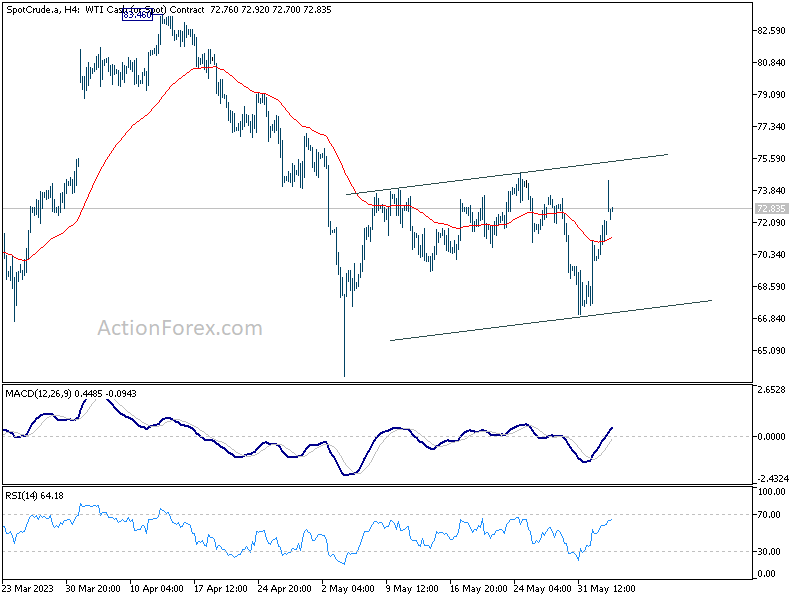
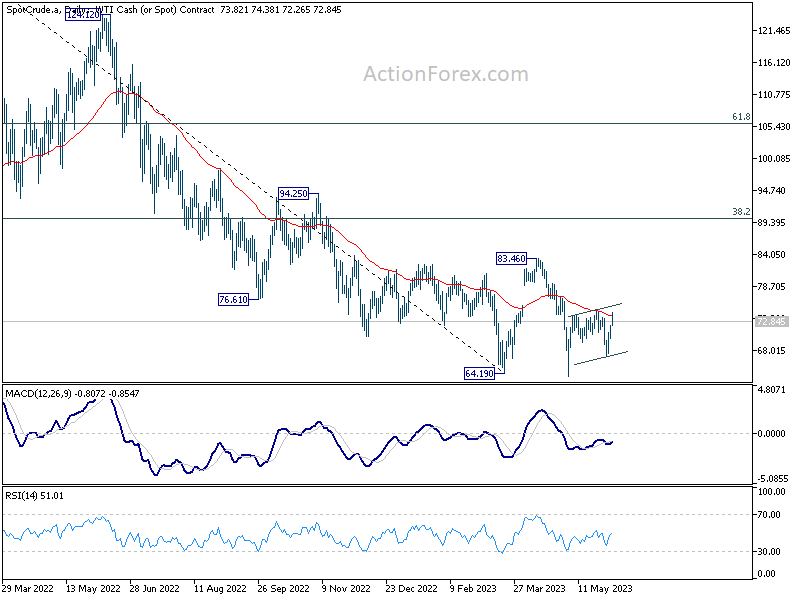
Technically speaking, however, WTI crude oil is just extending near term range trading. It's currently struggling to break through 55 D EMA decisively. Rejection by 55 D EMA would set the stage for another fall through 64.19 low to resume the medium term down trend sooner rather than later. Even though sustained break of 55 D EMA could bring stronger rebound, 83.46 will still represent a significant medium term resistance to overcome.
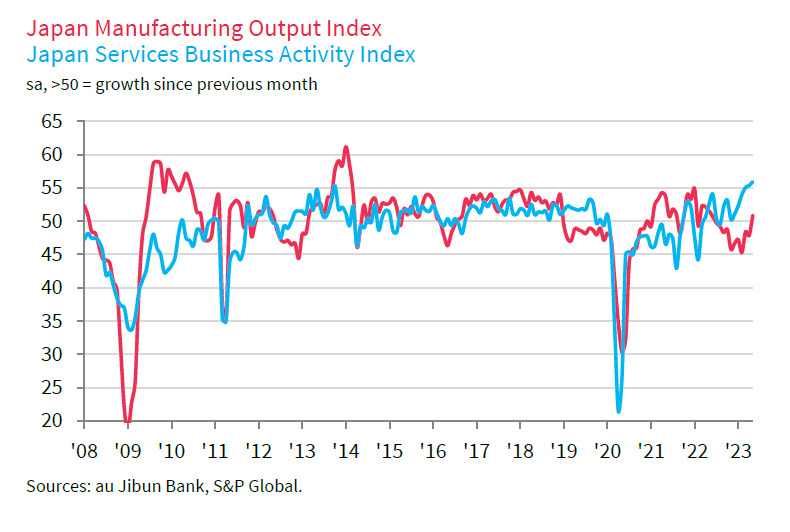
Japan PMI services finalized at record 55.9, overall growth accelerated in Q2
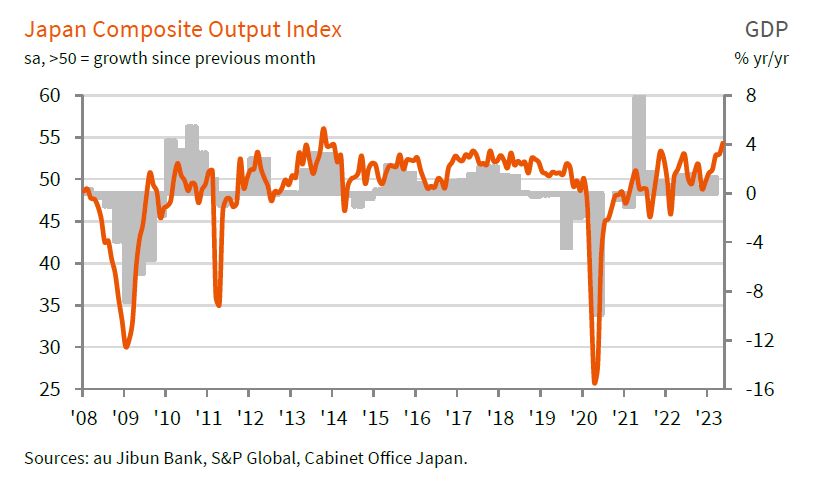
Japan PMI Services was finalized at 55.9 in May, up from April's 55.4, setting another fresh series record. PMI Composite was finalized at 54.3, up from April's 52.9, the second strongest reading since record began in 2007, after October 2013.
Usamah Bhatti, Economist at S&P Global Market Intelligence, said: "The record expansion in activity among service providers, coupled with a renewed increase in manufacturing production contributed to a stronger increase in overall private sector activity.
"The rate of expansion was solid and the second-strongest in the history of the series (behind October 2013). The upturn was led by the dominant services sector, although there was a renewed sense of optimism for private sector activity given the expansions in manufacturing output and new orders.
"Latest data also provides the indication economic growth has accelerated in the second quarter of the year, following the 1.3% year-on- year increase in growth in the first quarter of 2023, according to the latest official statistics."
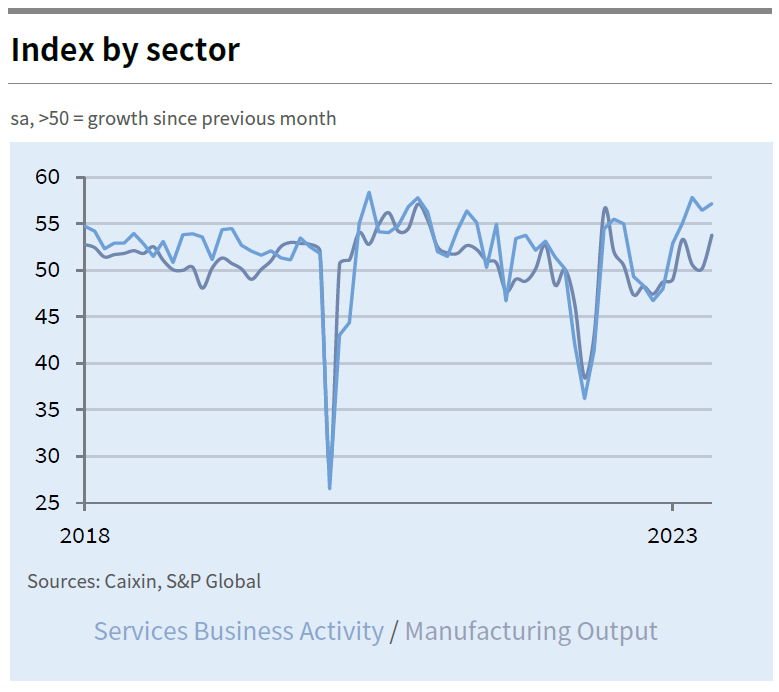
China Caixi PMI services rose to 57.1, overall economy lacks internal drive
China Caixin PMI Services rose from 56.4 to 57.1 in May, above expectation of 55.2. The rate of expansion was the second-steepest seen over the past two-and-a-half years. PMI Composite rose from 53.6 to 55.6, highest since end of 2020.
Wang Zhe, Senior Economist at Caixin Insight Group said: "In general, it remains a prominent feature of the Chinese economy that the services sector is stronger than manufacturing. In May, the Caixin China services PMI showed that services activity was picking up overall, but employment expansion and market optimism weakened. In the manufacturing sector, employment deteriorated, prices plunged, and manufacturers also became less optimistic toward the outlook, according to the Caixin China manufacturing PMI.
"This divergence highlights that economic growth is lacking internal drive and market entities lack sufficient confidence, underscoring the importance of expanding and restoring demand. Currently, stabilizing employment, increasing income and bolstering expectations through proactive fiscal policy should be prioritized given a dire job market and mounting deflationary pressure.
RBA and BoC interest rate decisions in Focus
RBA and BoC are set to announce their interest rates decisions this week, with both banks expected to maintain the status quo at 3.85% and 4.50% respectively.
BoC's decision to pause started in March and June meeting will be the third consecutive time the central bank has chosen to stand pat. However, expectations of a BoC rate hike are mounting in the wake of recent data showing robust GDP growth and persistent inflation. While June seems too early for the central bank to make a move, any hawkish undertones in the statement indicating openness for action in Q3 could buoy Canadian dollar.
As for RBA, markets are pricing in around 1/3 chance of a hike this week. So a hold is the more likely outcome even though the central bank has recent history of surprising the markets. The perception is that current interest rate level is not restrictive enough to bring down inflation to target within a reasonable timeframe. Therefore, further tightening is expected in the future. If RBA aims to set market expectations for a quarter-point hike per quarter, the next move will likely be in August.
On the data front, Eurozone Sentix investor confidence; Australia GDP, China Caixin PMI services CPI and PPI, as well as Canada employment are worth watching too.
Here are some highlights for the week:
- Monday: Australia MI inflation gauge; China Caixin PMI Services; Germany trade balance; Swiss CPI; Eurozone PMI services final, Sentix investor confidence, PPI; US ISM services, factory orders.
- Tuesday: Japan average cash earnings, household spending,; RBA rate decision; Germany factor orders, UK PMI construction, Eurozone retail sales; Canada building permits, Ivey PMI.
- Wednesday: Australia GDP; China trade balance; Swiss unemployment rate, foreign currency reserves; German industrial production; Italy retail sales; Canada trade balance, BoC rate decision; US trade balance.
- Thursday: Japan GDP final, current account; Australia trade balance; Eurozone GDP revision; US jobless claims.
- Friday: China CPI, PPI; Italy industrial production; Canada employment.
USD/JPY Daily Outlook
Daily Pivots: (S1) 139.03; (P) 139.55; (R1) 140.49; More...
Intraday bias in USD/JPY stays neutral as consolidation from 140.90 is extending. Further rally is expected as long as 138.22 minor support holds. On the upside, break of 140.90 will resume larger rise from 127.20 to 142.48 fibonacci level. However, considering bearish divergence condition in 4 hour MACD, break of 138.22 will confirm short term topping, and turn bias back to the downside for 55 D EMA (now at 136.27).
In the bigger picture, rise from 127.20 is seen as the second leg of the corrective pattern from 151.93 high. Stronger rally would be seen to 61.8% retracement of 151.93 to 127.20 at 136.34. Sustained break there will pave the way back to retest 151.93. On the downside, however, break of 133.73 support will argue that the pattern could have started the third leg through 127.20 low.
Economic Indicators Update
| GMT | Ccy | Events | Actual | Forecast | Previous | Revised |
|---|---|---|---|---|---|---|
| 01:00 | AUD | TD Securities Inflation M/M May | 0.90% | 0.20% | ||
| 01:30 | AUD | Company Gross Operating Profits Q/Q Q1 | 0.50% | 2.10% | 10.60% | 12.70% |
| 01:45 | CNY | Caixin Services PMI May | 57.1 | 55.2 | 56.4 | |
| 06:00 | EUR | Germany Trade Balance (EUR) Apr | 18.4B | 16.1B | 16.7B | |
| 06:30 | CHF | CPI M/M May | 0.40% | 0.00% | ||
| 06:30 | CHF | CPI Y/Y May | 2.10% | 2.60% | ||
| 07:45 | EUR | Italy Services PMI May | 53.7 | 57.6 | ||
| 07:50 | EUR | France Services PMI May F | 52.8 | 52.8 | ||
| 07:55 | EUR | Germany Services PMI May F | 57.8 | 57.8 | ||
| 08:00 | EUR | Eurozone Services PMI May F | 55.9 | 55.9 | ||
| 08:30 | EUR | Eurozone Sentix Investor Confidence Jun | -9.2 | -13.1 | ||
| 08:30 | GBP | Services PMI May F | 55.1 | 55.1 | ||
| 09:00 | EUR | Eurozone PPI M/M Apr | -2.70% | -1.60% | ||
| 09:00 | EUR | Eurozone PPI Y/Y Apr | 0.80% | 5.90% | ||
| 13:45 | USD | Services PMI May F | 55.1 | 55.1 | ||
| 14:00 | USD | ISM Services PMI May | 52.6 | 51.9 | ||
| 14:00 | USD | Factory Orders M/M Apr | 0.80% | 0.90% |
China Caixin PMI services rose to 57.1, overall economy lacks internal drive
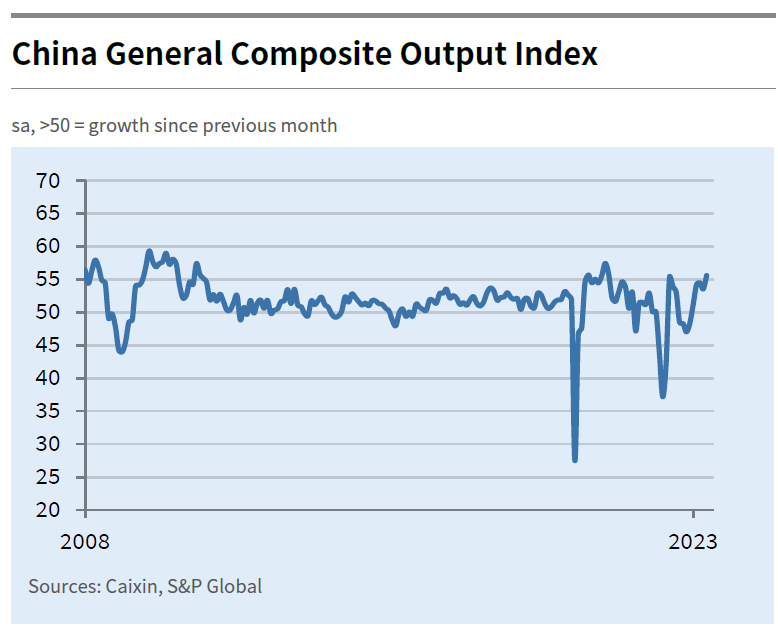
China Caixin PMI Services rose from 56.4 to 57.1 in May, above expectation of 55.2. The rate of expansion was the second-steepest seen over the past two-and-a-half years. PMI Composite rose from 53.6 to 55.6, highest since end of 2020.
Wang Zhe, Senior Economist at Caixin Insight Group said:
"In general, it remains a prominent feature of the Chinese economy that the services sector is stronger than manufacturing. In May, the Caixin China services PMI showed that services activity was picking up overall, but employment expansion and market optimism weakened. In the manufacturing sector, employment deteriorated, prices plunged, and manufacturers also became less optimistic toward the outlook, according to the Caixin China manufacturing PMI.
"This divergence highlights that economic growth is lacking internal drive and market entities lack sufficient confidence, underscoring the importance of expanding and restoring demand. Currently, stabilizing employment, increasing income and bolstering expectations through proactive fiscal policy should be prioritized given a dire job market and mounting deflationary pressure."
Japan PMI services finalized at record 55.9, overall growth accelerated in Q2
Japan PMI Services was finalized at 55.9 in May, up from April's 55.4, setting another fresh series record. PMI Composite was finalized at 54.3, up from April's 52.9, the second strongest reading since record began in 2007, after October 2013.
Usamah Bhatti, Economist at S&P Global Market Intelligence, said: "The record expansion in activity among service providers, coupled with a renewed increase in manufacturing production contributed to a stronger increase in overall private sector activity.
"The rate of expansion was solid and the second-strongest in the history of the series (behind October 2013). The upturn was led by the dominant services sector, although there was a renewed sense of optimism for private sector activity given the expansions in manufacturing output and new orders.
"Latest data also provides the indication economic growth has accelerated in the second quarter of the year, following the 1.3% year-on- year increase in growth in the first quarter of 2023, according to the latest official statistics."
Oil prices surge as Saudi Arabia pledges additional production cut
Oil prices shot up in response to an announcement from Saudi Arabia, the world's leading exporter, to slash production by an additional 1 million barrels per day starting in July. This voluntary reduction from the Saudis comes on the heels of an agreement by OPEC and their allies, including Russia, to curtail supply into 2024.
Collectively referred to as OPEC+, this group accounts for approximately 40% of the world's crude oil production. The group currently has cuts of 3.66 million barrels per day in place, which translates to about 3.6% of global demand.
The latest move by Saudi Arabia may take many by surprise, given that the most recent adjustments to quotas were implemented just a month ago. Consequently, the oil market is poised to tighten even further in the second half of 2023.
Technically speaking, however, WTI crude oil is just extending near term range trading. It's currently struggling to break through 55 D EMA decisively. Rejection by 55 D EMA would set the stage for another fall through 64.19 low to resume the medium term down trend sooner rather than later. Even though sustained break of 55 D EMA could bring stronger rebound, 83.46 will still represent a significant medium term resistance to overcome.