Sample Category Title
EUR/USD Recovery Could Fade As Bears Remain In Control
Key Highlights
- EUR/USD attempted a minor upside correction from 1.0635.
- It traded above a key bearish trend line with resistance near 1.0700 on the 4-hour chart.
- GBP/USD is struggling to recover above the 1.2550 resistance zone.
- The US ISM Services PMI could decline from 51.9 to 51.5 in May 2023.
EUR/USD Technical Analysis
The Euro followed a bearish path below the 1.0750 support against the US Dollar. EUR/USD even traded below 1.0665 before the bulls appeared.
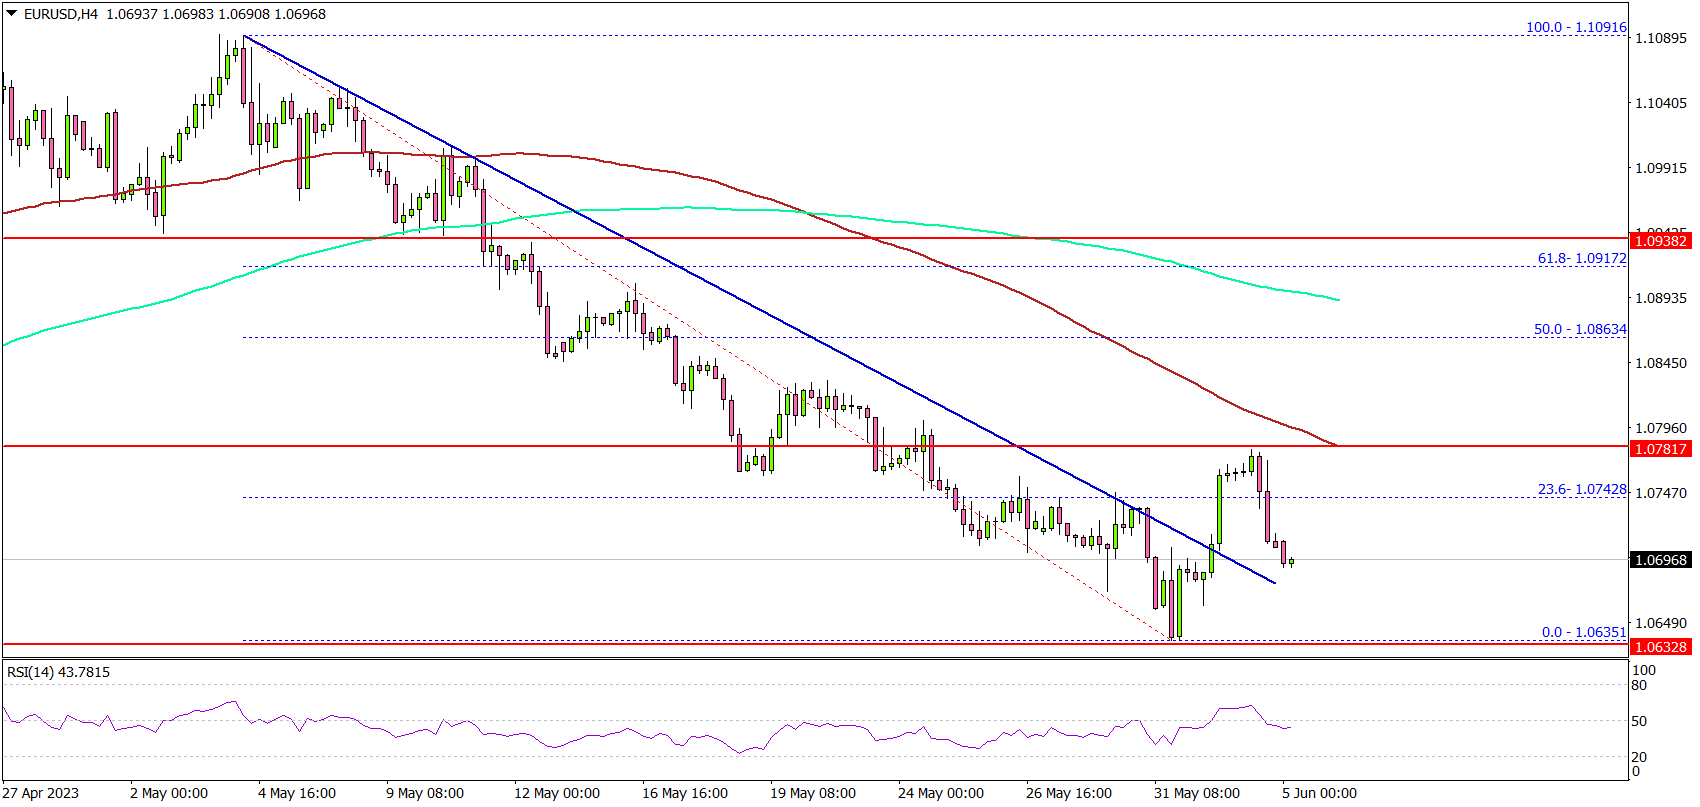
Looking at the 4-hour chart, the pair traded as low as 1.0635, and settled well below the 100 simple moving average (red, 4 hours) and the 200 simple moving average (green, 4 hours).
Recently, there was a minor upside correction above the 1.0700 level. The pair traded above a key bearish trend line with resistance near 1.0700 on the same chart. However, the bears were active near the 1.0800 zone and the 100 simple moving average (red, 4 hours).
The next major resistance is near 1.0820, above which the pair could rise toward the 1.0850 level. If there is no wave above 1.0800, the pair could dip toward 1.0635.
The next major support is near the 1.0620 level. If there is a downside break below the 1.0620 support, the pair could decline toward the 1.0550 support.
Looking at GBP/USD, the pair attempted an upside correction but the bears are still active below the 1.2550 resistance zone.
Economic Releases
- Germany’s Services PMI for May 2023 - Forecast 57.8, versus 57.8 previous.
- Euro Zone Services PMI for May 2023 – Forecast 55.9, versus 55.9 previous.
- UK Services PMI for May 2023 – Forecast 55.1, versus 55.1 previous.
- US Services PMI for May 2023 – Forecast 55.1, versus 55.1 previous.
- US ISM Services PMI for May 2023 – Forecast 51.5, versus 51.9 previous.
Forex and Cryptocurrencies Forecast
EUR/USD: Will the Dollar Return to Steady Growth?
The dollar has been rising since May 4. The DXY Index reached the 104.609 mark on the last day of spring, May 31. It hasn't soared this high since January 2023. As we have previously mentioned, two primary factors were propelling the American currency upwards.
The first one is the investors' appetite for the dollar as a safe-haven asset, triggered by the threat of a U.S. default. However, the Senate voted in favour of passing a bill on the public debt limit last week. Consequently, the default threat has finally passed, which has improved market sentiments and weakened demand for the dollar.
The second factor was the anticipation of a further rise in the key Federal Reserve interest rate. Amid hawkish statements from officials, the probability that the FOMC (Federal Open Market Committee) would increase the rate to 5.5% at its June 14 meeting rose above 60% by the end of May.
However, as the old song goes, "a beauty's heart is prone to change and fickleness". The first to play the role of such a "beauty" was the new Vice President of the Federal Reserve, Philip Jefferson, who subtly hinted at the need for a pause in the monetary tightening process. Furthermore, Patrick Harker, the president of the Federal Reserve Bank of Philadelphia, outright stated that "we should skip the rate hike at least at the June meeting". Then, Harker went even further and suggested skipping every other FOMC meeting, naturally including the one in June. Market participants immediately recalled Jerome Powell, the head of the Federal Reserve, who had also mentioned a pause.
Strong US macroeconomic data could have aided the dollar. However, the employment report from ADP released on Thursday, June 1, showed that the number of jobs in the private sector decreased from 291K in April to 278K in May. Meanwhile, the number of initial unemployment claims, albeit slightly, increased from 230K to 232K. The cooling of the economy was also indicated by the fall in the ISM's Purchasing Managers' Index (PMI) in the manufacturing sector from 47.1 to 46.9. (As a reminder, if the PMI is below 50, it indicates economic contraction, especially if the trend persists over several months). The substantial revision of data on unit labour costs for Q1 2023, which was downgraded from 6.3% to 4.2%, also fuelled dovish expectations. Such weak statistics added doubts for market participants about another rate hike on June 14th. As a result, according to the FedWatch Tool from CME Group, the chances of this happening have plummeted from 60% to 25%. The DXY Index also took a southern turn.
If the US statistics on June 1 worked against the American currency, the data from Europe the day before, on May 31, conversely, helped EUR/USD reach a 9-week low at 1.0634. The Consumer Price Index (CPI) showed that inflation in the Eurozone is on a downward trend. With a previous value of 7.0% and a forecast of 6.3%, the actual CPI dropped to 6.1%. If we talk about individual countries, the rate of consumer price growth in Italy fell from 8.7% to 8.1%, in France - from 6.9% to 6.0%, and in Germany - from 7.6% to 6.3%. In Spain, the CPI fell to a two-year low.
At the same time, with the decrease in inflation, the chances for further aggressive tightening of its monetary policy by the European Central Bank also went downhill. Although, at its next meeting on June 15, the ECB is still likely to raise the rate by 25 basis points (bp) to 4.0%, even after this, it will still remain below the current Federal Reserve rate of 5.25%. And if the ECB stops there and takes a pause, it will deprive EUR/USD bulls of an important trump card.
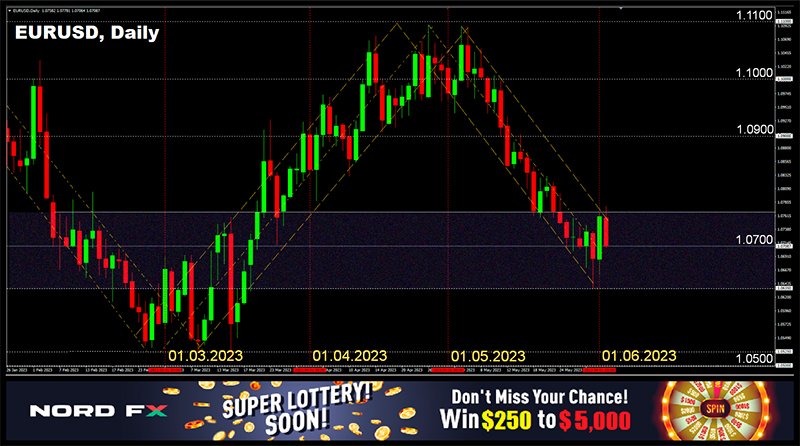
Strong labor market statistics, traditionally due on the first Friday of the month, June 2, could have helped the dollar towards the end of the week. The NFP (Non-Farm Payrolls) lived up to expectations: the number of new jobs created outside the agricultural sector, with a previous value of 294K and a forecasted fall to 180K, actually increased to 339K. However, another important indicator, the unemployment rate, disappointed investors: the unemployment rate in the US reached 3.7% in May (3.4% in April, forecast 3.5%).
Following such an ambiguous employment report, the pair ended the five-day period at a level of 1.0707. As for the near-term prospects, at the time of writing the review, the evening of June 2, the forecast is as neutral as possible: 50% of analysts expect the pair to move north, and just as many expect it to move south. Both among trend indicators and oscillators on D1, a substantial advantage is on the side of the dollar - 85% of each are coloured red, with 15% on the green side. Among trend indicators, 85% side with the reds (15% side with the greens). The pair's nearest support is located around 1.0680, followed by zones and levels at 1.0620-1.0635 and 1.0490-1.0525. Bulls will meet resistance around 1.0745-1.0707, then 1.0800-1.0835, 1.0865, 1.0895-1.0925, 1.0985, 1.1045, and 1.1090-1.1110.
For the upcoming week's calendar, it is worth noting Monday, June 5, when the ISM's Service Sector PMI (Purchasing Managers Index) for the US will be known. The EIA's (Energy Information Administration's) Energy Market Outlook and data on US crude oil reserves may cause some volatility on Tuesday and Wednesday. Additionally, Eurozone retail sales volumes will be announced on Tuesday, June 6. Thursday, June 8 could also be quite volatile, with data coming in on Eurozone GDP (Gross Domestic Product) and the US unemployment rate.
GBP/USD: UK Inflation Propels Pound Upwards
Over the last week, the pound has recovered all of its losses from May 12 to May 25. This occurred after last week's inflation figures in the UK shocked the market with an unexpected increase. The April release reported a rise in consumer prices by 1.2%, compared to the 0.8% increase recorded a month earlier. The core Consumer Price Index reached multi-year highs, hitting 6.8% YoY, exceeding the predicted 6.2%. Although annual inflation has slowed from 10.1% to 8.7%, it still exceeded the 8.2% forecast. This is a 13-month low, but still significantly above the target level. In particular, food inflation reached 19.1%, a level not seen since 1977. This figure greatly impacts low-income households, forcing them to spend more on food and less on other goods and services.
UK Chancellor of the Exchequer Jeremy Hunt has already stated the need to continue a hawkish monetary policy course, despite increasing recession risks. The official noted that economic recovery is only possible if inflation is fully defeated. As a result, investors have become more confident that the Bank of England (BoE) will raise the rate by 25 basis points at its next meeting, and likely will not stop there.
There's another factor that allowed GBP/USD to reach 1.2544 on June 2. If the dollar was strengthening its position energetically in mid-May, last week the US currency found itself under selling pressure (the reasons were indicated earlier), which facilitated a rally of GBP/USD. After the release of US labour market data, it concluded on the note of 1.2450.
In the current situation, the median forecast of analysts looks as follows: 45% of experts maintain a bullish outlook, 30% prefer the bears, and the same percentage (25%) chose to abstain from comments. Among oscillators on D1, only 15% recommend selling, 50% are set to buy, and 35% are painted in a neutral grey colour. Among trend indicators, the balance of power between green and red is 85% to 15% in favour of the greens.
If the pair moves south, its support levels and zones are 1.2390-1.2420, 1.2300-1.2330, 1.2275, 1.2200-1.2210. In the event of the pair's rise, it will meet resistance at levels 1.2480, 1.2510, 1.2540, 1.2570, 1.2610-1.2635, 1.2675-1.2700, 1.2820, and 1.2940.
The Composite Business Activity Index (PMI), as well as the PMI in the services sector of the United Kingdom will be published the next week, on Monday, June 5. The picture of business activity will be supplemented by the PMI in the country's construction sector the following day, Tuesday, June 6.
USD/JPY: The Pair Seeks a Return to Earth
The previous review was titled "USD/JPY Received a 'Ticket to the Moon'. As for the current one, it could be called "The Pair Seeks a Return to Earth". Or at least, it tries to do so, justifying the forecast given by 75% of analysts a week ago. If the pair reached its maximum for the past five-day period (and the last six months) on May 30 at the height of 140.92, the minimum on June 01 was 250 points lower, at 138.42. However, then the ambition to reach the stars took over again, and the pair finished at the level of 139.95.
It's clear that the yen's strengthening in recent days has been directly tied to the weakening of the dollar. However, when it comes to future prospects, things are very unclear and uncertain. Let's just quote a few statements.
Speaking in Parliament, Bank of Japan (BoJ) Governor Kazuo Ueda said that it will take some time to reach the 2.0% price growth target. He also added that he can't specify when this target will be reached. Moreover, the BoJ chief believes that setting strict timelines to achieve this goal could cause unexpected consequences for the market and hence is undesirable.
On Friday, June 2, a statement was also issued by Japan's Finance Minister, Shunichi Suzuki. In his opinion, currency rate movements are determined by the market and various factors. He also mentioned: "A weak yen has various impacts on Japan's economy". However, the Minister did not specify what these "various factors" are and what kind of "various impacts" he was referring to.
In the current situation, economists at ING, the largest banking group in the Netherlands, believe that "USD/JPY appears overvalued compared to trading conditions, which are now much more favorable for the yen than a year ago." They also note that "there is still a risk that the Bank of Japan will surprise on June 16, further normalizing its yield curve control policy," which would be a positive factor for the yen.
Strategists from Wells Fargo, one of the "big four" U.S. banks, are also relatively optimistic about the future of the Japanese currency, expecting the yen to be the main beneficiary of a weakening U.S. dollar. They believe that "The Bank of Japan will adjust its policy in Q4 2023 for further normalization of the government bond market," which could provide an opportunity for the yen to strengthen by the end of the year. "The strengthening of the yen should also be supported by the end of the global central bank tightening cycle and a transition to global easing, as well as a recession in the U.S. in the second half of 2023," Wells Fargo strategists said. "We are targeting a USD/JPY rate of 136.00 by the end of 2023 and 129.00 by the end of 2024." (end of quote).
As for the near future of the pair, the voices of analysts are distributed as follows. At this point, 65% of them are hoping for further strengthening of the Japanese currency and movement of the pair to the south. Only 25% of experts vote for a rise in the dollar, and the remaining 10% have taken a neutral position. Among the indicators on D1, the absolute advantage is on the side of the dollar: 100% of trend indicators and 85% of oscillators point north (10% signal overbought conditions). The remaining 15% of oscillators point south. The nearest support level is in the 139.45 area, followed by levels and zones 138.75-139.05, 137.50, 135.90-136.10, 134.85-135.15, 134.40, 133.60, 132.80-133.00, 132.00, 131.25, 130.50-130.60 and 129.65. The nearest resistance is 140.90-141.00, then bulls will need to overcome obstacles at levels 142.20, 143.50 and 144.90-145.10. And from there it's not far to the October 2022 high of 151.95.
No significant economic information concerning the Japanese economy is anticipated in the coming week. The exception is Thursday, June 8, when the volume of Japan's GDP for Q1 2023 will be announced.
CRYPTOCURRENCIES: A Moderately Positive Forecast for Bitcoin
After bouncing off the $25,850 support on May 25, the bulls launched an attack, instilling hope in the hearts of investors. However, their strength proved insufficient to reach the $29,000 resistance level. A local peak was recorded on May 29 at $28,433, after which BTC/USD retreated to the $26,500 support, leaving investors disappointed.
This dynamic was likely triggered by speculations surrounding the US government debt. Although, upon examining the charts, there was no direct correlation with stock indices (S&P500, Dow Jones, and Nasdaq), nor was there an inverse correlation with the Dollar Index (DXY) observed in bitcoin quotes.
After significant and tumultuous events in the crypto space in 2022 and early 2023, such as the FTX crash in November and numerous other bankruptcies, including Celsius, Voyager Digital, and Three Arrows Capital, bitcoin managed to recover its losses and grow by over 60%. However, a period of calm ensued for eleven weeks. Renowned cryptocurrency analyst Ton Vays believes that the leading cryptocurrency is concluding its consolidation phase, with many investors already "buying the bitcoin dip," indicating that BTC is preparing for further growth. To achieve this, though, it must overcome resistance at the $30,000 level. If the "bulls" succeed, BTC will reach new price highs.
"It is indeed time for bitcoin to grow," says Vays. "However, looking at the weekly chart, the bulls lack strength. [...] There is still time to overcome resistance. We need to surpass $30,000, reverse the Lucid SAR indicator, and then we will rise to $34,000, where another resistance awaits." (For reference: The Lucid SAR indicator is a variation of the Parabolic SAR. It is a trend-following indicator that combines price and time to calculate trends and determine entry and exit points.)
According to analysts at JPMorgan, the price of bitcoin is expected to rise to $45,000. This is indicated by the current price of gold, which is close to $2,000 per ounce. Analysts note that these two assets usually move in tandem. Based on JPMorgan strategists' calculations, the value of physical gold held outside central banks is currently estimated at around $3 trillion. This implies a price of digital gold, or bitcoin, at around $45,000 per coin, assuming the volume of bitcoin in private investors' portfolios matches that of the precious metal.
However, analysts at JPMorgan view $45,000 as the upper limit for bitcoin's price, suggesting limited potential for the asset. This calculation does not take into account the halving process and the increasing costs for miners. The upcoming halving in 2024 will automatically double the cost of bitcoin mining to approximately $40,000, and historically, this figure has served as the lower boundary for the asset's price.
When it comes to miners, the situation is twofold. In pursuit of profits, they contribute to the increasing computational difficulty. Over the past five months of 2023, the difficulty has grown by 45%, equal to the growth seen throughout the entire year of 2022. The price increase of bitcoin in Q1 of this year added optimism among miners, leading them to actively expand their computing power. However, this had the opposite effect, as the increased difficulty impacted mining profitability, bringing it down to levels seen on January 13 when BTC was trading at $19,000.
Former CEO of BitMEX, Arthur Hayes, believes that 2023 will be highly volatile for bitcoin due to the actions of the Federal Reserve System (FRS) in the United States. However, he does not expect the cryptocurrency to reach new all-time highs this year. Hayes states, "I don't think bitcoin will reach $70,000 this year. Most likely, we will surpass that level next year after the halving. Bitcoin will continue to grow in 2025 and 2026. And then, I anticipate an apocalypse. This situation will occur when least expected... We are currently sitting on a powder keg: the US has printed a massive amount of money, there is a lack of trust in them, and people are trying to make a living for themselves," Hayes concludes.
Popular analyst Credible Crypto disagrees with him. According to his opinion, bitcoin may replicate the impulsive waves of growth observed in previous bull cycles and set a new price record as early as 2023. "I keep hearing that it's impossible for bitcoin to reach a new all-time high this year. But I think we need to compare it to the last impulse in 2020. Remember, it took bitcoin about three months to surpass the $10,000 level. But within the next two months, it increased by another 90%. And just four months later, it set a new price record, growing fivefold from $10,000. So don't tell me that anything is impossible for bitcoin. We'll see it at new highs, most likely this year," Credible Crypto burst with optimism.
The publication Business Insider has also taken an interest in expert forecasts regarding what may happen to the leading cryptocurrency by the end of 2023. Charmyn Ho, Head of Analytics at the crypto exchange Bybit, believes that bitcoin will not be able to reach a new high until the macroeconomic environment becomes clearer. It all depends on the potential forecast of a recession in the US, Europe, and other major economies due to an inverted yield curve combined with a range of other unfavorable macroeconomic factors, such as inflation. The halving factor should also be taken into account, although it is expected to occur in April 2024.
According to Jagdeep Sidhu, President of the Syscoin Foundation, despite several crypto storms, the resilience of the ecosystem remains evident. The market has recovered from the ashes of FTX, with its inherent ability to absorb shocks and evolve. If inflation in the US decreases and there is more clarity in terms of regulating digital assets, bitcoin could reach the $38,000 mark by the end of the year, which is approximately 40% higher than the current level.
According to the scenario presented by Tim Shan, Chief Operating Officer of the crypto exchange Dexalot, bitcoin is expected to trade in a range of $25,000 to $32,000 by the end of 2023. However, if inflation remains high, it may return to the lows seen earlier this year.
David Uhryniak, Director of Ecosystem Development at TRON, is confident that bitcoin will finish the year above $35,000. According to him, traders are not rushing to invest significant amounts of money and want to see which direction the leading cryptocurrency and the market as a whole will move. By Q4 2023, most of the uncertainties should disappear.
The cryptocurrency market is not solely reliant on bitcoin. It's been a while since we discussed the second most significant cryptocurrency, ethereum. This altcoin also demonstrates high volatility, and investment returns depend heavily on the entry point. For example, the coin's price increased from $90 to $4,855 from March 2020 to November 2021, a more than 50-fold gain. However, it had dropped to $880 by June 2022, losing 80% of its value. Looking at the returns from the beginning of 2018 to the present, they stand at a modest 30%.
Researchers from VanEck have presented three price scenarios for ethereum over a seven-year horizon. In the base case scenario, the coin will be valued at $11,849 in 2030. In the bullish scenario, ETH could reach $51,006, while in the unfavourable bearish scenario, ethereum would plummet to $343. "Our estimates are based on the assumption that ethereum will become the dominant global network for transactions, hosting a significant portion of the most profitable business sectors. The dominant platform is likely to capture the lion's share of the market," write the VanEck analysts.
The report also notes that ethereum is likely to become a store of wealth, much like bitcoin, but with some differences. "We argue that ETH goes beyond being a transactional currency or a commodity-like oil or gas. We believe the coin is not a full-fledged store of value like bitcoin, due to the potential for code changes in ethereum and the project's utility-focused position. Nevertheless, this cryptocurrency can become a savings asset for government organizations seeking to maximize human capital."
However, according to JPMorgan strategists, the main threat to the number one altcoin comes from government organizations. It is their pressure and selling activity that poses a challenge for ethereum, and in the near future, it may lag behind bitcoin in terms of growth. This became particularly noticeable after SEC Chairman Gary Gensler stated that "everything other than bitcoin" falls under securities laws. "Crypto tokens and crypto securities will be regulated and may even cease to exist. Bitcoin is the only commodity that the SEC does not intend to regulate. Bitcoin is the safest network and the safest asset," commented MicroStrategy CEO Michael Saylor on Gensler's statement.
At the time of writing this review on the evening of Friday, June 2, BTC/USD is trading at $27,155, and ETH/USD is trading at $1,900. The total cryptocurrency market capitalization stands at $1.149 trillion ($1.123 trillion a week ago). Bitcoin's dominance in the market is 47.51%, while ethereum accounts for 20.65%. The Crypto Fear & Greed Index has remained relatively unchanged over the past seven days and is currently in the Neutral zone at 50 points (compared to 49 points a week ago).
Risk-On Sentiment Continued, Dollar Relatively Resilient Despite Receding June Hike Expectations
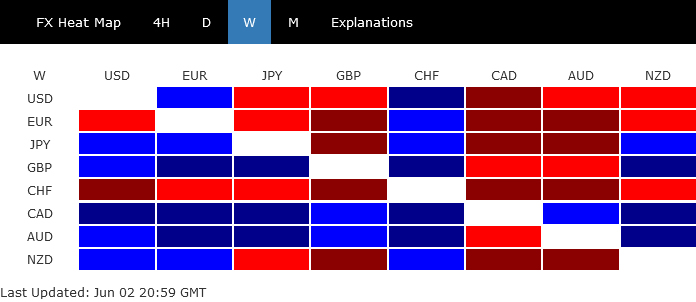
Global stock markets registered impressive gains last week, with the resolution of the US debt ceiling and robust American job data contributing to the bullish momentum. The ebbing expectation of a Federal Reserve rate hike in June also provided additional support. Canadian and Australian dollars emerged as the week's top performers, reflecting the market's increased anticipation of tighter monetary policy by BoC and RBA, even though these moves are not imminent. The British pound also showcased significant strength, gaining ground against other European majors.
Despite closing as the third weakest, the US dollar staged a notable rally towards the end of the week against Euro, Yen, and European majors. This surge was mirrored in stock markets and seems to indicate continuous decoupling from risk sentiment. This trend is expected to persist for some time. On the other end of the spectrum, Euro and Swiss Franc found themselves at the bottom of the performance chart. Lower than expected Eurozone headline and core inflation readings exerted significant pressure on these currencies, leading to their underperformance.
US stocks soar, retest of record high attainable in H2
Last week saw a significant upswing in US stocks, primarily spurred by the resolution of the contentious debt ceiling issue and robust economic data. Market sentiment received a further boost from Friday's impressive non-farm payroll report. Coupled with recent remarks by Fed officials hinting at a potential pause in interest rate hikes in June, market players are increasingly expecting a "skip" at the upcoming Fed meeting.
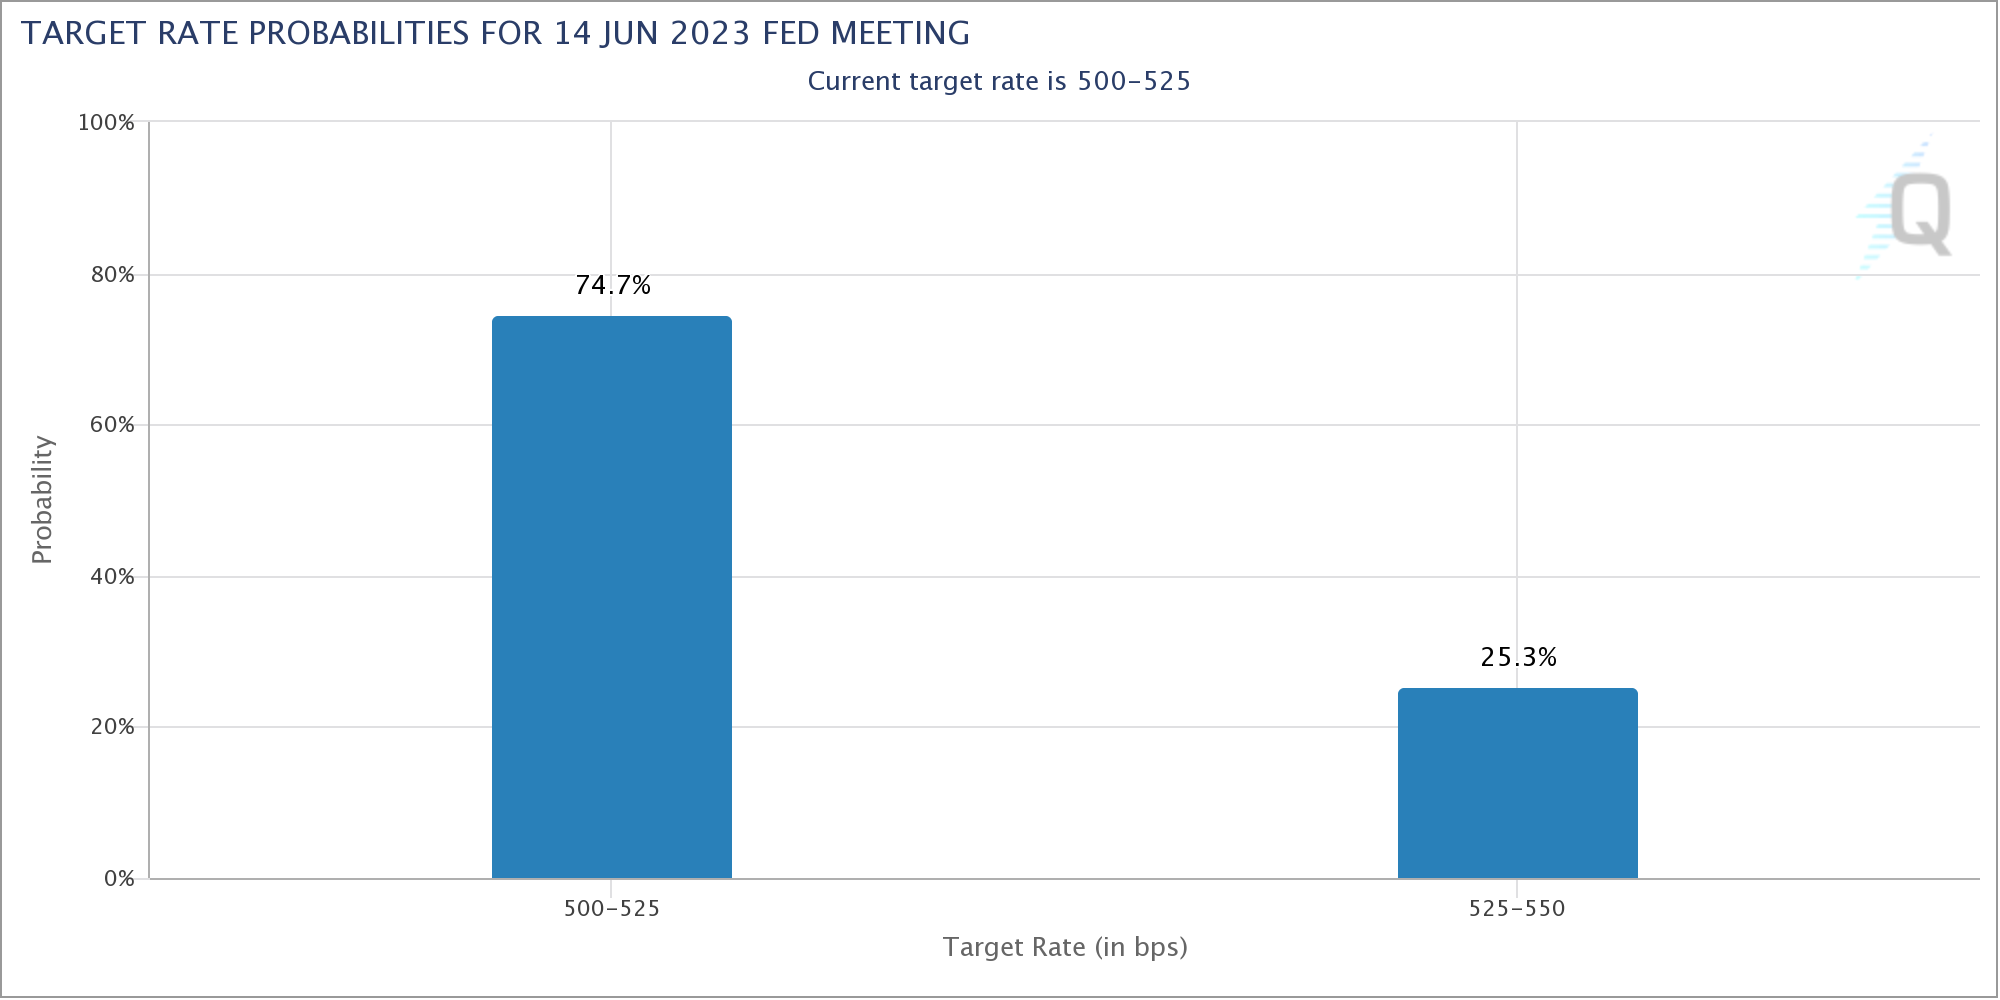
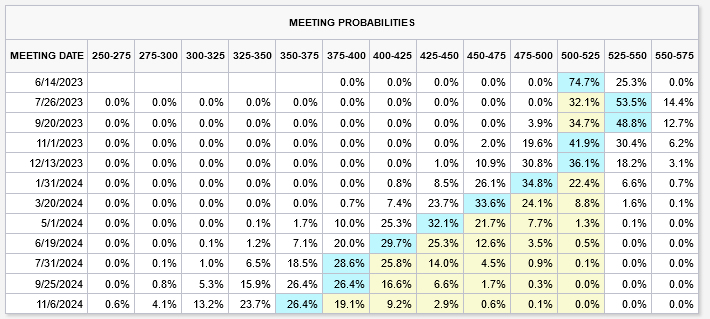
Fed funds futures now indicate a near 75% chance of a hold on June 14. They also predict a 67.9% probability of a further 25bp hike to a range of 5.25-5.50% on July 26, with a 61.5% chance of rates remaining unchanged post September 20 meeting. Expectations are currently at 63.4% for a rate cut to start in November.
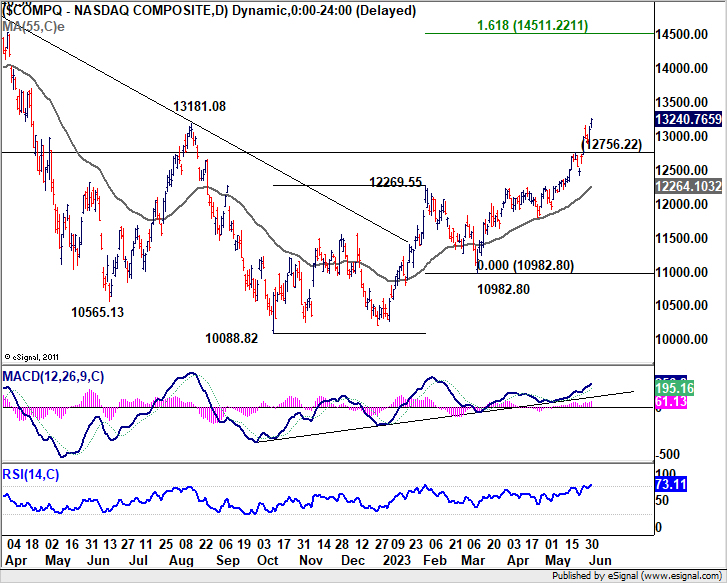
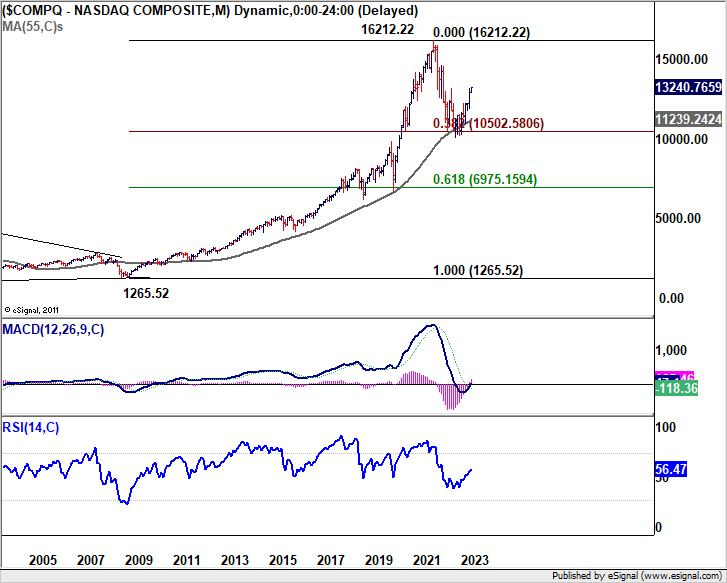
NASDAQ led the way in last week's rally, closing at its highest level in over a year, bolstered by influential mega-cap companies including chipmakers Nvidia and AMD, and AI trailblazers Alphabet and Microsoft.
In technical terms, the close above the resistance level of 13181.08 appears to confirm that NASDAQ's correction from 2021 high of 16212.22 ended at 10088.82. Such an outcome came after the support drawn from the 55 M EMA and 38.2% retracement of 1265.52 to 16212.22 at 10502.58.
Near term outlook will now stay bullish as long as 12756.22 support holds. Next target is 161.8% projection of 10088.82 to 12269.55 from 10982.80 at 14511.22.
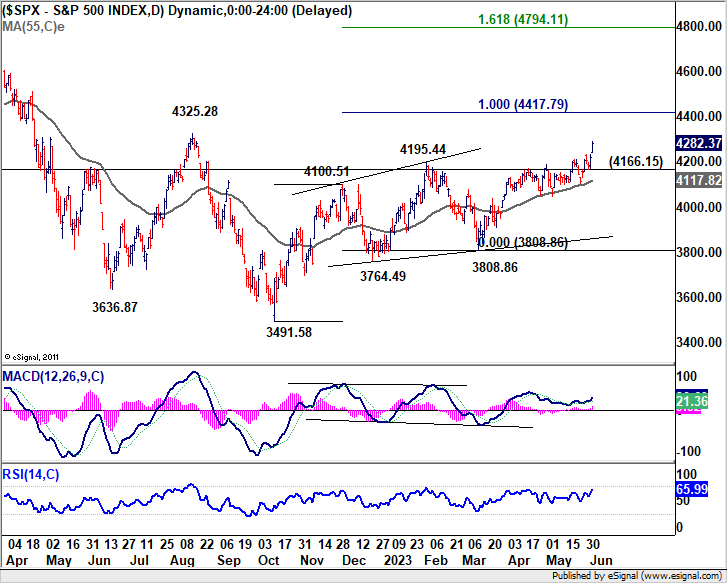
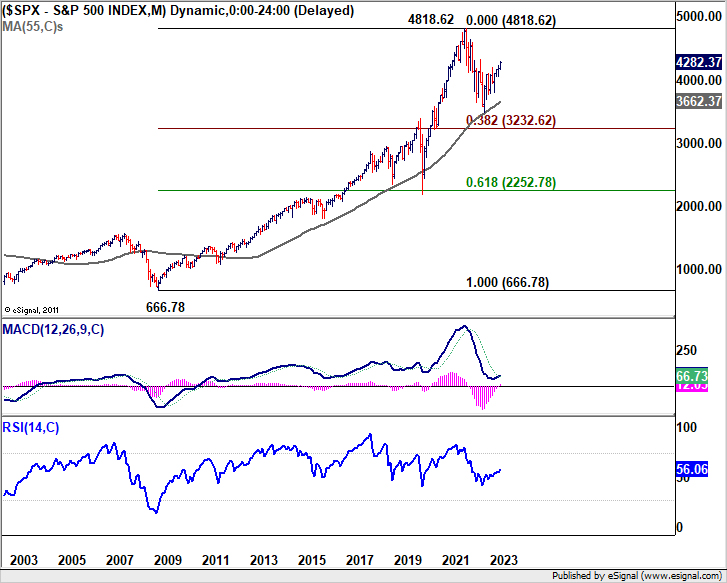
S&P 500 also enjoyed a vigorous rally last week, closing at 4282.37 and now setting its sights on 4325.28 structural resistance. Decisive break above this resistance will signal completion of the correction from the 2021 high of 4818.62, following support from the 55 M EMA.
In any case, near term outlook in SPX will now stay bullish as long as 4166.16 support holds. Next target is 100% projection of 3491.58 to 4100.51 from 3808.86 at 4417.79.
As it stands, it should be noted that while still a bit distant, retests of record highs in both NASDAQ and S&P 500 in the second half of the year now looking attainable.
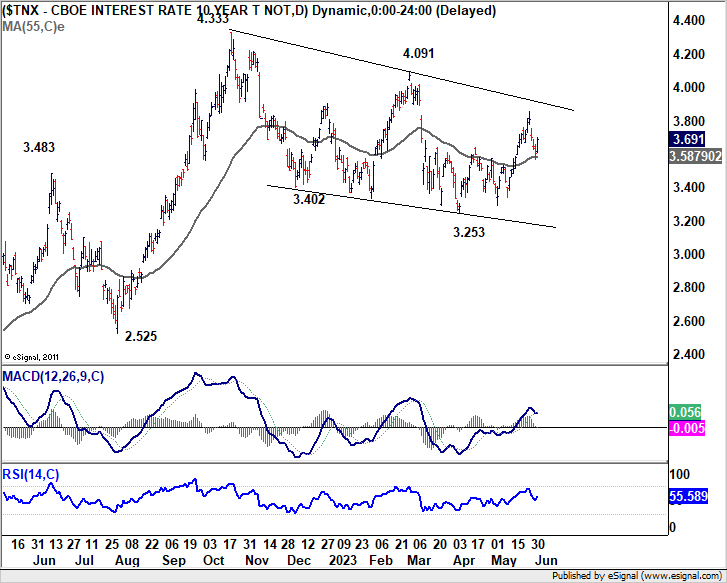
Concurrently, US 10-year yield retreated significantly last week due to diminishing expectations of a June Fed rate hike. Despite this, TNX managed to draw support from 55 Day EMA now at 5.879) to recover and close at 3.691, thus maintaining some degree of near-term bullishness. Outlook remains unchanged, as the correction from 4.333 seems to have completed in three waves down to 3.253, with expectations of another rise towards 4.091 structural resistance.
Dollar in retreat, but further rally still expected for near term
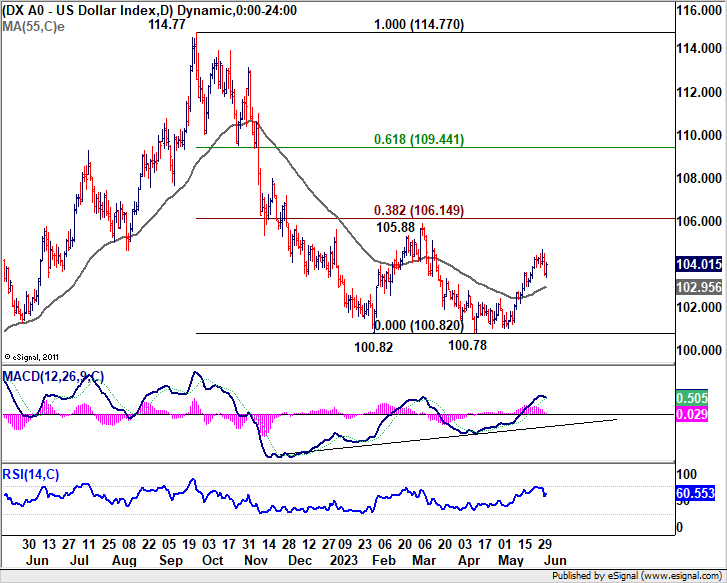
Dollar's correlation with overall risk sentiment appeared to continue to be unclear last week. Dollar index retreated after edging higher to 104.69. But DXY recovered notably on Friday (together with strong rally in stocks) to close at 104.01.
Further rally is expected in Dollar Index as long as 55 D EMA (now at 102.95) holds. Rise from 100.78 is seen as the third leg of the pattern from 100.82, and should target 105.88. Strong resistance could be seen from 38.2% retracement of 114.77 to 100.82 at 106.14 to limit upside, at least on first attempt.
EUR/CAD extended corrective fall, GBP/AUD risks topping
Euro ended as one of the worst performers in spite of persistent hawkish comments from ECB officials. Lower than expected headline and core inflation reading in May was a factor driving the weakness. Additionally, markets have increased expectation on extended tightening by some other major central banks, including BoC and RBA.
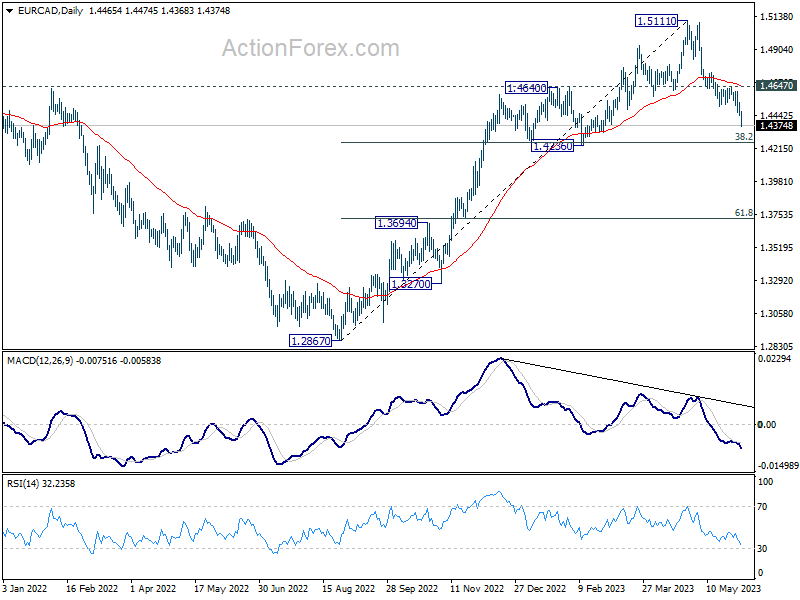
EUR/CAD resumed the corrective fall from 1.5111 last week to close at 1.4374. Near term outlook will stay bearish as long as 1.4647 resistance holds. Next target is 1.4256 cluster support (38.2% retracement of 1.2867 to 1.5111 at 1.4254). Strong support could be seen there to bring rebound, at least on first attempt. However, sustained trading below 1.4254/56 will bring even deeper decline to next cluster support at 1.3694 (61.8% retracement at 1.3724).
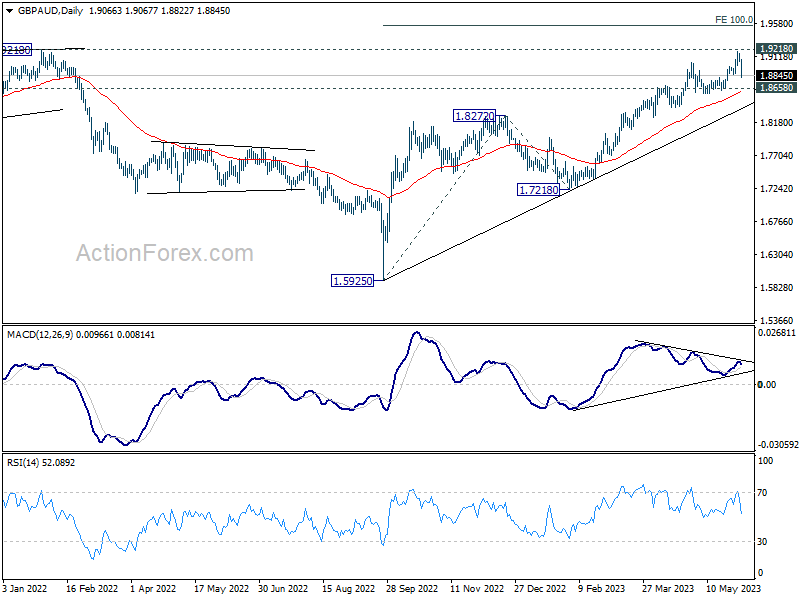
While GBP/AUD extended up trend to as high as 1.9180 risk of deeper pull back and extended correction is increasing. Considering bearish divergence condition in D MACD, firm break of 1.8658 support will indicate medium term topping, just a head of 1.9218 key resistance level. In this case, deeper decline could be seen to 1.8272 resistance support and possibly below, to correct whole up trend from 1.5925. However, firm break of 1.9218 will extend the up trend to 100% projection of 1.5925 to 1.8272 from 1.7218 at 1.9565 before topping.
USD/CHF Weekly Outlook
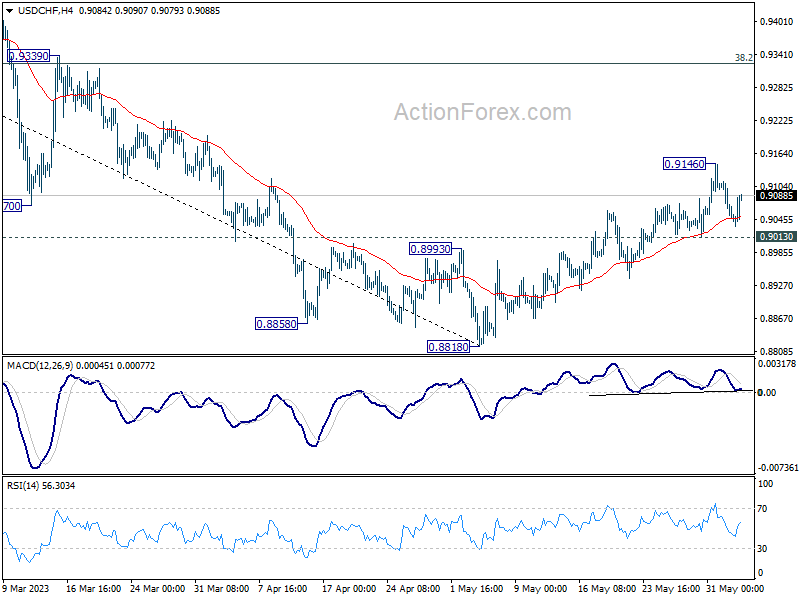
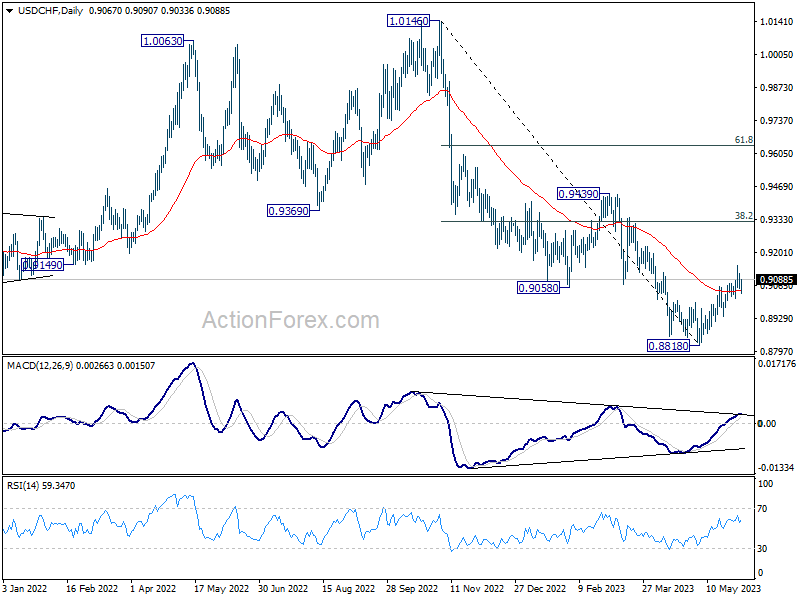
USD/CHF rebounded to 0.9146 last week but retreated since then. Initial bias remains neutral this week for consolidations. But further rally is expected as long as 0.9013 minor support holds. Rise from 0.8818 short term bottom is seen as corrective whole down trend from 1.0146. Above 0.9146 will target 38.2% retracement of 1.0146 to 0.8818 at 0.9325. On the downside, however, break of 0.9013 will turn bias back to the downside for retesting 0.8818 low instead.
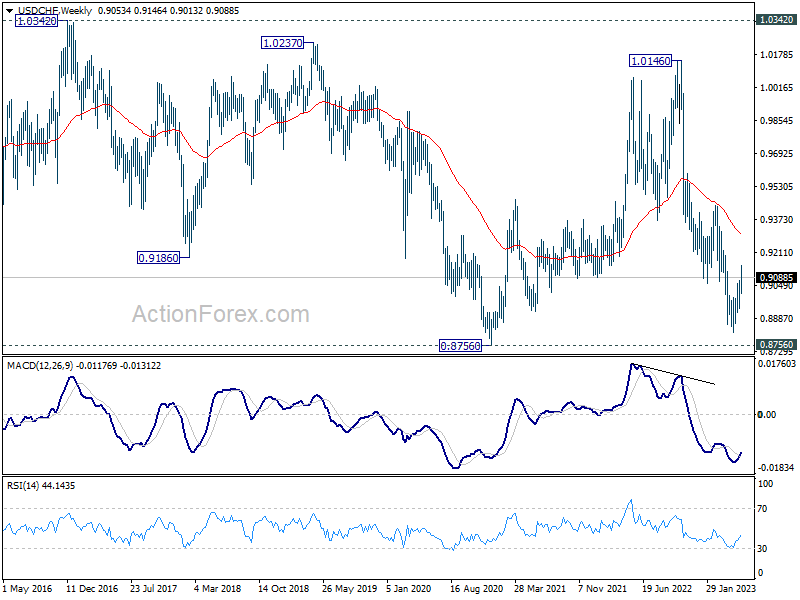
In the bigger picture, fall from 1.1046 (2022 high) is seen as a leg in the long term range pattern from 1.0342 (2016 high), which might have completed at 0.8818 already, just ahead of 0.8756 long term support. Sustained trading above 0.9058 support turned resistance should confirm medium term bottoming. Further break of 0.9439 resistance will confirm bullish trend reversal.
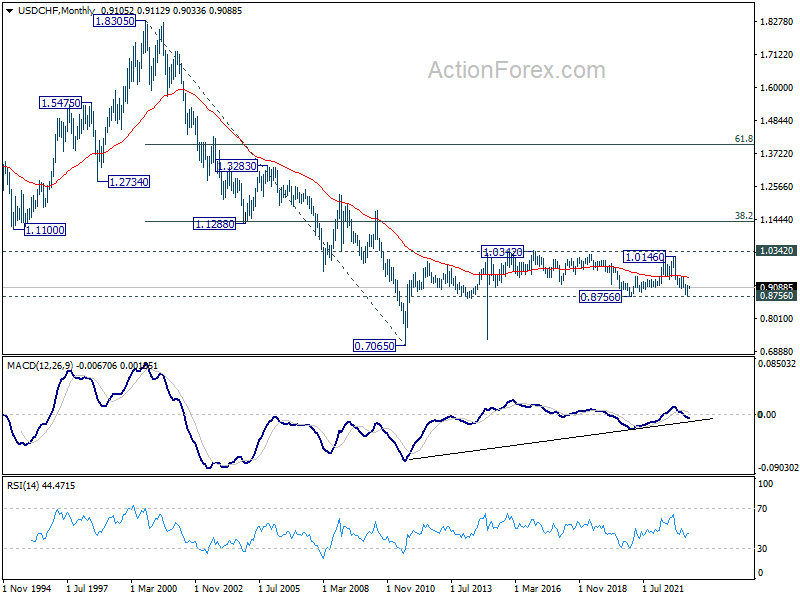
In the long term picture, long term sideway pattern from 1.0342 (2016 high) is expected to continue between 0.8756/1.0342. However, sustained break of 0.8756 will open up deeper fall back towards 0.7065 (2011 low).
EUR/USD Weekly Outlook
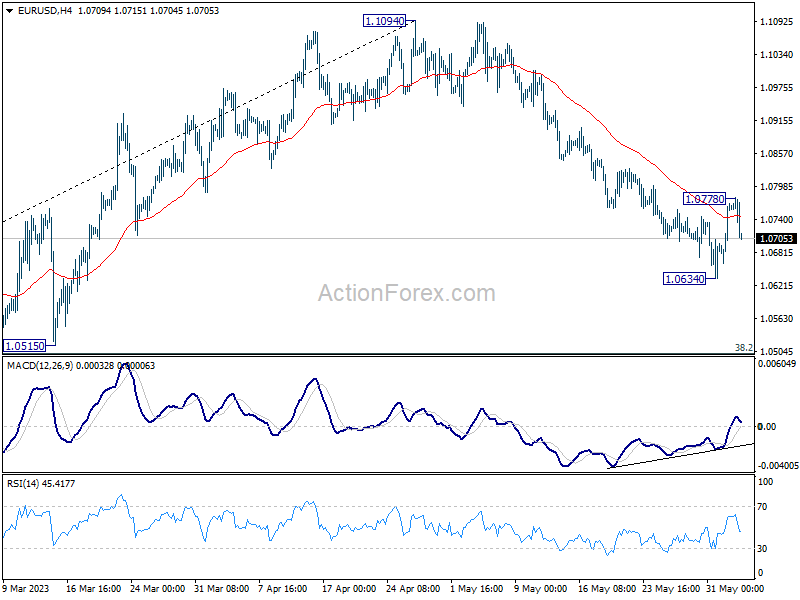
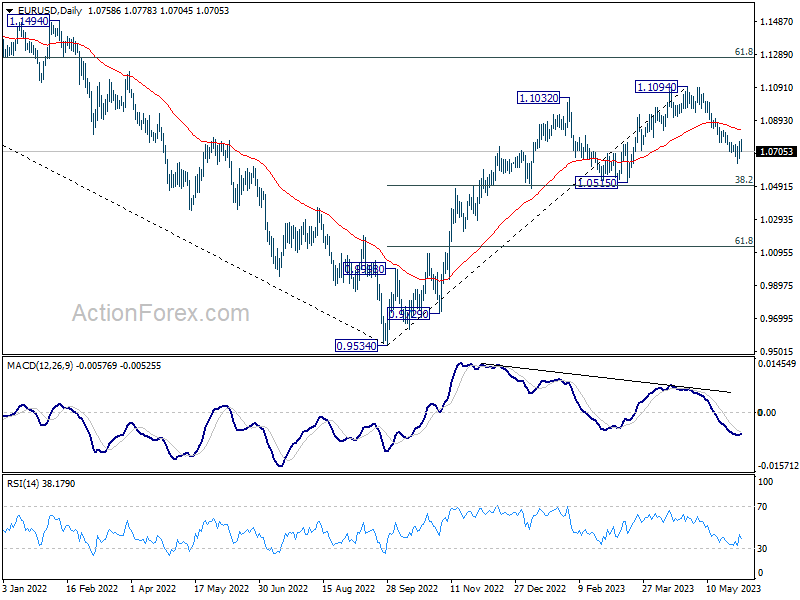
EUR/USD fell further to 1.0634 last week but recovered since then. As a temporary top was then formed at 1.0778, initial bias is turned neutral this week first. On the upside, above 1.0778 will resume the rebound from 1.0634 short term bottom to 55 D EMA (now at 1.0829). On the downside, though, break of 1.0634 will resume the fall from 1.1094 to 1.0515 cluster support, 38.2% retracement of 0.9534 to 1.1094 at 1.0498.
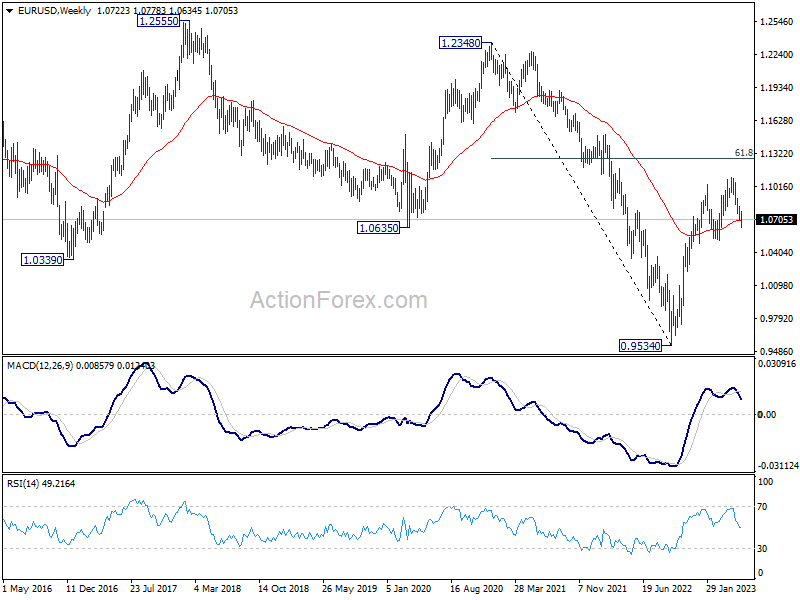
In the bigger picture, as long as 1.0515 support holds, rise from 0.9534 (2022 low) would still extend higher. Sustained break of 61.8% retracement of 1.2348 (2021 high) to 0.9534 at 1.1273 will solidify the case of bullish trend reversal and target 1.2348 resistance next (2021 high).
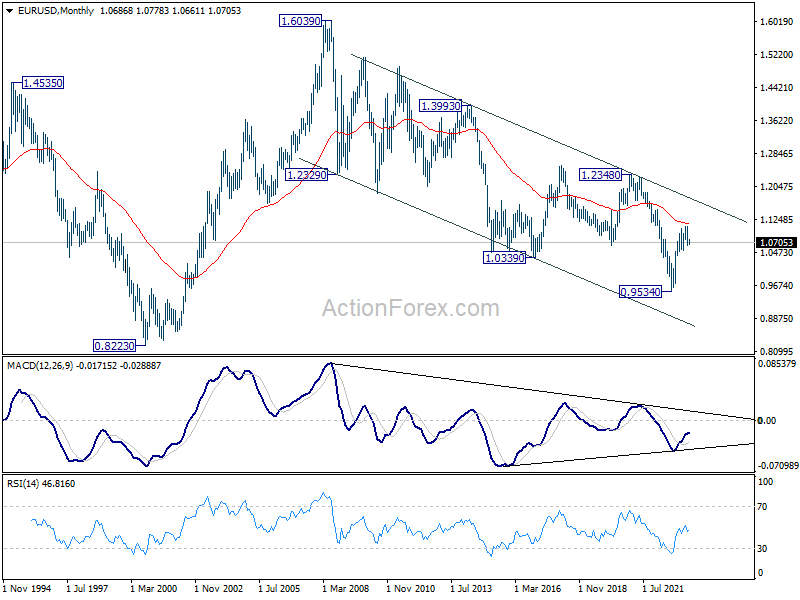
In the long term picture, focus is now on 55 M EMA (now at 1.1134). Rejection by this EMA will revive long term bearishness. However, sustained break above here will be affirm the case of long term bullish reversal and target 1.2348 resistance next.
USD/JPY Weekly Outlook
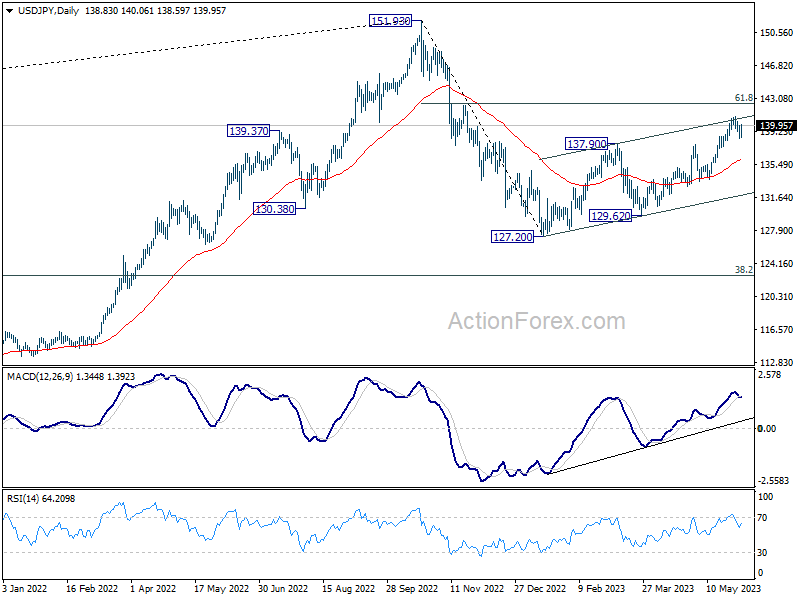
USD/JPY turned into consolidation after edging higher to 140.90 last week. Initial bias remains neutral this week first, and further rally is expected as long as 138.22 minor support holds. On the upside, break of 140.90 will resume larger rise from 127.20 to 142.48 fibonacci level. However, considering bearish divergence condition in 4 hour MACD, break of 138.22 will confirm short term topping, and turn bias back to the downside for 55 D EMA (now at 136.12).
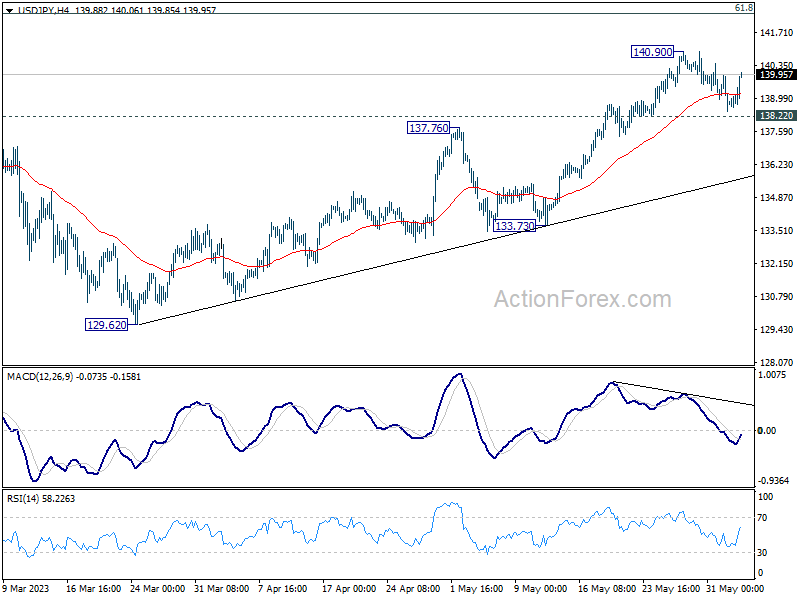
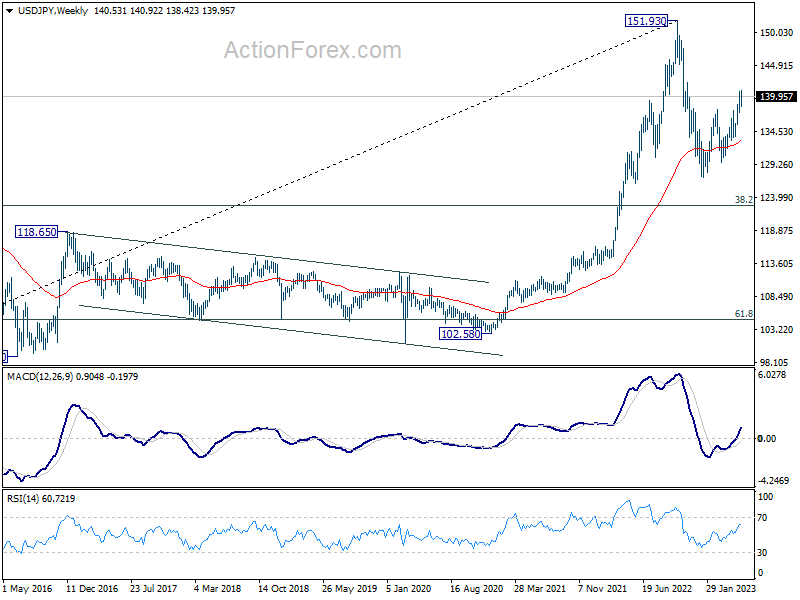
In the bigger picture, rise from 127.20 is seen as the second leg of the corrective pattern from 151.93 high. Stronger rally would be seen to 61.8% retracement of 151.93 to 127.20 at 136.34. Sustained break there will pave the way back to retest 151.93. On the downside, however, break of 133.73 support will argue that the pattern could have started the third leg through 127.20 low.
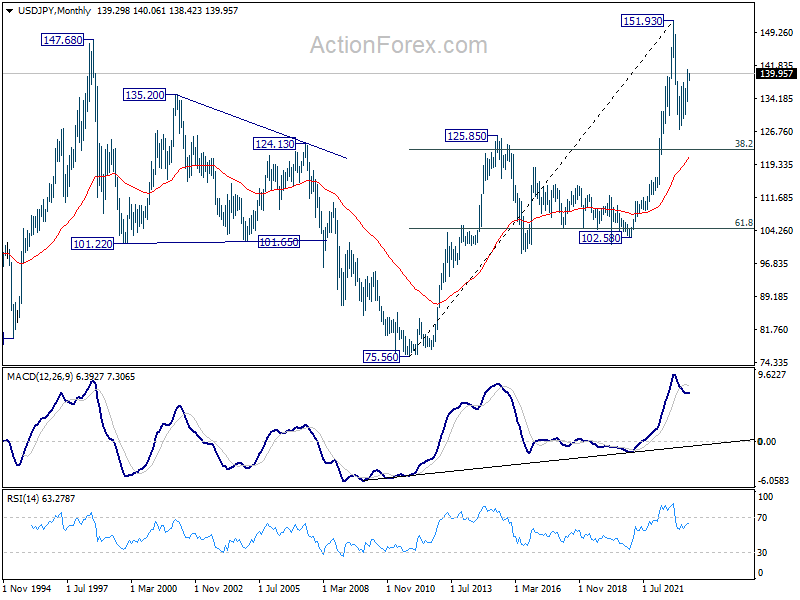
In the long term picture, price action from 151.93 is seen as developing into a corrective pattern to up trend from 75.56 (2011 low). While deeper decline cannot be ruled out, downside should be contained by 38.2% retracement of 75.56 to 151.93 at 122.75.
GBP/USD Weekly Outlook
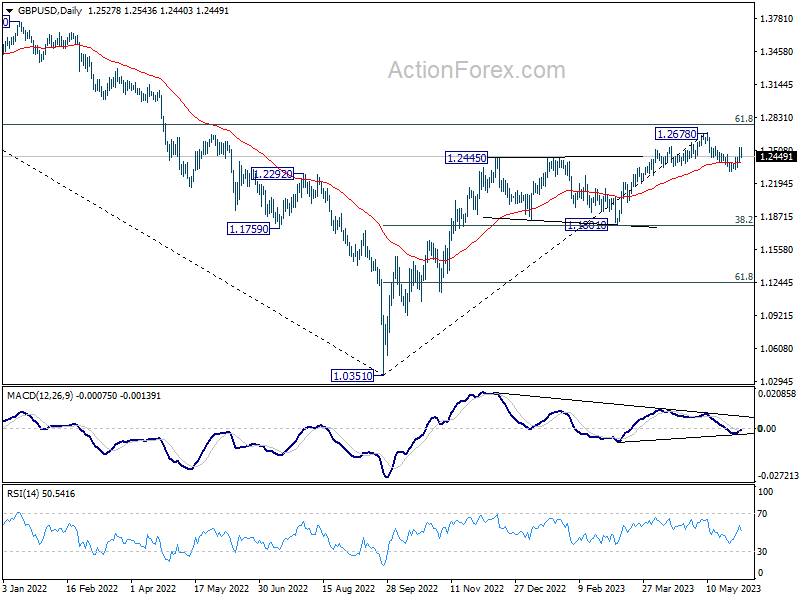
GBP/USD rebounded strongly to 1.2543 last week but retreated since then. Initial bias is neutral this week first. On the upside, above 1.2543 will resume the rebound to retest 1.2678 high. Meanwhile, break of 1.2306 will resume the correction towards 1.1801 cluster support (38.2% retracement of 1.0351 to 1.2678 at 1.1789).
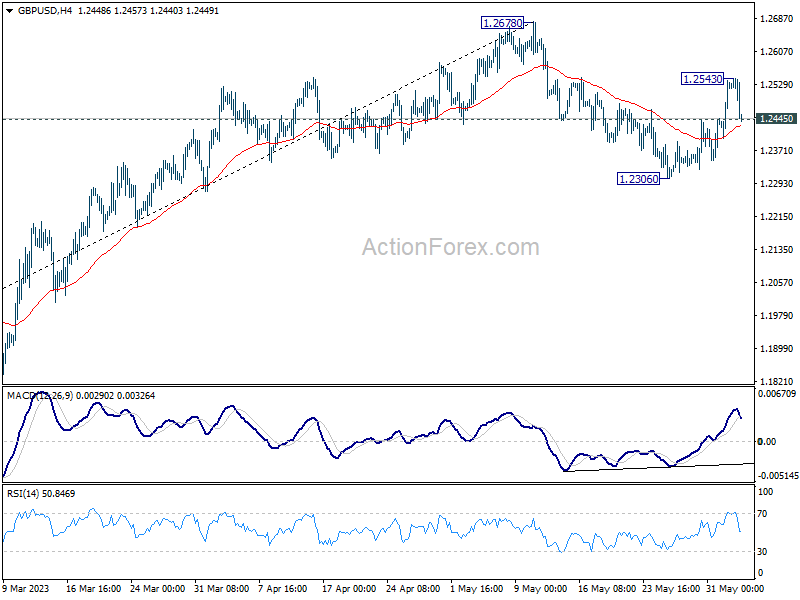
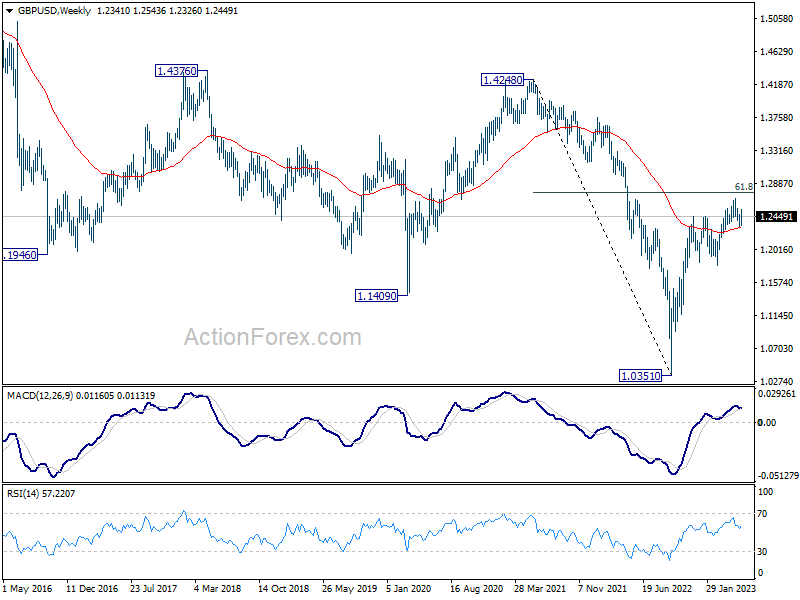
In the bigger picture, as long as 1.1801 support holds, rise from 1.0351 medium term bottom (2022 low) is expected to extend further. Sustained break of 61.8% retracement of 1.4248 (2021 high) to 1.0351 at 1.2759 will add to the case of long term bullish trend reversal. However, firm break of 1.1801 will indicate rejection by 1.2759, and bring deeper decline, even as a correction.
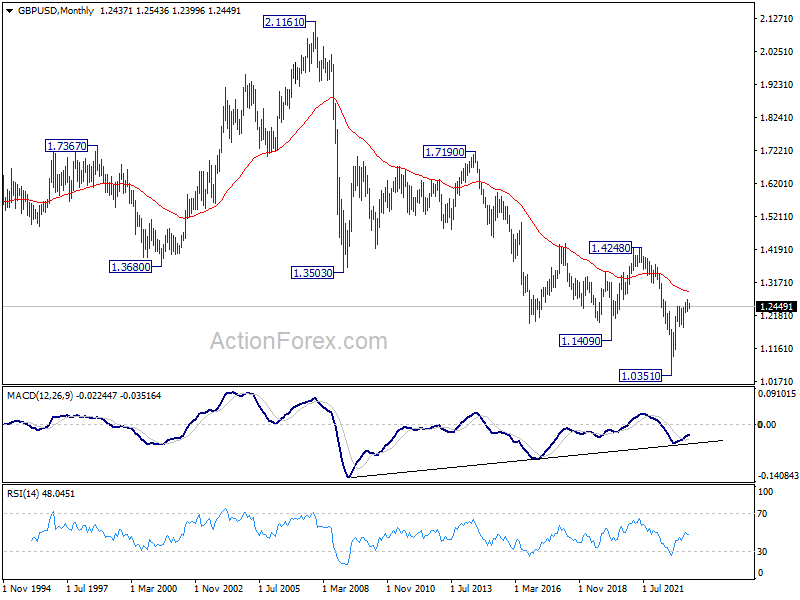
In the long term picture, while the rise from 1.0351 (2022 low) has been strong, there is no clear indicate of long term trend reversal yet. As long as 1.4248 resistance holds (2021 high), long term outlook will remain neutral at best.
USD/CHF Weekly Outlook
USD/CHF rebounded to 0.9146 last week but retreated since then. Initial bias remains neutral this week for consolidations. But further rally is expected as long as 0.9013 minor support holds. Rise from 0.8818 short term bottom is seen as corrective whole down trend from 1.0146. Above 0.9146 will target 38.2% retracement of 1.0146 to 0.8818 at 0.9325. On the downside, however, break of 0.9013 will turn bias back to the downside for retesting 0.8818 low instead.
In the bigger picture, fall from 1.1046 (2022 high) is seen as a leg in the long term range pattern from 1.0342 (2016 high), which might have completed at 0.8818 already, just ahead of 0.8756 long term support. Sustained trading above 0.9058 support turned resistance should confirm medium term bottoming. Further break of 0.9439 resistance will confirm bullish trend reversal.
In the long term picture, long term sideway pattern from 1.0342 (2016 high) is expected to continue between 0.8756/1.0342. However, sustained break of 0.8756 will open up deeper fall back towards 0.7065 (2011 low).
AUD/USD Weekly Report
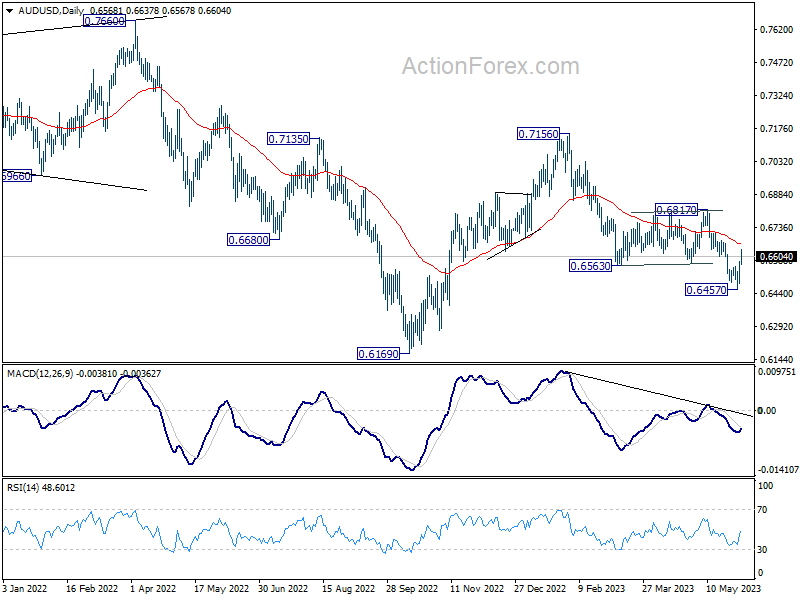
AUD/USD rebounded strongly after initial dip to 0.6457 last week. Initial bias is now mildly on the upside this week for 55 D EMA (now at 0.6659). Sustained break there will target 0.6817 resistance next. Nevertheless, rejection by 55 D EMA will keep near term outlook bearish. Firm break of 0.6457 will resume the fall from 0.7156.
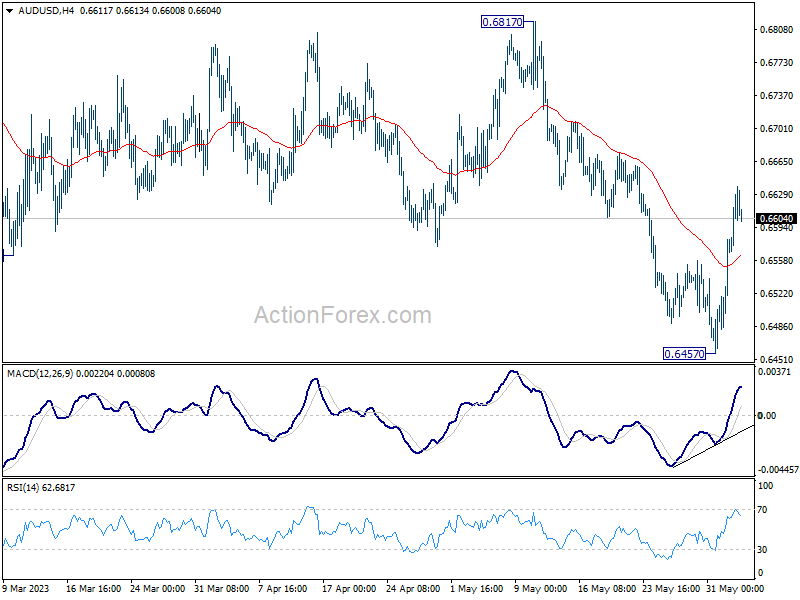
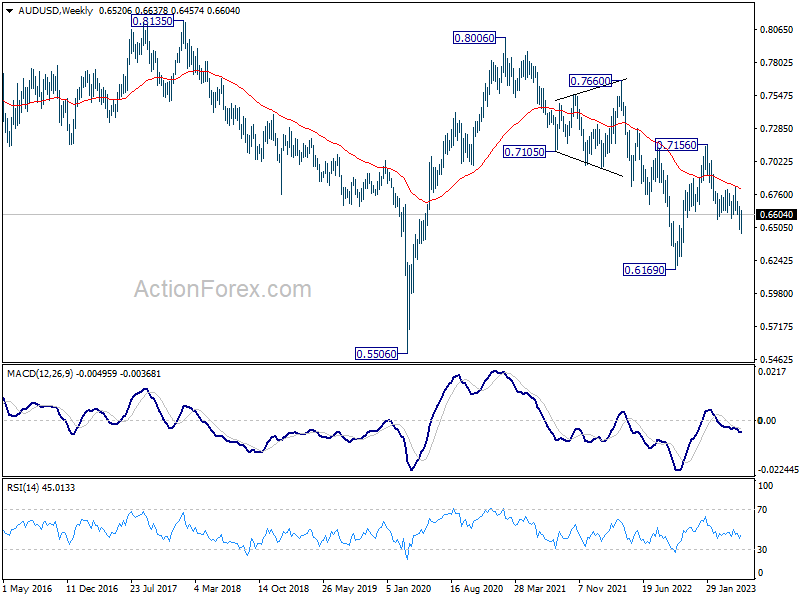
In the bigger picture, rejection by 55 W EMA (now at 0.6811) keeps medium term outlook bearish. Current development suggests that down trend from 0.8006 (2021 high) is possibly still in progress. Retest of 0.6169 (2022 low) should be seen next. Firm break there will confirm down trend resumption. For now, this will remain the favored case as long as 0.6817 resistance holds.
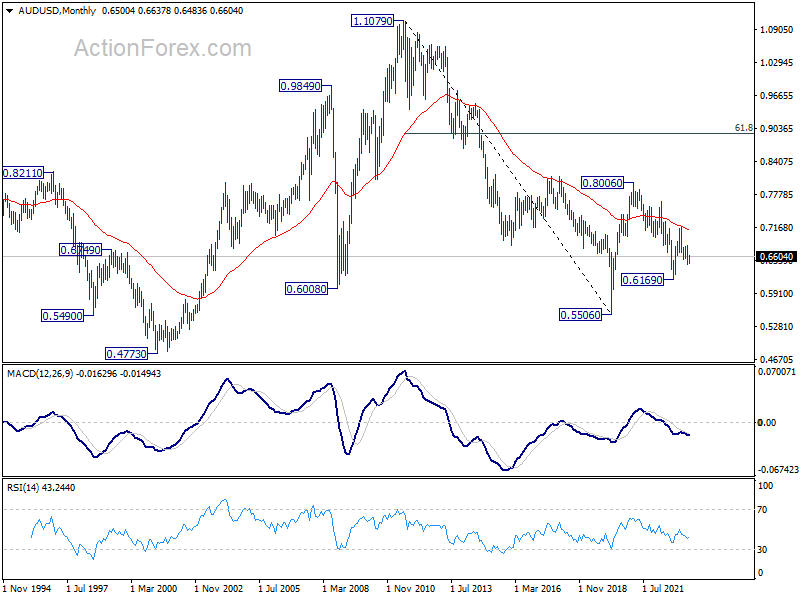
In the long term picture, initial rejection by 55 M EMA (now at 0.7119) retains long term bearishness. That is, down trend from 1.1079 (2011 high) could still resume through 0.5506 (2020 low) on resumption.
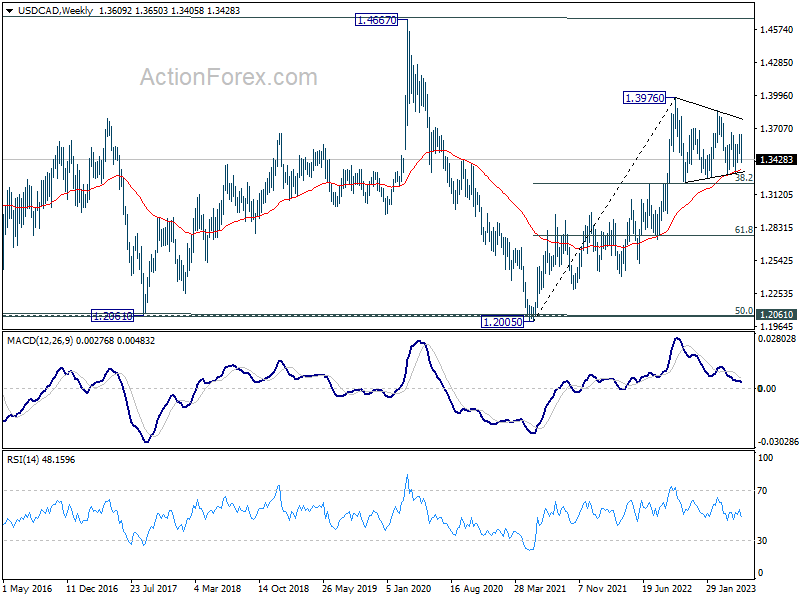
USD/CAD Weekly Outlook
USD/CAD fell sharply last week but overall outlook is unchanged. Initial bias remains neutral this week first. Price actions from 1.3976 are seen as a triangle consolidation pattern. Above 1.3666 will target 1.3860 resistance first. Firm break of 1.3860 will argue that larger up trend is ready to resume through 1.3976 high. Nevertheless, sustained break of 1.3229 will dampen this view and turn near term outlook bearish.
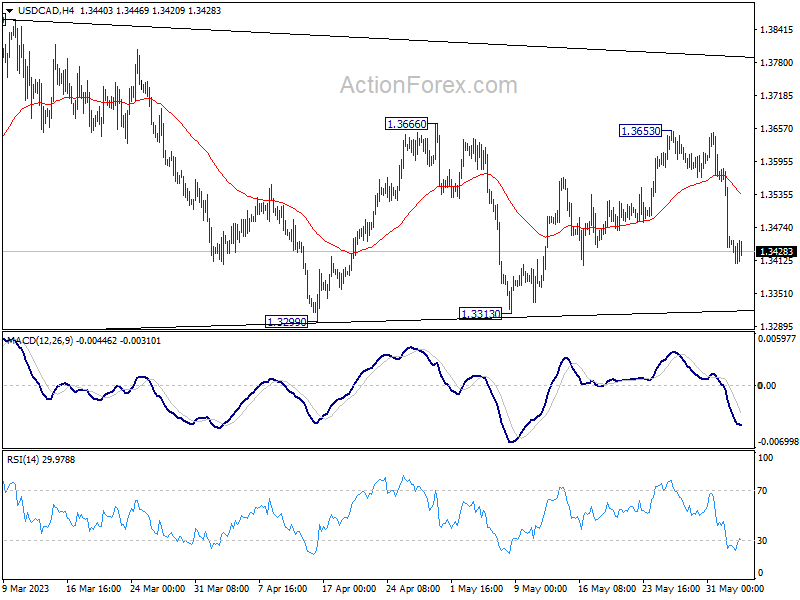
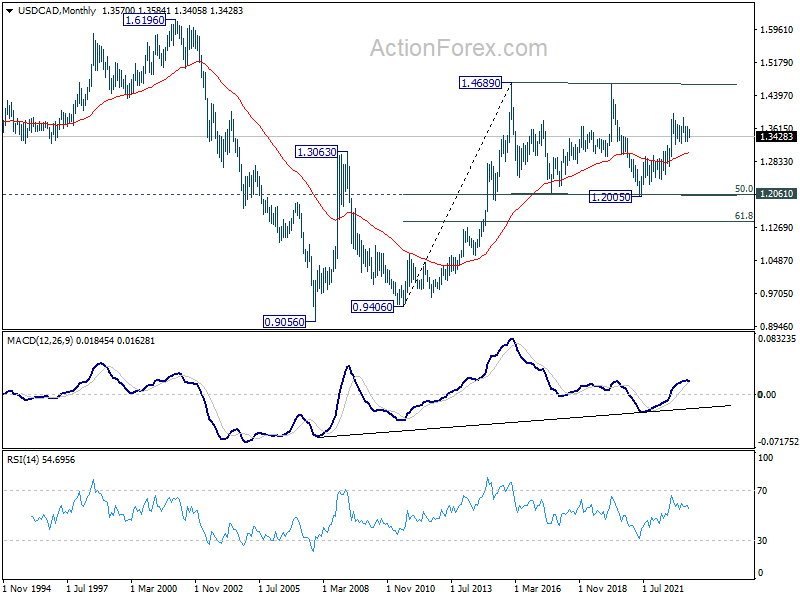
In the bigger picture, rise from 1.2005 (2021 low) is expected to resume through 1.3976 after consolidation from there completes. On decisive break of 1.3976, next target will be 1.4667/89 long term resistance zone. This will remain the favored case as long as 38.2% retracement of 1.2005 to 1.3976 at 1.3233 holds.
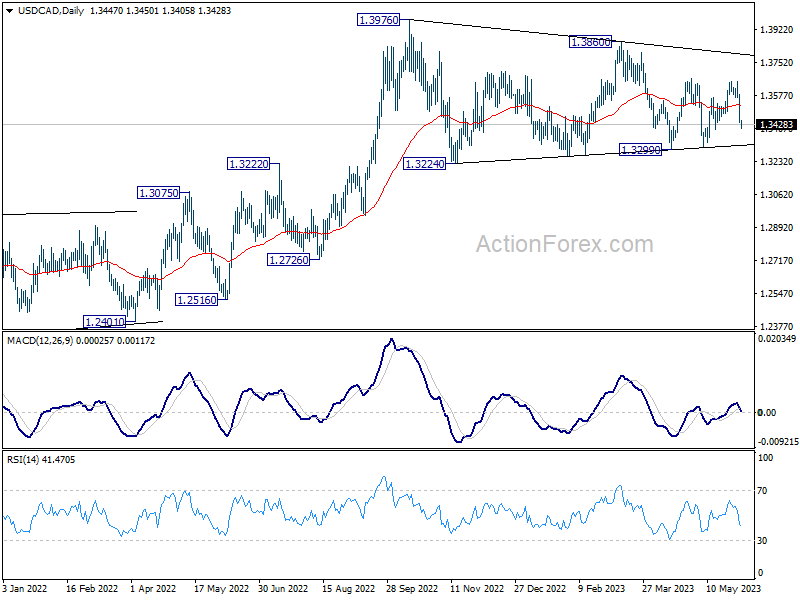
In the longer term picture, price actions from 1.4689 (2016 high) are seen as a consolidation pattern only, which might have completed at 1.2005. That is, up trend from 0.9506 (2007 low) is expected to resume at a later stage. This will remain the favored case as 55 M EMA (now at 1.3046) holds.