

Sample Category Title
RBA Shoots Up Aussie, Dollar Consolidating Against Europeans and Yen
Australian Dollar surges broadly after surprised RBA rate hike. Tightening bias is also maintained, so more hike(s) could still be in the pipeline. The move in Aussie is taking other commodity currencies higher. Now, a focus will be on whether BoC would follow and surprises the markets too. At the other end of the spectrum, Dollar is sold off broadly today. Yen is following as the second worst and then Euro. Swiss Franc and Sterling are mixed.
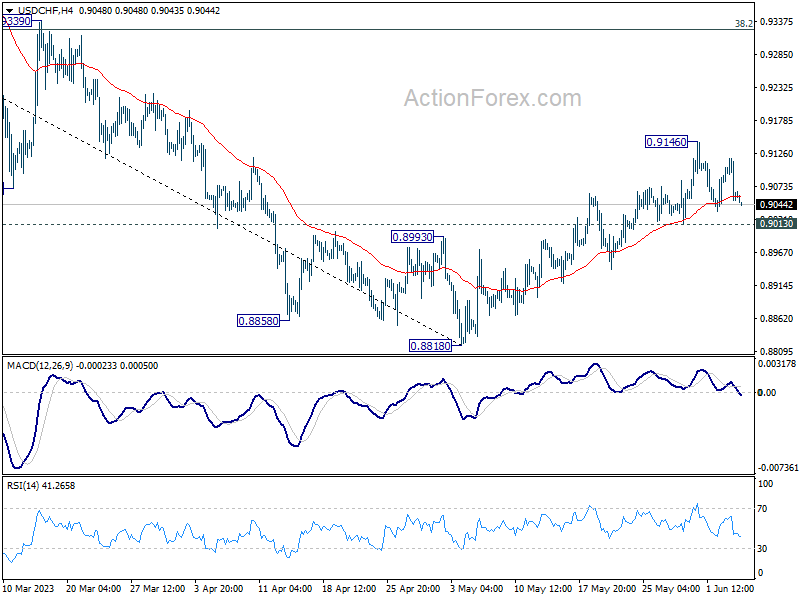
Technically, some attention will also be on Dollar in the early part of the week. Near term price actions in EUR/USD, USD/CHF, USD/JPY and even GBP/USD are displaying corrective structures. That is, the greenback's rally against European majors and Yen shouldn't be over yet. Break of any of 1.0634 support in EUR/USD, 1.2306 support in GBP/USD, 0.9146 resistance in USD/CHF and 140.90 resistance in USD/JPY could be the early signal of resumption in Dollar's rise.
In Asia, at the time of writing, Nikkei is up 0.69%. Hong Kong HSI is up 0.51%. China Shanghai SSE is up 0.05%. Singapore Strait Times is up 0.04%. Japan 10-year JGB yield is down -0.0040 at 0.430. Overnight, DOW dropped -0.59%. S&P 500 dropped -0.20%. NASDAQ dropped -0.09%. 10-year yield rose 0.0002 to 3.693.
RBA surprises with 25bps hike, to give itself greater confidence
RBA surprises the market by raising the cash rate target rate, by 25bps to 4.10. Tightening bias is maintained as "Some further tightening of monetary policy may be required to ensure that inflation returns to target in a reasonable timeframe".
The central bank noted that while inflation is "still too high" even though it has "passed its peak." Also, it will be "some time yet" before inflation falls back to target range. It explained, "this further increase in interest rates is to provide greater confidence that inflation will return to target within a reasonable timeframe".
Growth "has slowed" and labor market conditions "remain very tight" even though eased. Wages growth "has picked up" but is "still consistent with the inflation target". The path to soft landing "remains a narrow one" and a "significant source" of uncertainty continues to be household consumption.
AUD/NZD breaks structural resistance after RBA hike
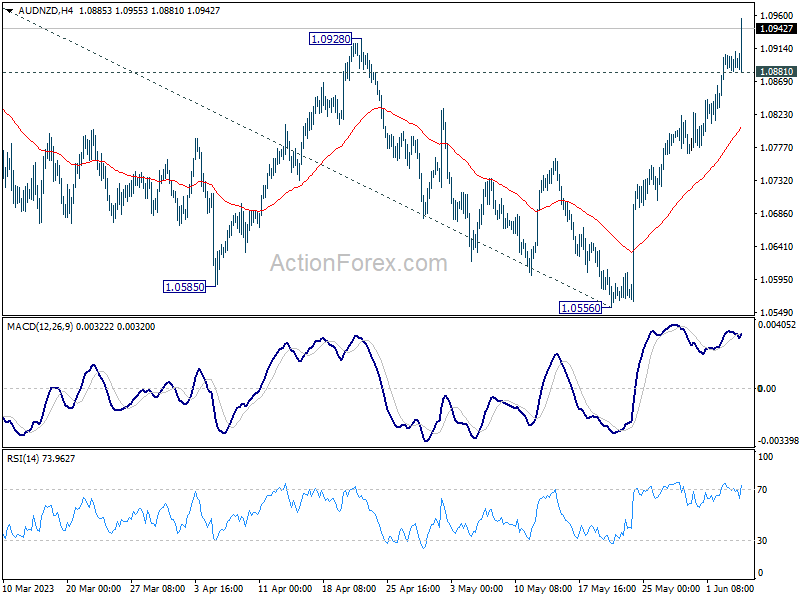
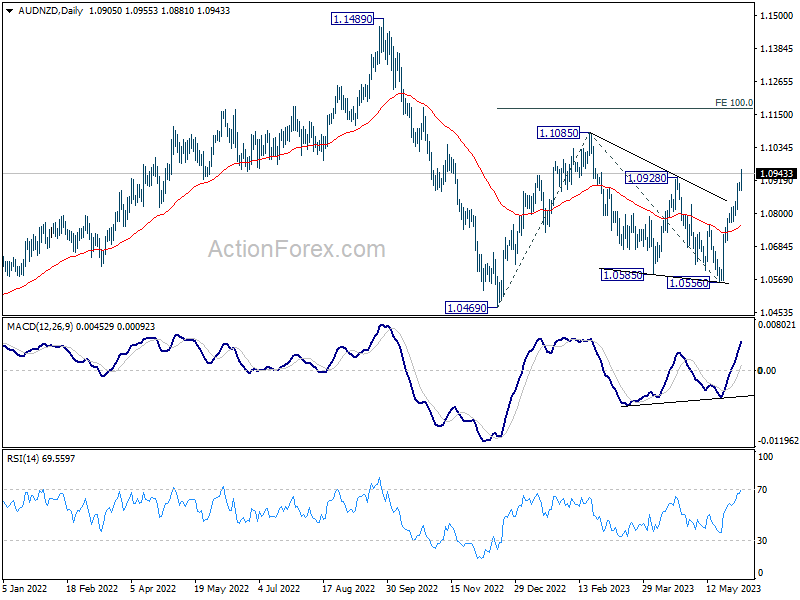
AUD/NZD surges after RBA's surprised rate hike and breaks through 1.0928 structural resistance. The development should confirm that corrective fall from 1.1085 has completed with three waves down to 1.0556.
Intraday bias is now on the upside as long as 1.0881 minor support holds. Sustained trading above 1.0928 could prompt upside acceleration 1.1085 resistance. Break there will resume whole rally from 1.0469 (2022 low) to 100% projection of 1.0469 to 1.1085 from 1.0556 at 1.1172.
Looking ahead
Germany factor orders, UK PMI construction, Eurozone retail sales will be released in European session. Later in the day, Canada will publish building permits and Ivey PMI.
EUR/AUD Daily Outlook
Daily Pivots: (S1) 1.6143; (P) 1.6191; (R1) 1.6237; More...
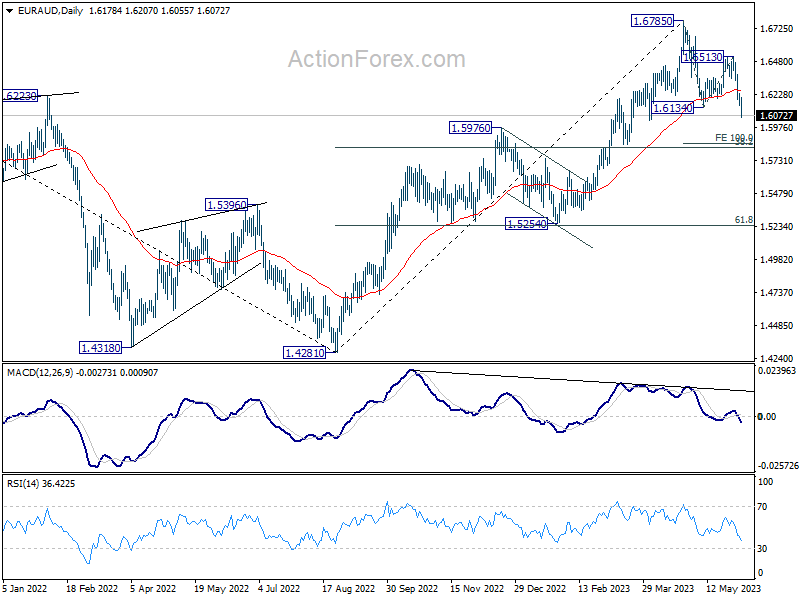
EUR/AUD's decline continues today and break of 1.6134 support confirms resumption of whole fall from 1.6785. Intraday bias stays on the downside for 100% projection of 1.6785 to 1.6134 from 1.6513 at 1.5862. On the upside, above 1.6207 minor resistance will turn intraday bias neutral first. But risk will stay on the downside as long as 1.6513 resistance holds, in case of recovery.
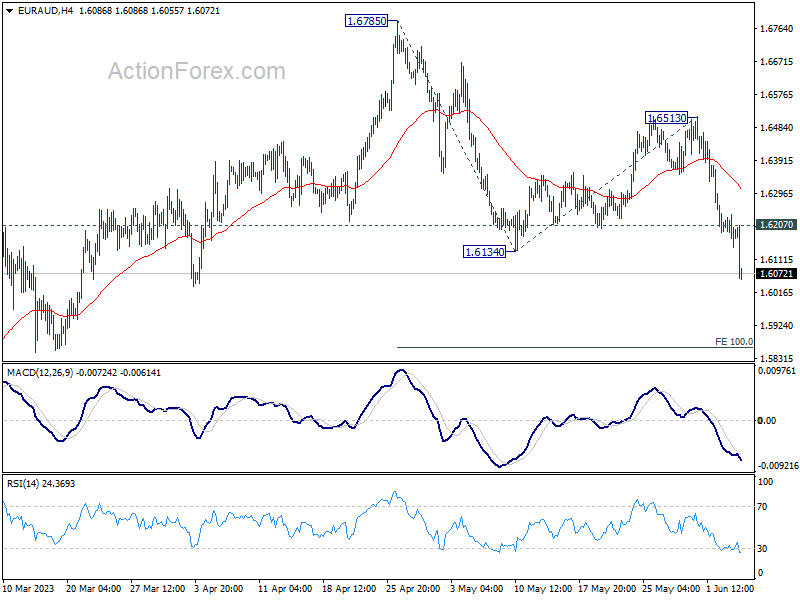
In the bigger picture, a medium term top is possibly in place at 1.6785 already, on bearish divergence condition in D MACD. Fall from there is seen as correcting whole up trend from 1.4281 (2022 low). Deeper decline is expected as long as 1.6513 resistance holds, to 38.2% retracement of 1.4281 to 1.6785 at 1.5828. Strong support could be seen there to complete the first leg of the corrective pattern.
Economic Indicators Update
| GMT | Ccy | Events | Actual | Forecast | Previous | Revised |
|---|---|---|---|---|---|---|
| 23:01 | GBP | BRC Like-For-Like Retail Sales Y/Y May | 3.70% | 5.20% | ||
| 23:30 | JPY | Labor Cash Earnings Y/Y Apr | 1.00% | 1.90% | 0.80% | 1.30% |
| 23:30 | JPY | Overall Household Spending Y/Y Apr | -4.40% | -2.30% | -1.90% | |
| 01:30 | AUD | Current Account (AUD) Q1 | 12.3B | 15.0B | 14.1B | 11.7B |
| 04:30 | AUD | RBA Interest Rate Decision | 4.10% | 3.85% | 3.85% | |
| 06:00 | EUR | Germany Factory Orders M/M Apr | 3.80% | -10.70% | ||
| 08:30 | GBP | Construction PMI May | 50.9 | 51.1 | ||
| 09:00 | EUR | Eurozone Retail Sales M/M Apr | 0.20% | -1.20% | ||
| 12:30 | CAD | Building Permits M/M Apr | 0.20% | 11.30% | ||
| 14:00 | CAD | Ivey PMI May | 57.2 | 56.8 |
AUD/NZD breaks structural resistance after RBA hike
AUD/NZD surges after RBA's surprised rate hike and breaks through 1.0928 structural resistance. The development should confirm that corrective fall from 1.1085 has completed with three waves down to 1.0556.
Intraday bias is now on the upside as long as 1.0881 minor support holds. Sustained trading above 1.0928 could prompt upside acceleration 1.1085 resistance. Break there will resume whole rally from 1.0469 (2022 low) to 100% projection of 1.0469 to 1.1085 from 1.0556 at 1.1172.
RBA surprises with 25bps hike, to give itself greater confidence
RBA surprises the market by raising the cash rate target rate, by 25bps to 4.10. Tightening bias is maintained as "Some further tightening of monetary policy may be required to ensure that inflation returns to target in a reasonable timeframe".
The central bank noted that while inflation is "still too high" even though it has "passed its peak." Also, it will be "some time yet" before inflation falls back to target range. It explained, "this further increase in interest rates is to provide greater confidence that inflation will return to target within a reasonable timeframe".
Growth "has slowed" and labor market conditions "remain very tight" even though eased. Wages growth "has picked up" but is "still consistent with the inflation target". The path to soft landing "remains a narrow one" and a "significant source" of uncertainty continues to be household consumption.
(RBA) Statement by Philip Lowe, Governor: Monetary Policy Decision
At its meeting today, the Board decided to increase the cash rate target by 25 basis points to 4.10 per cent. It also increased the interest rate paid on Exchange Settlement balances by 25 basis points to 4.00 per cent.
Inflation in Australia has passed its peak, but at 7 per cent is still too high and it will be some time yet before it is back in the target range. This further increase in interest rates is to provide greater confidence that inflation will return to target within a reasonable timeframe.
High inflation makes life difficult for people and damages the functioning of the economy. It erodes the value of savings, hurts family budgets, makes it harder for businesses to plan and invest, and worsens income inequality. And if high inflation were to become entrenched in people's expectations, it would be very costly to reduce later, involving even higher interest rates and a larger rise in unemployment. Recent data indicate that the upside risks to the inflation outlook have increased and the Board has responded to this. While goods price inflation is slowing, services price inflation is still very high and is proving to be very persistent overseas. Unit labour costs are also rising briskly, with productivity growth remaining subdued.
Growth in the Australian economy has slowed and conditions in the labour market have eased, although they remain very tight. The unemployment rate increased slightly to 3.7 per cent in April and employment growth has moderated. Firms report that labour shortages have eased, although job vacancies and advertisements are still at very high levels.
Wages growth has picked up in response to the tight labour market and high inflation. Growth in public sector wages is expected to pick up further and the annual increase in award wages was higher than it was last year. At the aggregate level, wages growth is still consistent with the inflation target, provided that productivity growth picks up.
The Board remains alert to the risk that expectations of ongoing high inflation contribute to larger increases in both prices and wages, especially given the limited spare capacity in the economy and the still very low rate of unemployment. Accordingly, it will continue to pay close attention to both the evolution of labour costs and the price-setting behaviour of firms.
The Board is still seeking to keep the economy on an even keel as inflation returns to the 2–3 per cent target range, but the path to achieving a soft landing remains a narrow one. A significant source of uncertainty continues to be the outlook for household consumption. The combination of higher interest rates and cost-of-living pressures is leading to a substantial slowing in household spending. Housing prices are rising again and some households have substantial savings buffers, although others are experiencing a painful squeeze on their finances. There are also uncertainties regarding the global economy, which is expected to grow at a below-average rate over the next couple of years.
Some further tightening of monetary policy may be required to ensure that inflation returns to target in a reasonable timeframe, but that will depend upon how the economy and inflation evolve. The Board will continue to pay close attention to developments in the global economy, trends in household spending, and the outlook for inflation and the labour market. The Board remains resolute in its determination to return inflation to target and will do what is necessary to achieve that.
Technical Outlook and Review
DXY:
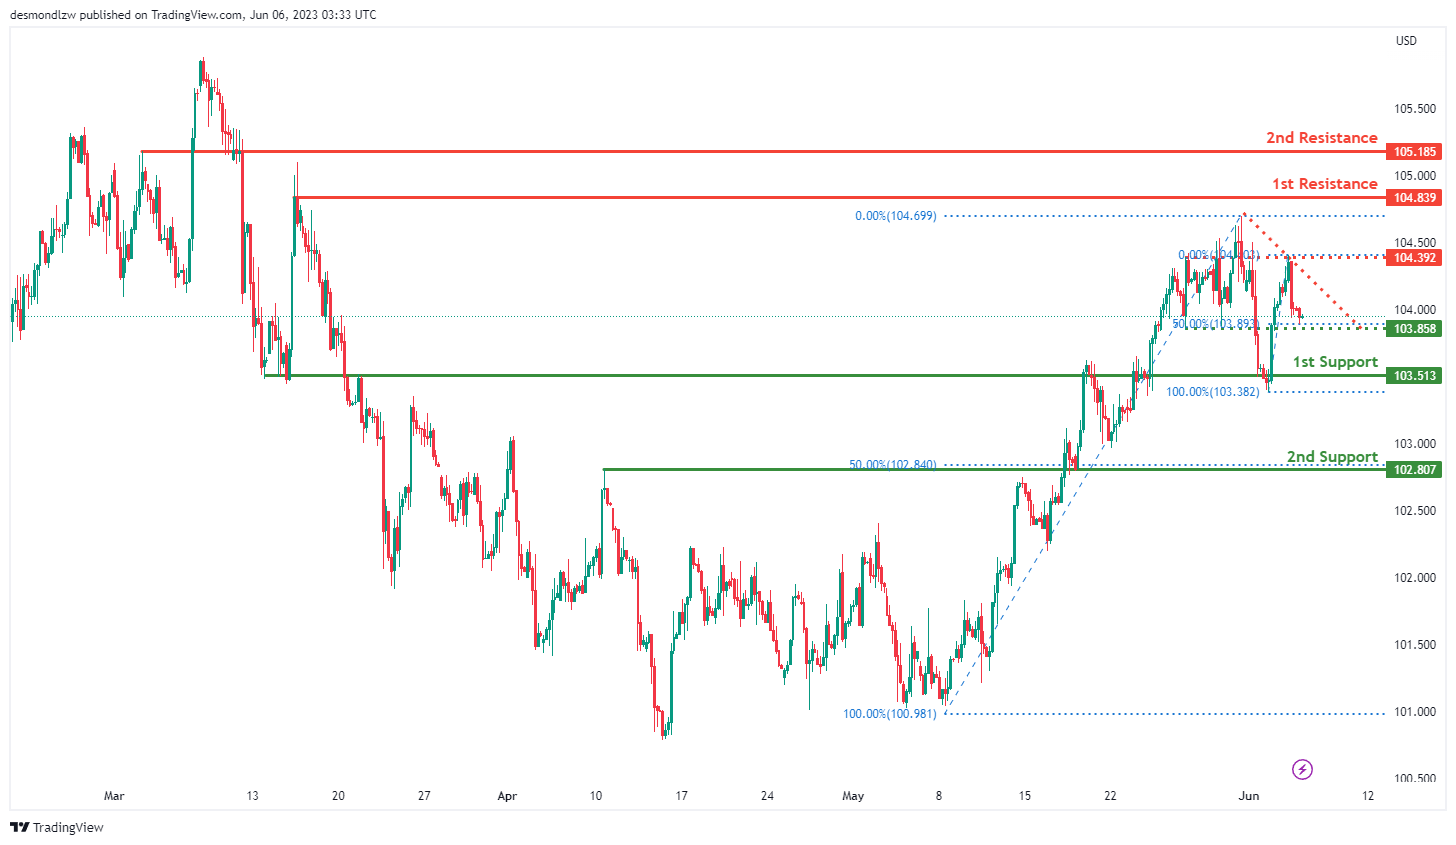
The DXY (US Dollar Index) chart is currently showing bearish momentum, with the price situated below a major descending trend line. This indicates a higher likelihood of continued downward movement. Under these bearish circumstances, it’s predicted that the price could continue its downward trajectory towards the first support level. There is also an intermediate support at 103.86 which is marked by the 50.0% Fibonacci retracement level.
The first support level is at 103.51. This overlap support level represents a zone where the market has previously found a price floor and could potentially do so again.
The second support level is at 102.81. This is another overlap support level, and it aligns with the 50% Fibonacci retracement level. This confluence strengthens the significance of this potential price floor.
The first resistance level is at 104.84. This overlap resistance level represents an area where sellers have previously come into the market and could potentially do so again, acting as a price ceiling.
The second resistance level is at 105.19, which is another overlap resistance level. This level could also serve as a significant barrier to any upward price movement.
EUR/USD:
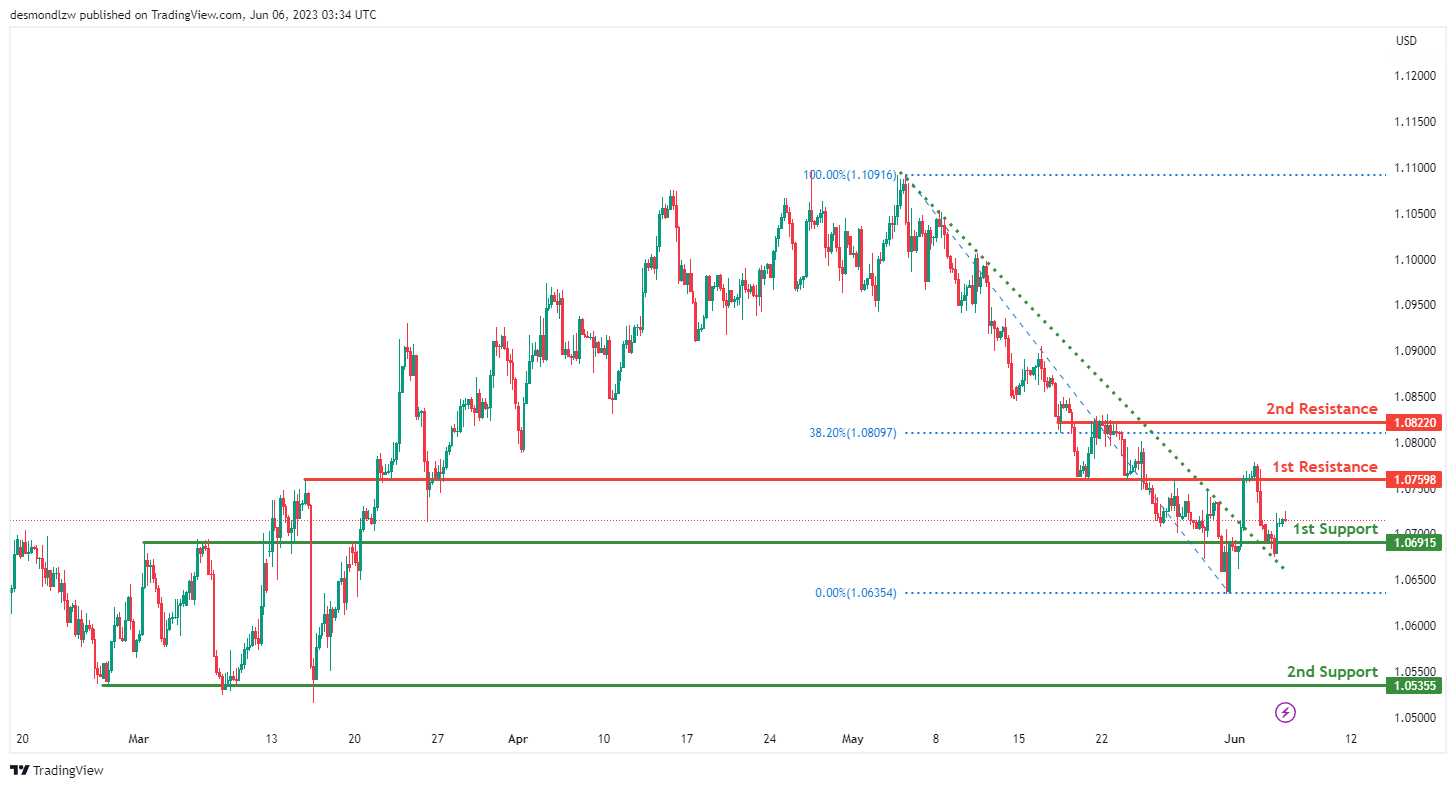
The EUR/USD chart is currently showing weak bullish momentum, which means that while the overall trend is upward, it lacks strength and is somewhat uncertain. Despite this uncertainty, the price has potential to make a bullish continuation towards the first resistance level.
The first support level is at 1.0692, which is identified as an overlap support. Overlap support is an area where price has bounced off before, suggesting that it is a significant level where buyers might enter the market.
The second support level is at 1.0536, another overlap support level. This is another price level where the market has found support previously and could potentially do so again.
The first resistance level is at 1.0760, an overlap resistance level. Resistance is an area where the price has previously been pushed down, suggesting potential selling pressure.
The second resistance level is at 1.0822. This level is also an overlap resistance, but it is further strengthened by the 38.2% Fibonacci retracement level. The combination of resistance and a key Fibonacci level often represents a significant price ceiling.
GBP/USD:
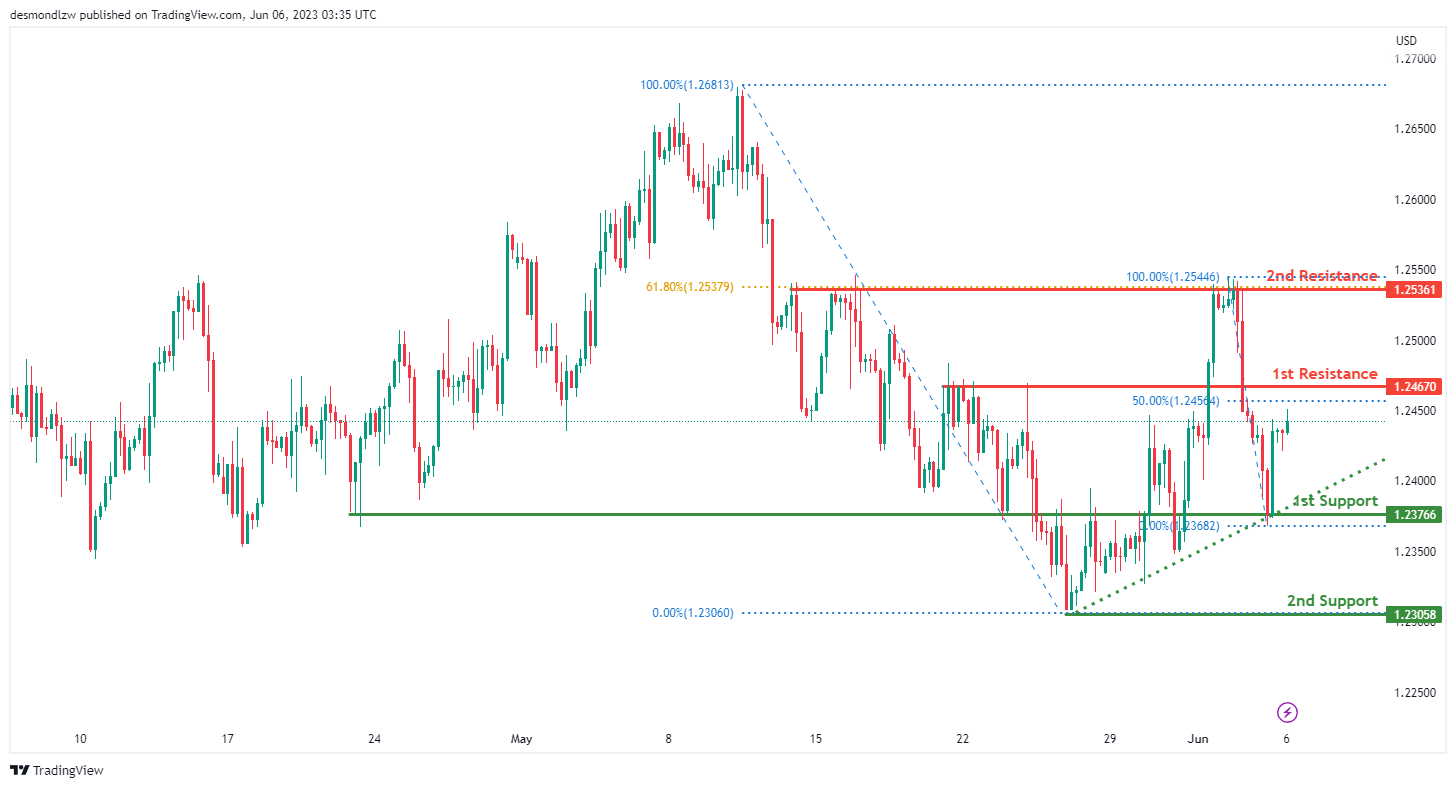
The GBP/USD chart is showing bullish momentum, meaning the trend is upward. This momentum is bolstered by the fact that the price is above a major ascending trend line, which suggests the possibility of further bullish momentum. In this situation, the price might continue its bullish trend towards the first resistance level.
The first support level is at 1.2377, which is classified as an overlap support. Overlap support is a level where price has bounced off before, indicating it as a significant level where buyers might come into the market.
The second support level is at 1.2306, which is a swing low support. This is a price level that acted as support during the most recent downward price swing and may do so again.
The first resistance level is at 1.2467. This level is an overlap resistance and is also marked by the 50% Fibonacci retracement level. This dual identity makes it a significant level where sellers might come into the market.
The second resistance level is at 1.2536. This level is also an overlap resistance and is further strengthened by being at the 61.8% Fibonacci retracement level. The combination of resistance and a key Fibonacci level often indicates a strong price ceiling.
USD/CHF:
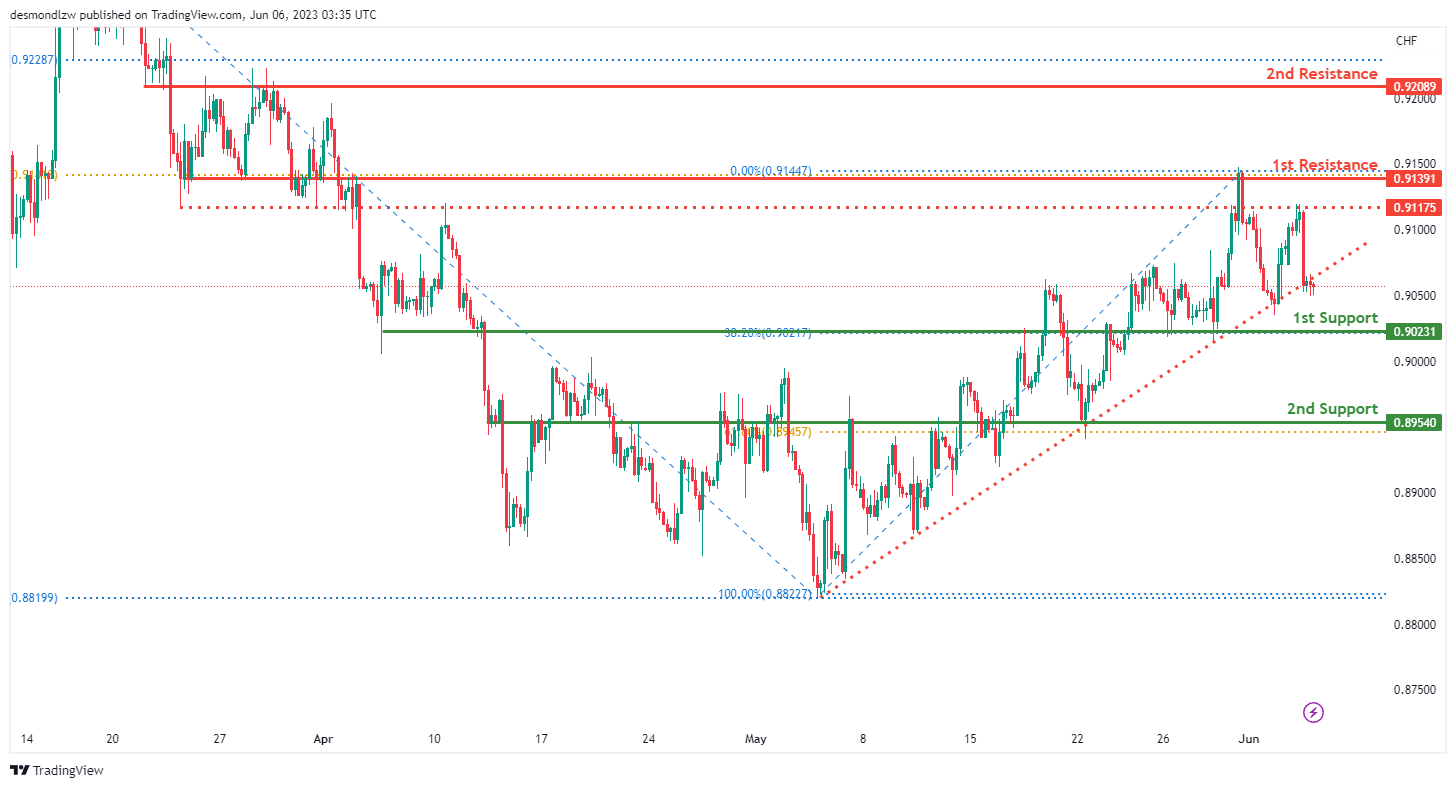
The USD/CHF chart is showing weak bearish momentum, which means the trend is mildly downward. This bearish sentiment could intensify if the price breaks below the ascending trendline, which could trigger a drop to the first support level. In this scenario, the price might continue its bearish trend towards the first support level.
The first support level is at 0.9023. This is an overlap support level and is also at the 38.2% Fibonacci retracement level. The combination of a support level and a key Fibonacci level often indicates a significant price floor where buyers might enter the market.
The second support level is at 0.8954. This is also an overlap support level and is further strengthened by being at the 61.8% Fibonacci retracement level. This dual significance could mark a strong potential buying point.
The first resistance level is at 0.9139. This level is an overlap resistance, suggesting it’s a significant level where sellers might come into the market.
The second resistance level is at 0.9209. This level is also an overlap resistance, marking it as another potential selling point.
USD/JPY:
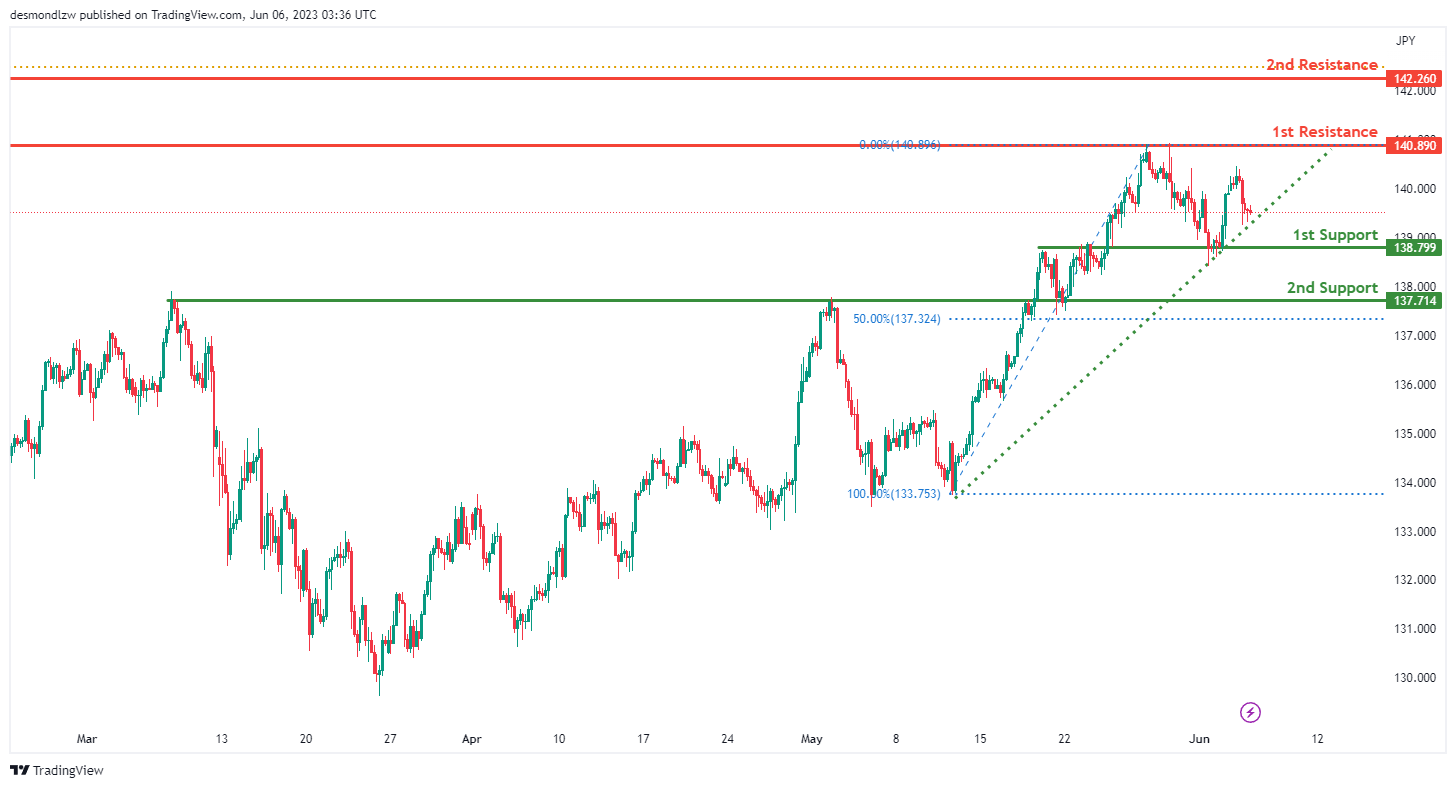
The USD/JPY chart is showing weak bullish momentum, which means the trend is mildly upward. This bullish sentiment could be reinforced as the price is currently above a major ascending trendline, suggesting that further bullish momentum is possible. In this scenario, the price might continue its bullish trend towards the first resistance level.
The first support level is at 138.80. This is an overlap support level, which often indicates a significant price floor where buyers might enter the market.
The second support level is at 137.71. This is also an overlap support level and is further strengthened by being at the 50% Fibonacci retracement level. This dual significance could mark a strong potential buying point.
The first resistance level is at 140.89. This level is an overlap resistance, suggesting it’s a significant level where sellers might come into the market.
The second resistance level is at 142.26. This level is also an overlap resistance, marking it as another potential selling point.
USD/CAD:
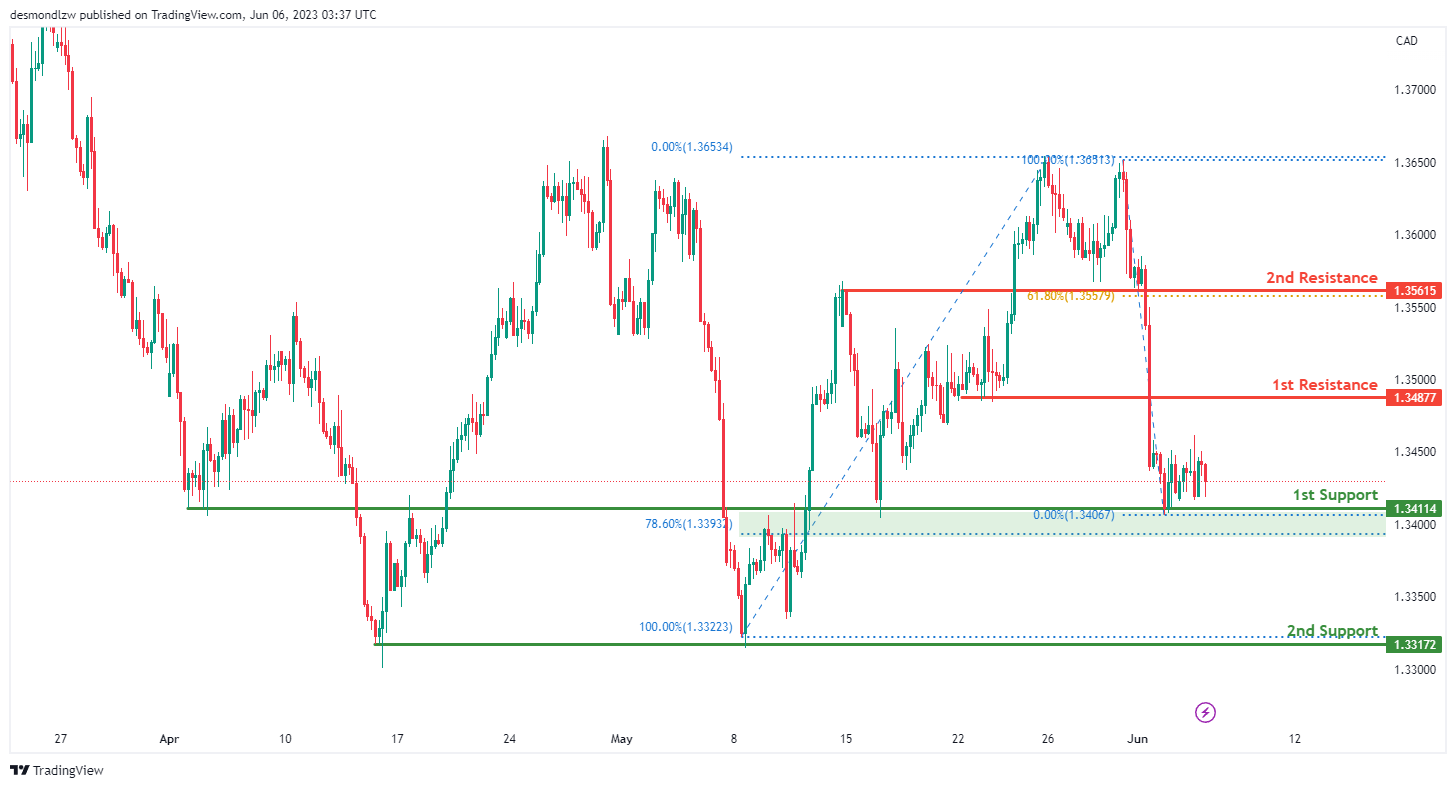
The USD/CAD chart is currently showing weak bullish momentum. Despite the low confidence, it suggests a mild upward trend, but the price may initially drop to the first support level before rebounding and rising towards the first resistance level.
The first support level is at 1.3411. This level is an overlap support, meaning it’s a price point where buyers have previously entered the market. It also corresponds to the 78.60% Fibonacci retracement level, indicating it could be a significant level for potential buyers.
The second support level is at 1.3317. This is another overlap support, which is usually an area of increased buying pressure.
The first resistance level is at 1.3488. This is an overlap resistance level, which often acts as a price ceiling where sellers may enter the market.
The second resistance level is at 1.3562. It is also an overlap resistance level and aligns with the 61.80% Fibonacci retracement level, which could attract sellers and potentially trigger a price reversal.
AUD/USD:
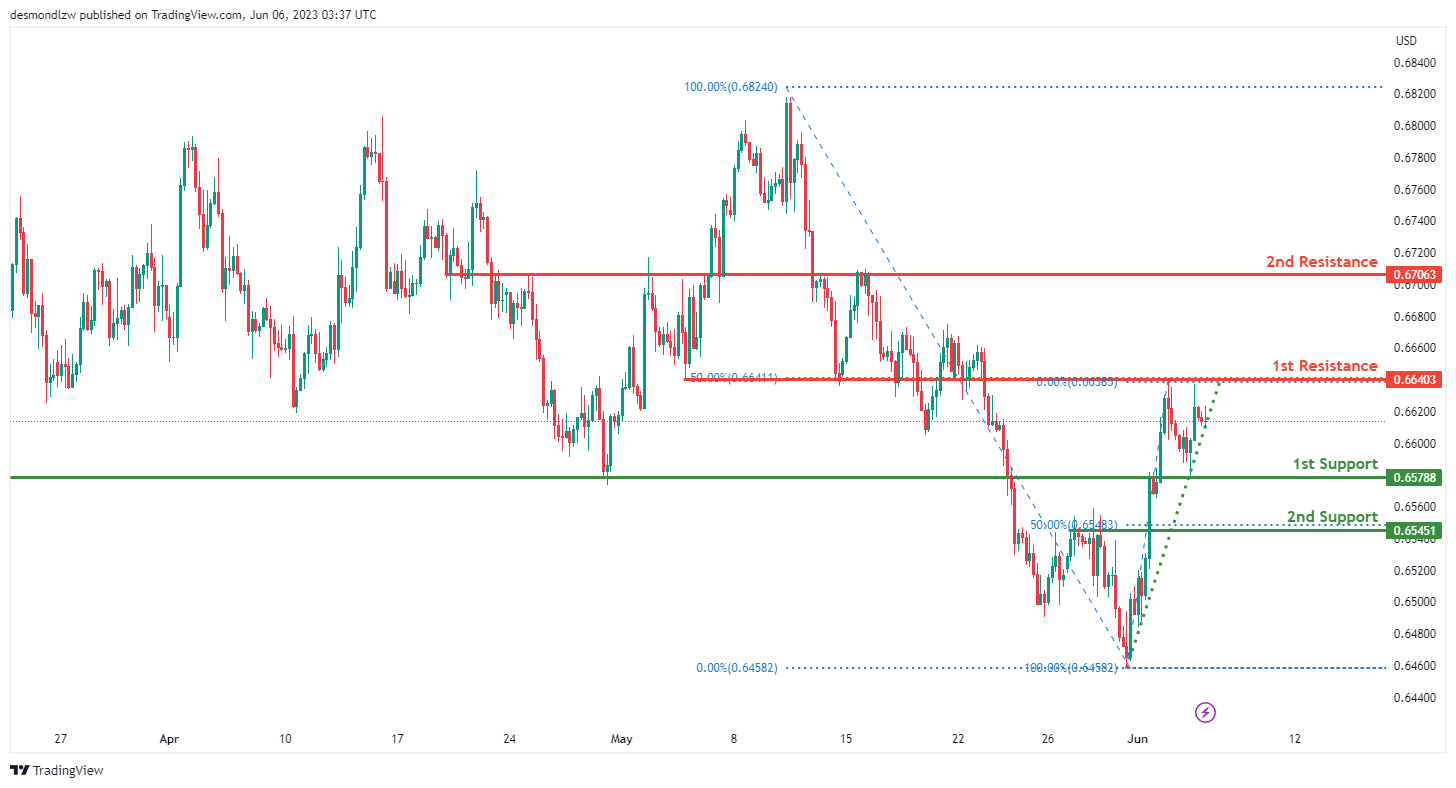
The AUD/USD chart is currently showing weak bullish momentum. Despite the low confidence, the price is above a major ascending trend line suggesting further bullish momentum. There’s the potential for the price to continue rising towards the first resistance level.
The first support level is at 0.6579. This is an overlap support, suggesting it’s a point where buyers have previously entered the market, making it a possible area for a bounce.
The second support level is at 0.6545. This is another overlap support and also corresponds to the 50% Fibonacci retracement level, making it a significant level for potential buyers.
The first resistance level is at 0.6640. This is an overlap resistance level, which often acts as a price ceiling. It is also at the 50% Fibonacci retracement level, potentially marking it as a point of interest for sellers.
The second resistance level is at 0.6706. This level is also an overlap resistance, which means it could act as a point of resistance for further price ascension.
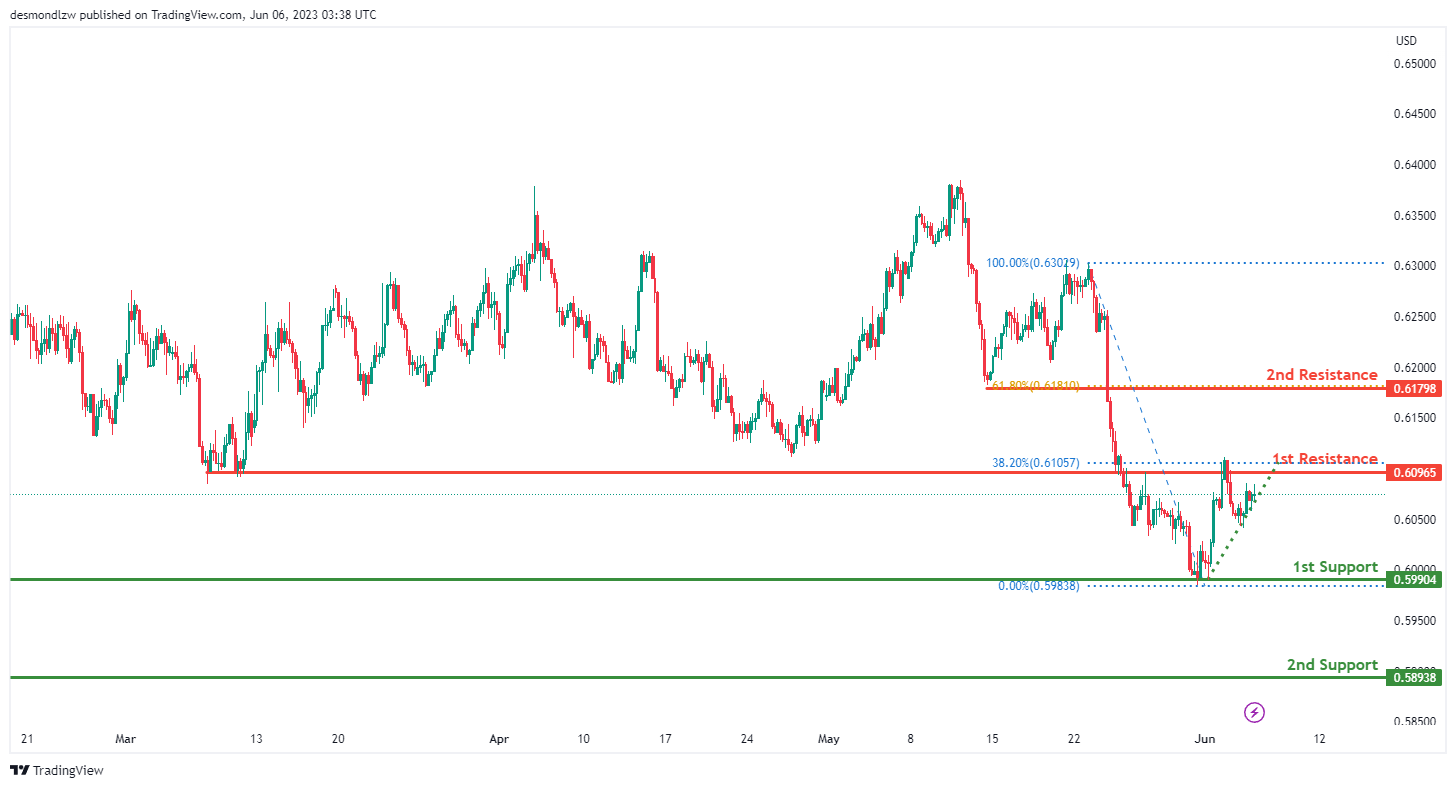
NZD/USD
The NZD/USD chart is currently showing bullish momentum. The price is above a major ascending trend line which suggests further bullish momentum could be in the cards. There’s the potential for the price to continue its bullish movement towards the first resistance level.
The first support level is at 0.5990. This is an overlap support, meaning it’s a point where buyers have previously entered the market, making it a possible area for a bounce.
The second support level is at 0.5894. This is another overlap support, again suggesting a possible area of buying interest.
The first resistance level is at 0.6097. This is an overlap resistance level, which often acts as a price ceiling. It is also at the 38.20% Fibonacci retracement level, making it a significant level for potential sellers.
The second resistance level is at 0.6180. This level is also an overlap resistance and corresponds to the 61.80% Fibonacci retracement level. This combination could make it a strong resistance point for further price ascension.
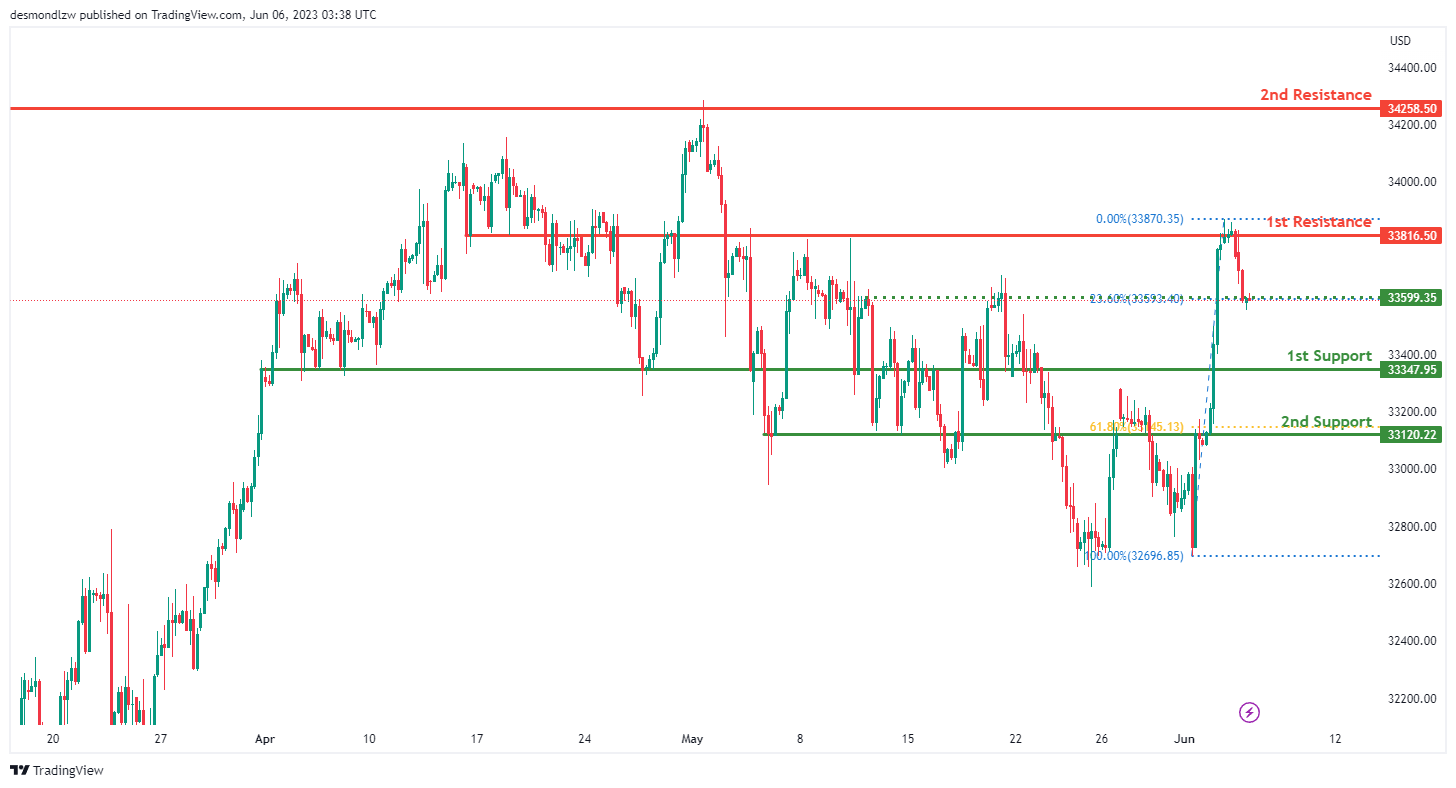
DJ30:
The DJ30 (Dow Jones Industrial Average) chart currently shows neutral momentum, suggesting that the price could fluctuate between the first resistance and first support levels. There is also an intermediate support at 33599.35 which is marked by the 23.6% Fibonacci retracement level.
The first support level is at 33347.95. This is an overlap support, indicating a point where buyers have previously entered the market, making it a possible area for a bounce.
The second support level is at 33120.22. This is another overlap support, again suggesting a possible area of buying interest. Additionally, it aligns with the 61.80% Fibonacci retracement level, adding to its significance as a potential price floor.
The first resistance level is at 33816.50. This is an overlap resistance level, which often acts as a price ceiling, making it a significant level for potential sellers.
The second resistance level is at 34258.5. This is also an overlap resistance, meaning that it could act as a barrier to further price ascension.
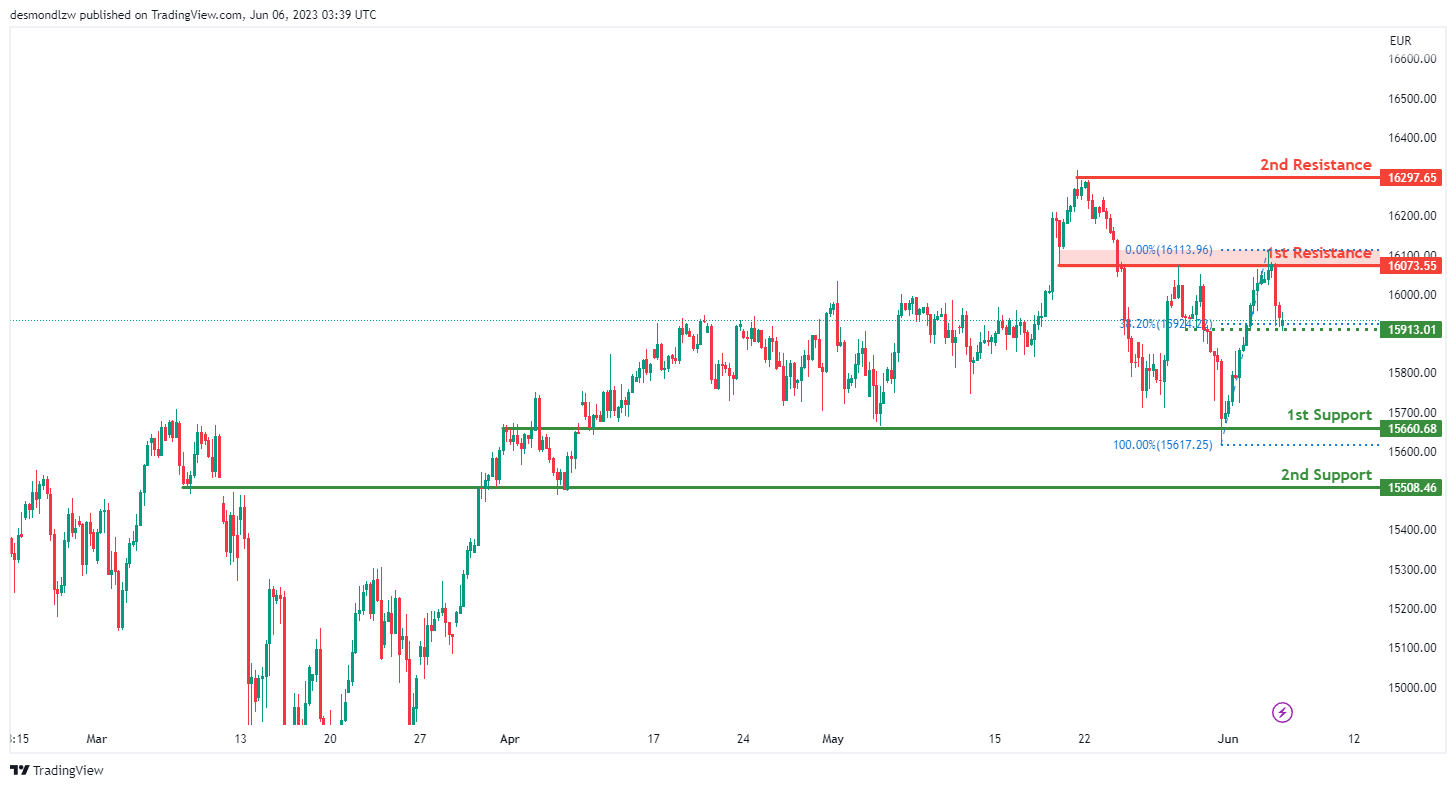
GER30:
The GER30 (DAX Index) chart currently shows neutral momentum, suggesting that the price could oscillate between the first resistance and first support levels. There is also an intermediate support at 15913.01 which is marked by the 38.2% Fibonacci retracement level.
The first support level is at 15660.68. This is an overlap support, indicating a point where buyers have historically entered the market, making it a probable area for a potential price rebound.
The second support level is at 15508.46. This is another overlap support, which also suggests a possible area of buying interest and can act as a significant level for buyers to possibly enter the market or for sellers to take profits.
The first resistance level is at 16073.55. This is an overlap resistance level, which often acts as a price ceiling, making it a critical level for potential selling interest.
The second resistance level is at 16297.65. This is also an overlap resistance, meaning it could potentially hinder further price increases.
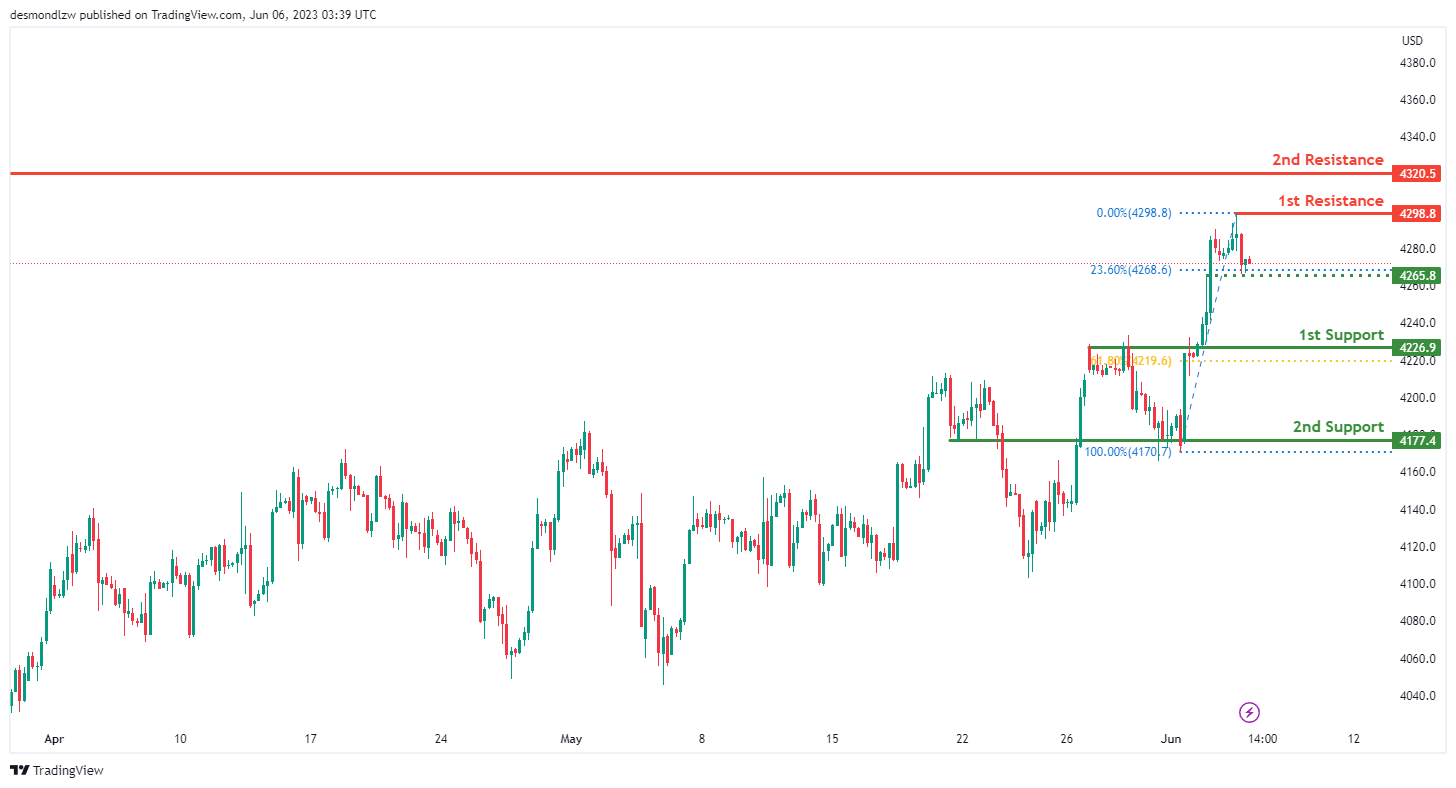
US500
The US500 (S&P 500 Index) chart currently shows neutral momentum, which suggests that the price might fluctuate between the first resistance and first support levels. There is also an intermediate support at 4265.80 which is marked by the 23.6% Fibonacci retracement level.
The first support level is at 4226.90. This is an overlap support and it also aligns with the 61.80% Fibonacci retracement level. This dual confluence increases the likelihood that this level could act as a strong price floor where buyers might step in.
The second support level is at 4177.40. This level is another overlap support, indicating a level where buyers have historically shown interest. If the price drops to this level, it could attract buying interest.
The first resistance level is at 4298.80. This level is identified as a swing high resistance, marking a recent peak in price where sellers had previously taken control. If the price reaches this level, it could face selling pressure.
The second resistance level is at 4320.50. This level is an overlap resistance, meaning it’s a level where sellers have historically come into the market, suggesting potential selling pressure if the price approaches this level.
BTC/USD:
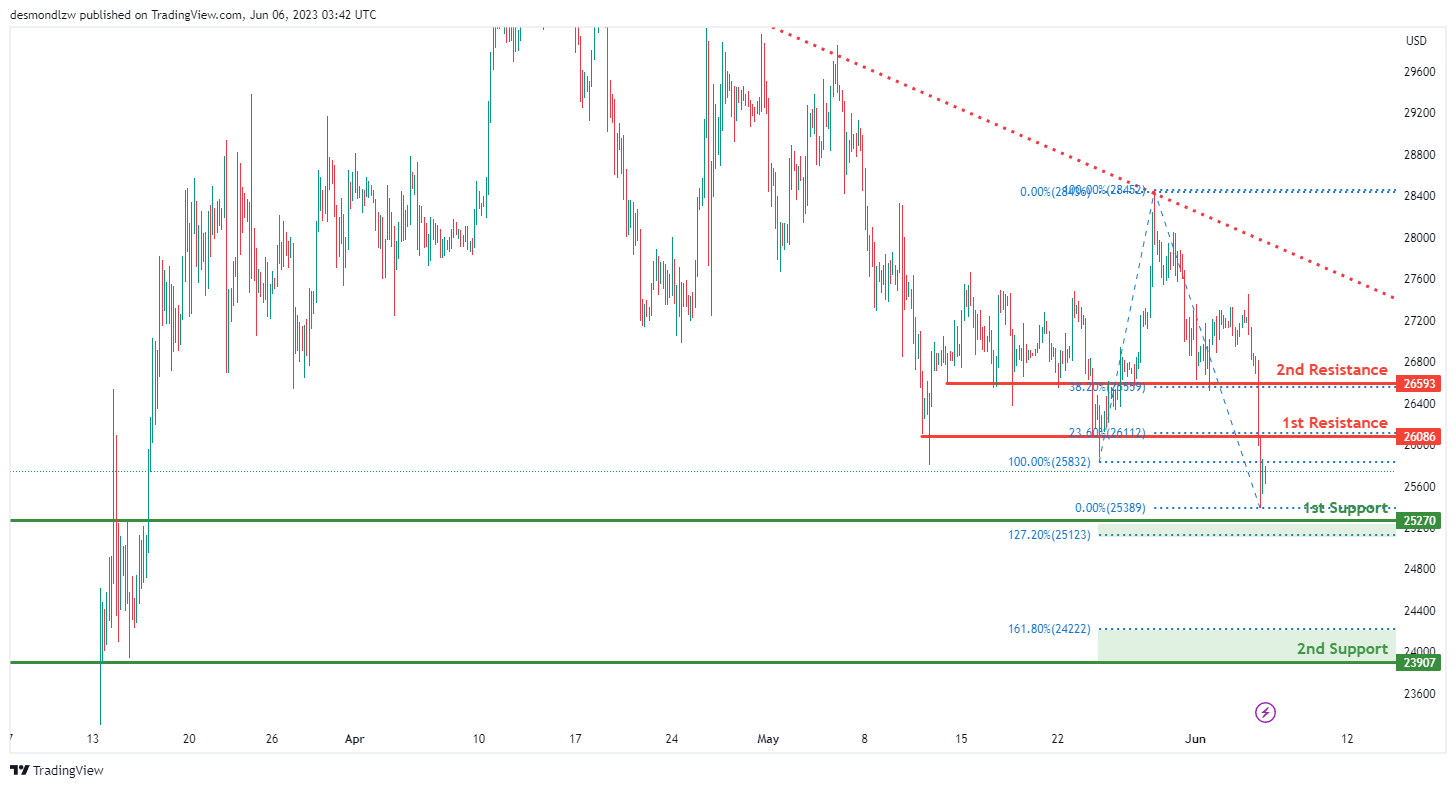
The BTC/USD chart is currently showing bearish momentum. This implies that sellers are dominating the market and the price is more likely to fall than to rise.
The first support level is at 25270.00. This is an overlap support, which means that it is a level where buyers have historically shown interest. Moreover, this support aligns with the 127.20% Fibonacci Extension level, which further strengthens its potential to hold as support.
The second support level is at 23907.00. This is another overlap support, again representing a price level where buyers have previously entered the market. It also coincides with the 161.80% Fibonacci Extension level, indicating that it is a strong potential support level.
The first resistance level is at 26086.00. This level is an overlap resistance, meaning that it is a level where sellers have historically come into the market. Furthermore, it aligns with the 23.60% Fibonacci Retracement level, adding to its potential as a resistance level.
The second resistance level is at 26593.00. This is another overlap resistance, and it is also at the 38.20% Fibonacci Retracement level, indicating that it could be a significant resistance level where sellers might step in.
ETH/USD:
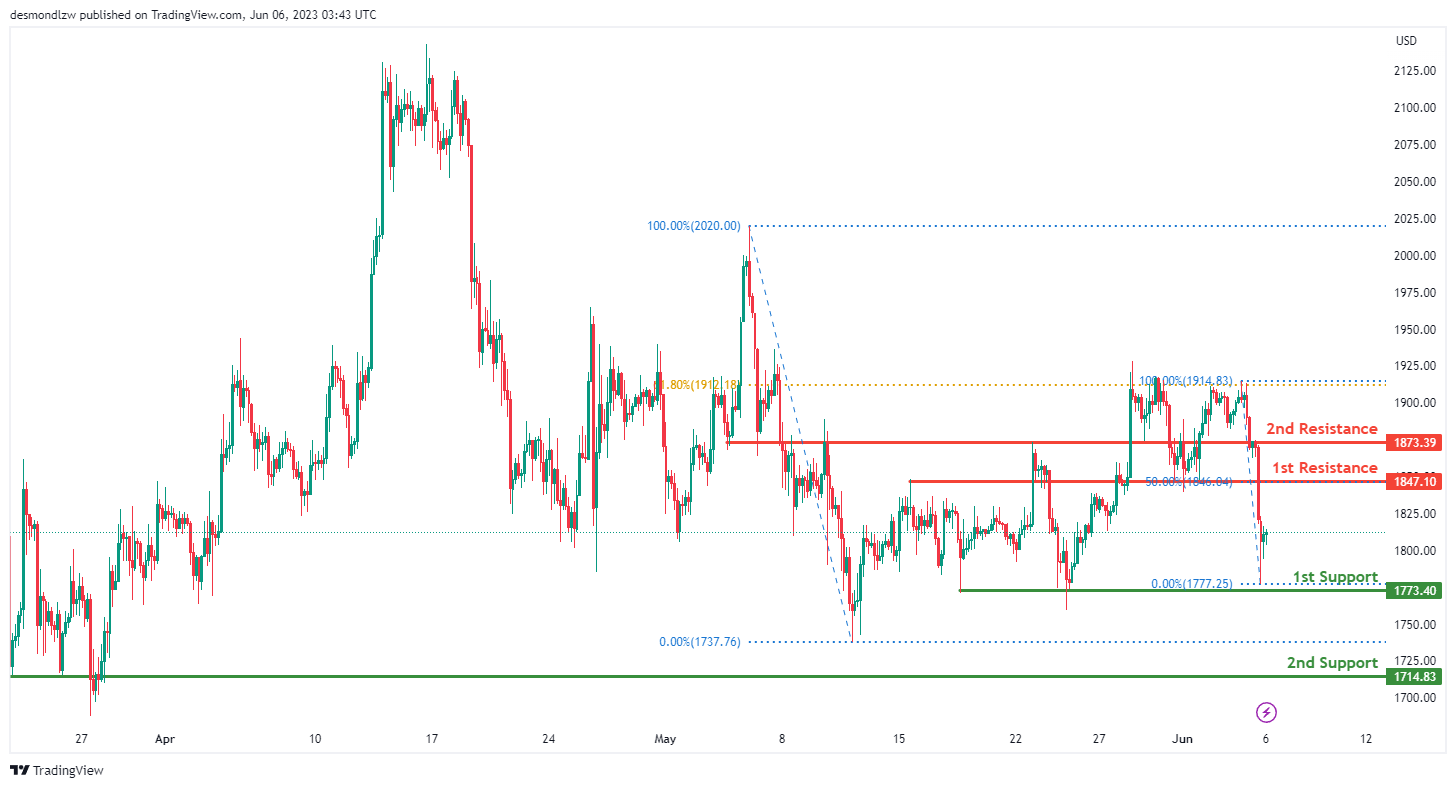
The ETH/USD chart is currently showing bearish momentum. This suggests that the market is dominated by sellers and there is a potential for the price to continue falling.
The first support level is at 1773.40. This is an overlap support, which means that it is a level where buyers have historically shown interest. This support level may hold strong and prevent further price decline.
The second support level is at 1714.83. Similar to the first, this is another overlap support, indicating a price level where buyers have previously entered the market, potentially offering further support to the price.
The first resistance level is at 1847.10. This level is an overlap resistance, signifying a point where sellers have historically entered the market. Moreover, it aligns with the 50% Fibonacci Retracement level, adding to its strength as a potential resistance level.
The second resistance level is at 1873.39. This is another overlap resistance, reinforcing that it could be a significant level where sellers might emerge.
WTI/USD:
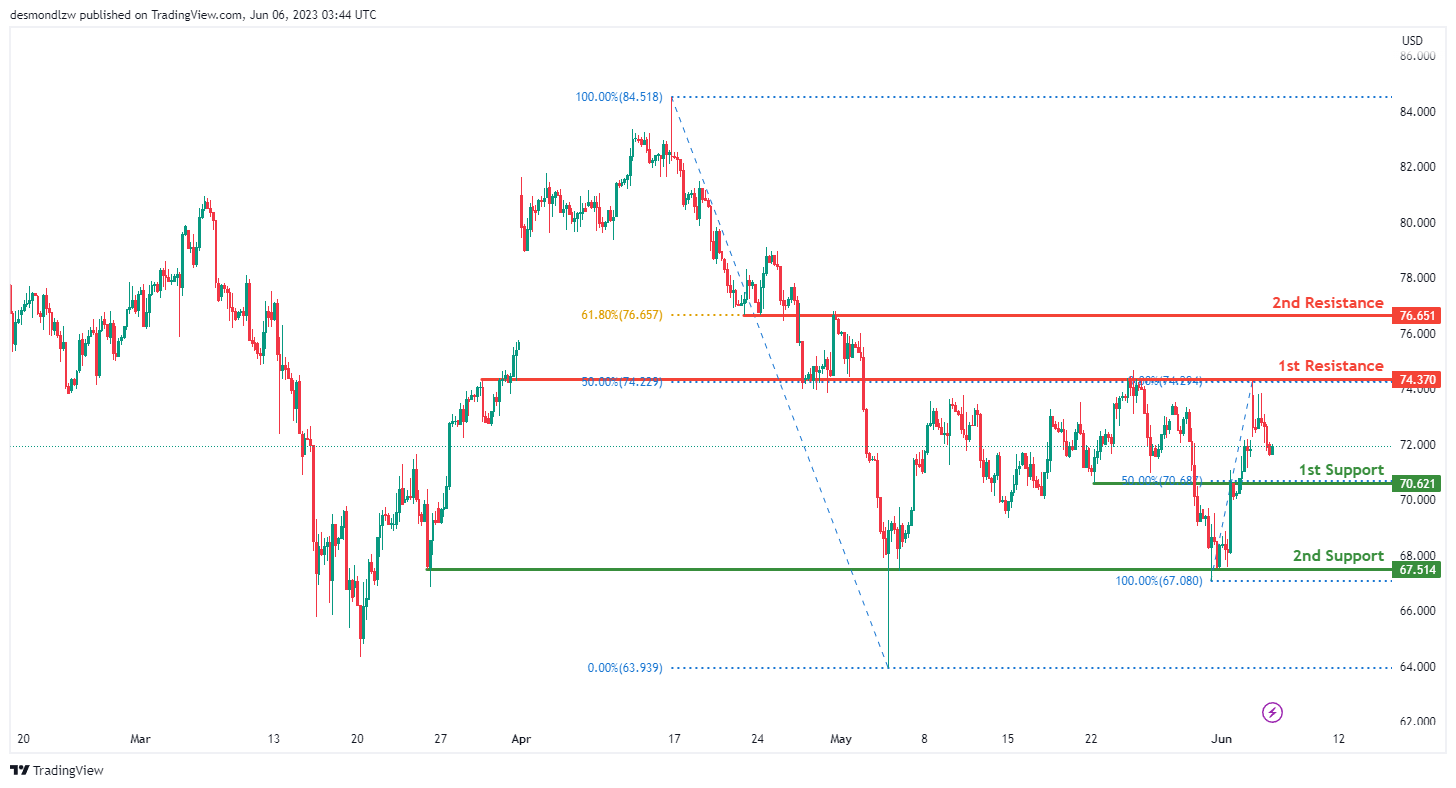
The WTI (West Texas Intermediate) chart is currently showing neutral momentum. This suggests that the market is indecisive, with neither buyers nor sellers having a definitive advantage.
The first support level is at 70.62. This is an overlap support, a level where buying interest has historically been strong. It’s also significant because it coincides with the 50% Fibonacci Retracement level, which often acts as a major support or resistance level in financial markets.
The second support level is at 67.51. This level is also an overlap support, indicating a price level where buyers have previously entered the market.
The first resistance level is at 74.37. This level is an overlap resistance, which means it’s a point where sellers have historically entered the market. Interestingly, this level also coincides with the 50% Fibonacci Retracement level, which could add to its validity as a resistance level.
The second resistance level is at 76.65. This is another overlap resistance, indicating a potential price level where selling interest might increase. It also aligns with the 61.80% Fibonacci Retracement level, adding further strength to this resistance.
XAU/USD (GOLD):
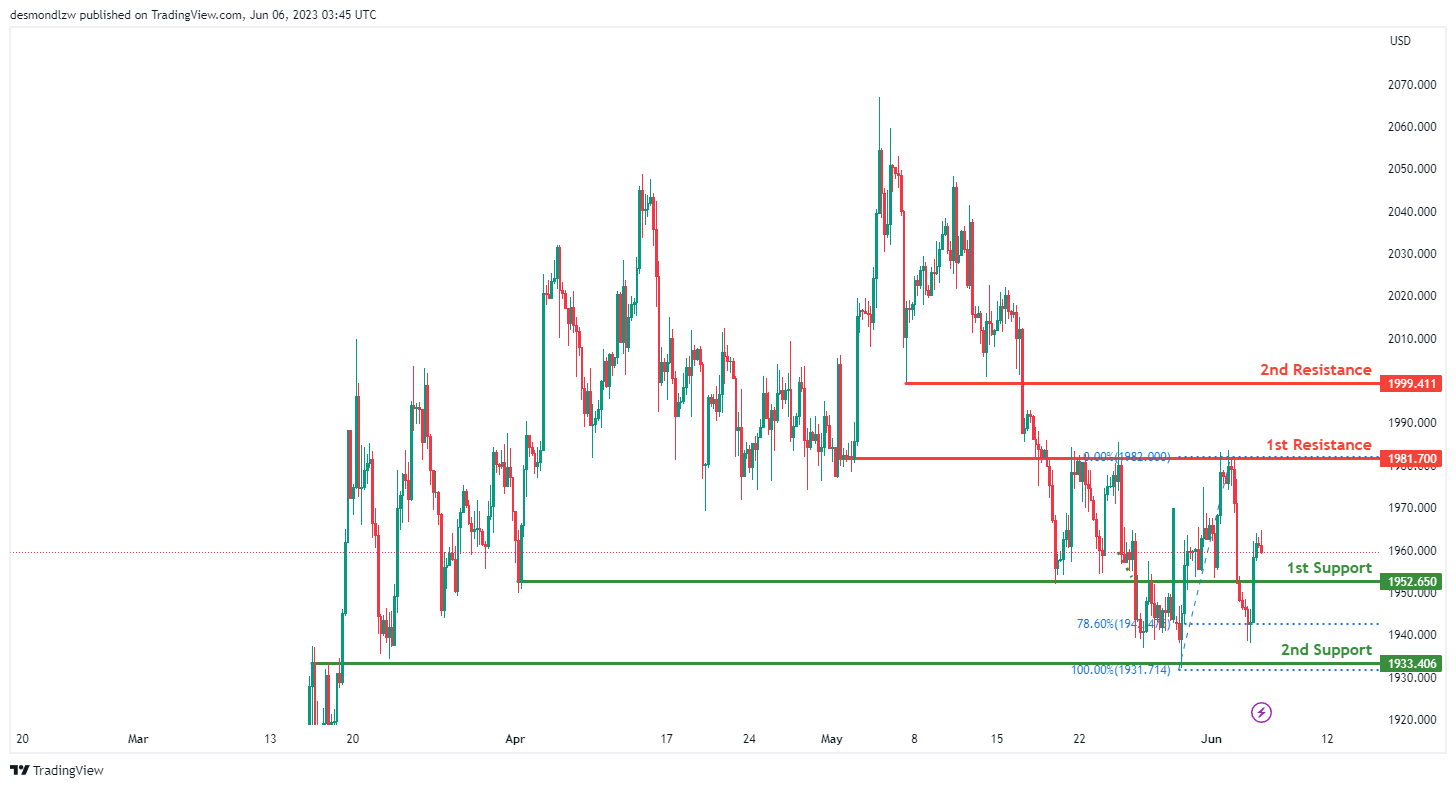
The XAU/USD (Gold) chart is currently showing a bearish momentum. This suggests that sellers are currently controlling the market.
The first support level is at 1952.65. This is an overlap support, indicating a price level where buying interest has historically been strong. Traders could potentially look for buying opportunities at this level.
The second support level is at 1933.41. This is another overlap support, a point where the market has previously seen increased buying interest. If the price continues to drop, this could be a potential area where buyers might step in.
The first resistance level is at 1981.70. This is an overlap resistance, indicating a price level where selling interest has previously been strong. If the price rises to this level, it could face selling pressure.
The second resistance level is at 1999.41. This is another overlap resistance. This level may act as a barrier to upward price movement, with sellers potentially stepping in to push prices down.
GBP/USD Could Attempt Fresh Increase above 1.2500
Key Highlights
- GBP/USD is slowly moving higher toward the 1.2500 resistance.
- A key bullish trend line is forming with support near 1.2380 on the 4-hour chart.
- EUR/USD is still trading well below the 1.0780 resistance.
- Gold price is facing strong resistance near $1,975.
GBP/USD Technical Analysis
The British Pound failed to clear the 1.2550 resistance and declined against the US Dollar. GBP/USD is again rising and trading above the 1.2400 level.
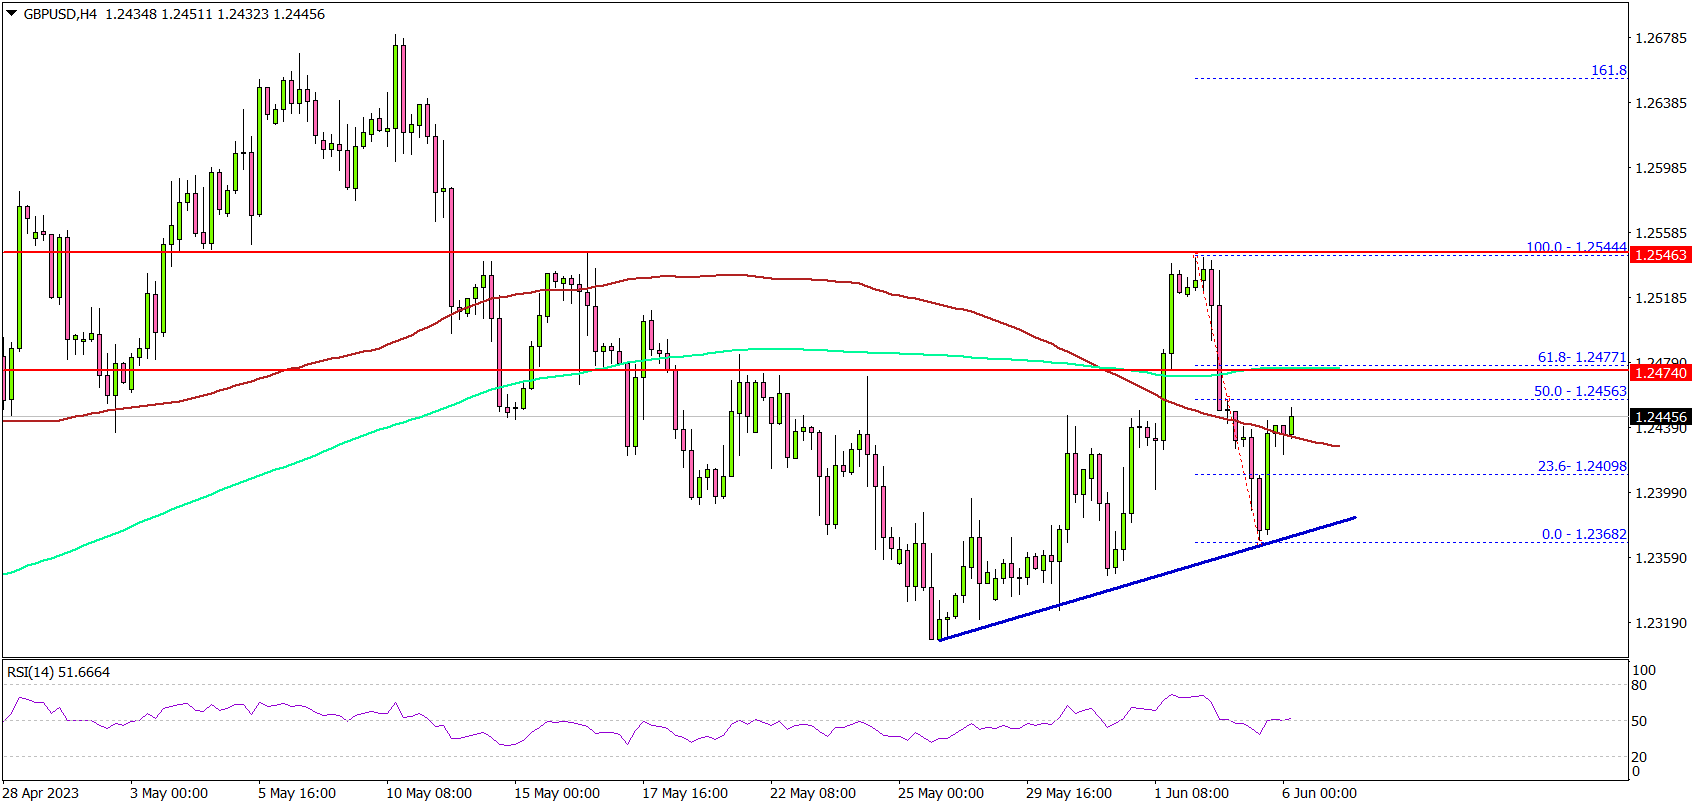
Looking at the 4-hour chart, the pair traded is slowly moving higher above the 100 simple moving average (red, 4 hours). There was a move above the 1.2400 resistance zone.
However, the pair is now approaching a few hurdles, starting with the 50% Fib retracement level of the downward move from the 1.2544 swing high to the 1.2368 low. The first major resistance is near the 1.2480 level and the 200 simple moving average (green, 4 hours).
It is near the 61.8% Fib retracement level of the downward move from the 1.2544 swing high to the 1.2368 low. The main resistance is near 1.2500, above which the pair might rise steadily.
If there is no wave above 1.2500, the pair could dip toward 1.2380. The next major support is near the 1.2350 level. If there is a downside break below the 1.2350 support, the pair could decline toward the 1.2300 support.
Looking at EUR/USD, the pair is slowly moving higher but there is strong resistance waiting near the 1.0780 level.
Economic Releases
- Euro Zone Retail Sales for April 2023 (YoY) - Forecast -1.8%, versus -3.8% previous.
EURCHF Wave Analysis
- EURCHF reversed from resistance level 0.9745
- Likely to fall to support level 0.9675
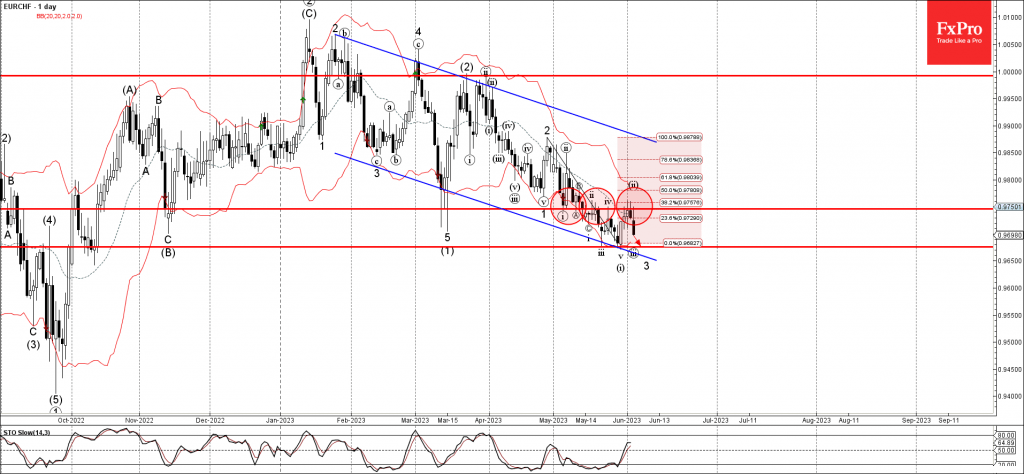
EURCHF recently reversed down from the pivotal resistance level 0.9745 (former support from March and the start of May) strengthened by the 20-day moving average and the 38.2% Fibonacci correction of the downward impulse from last month.
The downward reversal from the resistance level 0.9745 created the second consecutive reversal pattern Shooting Star.
Given the strong daily downtrend, EURCHF can be expected to fall further toward the next support level 0.9675 (which stopped the previous downward impulse wave (i)).
Gold Wave Analysis
- Gold reversed from support level 1940.00
- Likely to rise to resistance level 1985.00
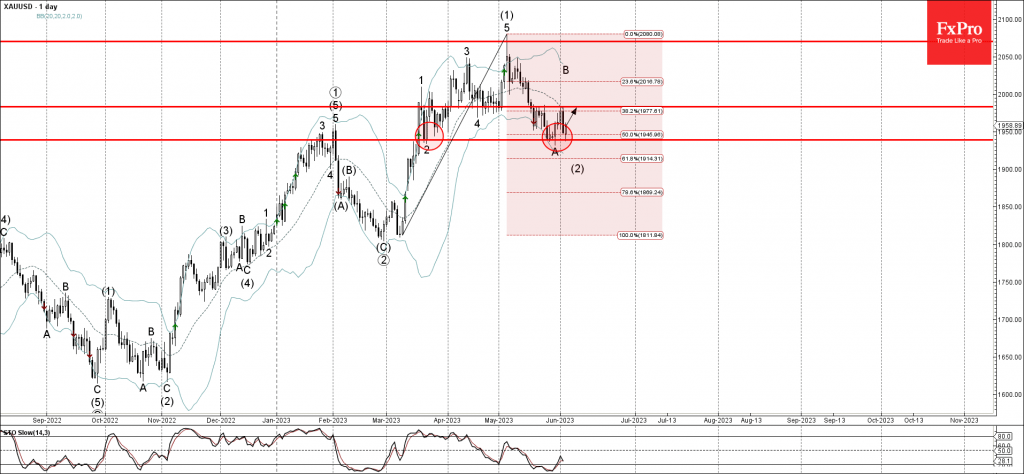
Gold recently reversed up from the key support level 1940.00 (which also stopped the previous wave 2 in the middle of March) standing near the lower daily Bollinger Band.
The upward reversal from the resistance level 1.3625 started the active B-wave of the intermediate ABC correction (2) from the start of May.
Given the predominant uptrend, Gold can be expected to rise further toward the next resistance level 1985.00 (former multi-day support April).
June Flashlight for the FOMC Blackout Period
To Hike or Not to Hike, That Is the Question
Summary
- After raising rates by 500 bps since March 2022, the FOMC signaled at the conclusion of its previous meeting on May 3 that the tightening cycle may be coming to an end. That said, the Committee was careful to keep its options open regarding further tightening.
- Economic data that have been released after the previous FOMC meeting have generally been stronger than expected. In addition, financial conditions have been little changed since the May meeting. Consequently, some Committee members have indicated their preference to raise rates further on June 14.
- However, some key FOMC members, including Chair Powell, FOMC Vice Chair Williams and Governor Jefferson, seem content to leave policy unchanged at next week's meeting to allow more time for past rate hikes to filter through to the economy.
- We see the most likely outcome for next week's meeting as the FOMC making no change to its policy rate, but making clear that another hike at its July 26 meeting remains a distinct possibility. This combination would allow a compromise between officials who believe further tightening is necessary and those who believe it is time to be patient and let the medicine of the past year fully take hold.
- The FOMC will release its quarterly Summary of Economic Projections (SEP) at the conclusion of its meeting on June 14. We think the median "dot" for year-end 2023 will shift up by 25 bps relative to the March SEP. If so, then most FOMC members would be indicating that the target range for the federal funds rate needs to go at least 25 bps higher from its current setting of 5.00%-5.25%. We think the median dots for 2024 and 2025 will also rise by 25 bps each to reflect a similar pace of eventual policy easing, as was the case in the March projections.
- We think most Committee members will bring down their forecasts of where they think the unemployment rate will end 2023, while nudging up their outlooks for GDP growth this year. We do not expect meaningful changes to the Committee's inflation projections.
Take a Breath
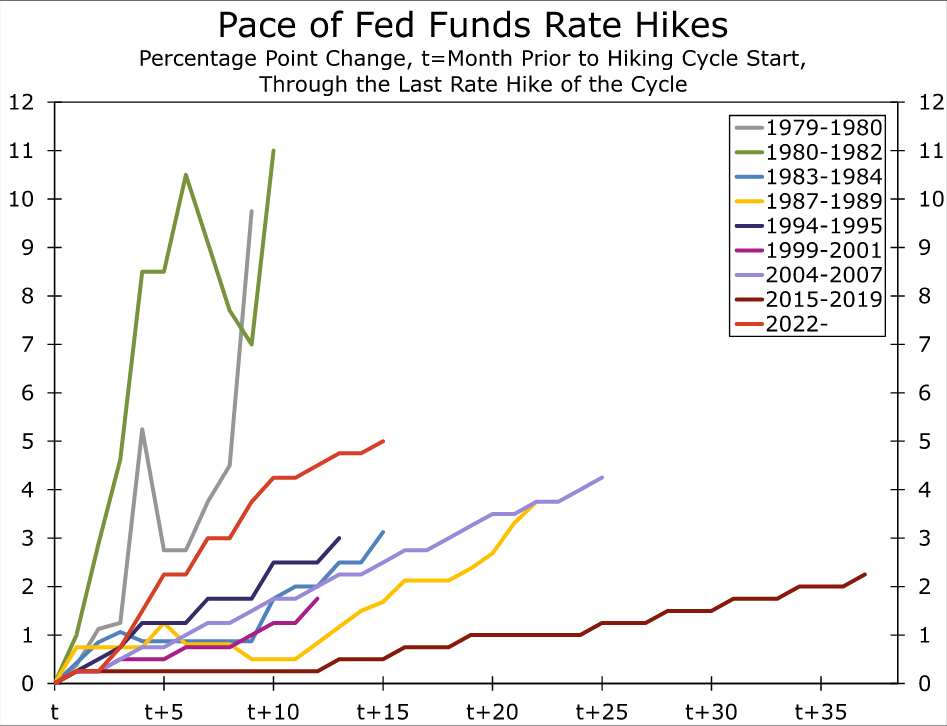
At the conclusion of the FOMC's meeting on May 3, there were signs that the most aggressive tightening cycle since the 1980s was nearing its end (Figure 1). Policymakers voted unanimously to raise the fed funds rate by 25 bps to 5.00-5.25%, a 15-year-high. Yet, the Committee was careful to keep its options open about additional rate hikes. Rather than noting that it anticipated "ongoing increases" or even "some additional policy firming," the post-meeting statement merely laid out the factors the FOMC would consider in determining how much additional tightening "may be appropriate" (emphasis ours). The change in language implied that Fed policy may have already arrived at a point where the FOMC could wait and see how the cumulative amount of tightening this cycle—a 500 bps increase in the fed funds rate and a $550B reduction in its balance sheet—is impacting the economy given the lagged effects of monetary policy.
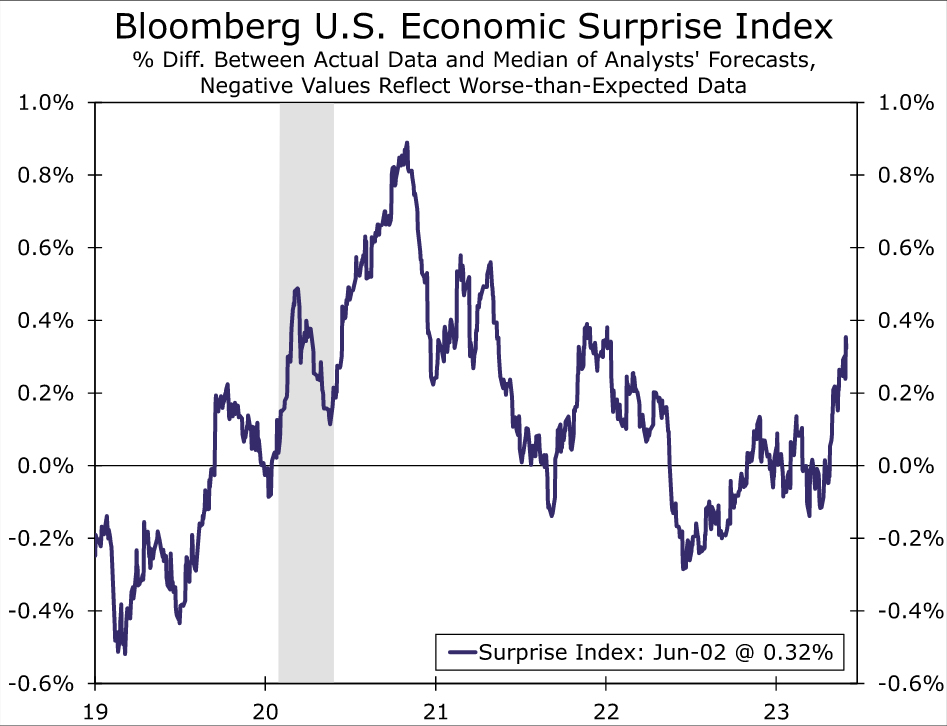
Because of these uncertain lags, the FOMC remains dependent on incoming data to guide its next steps. Since the FOMC's most recent meeting, the economic data have come in stronger than expected, driving the Bloomberg U.S. Economic Surprise Index to a 17-month high (Figure 2). Consumers stepped up spending on both goods and services in April, putting real personal consumption expenditures on track to grow at a 1%-2% annualized rate in Q2. Business investment looks a little stronger as core capital goods orders in April rose by the most in more than a year, and spending on private nonresidential construction has increased more than 10% year to date. Meanwhile, the dearth of existing homes for sale is supporting a modest rebound in residential investment, with single-family permits increasing for three straight months and homebuilder confidence rebounding to a 10-month high.
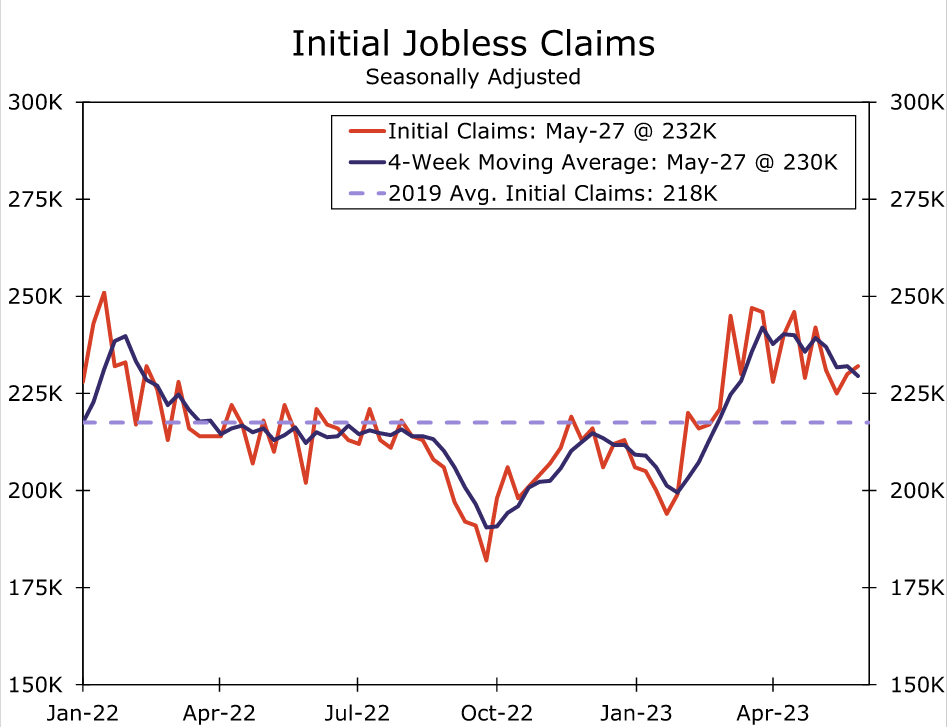
The labor market data have been equally strong. Nonfarm payrolls increased a robust 339K in May and have grown at an average pace of 283K over the past three months. Wage growth has cooled a bit but remains above what would be consistent with the Fed's 2% inflation target. Layoffs have moved sideways in recent months whether measured by initial jobless claims, the JOLTS data or Challenger job cuts announcements (Figure 3). Supply and demand are coming into better balance in the labor market, but only gradually.
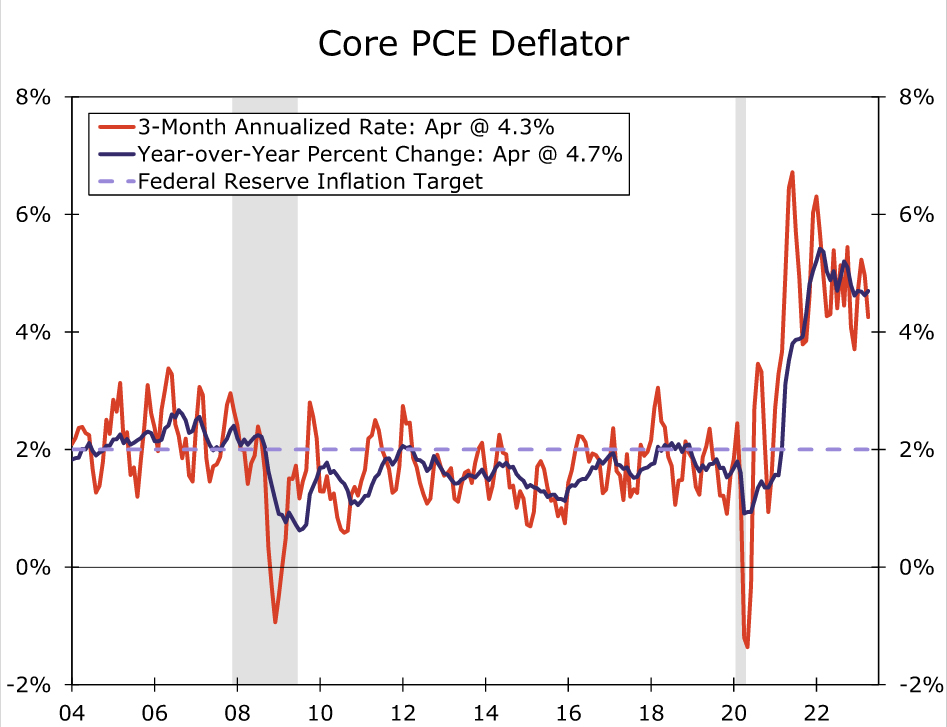
The corollary to resilient activity, however, is sticky inflation. The trend in inflation has yet to convincingly bend. The core Consumer Price Index has advanced 0.4% or more for five consecutive months, while April's above-consensus increase in the core PCE deflator keeps the Fed's preferred inflation gauge running two-times higher than the Committee's target when measured on a three-month annualized or 12-month basis (Figure 4). The FOMC will get another important look at recent inflation trends with the May CPI report scheduled to be released on June 13, the day the FOMC kicks off its meeting. Tamer commodity prices should leave overall consumer prices in May little changed. However, the core CPI index is on track for a 0.3%-0.4% monthly rise by our estimates, furthering the notion that inflation remains stubbornly high.
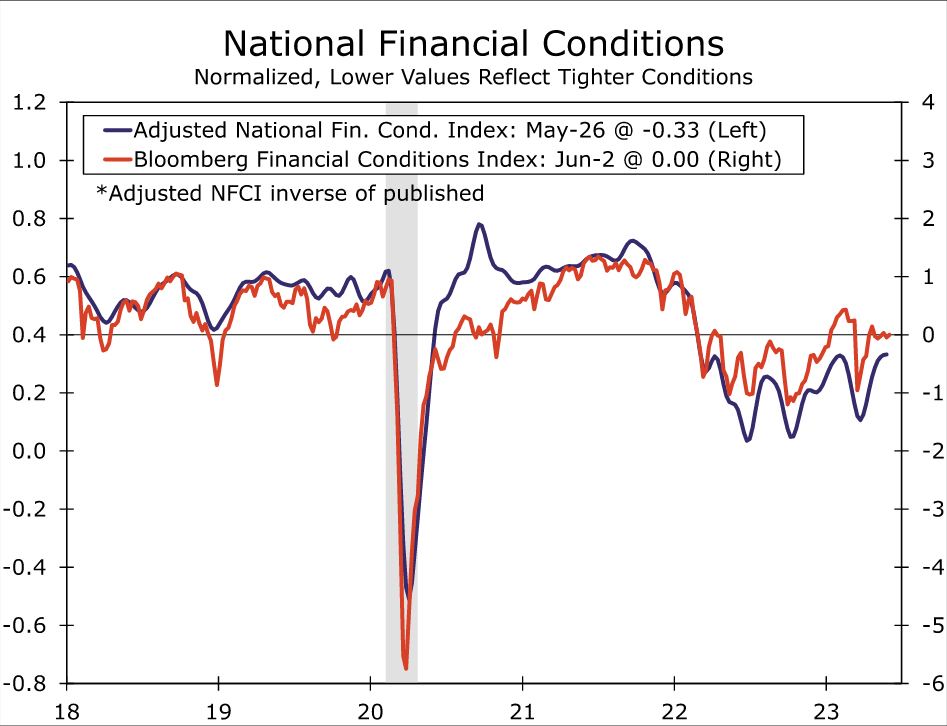
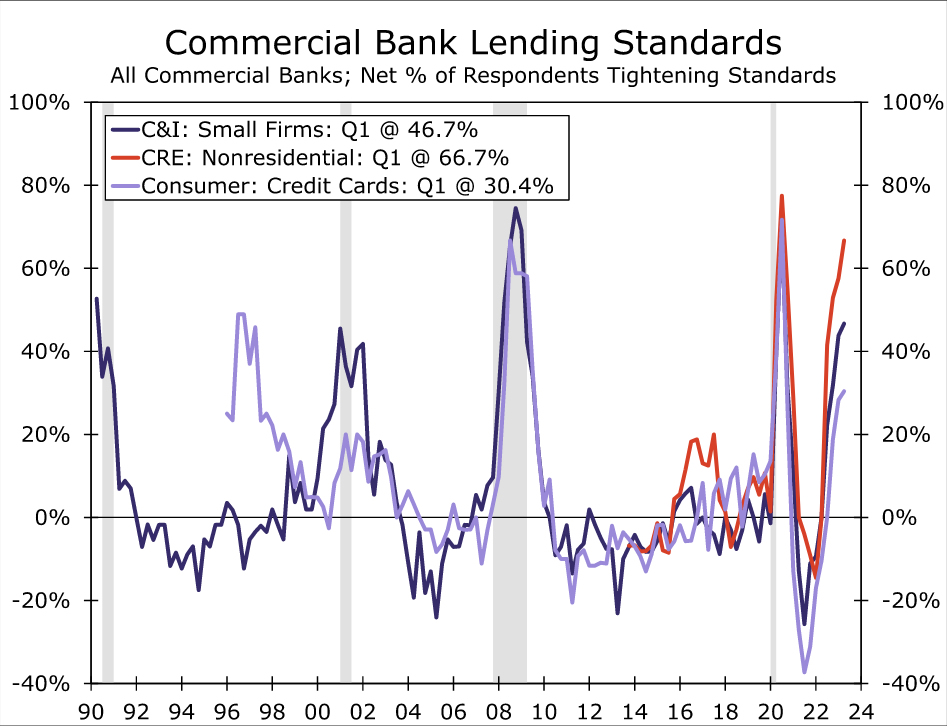
Meanwhile, financial conditions—the channel through which Fed policy affects the real economy—have been little changed since the FOMC's May meeting and are easier than a year ago when the Fed's tightening campaign was in its early months (Figure 5). The S&P 500 index has risen by nearly 12% since the last trading day of 2022, and corporate bond spreads are little changed on balance over the same period for both investment grade and high yield debt securities. Private lending conditions are more difficult to measure in real time and may be tightening more than public markets suggest. Unsurprisingly given the turmoil in the banking sector in March, credit standards at commercial banks tightened over the first quarter, though not materially more than the prior quarter (Figure 6). The KBW regional bank index has risen roughly 4% since the previous FOMC meeting on May 3, although it remains down significantly on the year.
The strength in the latest economic and financial market data has led to a meaningful number of Fed officials expressing their opinions that a bit more tightening likely will be needed to rein in inflation. Between data beats and a chorus of Fed officials sharing they are unconvinced monetary policy is significantly restrictive, the market-implied probability that the FOMC would hike another 25 bps at its June meeting rose to nearly 70% in late May.
Yet, key Fed officials, including Chair Powell, FOMC Vice Chair Williams and Board of Governors Vice Chair-nominee Jefferson, seem content to leave policy unchanged at the upcoming meeting to give more time for the past year's policy changes to filter through to the economy. On May 19, Chair Powell noted that "having come this far, we can afford to look at the data and the evolving outlook to make careful assessments." A day earlier, Governor Jefferson stressed the lags of monetary policy and that "a year is not a long enough period for demand to feel the full effect of higher interest rates." In what seemed like a pointed rebuke to markets pricing in a June increase, Governor Jefferson said just a few days before the blackout period began that "skipping a rate hike at a coming meeting would allow the Committee to see more data before making decisions about the extent of additional policy firming." The small amount of fiscal tightening in the recent debt ceiling bill may also provide wavering FOMC participants some comfort that fiscal policy is at least modestly pulling on the same side of the rope as monetary policy.
Therefore, we see the most likely outcome for next week's meeting as the FOMC making no change to its policy rate but making clear that another hike at its July 26 meeting remains a distinct possibility. This would allow a compromise between officials who believe further tightening is necessary and those who believe it is time to be patient and let the medicine of the past year fully take hold. We think this balanced approach will be enough to stave off any dissenting votes, but the uncertain outlook and increasingly fractured views within the FOMC have increased the odds that one or more dissents could occur at one of the upcoming meetings.
The timing at which to first take a step back and leave more time to assess the effects of policy seems a bit odd to us given the surprising strength of recent data and leads us to wonder if some Committee members are weary about the effect of even higher rates on the banking system. However, a "skip" would hardly be unprecedented. In the most recent tightening cycle of 2015-2018, the FOMC never hiked rates at back-to-back meetings. Even in the 1994-95 cycle when the FOMC was raising rates in 50 bps or 75 bps increments, it did so at every other meeting.
If the Committee does decide to leave the fed funds rate unchanged, we would expect the statement to emphasize the significant amount of policy tightening undertaken in a little over a year. But to keep the door open to potentially more tightening, the statement would likely maintain the reference to possible additional policy firming being appropriate. The clearest indication that FOMC participants believe some further tightening is more-likely-than-not probably will come from the Summary of Economic Projections (SEP), to which we now turn.
SEP: Modestly Higher Dots, More Resilient Economy
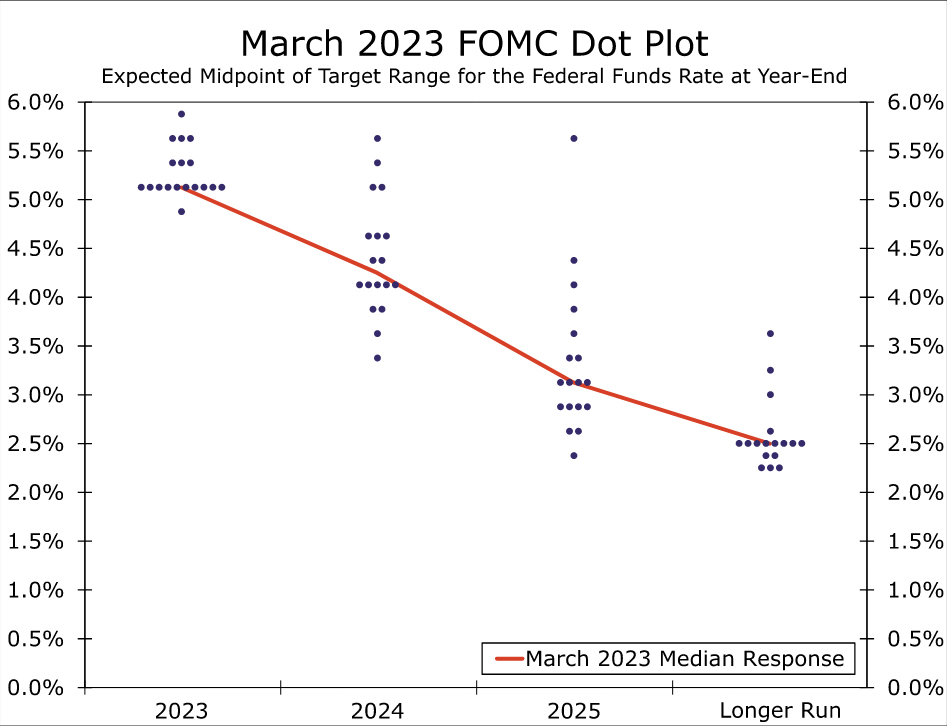
The upcoming FOMC meeting will include an update to the Committee's SEP, which summarizes the macroeconomic forecasts that each FOMC member provides on a quarterly basis. In the previous SEP released at the March FOMC meeting, the median projection for the federal funds rate at year-end 2023 was 5.125%, which is the midpoint of the current fed funds target range. However, the "dots" for year-end 2023 had a clear upward bias; seven projections were above 5.125%, while just one was below (Figure 7). As a result, it would not take much to nudge the 2023 median dot a little higher, and accordingly we look for the 2023 median dot to be 5.375% in the updated projections. This could serve as an olive branch to the more hawkish members of the Committee who are concerned that more monetary policy tightening is still warranted. We think the median 2024 and 2025 dots will also rise by 25 bps each to reflect a similar pace of eventual policy easing, as was the case in the March projections.
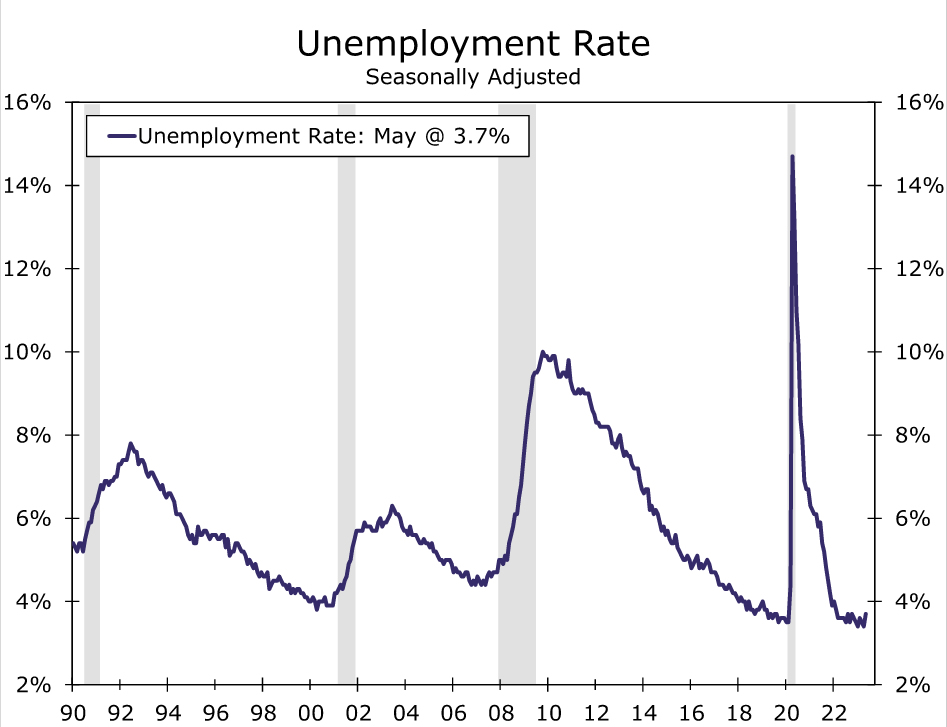
As we discussed earlier, the economy has outperformed expectations in recent months, and we believe the SEP will be updated to reflect this rosier near-term outlook. The current unemployment rate is a low 3.7% (Figure 8), but the March SEP included a median year-end projection for the unemployment rate of 4.5% in 2023. If realized, this would signal a rapid deterioration of the labor market in a short period of time. We think the Committee will revise its projections for this year's unemployment rate down, with a median estimate of 4.1% or so plausible in our view. We doubt the 2024 or 2025 unemployment rate projections will change materially.
Similarly, the median projection for real GDP growth in 2023 looks too low at 0.4%. Real GDP growth registered a 1.3% annualized pace in Q1, and it appears to be on track to grow at least that fast in Q2. We think the median 2023 growth projection will rise by at least a few tenths of a percentage point, although the 2024 and 2025 projections may drift lower to reflect the lagged effect from past tightening.
Despite these changes, the Fed's inflation projections probably will not change very much. The median core inflation projections might be nudged higher by a tenth of a percentage point or so, similar to the changes made in the March SEP. Headline PCE inflation could be revised lower by a similar amount given recent downward pressure on food and energy prices. On balance, however, we do not expect major changes to the Committee's inflation projections.