Sample Category Title
EUR/AUD Daily Outlook
Daily Pivots: (S1) 1.6315; (P) 1.6394; (R1) 1.6506; More...
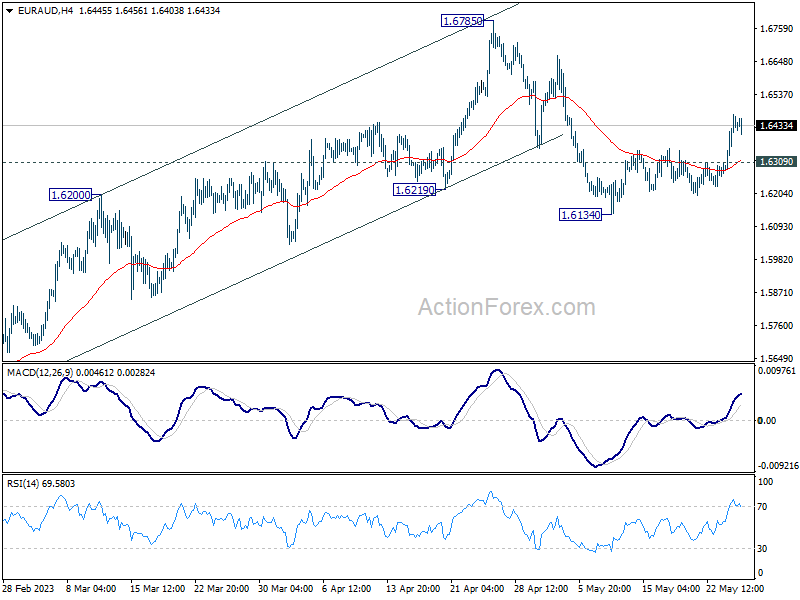
Intraday bias in EUR/AUD stays on the upside at this point. Pull back from 1.6785 should have completed at at 1.6134, after drawing support from 55 D EMA (now at 1.6222). Further rally should be seen to retest 1.6785 high next. On the downside, however, break of 1.6309 minor support will dampen this view and turn bias neutral first.
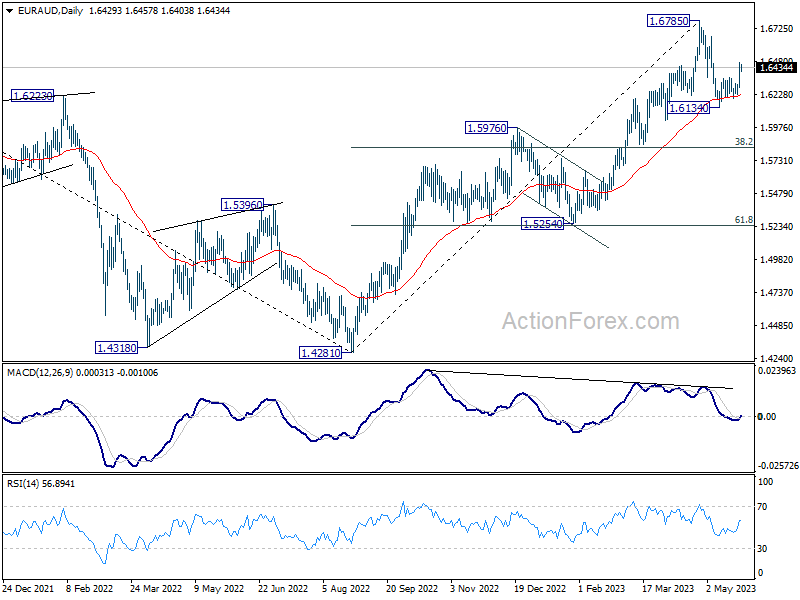
In the bigger picture, whole down trend from 1.9799 (2020 high) should have completed at 1.4281 (2022 low). Further rise should be seen to 61.8% retracement of 1.9799 to 1.4281 at 1.7691 next. For now, outlook will stay bullish as long as 1.5976 resistance turned support holds, even in case of deep pull back.
EUR/CHF Daily Outlook
Daily Pivots: (S1) 0.9706; (P) 0.9729; (R1) 0.9752; More...
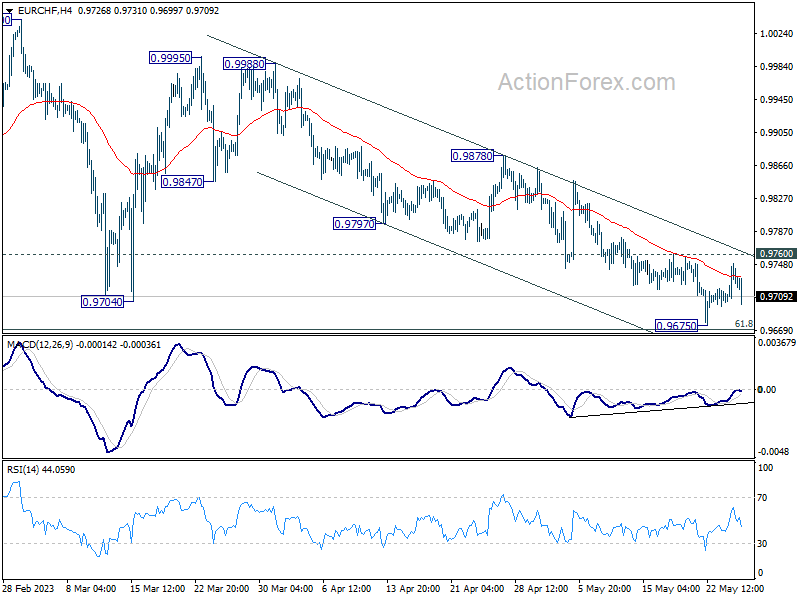
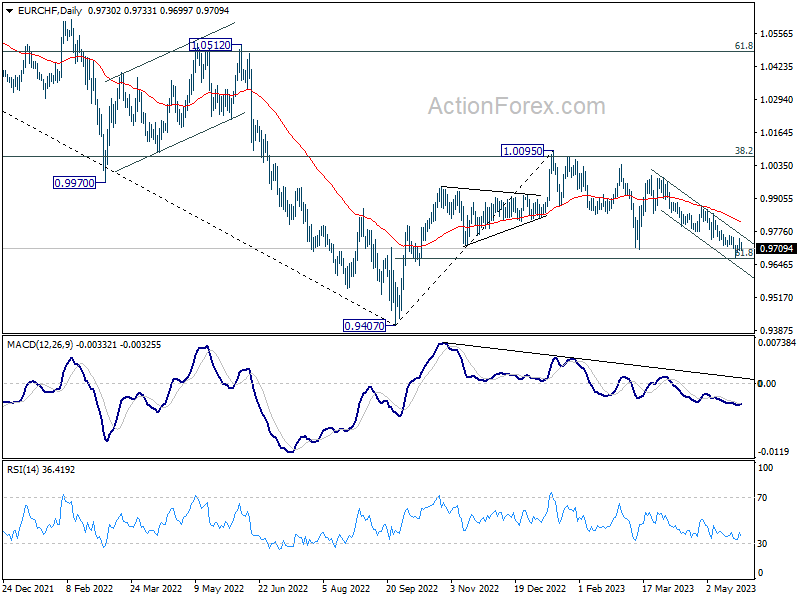
EUR/CHF failed to break through 0.9760 resistance and treated. Intraday bias stays neutral first. Strong support should still be seen around 61.8% retracement of 0.9407 to 1.0095 at 0.9670 to complete the whole corrective pattern from 1.0095. On the upside, firm break of 0.9760 resistance will confirm short term bottoming, and turn bias back to the upside for 0.9878 resistance next. However, sustained break of 0.9670 will pave the way back to 0.9407 low instead.
In the bigger picture, prior rejection by 38.2% retracement of 1.1149 to 0.9407 at 1.0072 suggests that medium term outlook is staying bearish. The pair is also capped below 55 W EMA (now at 0.9963). Down trend from 1.2004 is not completed yet and is in favor to resume through 0.9407 at a later stage. However, decisive break of 1.0095 resistance will raise the chance of bullish trend reversal. Rise from 0.9407 should then target 1.0505 cluster resistance (2020 low at 1.0505, 61.8% retracement of 1.1149 to 0.9407 at 1.1484).
NZD/USD: Kiwi Dollar at New Multi-Month Low after Sharp Fall on Dovish RBNZ
The Kiwi dollar is holding firmly in red in early Thursday and extends steep fall into third straight day.
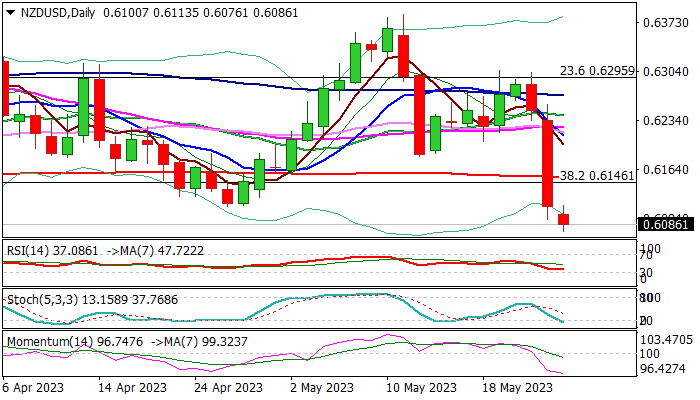
Bears hit the lowest since mid-November on probe through key short-term support at 0.6084 (2023 low, posted on Mar 8), in extension of Wednesday’s post RBNZ 2% fall (the biggest one day loss since Feb 3).
The currency was deflated by dovish steer from the New Zealand’s central bank, which delivered 25 basis points hike (pushed the borrowing cost to 5.50%) in line with expectations but signaled that tightening cycle is over.
The decision surprised markets as many speculated that the RBNZ may lift rates to 6% and prompted strong selling of the Kiwi dollar.
Wednesday’s massive bearish daily candle weighs on near-term action, along with firmly bearish daily studies, although oversold conditions may spark a partial profit-taking after 3.2% drop in past three days.
Upticks would provide better levels to re-enter bearish market for clear break of 0.6084 pivot and attack at next key supports at 0.6025 (50% retracement of 0.5511/0.6538) and 0.6000 zone (psychological/weekly cloud base).
Former low of Apr 26 (0.6111) marks initial resistance ahead of broken Fibo 38.2% (0.6146) and 200DMA (0.6152) which should cap extended upticks and keep bears in play.
Res: 0.6111; 0.6152; 0.6182; 0.6230.
Sup: 0.6076; 0.6025; 0.6000; 0.5903.
WTI Futures Advance to Fortified Technical Region
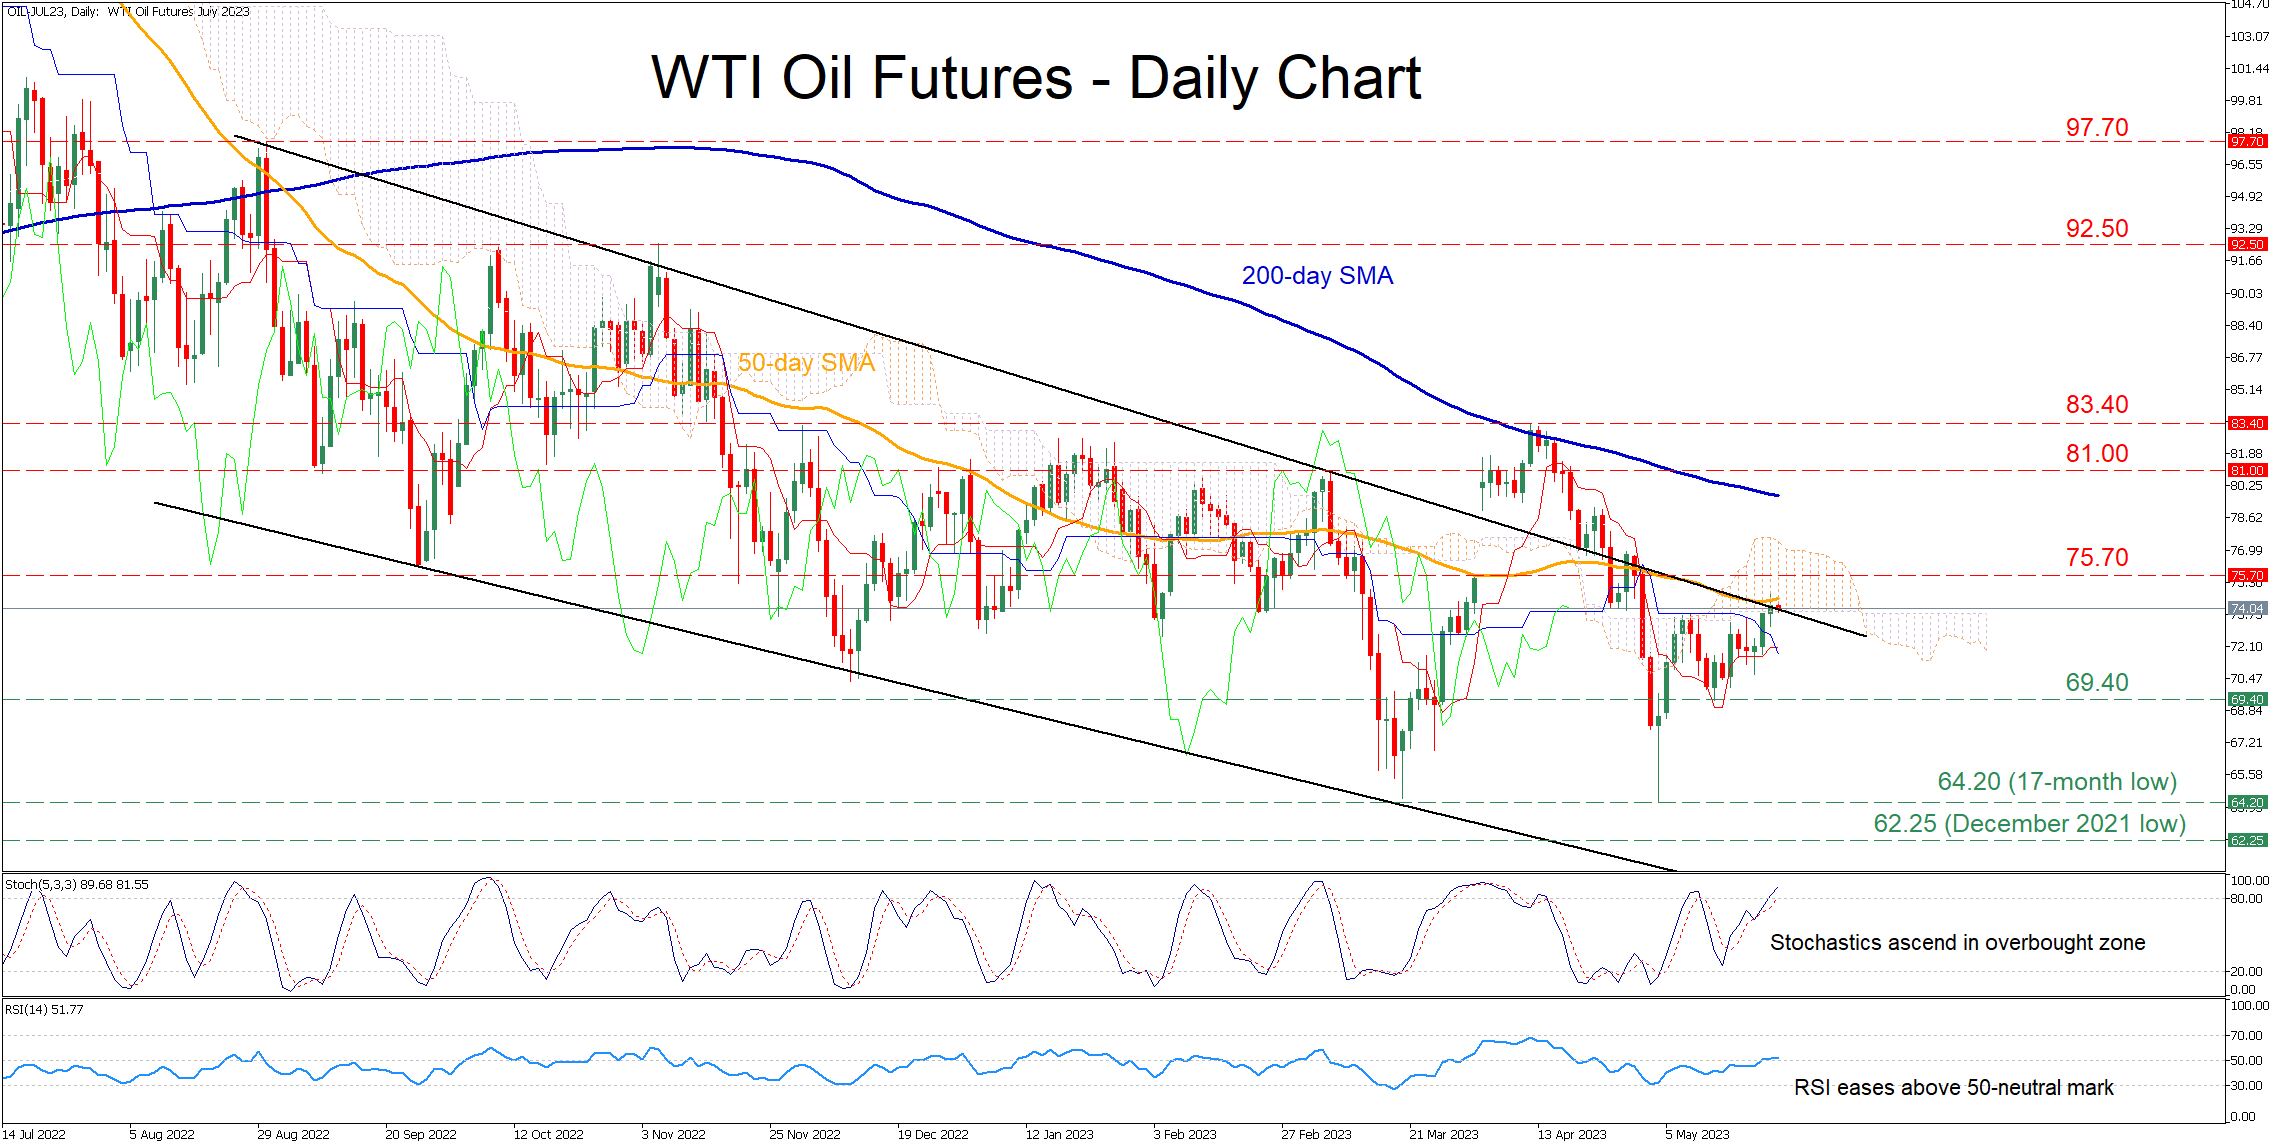
WTI oil futures (July delivery) have been steadily gaining ground after bouncing off 69.40 in mid-March. However, the uptrend seems to have paused at the congested region that includes the 50-day simple moving average (SMA), the upper boundary of the descending channel and the lower end of the Ichimoku cloud.
The momentum indicators currently suggest that bullish forces are intensifying. Specifically, the stochastic oscillator is ascending in the overbought zone, while the RSI jumped above its 50-neutral mark.
Should the price manage to surpass the fortified area, immediate resistance could be met at the 75.70 hurdle. Jumping above that zone, WTI futures may ascend towards the March high of 81.00 or higher to test the 2023 peak of 83.40. Further advances could then cease at the November 2022 high of 92.50.
On the flipside, if the bulls fail to conquer the crucial technical region, the price could reverse towards the recent support of 69.40. A break below that floor could open the door for the double-bottom of 64.20, which is also a 17-month low. Even lower, the price could descend towards levels not seen in the past few months, where the December 2021 bottom of 62.25 could provide downside protection.
In brief, WTI oil futures appear to be in recovery mode after the formation of a bullish double-bottom pattern. For the uptrend to extend, the price needs to pierce through the fortified region that is currently under attack.
JP225 Index Bulls Want Another All-Time High But Bearish Pressure Mounts
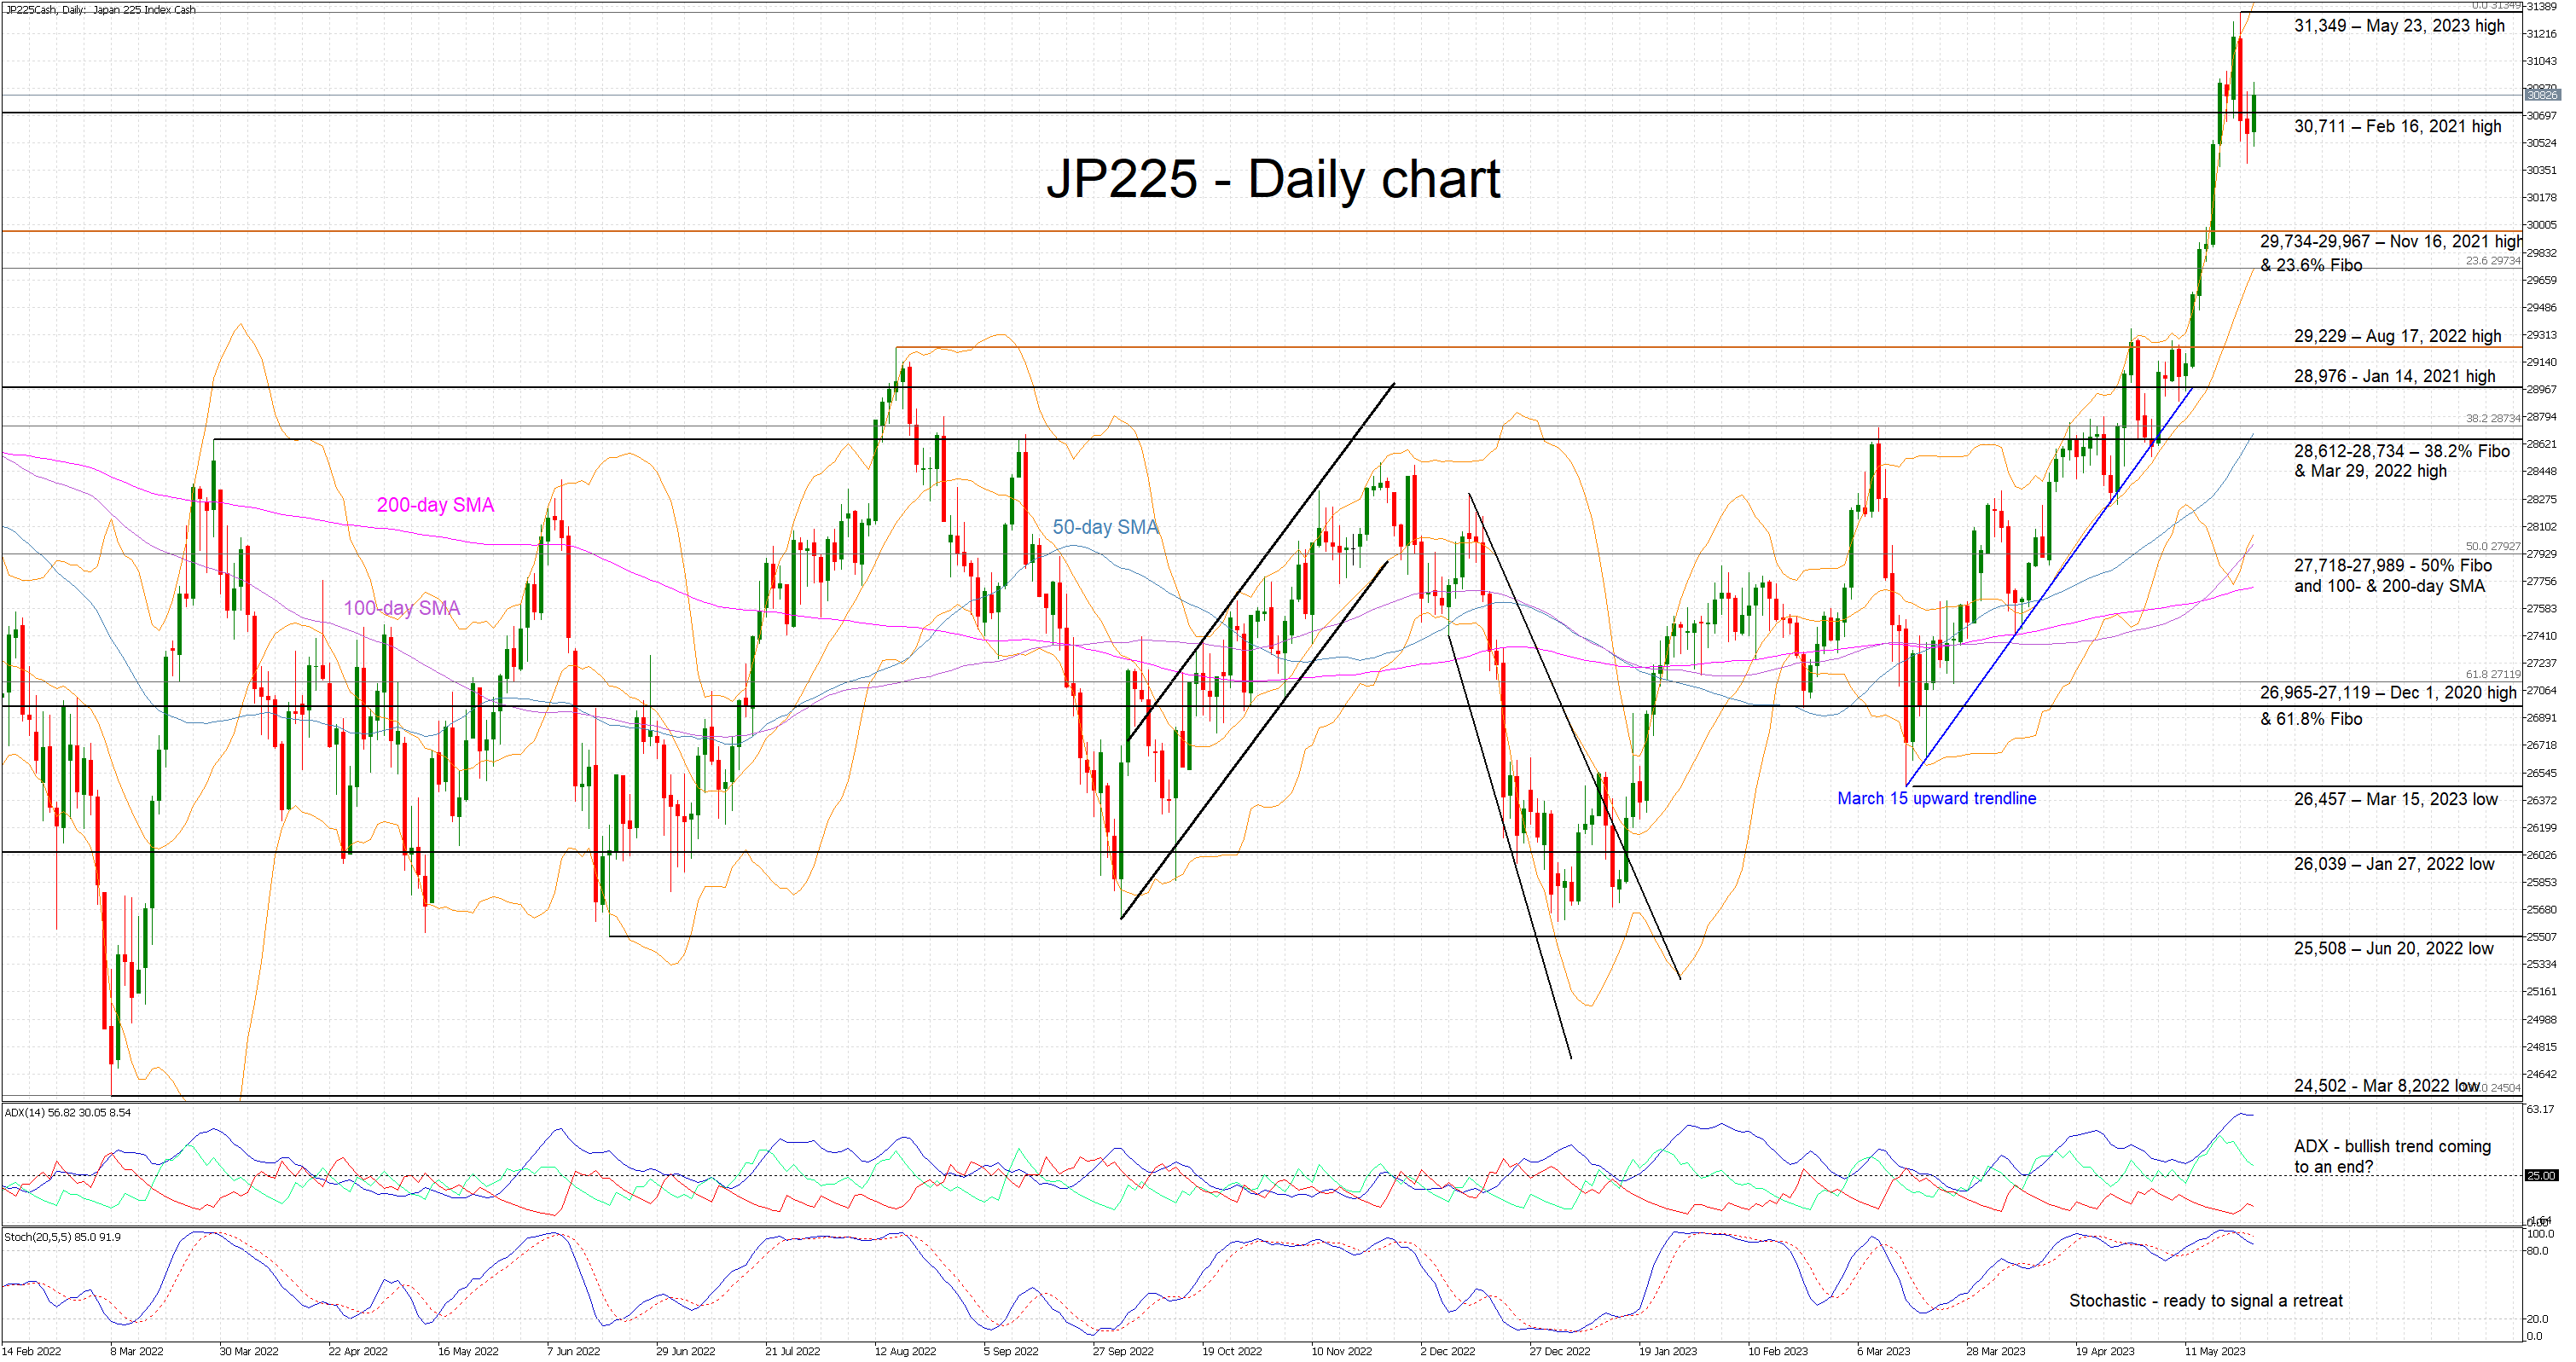
The JP225 cash index is edging higher today, as the bulls are trying to recapture the 30,711 level and keep up the pressure. A short-term consolidation at the current levels could be beneficial for both sides following the steep increase since May 11.
The bears though might be able to finally crack a smile when examining the momentum indicators. The Average Directional Movement Index (ADX) appears to have topped, signaling that the bullish trend in place since the March 15, 2023 low might be over. Similarly, the stochastic oscillator has moved below its moving average and is ready to exit its overbought territory. That would potentially be a strong bearish message.
If the bearish pressure increases, the bears would quickly like to break the 30,711 level and target the busier 29,733-29,967 area that is defined by the 23.6% Fibonacci retracement level of the March 8, 2022 – May 23, 2023 uptrend and the November 16, 2021 high. Even lower, the August 17, 2022 and January 14, 2021 highs at 29,229 and 28,976 respectively should prove tougher to overcome.
If the bulls decide to ignore the mixed technical signs, they will most likely have to keep the JP225 index above the 30,711 level. The next step would be to retest the May 23, 2023 high at 31,349 and aim to record another all-time high.
To conclude, JP225 index bulls are keen on recording a higher high, but the overall technical picture is ready to turn overwhelmingly against them. The bears appear ready to capitalize on these signals, but a decisive move lower is needed to reverse the medium-term bullish trend.
Yuan Weakness Spooks China and Asia Ex-Japan Stock Markets
- USD/CNH (offshore yuan) has surged to a 6-month high of 7.08.
- Since late Oct 2022, the movement of USD/CNH has had a high degree of correlation with China and Asia ex-Japan equities.
- Positive momentum factor remains intact for USD/CNH which may add further potential headwinds for China and Asia ex-Japan equities.
The earlier “China re-opening theme play” gains of +20% to +56% that were seen in the China benchmark stock indices and its proxies (such as CSI 300 & Hang Seng China Enterprises Index) from late October 2022 have almost been reduced by 50% till to date. In addition, the CSI 300 and HSCEI 2023 year-to-date returns as of 25 May have slipped to negative territory with losses of -0.8% and -5.6% at this time of the writing; the worst performers among the major developed countries’ benchmark stock indices.
The key reasons for such weakness have been lackluster leading economic data out from China and the “inaction” of PBoC to implement more accommodative monetary policies. More details were highlighted in our previous analysis, “China equities bulls in need of fresh liquidity”, click here to read.
A weakening yuan is adding another layer of headwinds for China equities & rest of Asia ex Japan
The fate of the other Asia Pacific (excluding Japan) stock indices is directly intertwined with the performance of the China stock market since late last year due to the positive feedback loop from the “China re-opening theme play” narrative that will eventually lead to an increase in exports trading volume and tourism activities.
But once this feedback loop turns negative, it tends to have an opposition adverse effect on the Asia Pacific benchmark stock indices where the MSCI All Country Asia ex Japan Index saw its initial 2023 year-to-date gain of +13% dwindled to +0.40%.
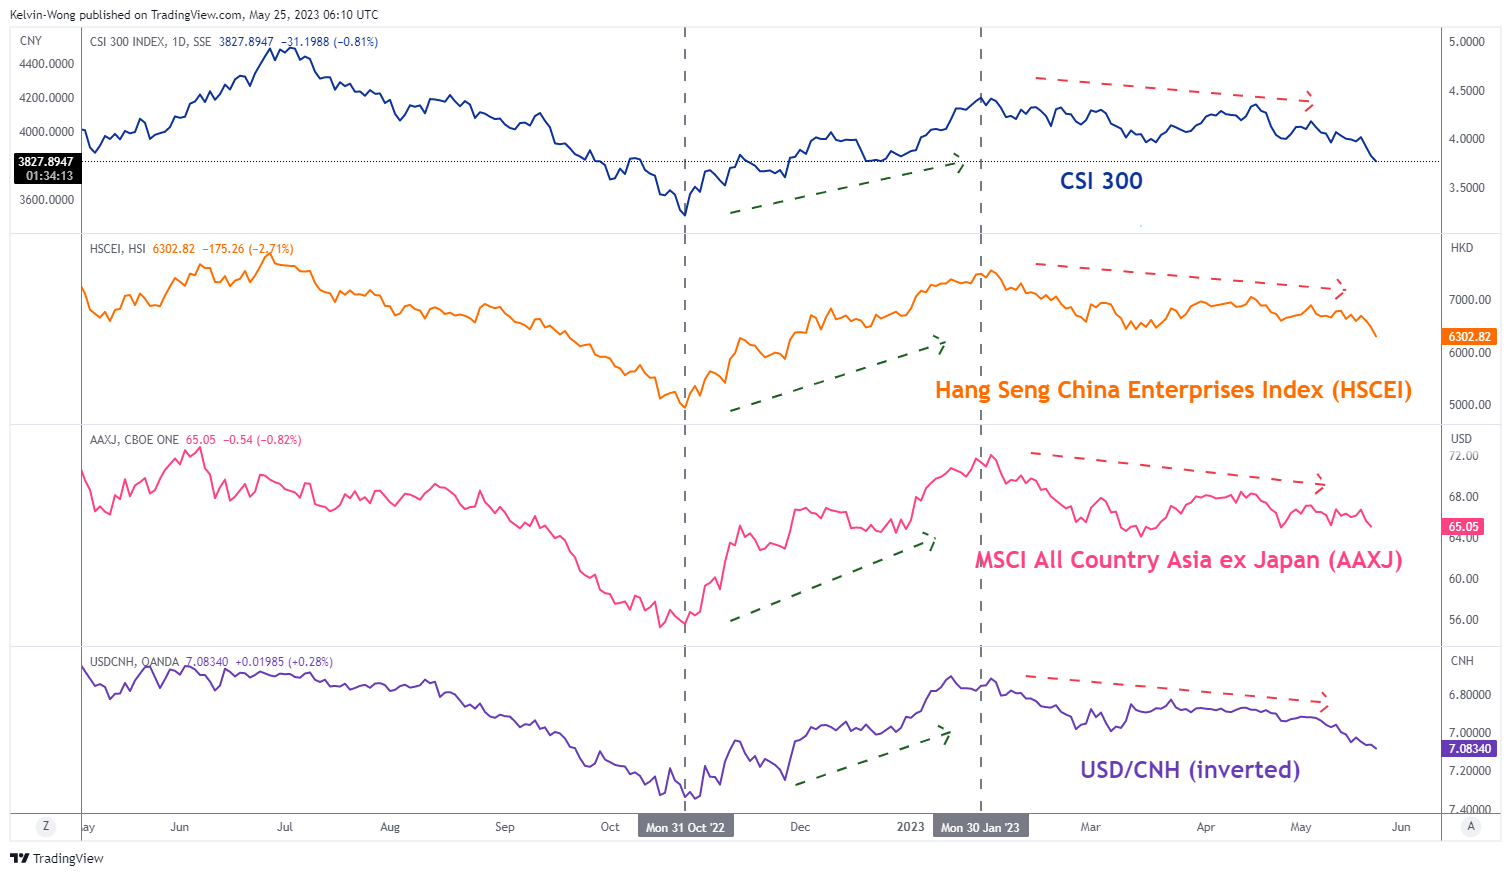
Fig 1: Correlation between CSI 300, HSCEI, MSCI All Country Asia ex Japan & USD/CNH as of 25 May 2023
(Source: TradingView, click to enlarge chart)
One of the other drivers of the weak underperformance of the China stock market and its proxies has been the speed of the downside momentum of the Chinese currency, the yuan against the US dollar (yuan weakness) where the offshore USD/CNH has staged a rally of 2.4% in the recent three weeks to hit close to a 6-month high of 7.08.
People’s Bank of China (PBoC) seems to be tolerant of the current bout of yuan weakness
Also, the Chinese central bank, PBoC seems to be comfortable with the current bout of yuan weakness as indicated by its current mode of operation.
Despite a statement issued by PBoC last Friday, 19 May that stated the Chinese central bank together with the foreign exchange regular will “strengthen market expectation guidance and take actions to correct pro-cyclical and one-way market behaviours when necessary”.
A hint that has suggested PBoC “does not desire one-way speculative bearish bets on the yuan” but the daily fixing on the onshore yuan (USD/CNY) reference rate as seen in the recent two weeks stated otherwise, it has been in line with market forces; gradually moving up above the 7.00 psychological level and in the last five days hovered between 7.0157 to 7.0560.
Hence, the current actions of PBoC seem to be allowing more leeway for the yuan to move in line with broad-based US dollar strength seen at this juncture.
USD/CNH Technical Analysis – Holding above 50-day moving average with upside momentum intact
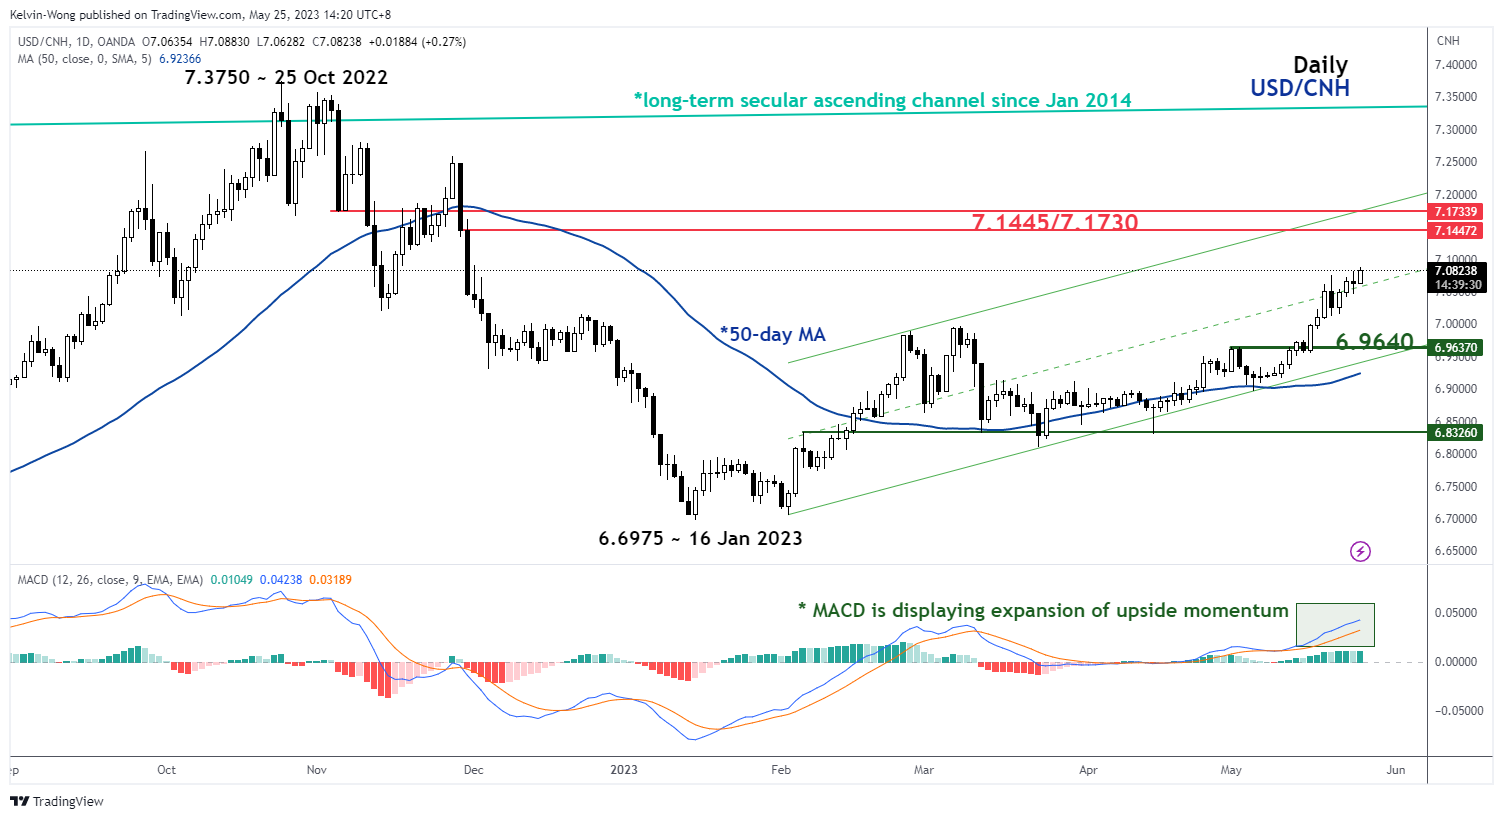
Fig 2: USD/CNH trend as of 25 May 2023 (Source: TradingView, click to enlarge chart)
The downside momentum of the yuan may continue to persist where a further rally in the offshore USD/CNH cannot be ruled out in the coming weeks with the next key medium-term resistance zone coming in at 7.1445/7.1730 (see chart above). Thus, if such a base case scenario unfolds, we cannot rule out further potential weakness at least in the near term for China and Asia ex-Japan equities.
EUR/USD Daily Outlook
Daily Pivots: (S1) 1.0731; (P) 1.0766; (R1) 1.0784; More...
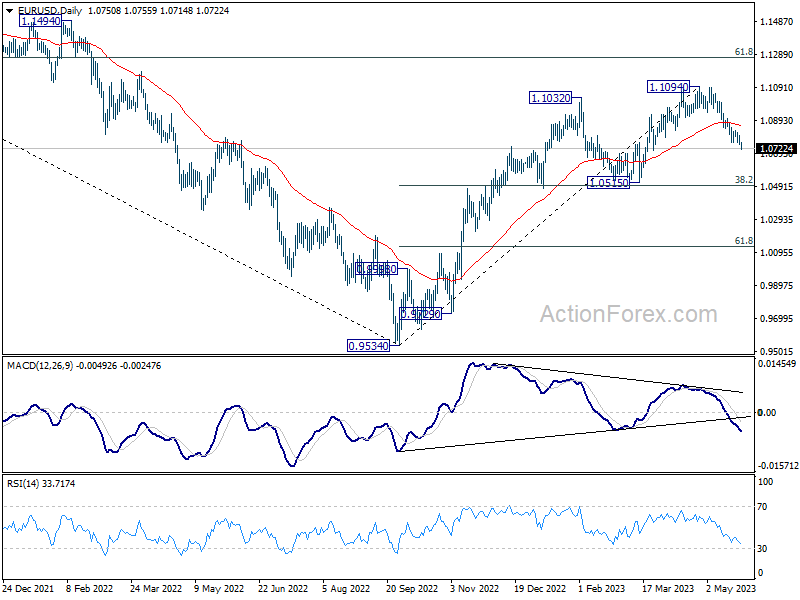
Intraday bias in EUR/USD is back on the downside as fall from 1.1094 resumes by breaking 1.0759. Current fall is seen as correcting whole up trend from 0.9534. Deeper decline should be seen to 1.0515 cluster support, 38.2% retracement of 0.9534 to 1.1094 at 1.0498. On the upside, above 1.0830 minor resistance will turn intraday bias neutral first.
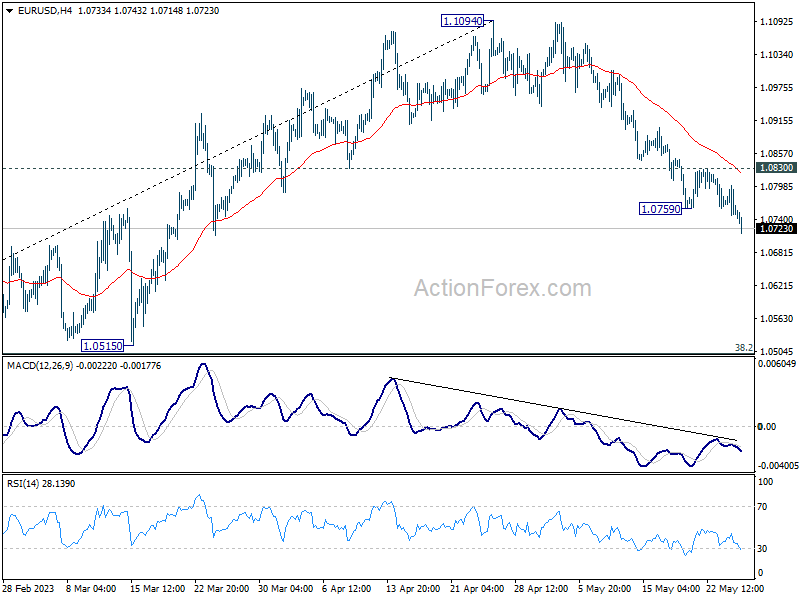
In the bigger picture, as long as 1.0515 support holds, rise from 0.9534 (2022 low) would still extend higher. Sustained break of 61.8% retracement of 1.2348 (2021 high) to 0.9534 at 1.1273 will solidify the case of bullish trend reversal and target 1.2348 resistance next (2021 high).
GBP/USD Daily Outlook
Daily Pivots: (S1) 1.2325; (P) 1.2398; (R1) 1.2437; More...
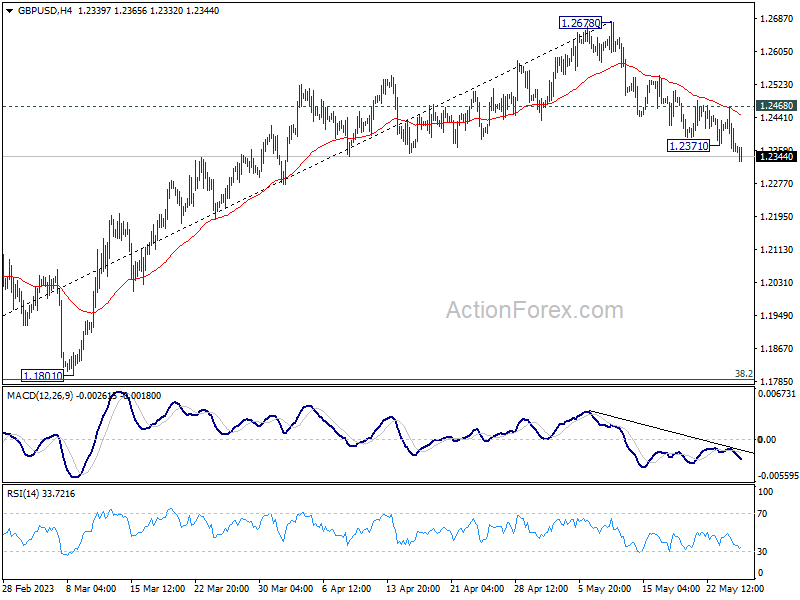
GBP/USD's fall from 1.2678 resumed by breaking through 1.2371 and intraday bias is back on the downside. Current decline is seen as correcting whole up trend from 1.0351. Deeper fall should be seen to 1.1801 cluster support (38.2% retracement of 1.0351 to 1.2678 at 1.1789). On the upside, above 1.2468 minor resistance will turn intraday bias neutral first.
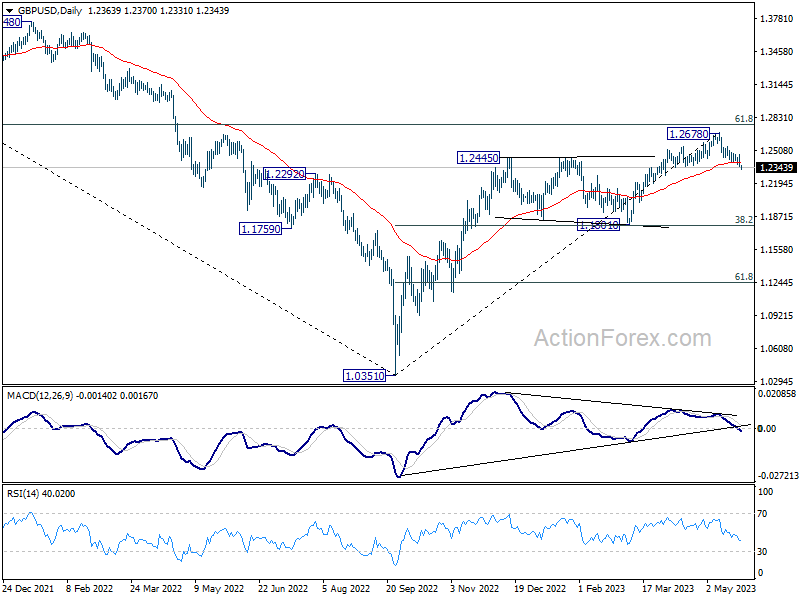
In the bigger picture, as long as 1.1801 support holds, rise from 1.0351 medium term bottom (2022 low) is expected to extend further. Sustained break of 61.8% retracement of 1.4248 (2021 high) to 1.0351 at 1.2759 will add to the case of long term bullish trend reversal. However, firm break of 1.1801 will indicate rejection by 1.2759, and bring deeper decline, even as a correction.
USD/CHF Daily Outlook
Daily Pivots: (S1) 0.9016; (P) 0.9041; (R1) 0.9078; More...
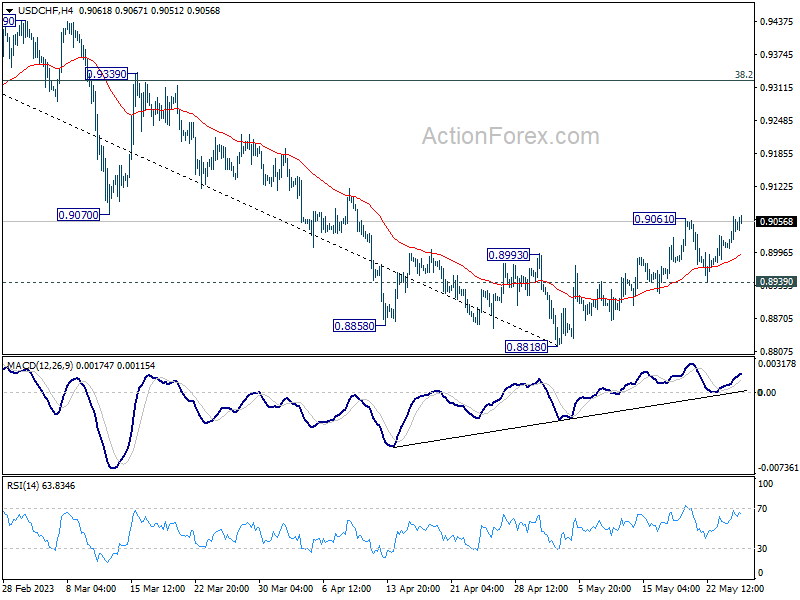
USD/CHF's rebound from 0.8818 short term bottom resumes by breaching 0.9061 and intraday bias is back on the upside. Sustained trading above 55 D EMA (now at 0.9039) should confirm that current rally is at least correcting whole down trend from 1.0146. Further rise should then be seen to 38.2% retracement of 1.0146 to 0.8818 at 0.9325. On the downside, though, break of 0.8939 will bring retest of 0.8818 low instead.
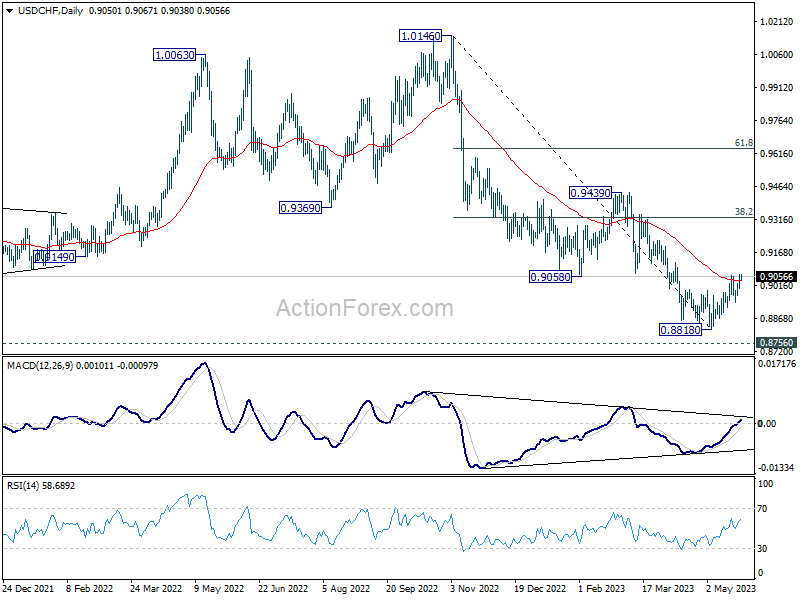
In the bigger picture, fall from 1.1046 (2022 high) is seen as a leg in the long term range pattern from 1.0342 (2016 high). So, downside should be contained by 0.8756 to bring reversal. Sustained break of 0.9058 support turned resistance will be the first sign of medium term bottoming. However, decisive break of 0.8756 will carry larger bearish implications.
USD/JPY Daily Outlook
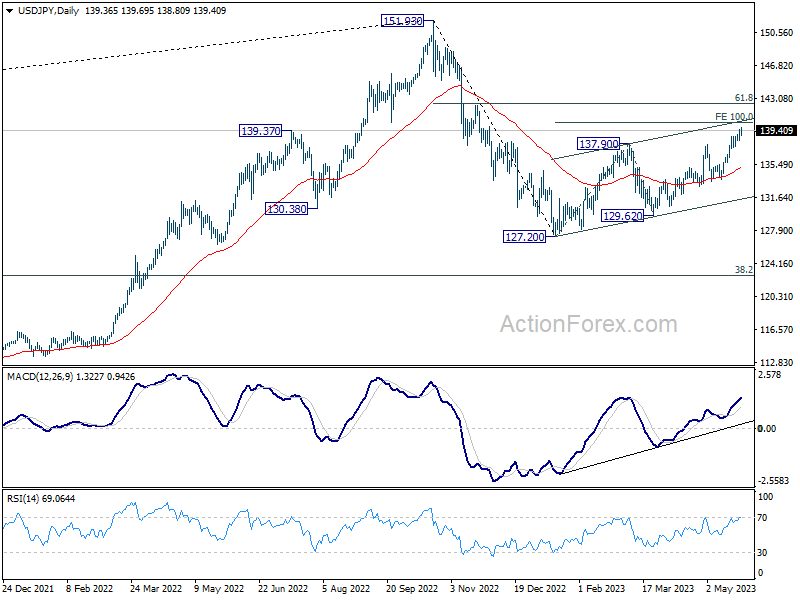
Daily Pivots: (S1) 138.65; (P) 139.06; (R1) 139.88; More...
USD/JPY's rally continues today and intraday bias stays on the upside. Further rise is still expected to 100% projection of 127.20 to 137.90 from 129.62 at 140.32. Break there will target 142.48 fibonacci level. On the downside, break of 138.22 minor support will turn intraday bias neutral and bring some consolidations first.
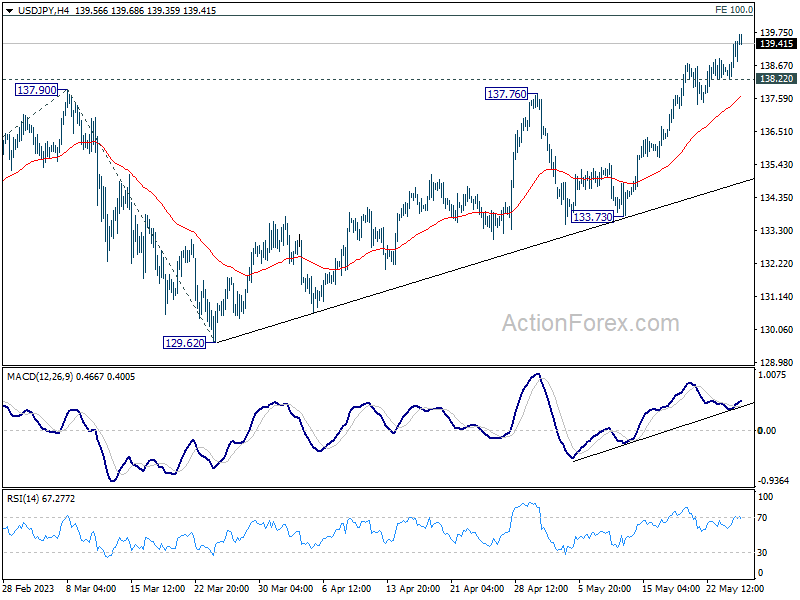
In the bigger picture, rise from 127.20 is seen as the second leg of the corrective pattern from 151.93 high. Stronger rally would be seen to 61.8% retracement of 151.93 to 127.20 at 136.34. Sustained break there will pave the way back to retest 151.93. On the downside, however, break of 133.73 support will argue that the pattern could have started the third leg through 127.20 low.