

Sample Category Title
Debt Ceiling Deal Awaits ‘At the End of the Day’
Market movers today
Today we have a lot of data from the US. April PCE inflation is released along personal spending. The final University of Michigan survey is also released.
In the Nordics we have retail sales out of Sweden and Norway. We expect a 1.5% mom increase in the latter. See more below.
The 60 second overview
Japan: Tokyo CPI inflation declined more than anticipated in May to 3.2% y/y from 3.5% y/y in April. Consensus had expected inflation to fall only to 3.4% y/y. New Bank of Japan Governor Ueda yesterday gave his first little hawkish hint, when he indicated the central bank would have to respond if inflation did not fall later this year. JPY rallied temporarily on the headline.
US: Hopes of a deal to solve the debt ceiling rose yesterday, when Republican House Speaker McCarthy said a deal would get done at the end of day. It looks like negotiators are zeroing on a deal that would raise the debt limit and cap federal spending for a period of two years. The market reacted promptly with the gold price taking a nose dive.
Fed: Boston Fed's Collins yesterday said that the Fed may be at or near the point where it can pause on rate hikes and further stressed a pause would allow it to assess its actions so far. Collins favours a meeting-by-meeting approach. The market discounts another 25bp rate hike by the July meeting.
Equities: Equities were mixed on Thursday, with tech-intense indices like Nasdaq and S&P 500 up 1-2% while Dow and Russell 2000 were lower. This selective performance did not come down to yields but by earnings. Given the huge multiple expansion YTD in the tech sector it is healthy to see earnings deliverance leading the way higher. Chip maker Nvidia issued its sales guidance 50% ahead of expectations for the coming quarter, driven by the AI segment. Overall though, earnings were better and as the semi-cycle correlates well with the inventory cycle, this gives further support that the worst of the inventory destocking is behind us, with positive spill-over to many cyclical sectors. Naturally, tech beat the tape, but also cars/trucks, industrials, banks and real estate performed well while defensives reversed some of the outperformance this week. Futures are a tad lower this morning.
FI: US T-bill rates are slowly declining as the possibility of a deal on the debt ceiling seems to be getting closer. Some of the T-bills maturing in August have been trading around 7%, but are slowly decreasing. On the other hand, we are seeing 2Y yields rise as the market is looking for more hikes from the Federal Reserve combined with a solution to the debt ceiling issue. Hence, 2Y Treasury yields has risen some 20bp since Monday.
FX: SEK and NZD have been this week's underperformers within G10. Safe haven USD and CHF, but not low-yielding JPY, are winners in the current environment. EUR/SEK moves higher and higher and now breached 11.60. NOK is also not doing well, though NOK/SEK has erased some of the losses during the week.
Credit: Yesterday the credit markets regained its footing with iTraxx Main tightening 1.5bp to 83.1bp and Xover tightened 7bp to 437.5bp. We suspect that the spread tightening was driven by equal doses of lower primary printing and renewed hopes of an undramatic solution to the US debt ceiling worries.
Nordic macro
Norway: Norwegian retail sales have been trending down for almost two years now, driven by a shift towards consumption of services and the decline in households' purchasing power. Based on the monthly numbers from BankAxept, it looks like this trend will have continued in April, with retail sales falling 1.5% m/m.
Sweden: Swedish retail sales are down 11.6% (y/y), marking the steepest yearly decline in the history of the series. As Swedish households continue to be under pressure, we expect today's number to corroborate that picture and signal a continued challenging outlook for Swedish retailers. The past year we have seen a sharp decline in Swedish producer prices, which in due time is expected to lead consumer prices lower as well. Hence, PPI data from April, released today, might warrant some interest from markets.
GBP/USD Daily Outlook
Daily Pivots: (S1) 1.2291; (P) 1.2339; (R1) 1.2370; More...
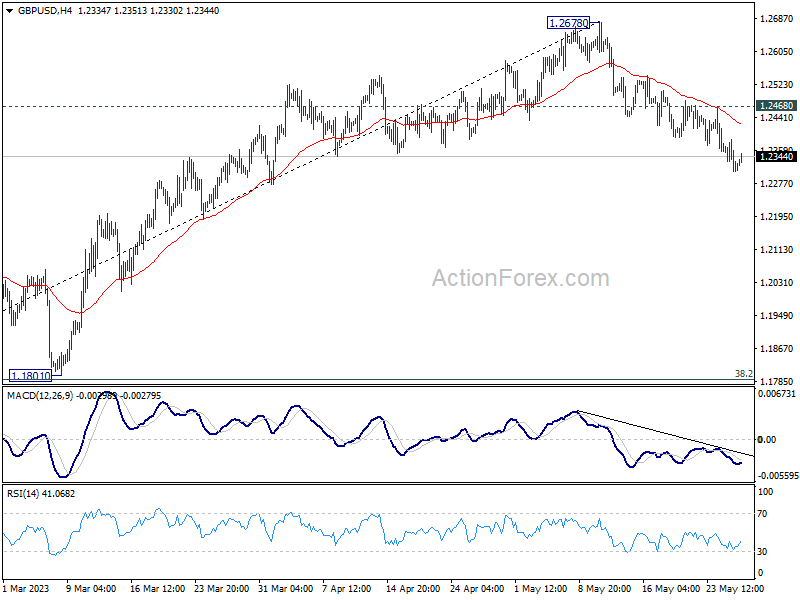
GBP/USD recovers mildly today but there is no clear sign of bottoming yet. Intraday bias stays on the downside for the moment. Current decline is seen as correcting whole up trend from 1.0351. Deeper fall should be seen to 1.1801 cluster support (38.2% retracement of 1.0351 to 1.2678 at 1.1789). On the upside, above 1.2468 minor resistance will turn intraday bias neutral first.
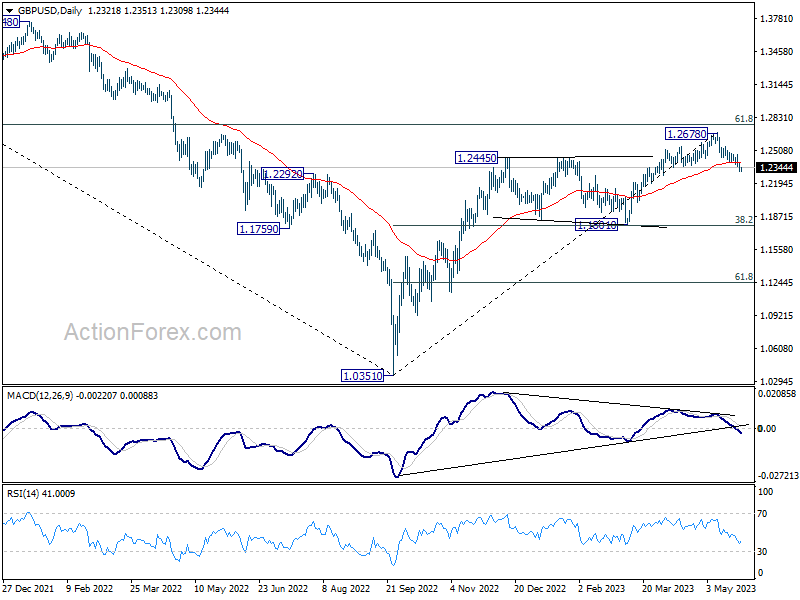
In the bigger picture, as long as 1.1801 support holds, rise from 1.0351 medium term bottom (2022 low) is expected to extend further. Sustained break of 61.8% retracement of 1.4248 (2021 high) to 1.0351 at 1.2759 will add to the case of long term bullish trend reversal. However, firm break of 1.1801 will indicate rejection by 1.2759, and bring deeper decline, even as a correction.
Dollar Retains Weekly Lead But Started Losing Momentum
Dollar has maintained its position as the strongest performer for the week, despite the noticeable waning of its upside momentum over the past two days. Today, markets anticipates the release of several US economic indicators, including PCE inflation and durable goods orders. However, the primary driver is likely to be any updates on the debt ceiling negotiations.
Reports suggest that a deal is in the works that would increase the debt limit to USD 31.4T for a two-year period. However, both the deal itself and the market's response to it are fraught with considerable uncertainty.
In other currency market developments, Sterling is attempting a bounce after encouraging retail sales data, but thus far, buyers seem to be demonstrating a lack of conviction. Meanwhile, the sell-off in Australian and New Zealand Dollars appears to be slowing down.
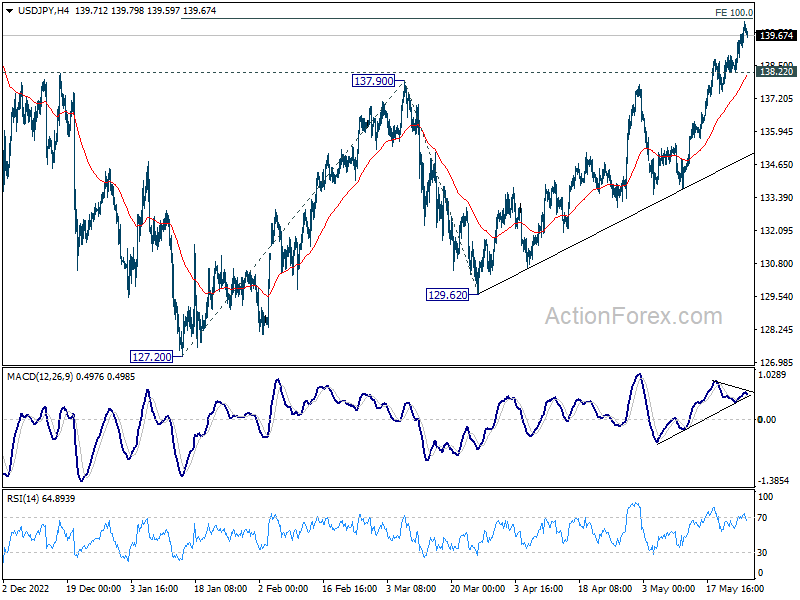
Technically, USD/JPY is worth a watch for the rest of the week and the early part of next. It's been losing some upside momentum as seen in 4H MACD. Also, it has almost met the target of 100% projection of 127.20 to 137.90 from 129.62 at 140.32. Rejection by 140.32, followed by break of 138.22 support could mark the completion of the three-wave corrective rise from 127.20. If realized, the could set a bearish tone for other Yen crosses for the near term.
UK retail sales volume up 0.5% mom in Apr, value up 1.1% mom
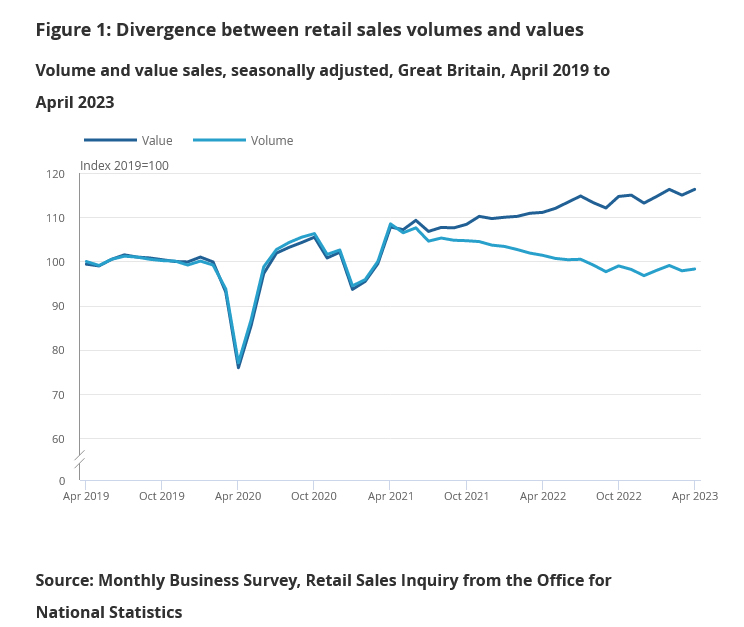
UK retail sales volumes rose 0.5% mom in April, well above expectation of 0.0% mom. Excluding automotive fuel, sales volume rose 0.8% mom. Sales value rose 1.1% mom in the month, with ex-automotive fuel sales value up 1.7% mom.
In the three months to April, sales volumes rose 0.8% 3mo3m, the highest rates since August 2021, which was at 1.3% 3mo3m.
RBNZ Silk warns against premature rate cut expectations
RBNZ Assistant Governor Karen Silk advised caution against pricing in rate cuts too prematurely. In her comments, Silk stressed that RBNZ has reached a juncture where it can "take a pause and watch how this evolves," ensuring that "you don't overdo things."
However, Silk emphasized that it's core inflation that the central bank is focused on bringing down, and this will require maintaining the current rate levels for an extended period. "We've said we need to hold for an extended period of time to ensure core inflation comes down; it's core inflation that we need to get down," she stated.
She explained the bank's holistic approach to assessing economic conditions, saying, "We look at economic data, but we also look at transmission," Silk explained. "If at a wholesale level and most importantly at a retail level we start to see those things come off faster, then that's one of the things we take into account when we think about where we set the OCR."
In terms of the inflationary impact of Cyclone Gabrielle, Silk indicated that its effect has been less severe than initially anticipated. RBNZ had initially projected the storm would add 0.3% to inflation in both the first and second quarters. Still, it has since revised this down to just 0.1%, citing that while the storm led to increased food costs, it didn't inflate the prices of other goods such as used cars.
Australia retail sales flat in Apr, cost-of-living pressures and rising interest rates
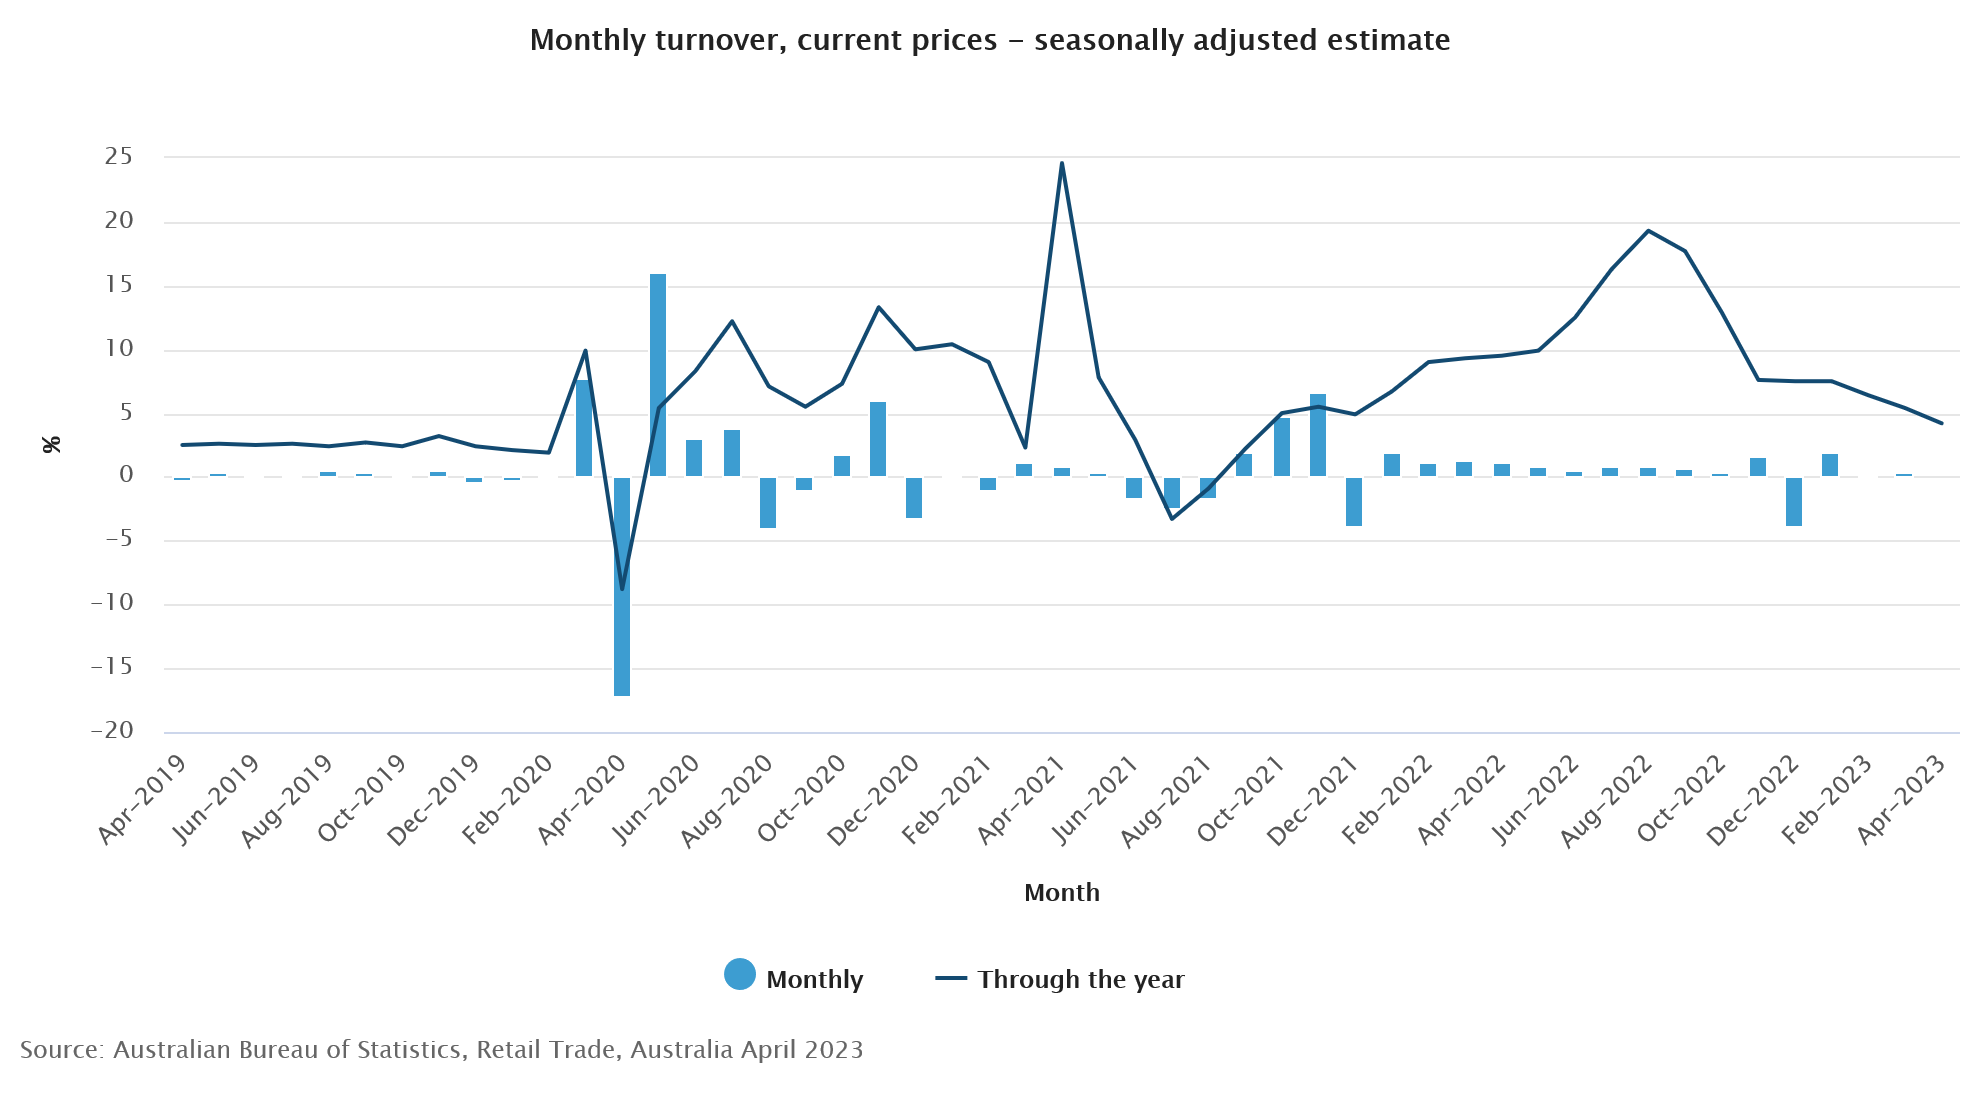
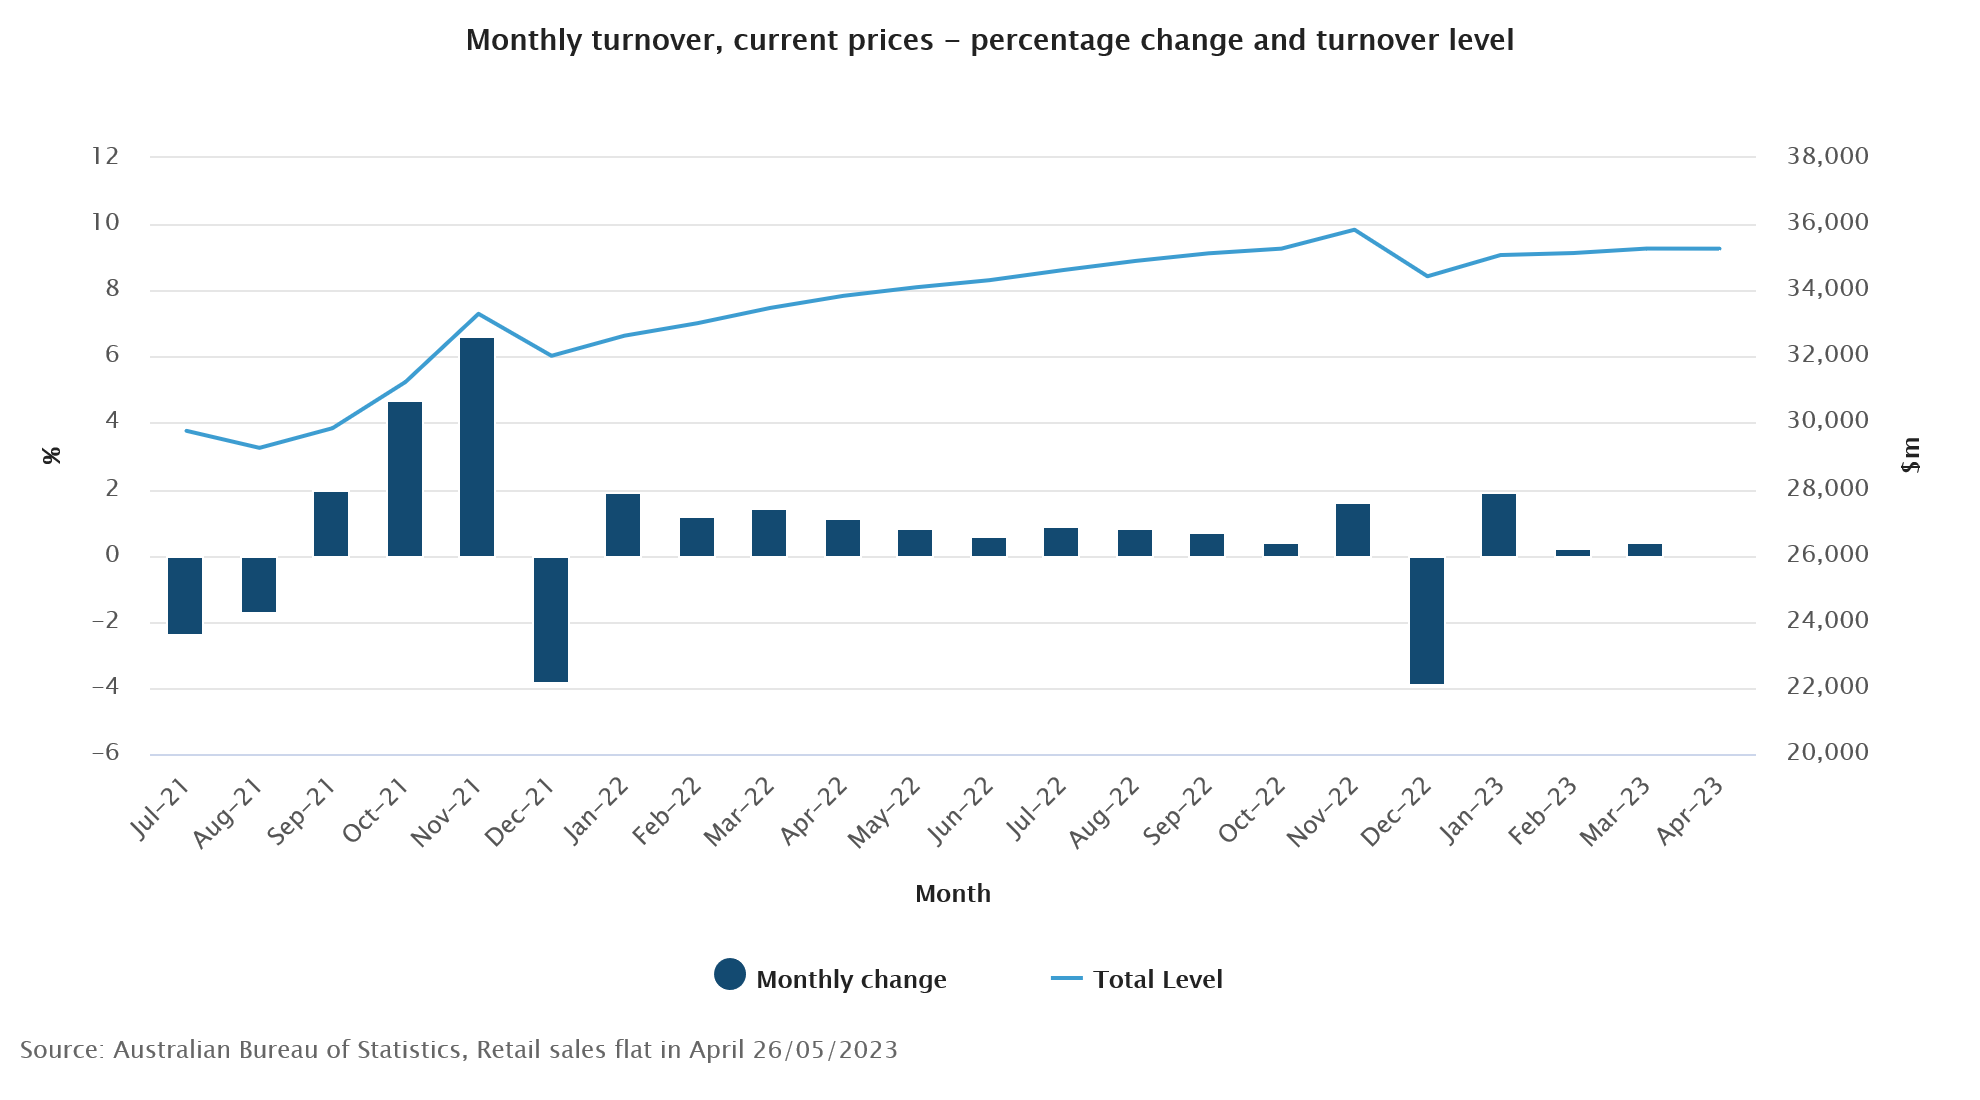
Australia retail sales turnover was flat at 0% mom in April, and up 4.2% yoy.
"Retail turnover has plateaued over the last six months as consumers spent less on discretionary goods in response to cost-of-living pressures and rising interest rates. Spending was again soft in April but was boosted by increased spending on winter clothing in response to cooler and wetter than average weather across the country," Ben Dorber, ABS head of retail statistics said.
GBP/USD Daily Outlook
Daily Pivots: (S1) 1.2291; (P) 1.2339; (R1) 1.2370; More...
GBP/USD recovers mildly today but there is no clear sign of bottoming yet. Intraday bias stays on the downside for the moment. Current decline is seen as correcting whole up trend from 1.0351. Deeper fall should be seen to 1.1801 cluster support (38.2% retracement of 1.0351 to 1.2678 at 1.1789). On the upside, above 1.2468 minor resistance will turn intraday bias neutral first.
In the bigger picture, as long as 1.1801 support holds, rise from 1.0351 medium term bottom (2022 low) is expected to extend further. Sustained break of 61.8% retracement of 1.4248 (2021 high) to 1.0351 at 1.2759 will add to the case of long term bullish trend reversal. However, firm break of 1.1801 will indicate rejection by 1.2759, and bring deeper decline, even as a correction.
Economic Indicators Update
| GMT | Ccy | Events | Actual | Forecast | Previous | Revised |
|---|---|---|---|---|---|---|
| 23:30 | JPY | Tokyo CPI Core Y/Y May | 3.20% | 3.40% | 3.50% | |
| 23:50 | JPY | Corporate Service Price Index Y/Y Apr | 1.60% | 1.40% | 1.60% | 1.70% |
| 01:30 | AUD | Retail Sales M/M Apr | 0.00% | 0.30% | 0.40% | |
| 06:00 | GBP | Retail Sales M/M Apr | 0.50% | 0.00% | -0.90% | |
| 12:30 | USD | Durable Goods Orders Apr | -0.90% | 3.20% | ||
| 12:30 | USD | Durable Goods Orders ex Transportation Apr | 0.00% | 0.20% | ||
| 12:30 | USD | Personal Income M/M Apr | 0.40% | 0.30% | ||
| 12:30 | USD | Personal Spending M/M Apr | 0.40% | 0.00% | ||
| 12:30 | USD | PCE Price Index M/M Apr | 0.40% | 0.10% | ||
| 12:30 | USD | PCE Price Index Y/Y Apr | 3.90% | 4.20% | ||
| 12:30 | USD | Core PCE Price Index M/M Apr | 0.40% | 0.30% | ||
| 12:30 | USD | Core PCE Price Index Y/Y Apr | 5.00% | 4.60% | ||
| 12:30 | USD | Goods Trade Balance (USD) Apr P | -85.6B | -84.6B | ||
| 12:30 | USD | Wholesale Inventories Apr P | 0.10% | 0.00% | ||
| 14:00 | USD | Michigan Consumer Sentiment Index May F | 58.2 | 57.7 |
UK retail sales volume up 0.5% mom in Apr, value up 1.1% mom
UK retail sales volumes rose 0.5% mom in April, well above expectation of 0.0% mom. Excluding automotive fuel, sales volume rose 0.8% mom. Sales value rose 1.1% mom in the month, with ex-automotive fuel sales value up 1.7% mom.
In the three months to April, sales volumes rose 0.8% 3mo3m, the highest rates since August 2021, which was at 1.3% 3mo3m.
Australia retail sales flat in Apr, cost-of-living pressures and rising interest rates
Australia retail sales turnover was flat at 0% mom in April, and up 4.2% yoy.
"Retail turnover has plateaued over the last six months as consumers spent less on discretionary goods in response to cost-of-living pressures and rising interest rates. Spending was again soft in April but was boosted by increased spending on winter clothing in response to cooler and wetter than average weather across the country," Ben Dorber, ABS head of retail statistics said.
RBNZ Silk warns against premature rate cut expectations
RBNZ Assistant Governor Karen Silk advised caution against pricing in rate cuts too prematurely. In her comments, Silk stressed that RBNZ has reached a juncture where it can "take a pause and watch how this evolves," ensuring that "you don't overdo things."
However, Silk emphasized that it's core inflation that the central bank is focused on bringing down, and this will require maintaining the current rate levels for an extended period. "We've said we need to hold for an extended period of time to ensure core inflation comes down; it's core inflation that we need to get down," she stated.
She explained the bank's holistic approach to assessing economic conditions, saying, "We look at economic data, but we also look at transmission," Silk explained. "If at a wholesale level and most importantly at a retail level we start to see those things come off faster, then that's one of the things we take into account when we think about where we set the OCR."
In terms of the inflationary impact of Cyclone Gabrielle, Silk indicated that its effect has been less severe than initially anticipated. RBNZ had initially projected the storm would add 0.3% to inflation in both the first and second quarters. Still, it has since revised this down to just 0.1%, citing that while the storm led to increased food costs, it didn't inflate the prices of other goods such as used cars.
Cliff Notes: Shifting Risks and Rhetoric
Key insights from the week that was.
Events and data have all been offshore this week, with Australia's single ABS release (April retail sales) due later today.
In New Zealand, at their May meeting, the RBNZ hiked the cash rate by 25bp to 5.50% as expected. However, their forward guidance surprised. Despite strong population growth at a time of limited capacity and expansionary fiscal policy, the RBNZ believe they have likely done enough to contain and reduce inflation, with their forward profile showing the cash rate at its peak. This is not to say policy will be eased anytime soon. Rate cuts are not expected until the second half of 2024.
Our New Zealand Economics team see upside risks to the RBNZ's views on growth and inflation, and so continue to believe further tightening will be required, with one more hike forecast for August to 5.75% and rate cuts to start no sooner than July 2024. Westpac NZ Chief Economist Kelly Eckhold provided an overview of the key issues before New Zealand and the RBNZ in this week’s video update.
In the US meanwhile, the FOMC May meeting minutes highlighted the scale of the uncertainty clouding the outlook. The Committee clearly remains cautious regarding inflation risks, but increasingly these are being balanced by downside risks to growth – the result of both policy's effect on the economy as well as the additional tightening in financial conditions associated with recent bank closures and deposit flight.
"Participants generally expressed uncertainty about how much more policy tightening may be appropriate" and "Several participants noted that if the economy evolved along the lines of their current outlooks, then further policy firming after this meeting may not be necessary" point to a conditional pause being the consensus view of the Committee. That said, rate cuts from December as we forecast will require a continued deceleration in inflation and labour market momentum. Principally due to shelter costs, the chief risk for inflation is that it sustains above-target momentum into 2024, even as activity deteriorates. This would put the FOMC in a difficult position.
As we go to press, fractious debate over the terms of a debt ceiling increase continue despite Treasury's extraordinary measures potentially being exhausted within a fortnight. We expect a deal to inevitably get done, and some headlines received today have been constructive on this point. But we will have to wait to see whether an agreement materialises and, critically, how far out it pushes the next debt ceiling conflict.
Finally to the data received this week. For the US, the tone has remain mixed, with the S&P Global manufacturing PMI disappointing with a contractionary reading of 48.5 while the services measure beat with a robust 55.1. New and pending home sales meanwhile both disappointed in April net of revisions to March; while the second estimate of Q1 GDP carried next-to-no significance, the annualised estimate edged up from 1.1% to 1.3%.
Other global PMI results were similarly mixed across Europe, the UK and Japan, with manufacturing stagnant (Japan) or contractionary (Europe and the UK) but services experiencing healthy growth. For the UK, the key release for the week was the April CPI report which again shocked to the upside, headline inflation rising 1.2%/ 8.7%yr against 0.7%/8.2%yr expectations. Of even greater concern, the annual rate for core inflation lifted from 6.2%yr to 6.8%yr against expectations for an unchanged result.
In recent communications, the Bank of England have sought to look through the current strength in inflation, believing it will prove fleeting given underlying price dynamics and the steps already taken with policy. This outcome is sure to test their resolve. The market now has 100bps of additional hikes priced for UK Bank Rate by late-2023 compared to 50bps for the ECB and a December rate cut by the FOMC.
Technical Outlook and Review
DXY:
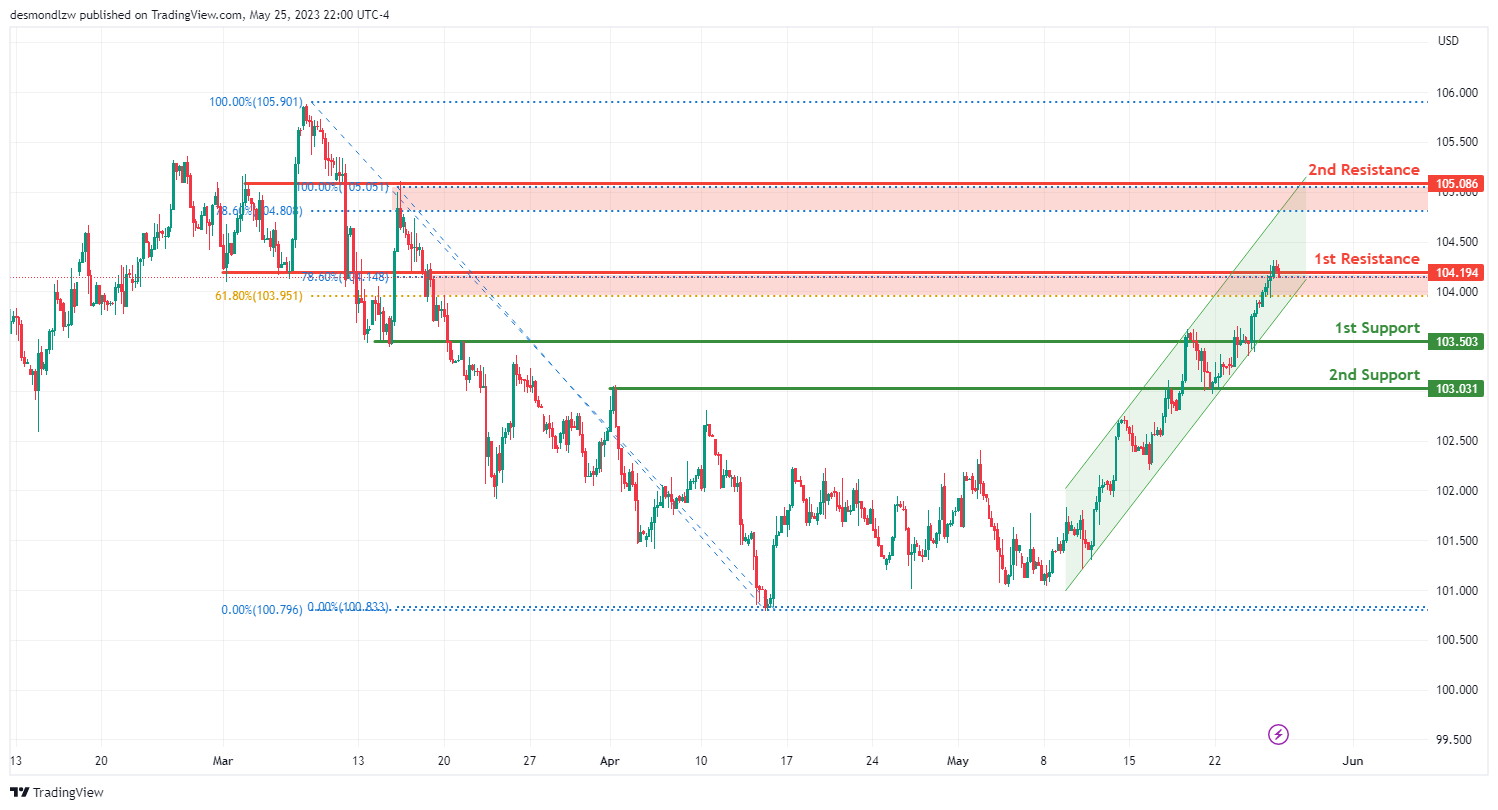
The DXY instrument is currently demonstrating a bullish momentum, primarily driven by the fact that the price is moving within a bullish ascending channel.
In the short term, there’s a possibility that the price could further descend towards the first support level at 103.50 before rebounding and climbing towards the first resistance. This first support level is known as a pullback support, which suggests it could halt any further downward movement.
An additional support level is at 103.03, serving as an overlap support, indicating its potential to prevent further declines in price.
On the other hand, should the price aim to continue its bullish trend, it could meet resistance at 104.19. This overlap resistance level, also at both the 61.80% and 78.60% Fibonacci retracement levels, could potentially obstruct upward price movements. This alignment is referred to as Fibonacci confluence.
A second resistance level is at 105.08. This pullback resistance, located at the 78.60% Fibonacci retracement level, might pose a challenge to any further increases in price.
EUR/USD:
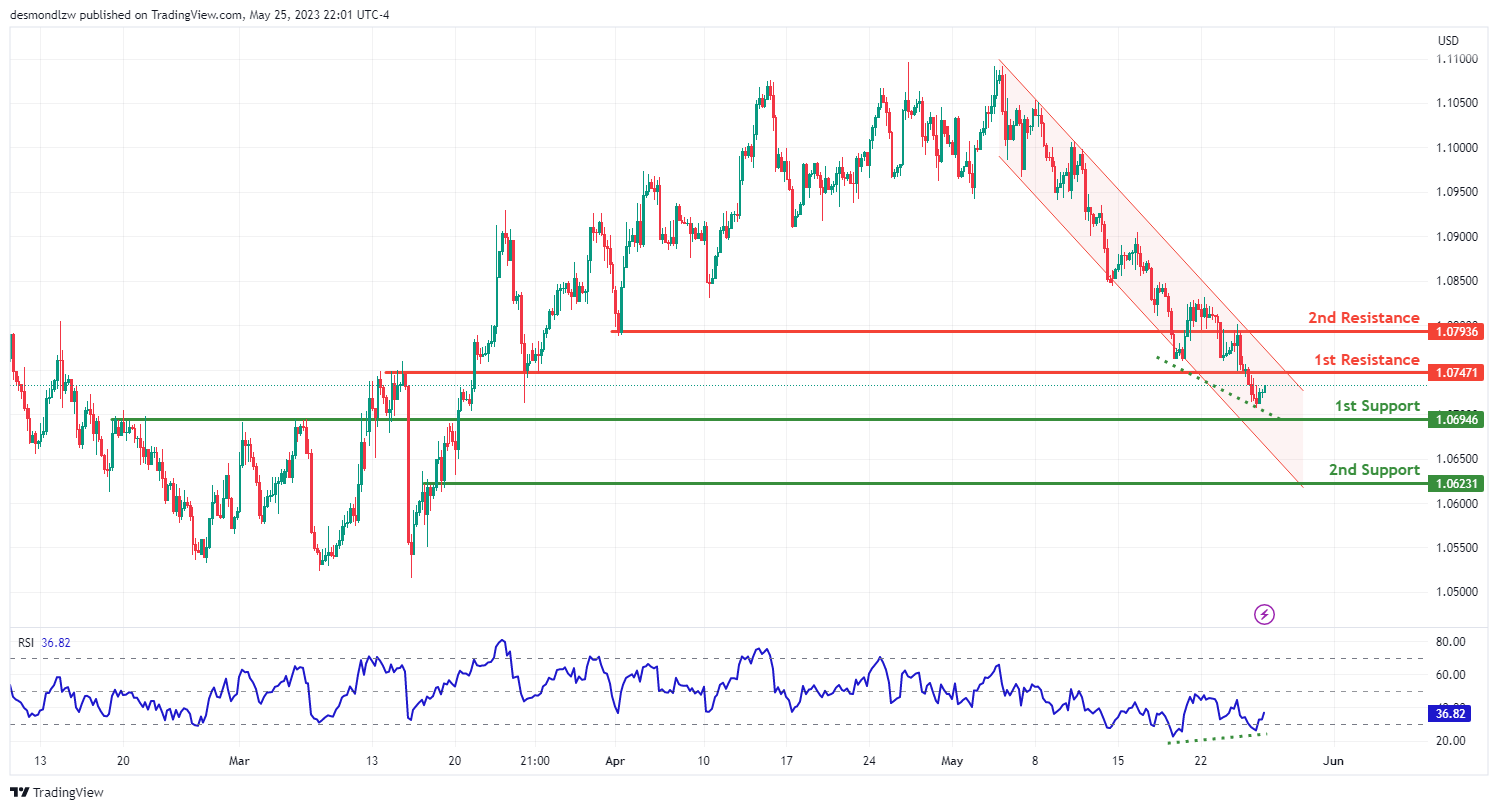
The EUR/USD chart is currently showing a bearish trend, predominantly due to the price being in a bearish descending channel.
In the short term, there’s a possibility for a bearish reaction at the first resistance level at 1.0747, leading to a decline towards the first support level at 1.0694. This resistance level is recognized as a pullback resistance, indicating its potential to hinder upward price movements.
An additional resistance level is located at 1.0793, known as an overlap resistance, which could also obstruct any further price increases.
On the other hand, if the price looks to descend, it may find support at 1.0694. This pullback support could potentially halt any further downward movement.
Another support level to be mindful of is at 1.0623. As an overlap support, this level could potentially stop any further price declines.
Despite the overall bearish momentum, the Relative Strength Index (RSI) is displaying bullish divergence compared to the price, suggesting a potential swift rise in price in the near future.
GBP/USD:
The GBP/USD chart is currently in a bearish trend, suggesting potential for continued downward movement.
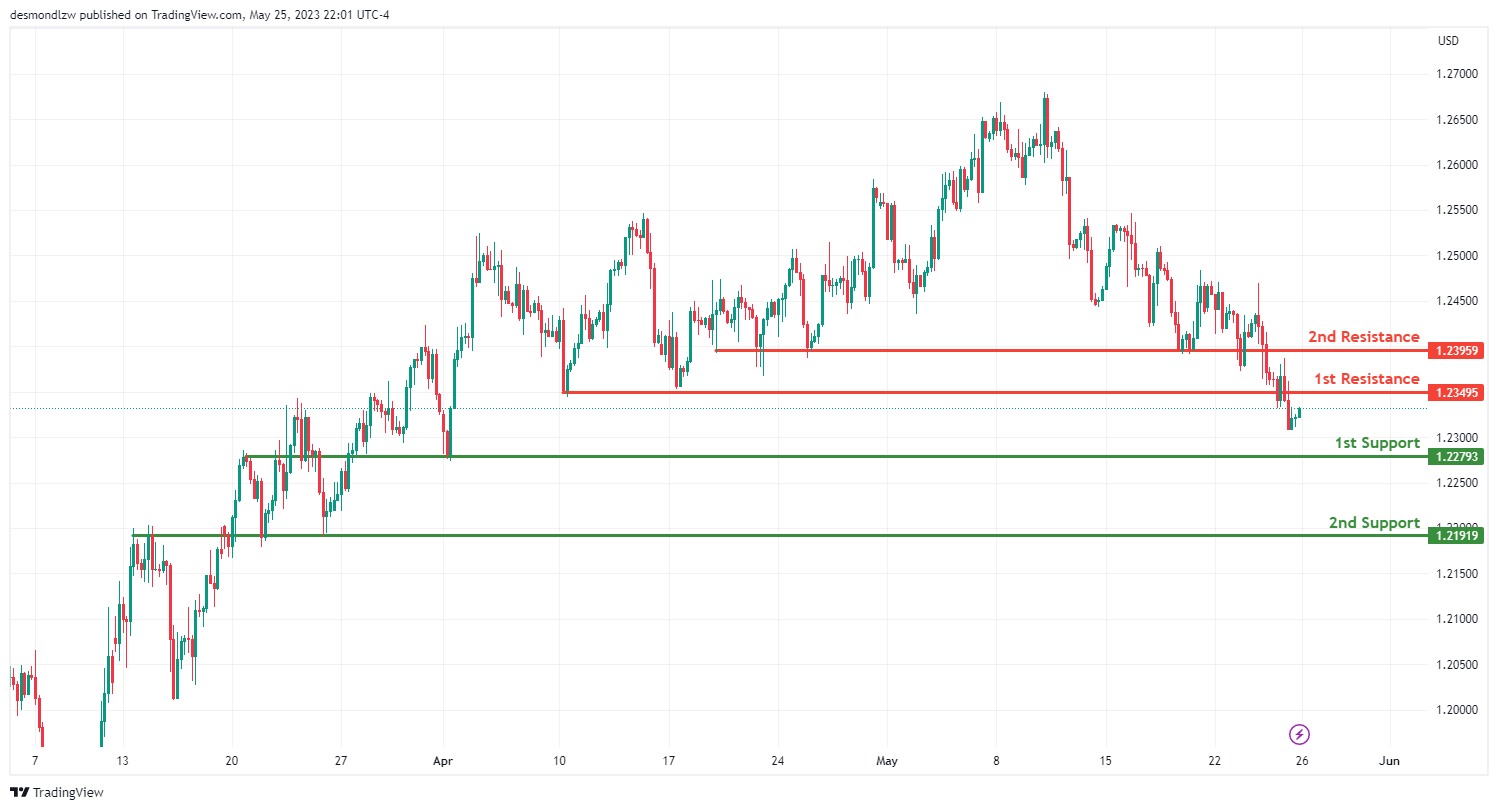
In the near term, we could see a bearish response at the first resistance level at 1.2349, leading to a decrease towards the first support level at 1.2279. This first resistance level, recognized as a pullback resistance, might pose a hurdle for further price increases.
Furthermore, there’s a second resistance level at 1.2395, identified as an overlap resistance. This level could act as another obstacle for any upward price movements.
On the flip side, the first support level at 1.2279, known as an overlap support, could potentially provide a strong foundation to prevent further price declines.
There’s also a second support level at 1.2191, which is another overlap support. This further reinforces its potential to halt any further decrease in price.
USD/CHF:
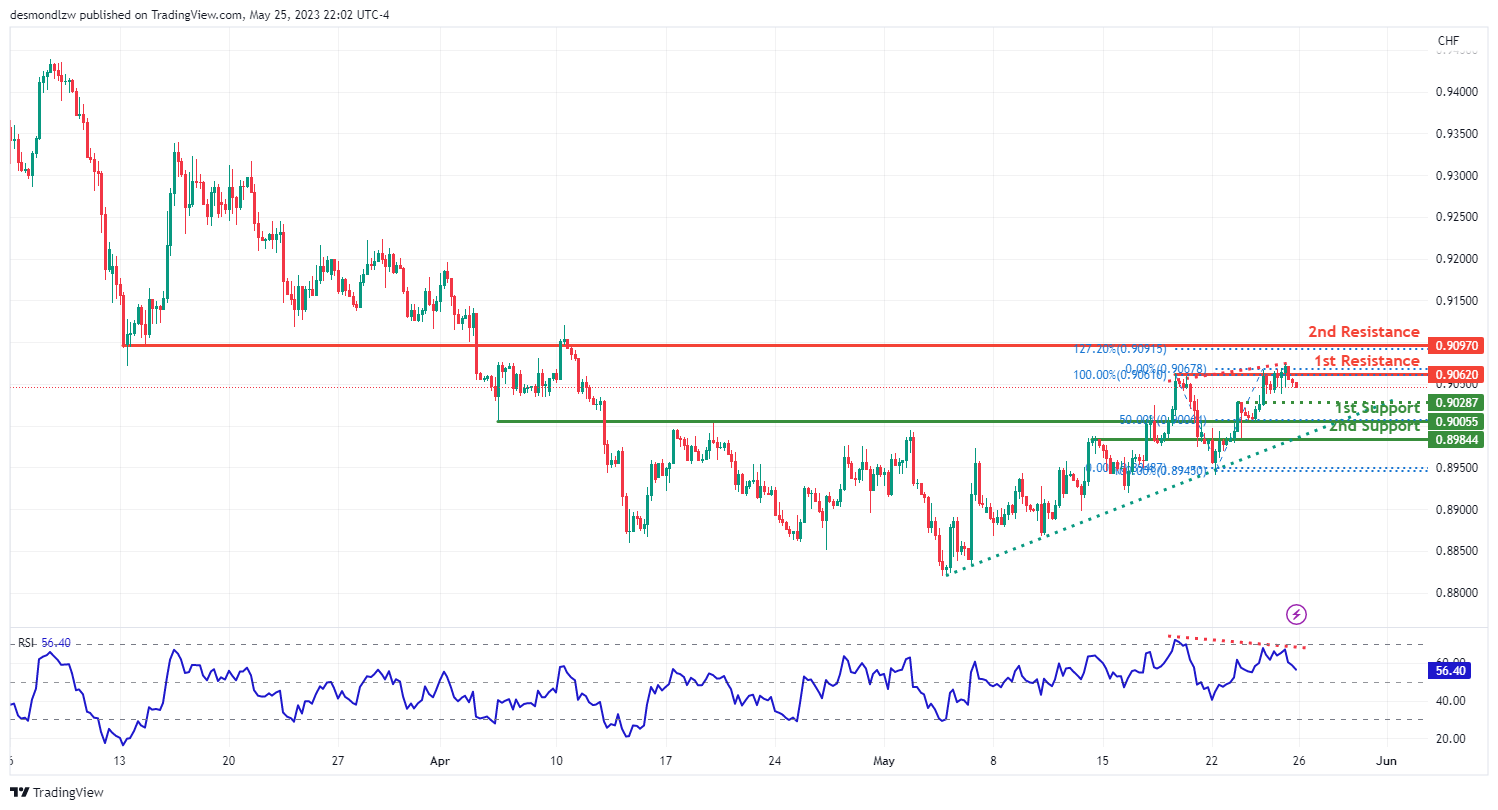
The USD/CHF trading instrument is currently displaying a bearish trend. However, the price is hovering above a significant ascending trend line, suggesting a possibility of further bullish momentum.
In the short term, the price might continue its downward trend towards the first support level at 0.9005 before potentially rebounding and escalating towards the first resistance level. This first support level, classified as an overlap support, also corresponds with the 50% Fibonacci retracement, indicating its potential to resist further price falls.
Another support level is positioned at 0.8984, also recognized as an overlap support, strengthening its capacity to halt further price decreases.
In the event of a price reversal, it might encounter resistance at 0.9062. This multi-swing high resistance could serve as a significant hurdle to price increases.
There’s also a second resistance level situated at 0.9097. This level, acknowledged as a pullback resistance, coincides with the 127.20% Fibonacci extension level, suggesting it could act as a considerable barrier to any further price surges.
Moreover, the Relative Strength Index (RSI) shows bearish divergence compared to the price, indicating the potential for a decline in price in the near future.
USD/JPY:
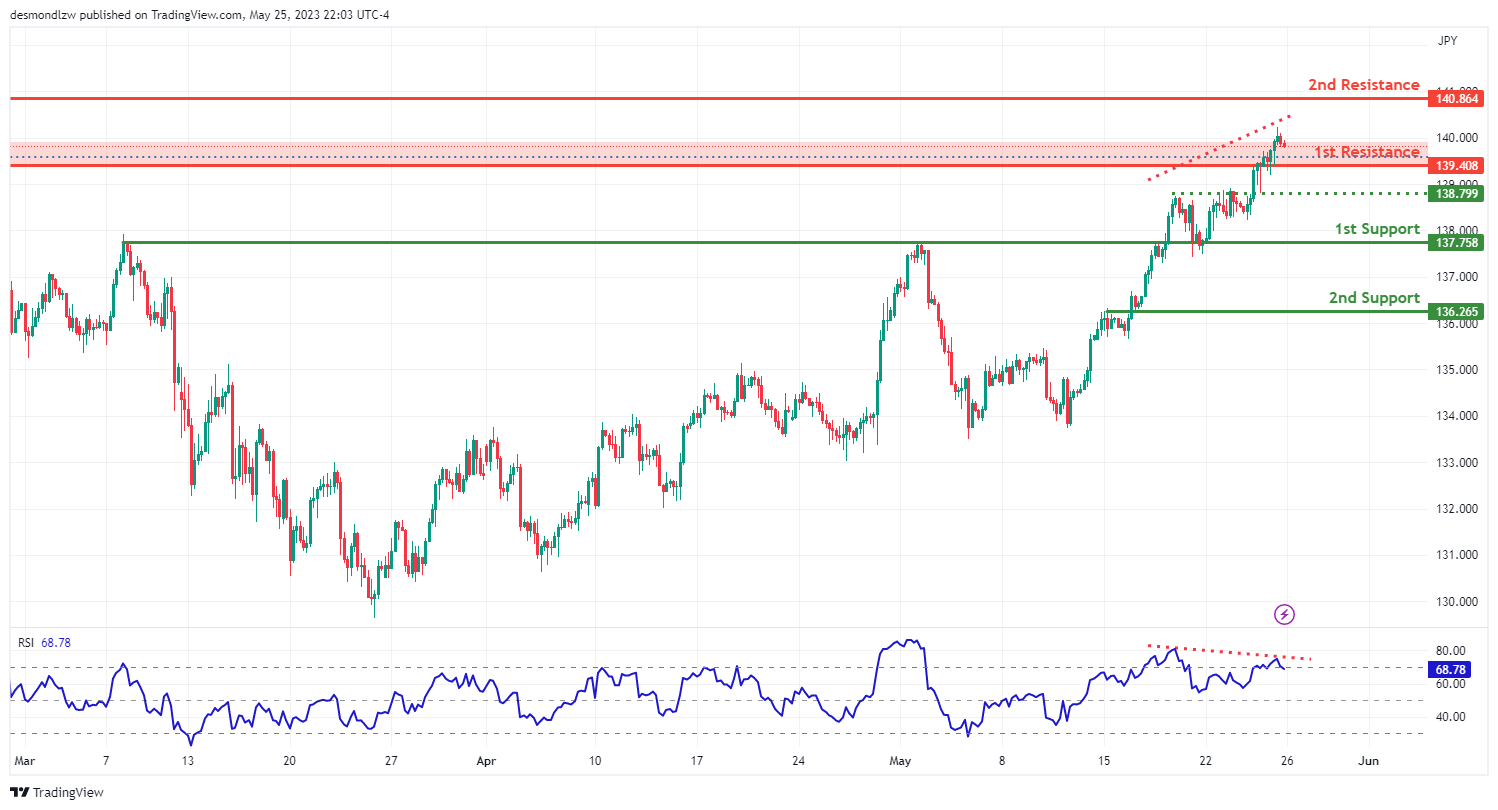
The USD/JPY trading instrument is presently exhibiting a bearish trend.
In the near future, the price could potentially continue its bearish trajectory towards the first support level at 137.75. This support level, known as an overlap support, could serve as a substantial base to prevent further price declines.
A second support level is identified at 136.25, also classified as an overlap support, reinforcing its potential to halt additional decreases in price.
Conversely, if the price seeks to reverse its bearish path, it might encounter resistance at 139.40. This resistance level, also identified as a pullback resistance, aligns with the 50% Fibonacci retracement level and could pose a challenge to further price increases.
Another resistance level to be mindful of is at 140.86. As a swing high resistance, this level could potentially limit any upward price momentum.
Moreover, the Relative Strength Index (RSI) is showing bearish divergence compared to the price, indicating a likelihood of a swift decrease in price in the near future.
AUD/USD:
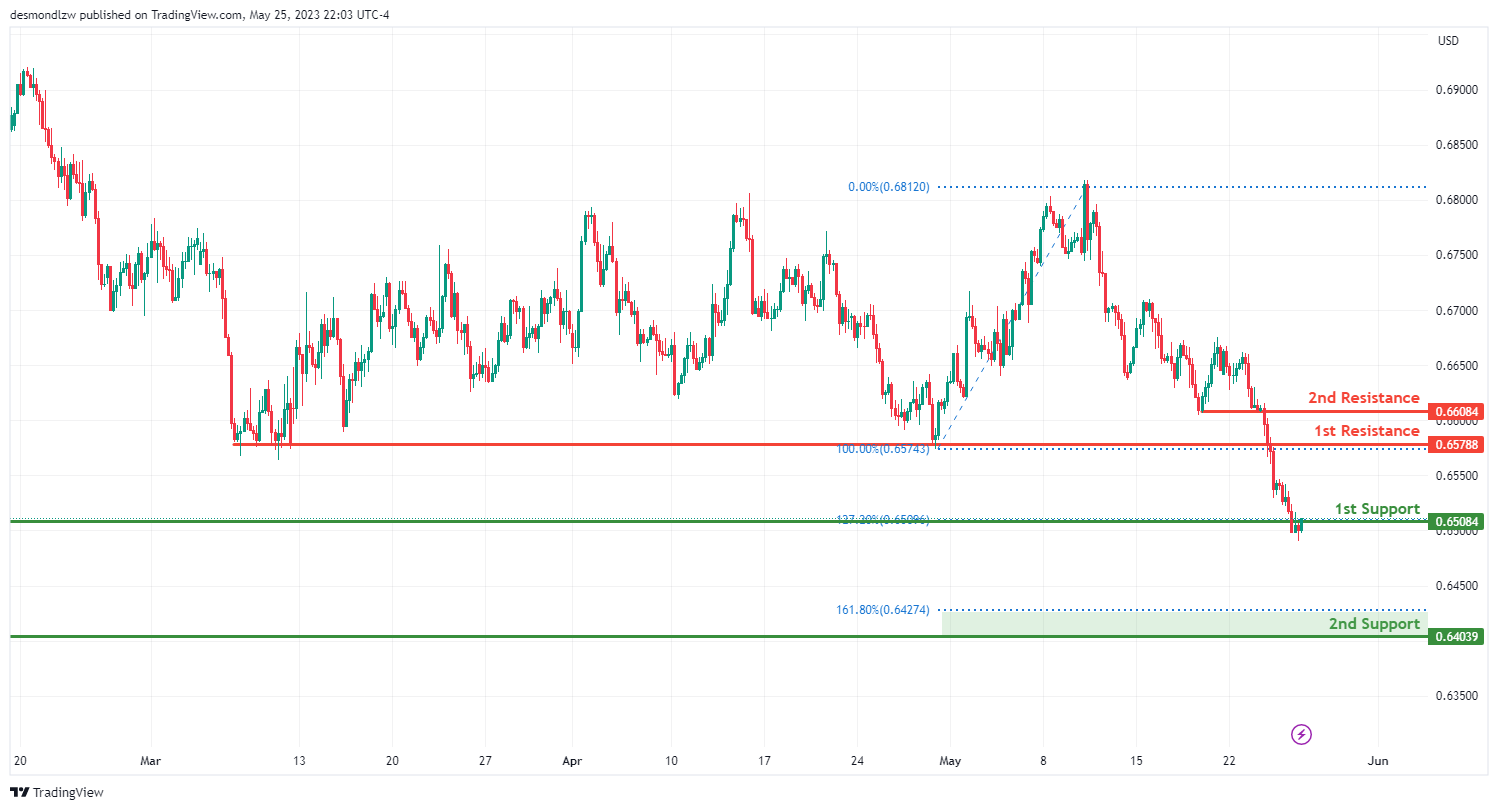
The AUD/USD instrument is currently displaying a bullish trend.
In the near future, there’s a possibility for a bullish bounce off the first support level at 0.6508, potentially propelling the price towards the first resistance level at 0.6578. This first support level, known as a pullback support, aligns with the 127.20% Fibonacci Extension, bolstering its potential to halt any further downward movement.
There is also a second support level at 0.6403, identified as an overlap support, coinciding with the 161.80% Fibonacci Extension, which further strengthens its ability to prevent additional price decreases.
On the upside, the first resistance level is located at 0.6578, which functions as a pullback resistance and could pose a potential barrier to price increases.
Further, a second resistance level is noted at 0.6608, also serving as a pullback resistance, enhancing the potential for hindering any further bullish price momentum.
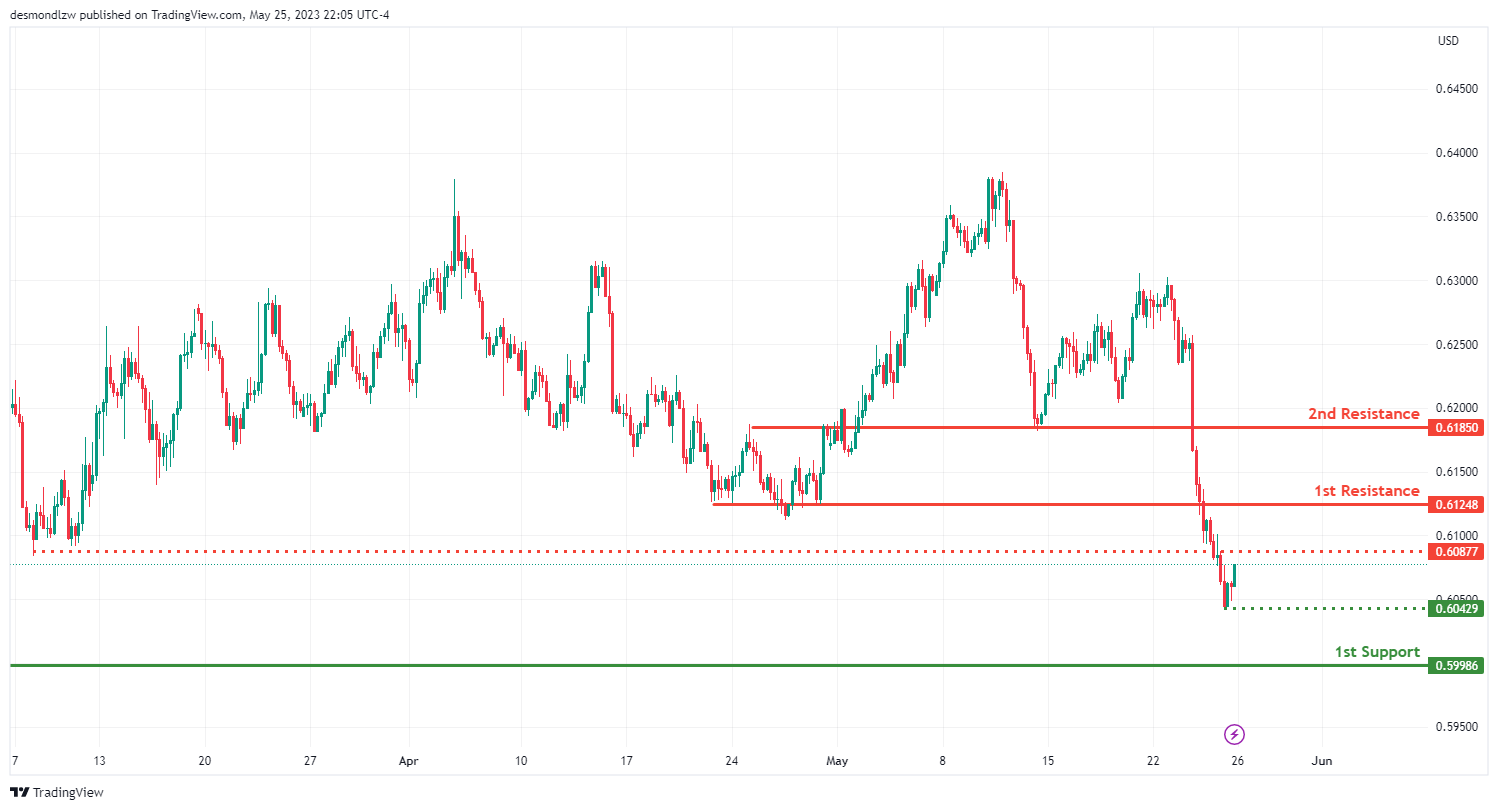
NZD/USD
The NZD/USD instrument is currently displaying a bearish trend.
In the short term, there’s a potential for a bearish continuation towards the first support level at 0.6508. This first support level serves as a pullback support, strengthening its ability to halt further price drops.
An intermediate support level is also present at 0.6042, functioning as a swing low support and could further reinforce the potential for price support during a downward movement.
Regarding resistance levels, the first resistance is at 0.6124, serving as a pullback resistance, which could provide a potential obstacle for upward price movements.
Additionally, there is a second resistance level at 0.6185, also serving as a pullback resistance, enhancing its potential to hinder any further bullish momentum.
An intermediate resistance level is noted at 0.6087, functioning as a pullback resistance, which might act as an additional hurdle to the price rise.
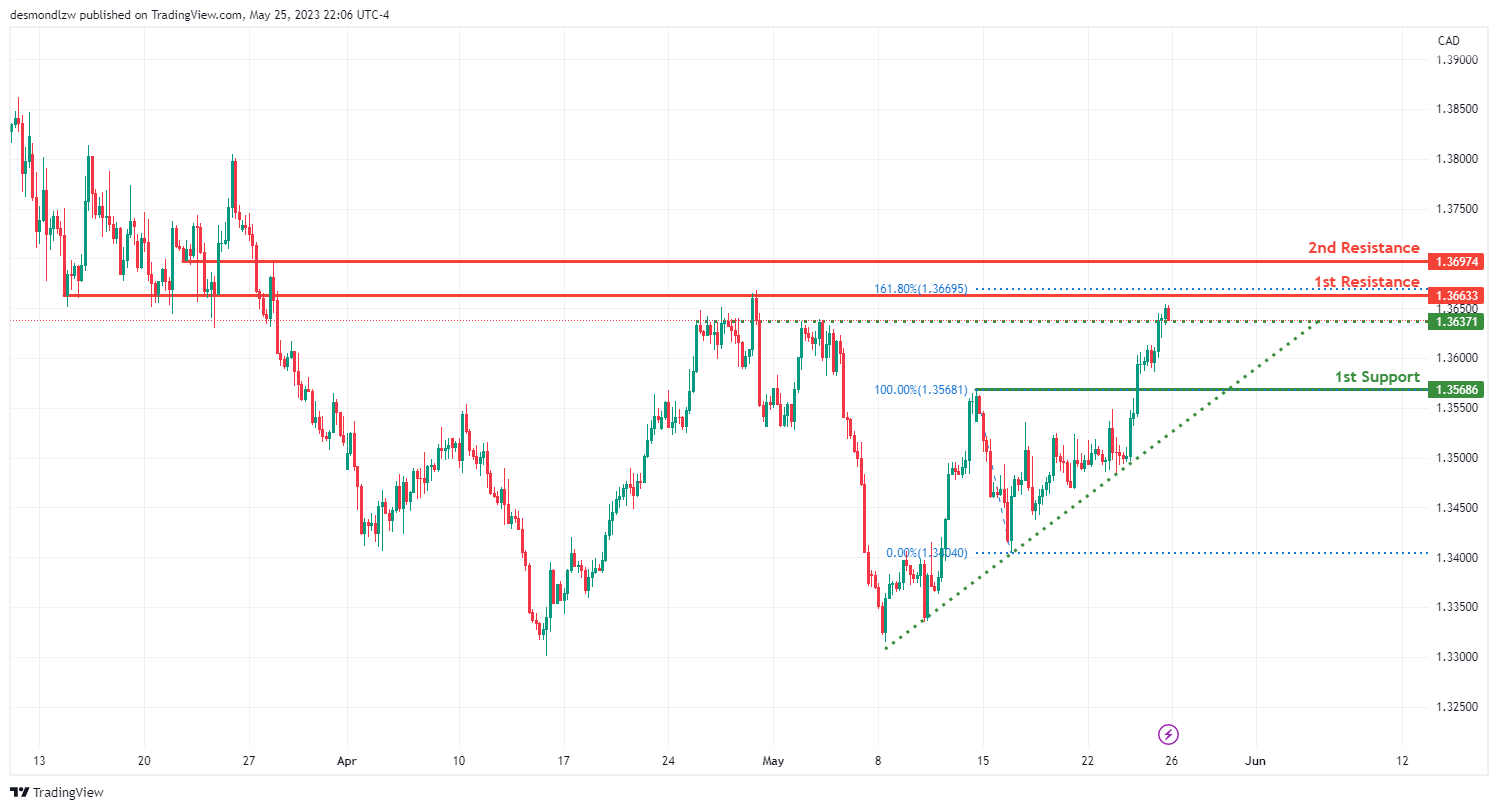
USD/CAD:
The USD/CAD pair is currently displaying a bullish momentum. This trend is influenced by the price being above a significant ascending trend line, which suggests further bullish movements.
In the short term, it’s likely that the price could drop to the first support level at 1.3568 before bouncing back and rising to the first resistance level at 1.3663. This first support level, identified as a pullback support, might provide a strong base to prevent further price drops.
Additionally, an intermediate support level at 0.6042 is acting as a swing low support, providing another potential base to halt any price declines.
As for resistance levels, the first resistance at 1.3663 is classified as an overlap resistance, coinciding with a 161.80% Fibonacci Extension, suggesting its significance as a potential price ceiling. The second resistance level at 0.6185, recognized as an overlap resistance, could further hinder an upward price movement.
DJ30:
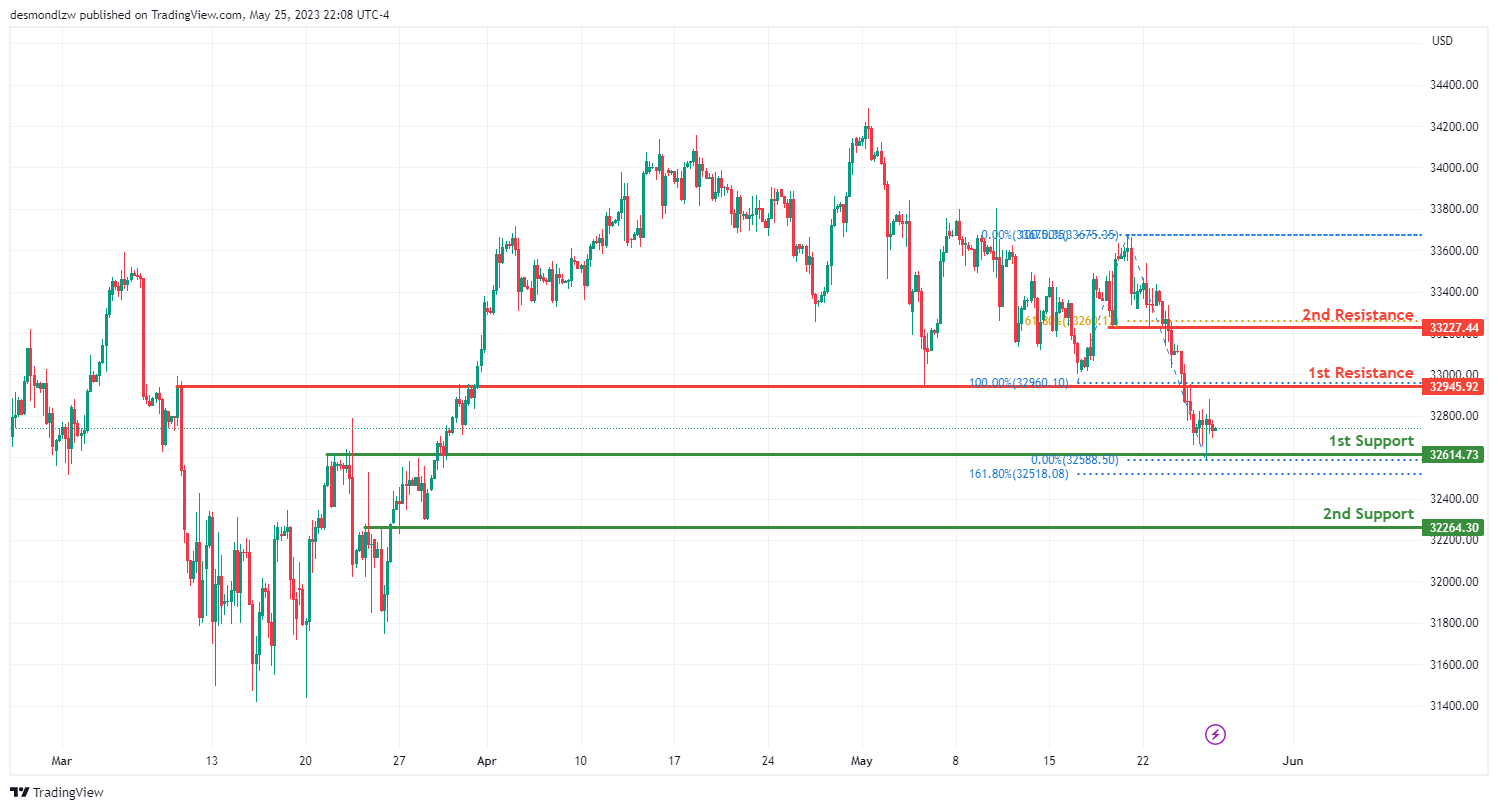
The DJ30 chart is currently displaying a bullish trend, suggesting potential for continued upward movement.
In the near term, there’s a possibility of a bullish continuation towards the first resistance level at 32945.92.
As for the support levels, the first one at 32614.73, known as an overlap support, might offer a strong foundation to prevent further declines in price. The second support level, placed at 32264.30, also recognized as an overlap support, might provide additional strength against a downward price movement.
Regarding the resistance levels, the first resistance at 32945.92 is identified as a pullback resistance, which could act as a potential barrier to price increase. The second resistance level at 33227.44, also classified as a pullback resistance, coincides with the 61.80% Fibonacci retracement, implying its significance as a potential price ceiling.
GER30:
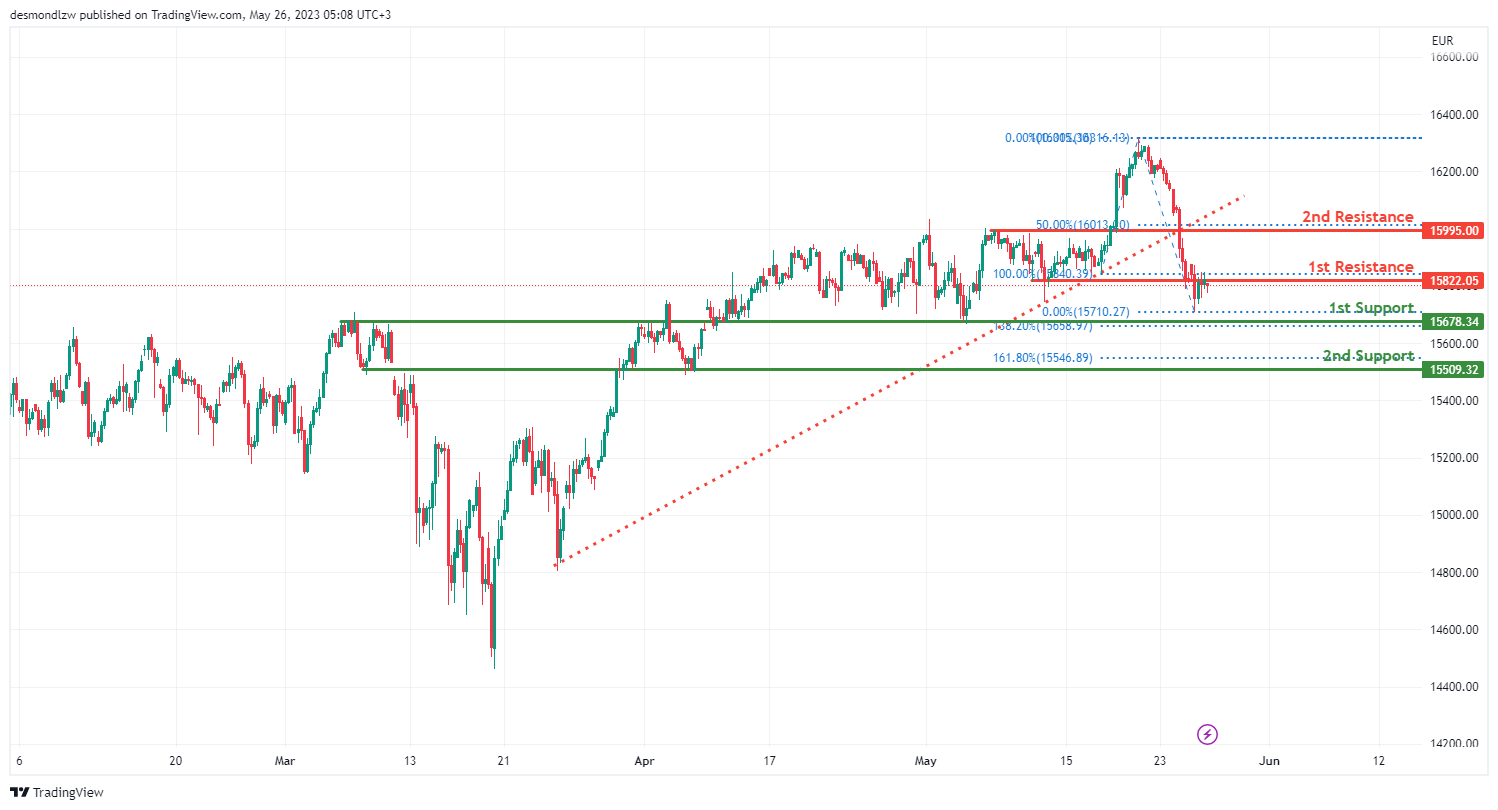
The GER30 chart is currently exhibiting a bearish trend, indicating potential for further downward movement. A significant factor contributing to this momentum is that the price has broken below an ascending support line, signalling a potential bearish shift.
In the short term, we might see a bearish reaction at the first resistance level of 15822.05, which could lead to a decrease towards the first support level of 15678.34. The first support is an overlap support, and it aligns with the 138.20% Fibonacci extension, indicating its potential to act as a solid base to prevent further price drops.
There’s also a second support level at 15509.32, classified as an overlap support and aligning with the 161.80% Fibonacci retracement. This level could provide additional support in the event of a price decrease.
On the resistance side, the first resistance level at 15822.05 is recognized as an overlap resistance and could impede upward price movement. The second resistance level at 15995.00, known as a pullback resistance, coincides with the 50% Fibonacci retracement, suggesting its potential to act as a barrier to price increase.
BTC/USD:
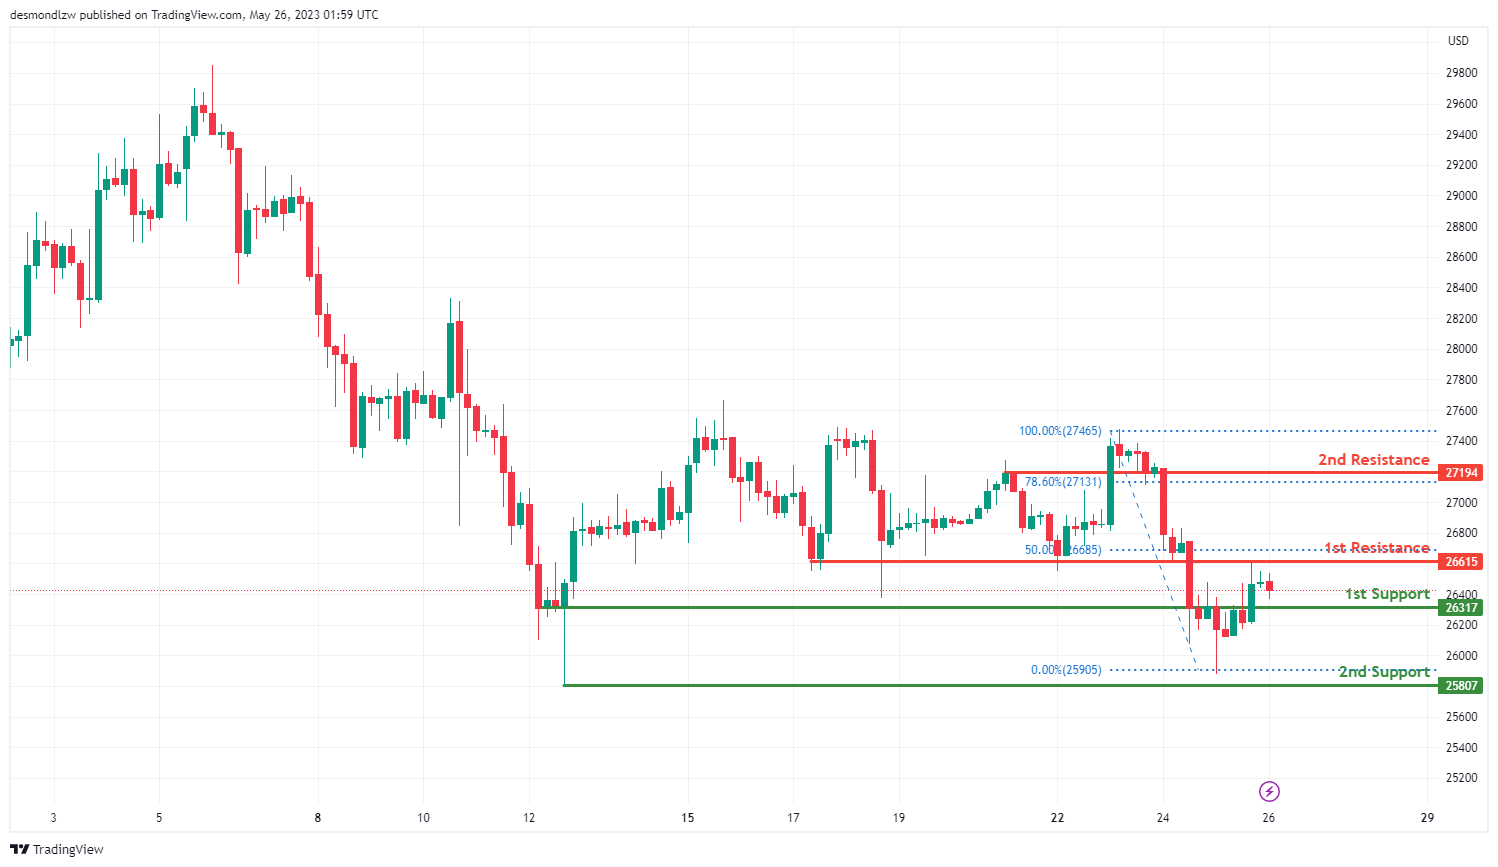
The BTC/USD chart is currently demonstrating a bearish trend, suggesting potential for continued downward movement.
In the short run, there’s a possibility for a bearish continuation towards the first support level at 26317. This level serves as a pullback support, which might provide a solid base to prevent further price drops.
There’s also a second support level at 25807, which is identified as a swing low support. This level could add another layer of support in case of a price decrease.
On the resistance side, the first resistance level is at 26615, recognized as an overlap resistance and coinciding with a 50% Fibonacci retracement. This suggests its significance as a potential price ceiling.
Moreover, there’s a second resistance level at 27194, known as a pullback resistance. This level aligns with a 78.60% Fibonacci retracement, indicating its potential to obstruct an upward price movement.
US500
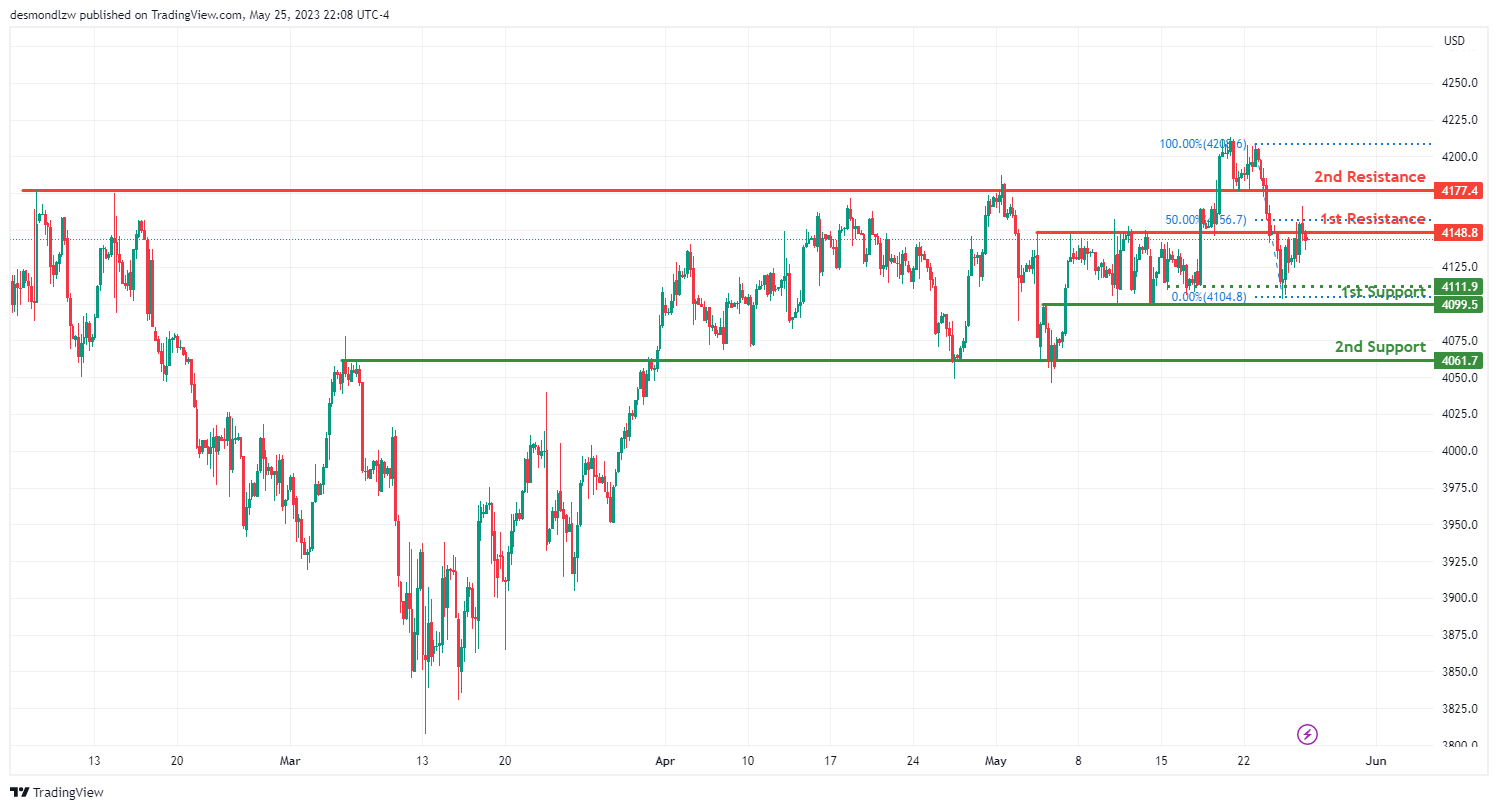
The US500 chart is currently indicating a bearish momentum, suggesting the potential for continued downward trends.
In the near term, a bearish response off the first resistance level at 4148.8 could lead to a decline towards the first support level at 4099.5. This first resistance level is recognized as an overlap resistance, aligning with a 50% Fibonacci retracement, which hints at its potential to act as a limit for price hikes.
Moreover, a second resistance level at 4177.4, identified as a pullback resistance, could further obstruct an upward price movement.
In terms of support, the first support level at 4099.5, known as an overlap support, might provide a strong foundation to prevent further drops in price. Additionally, there’s a second support level at 4061.7, also recognized as an overlap support, adding to the potential for price support in the event of a downward shift in price.
ETH/USD:
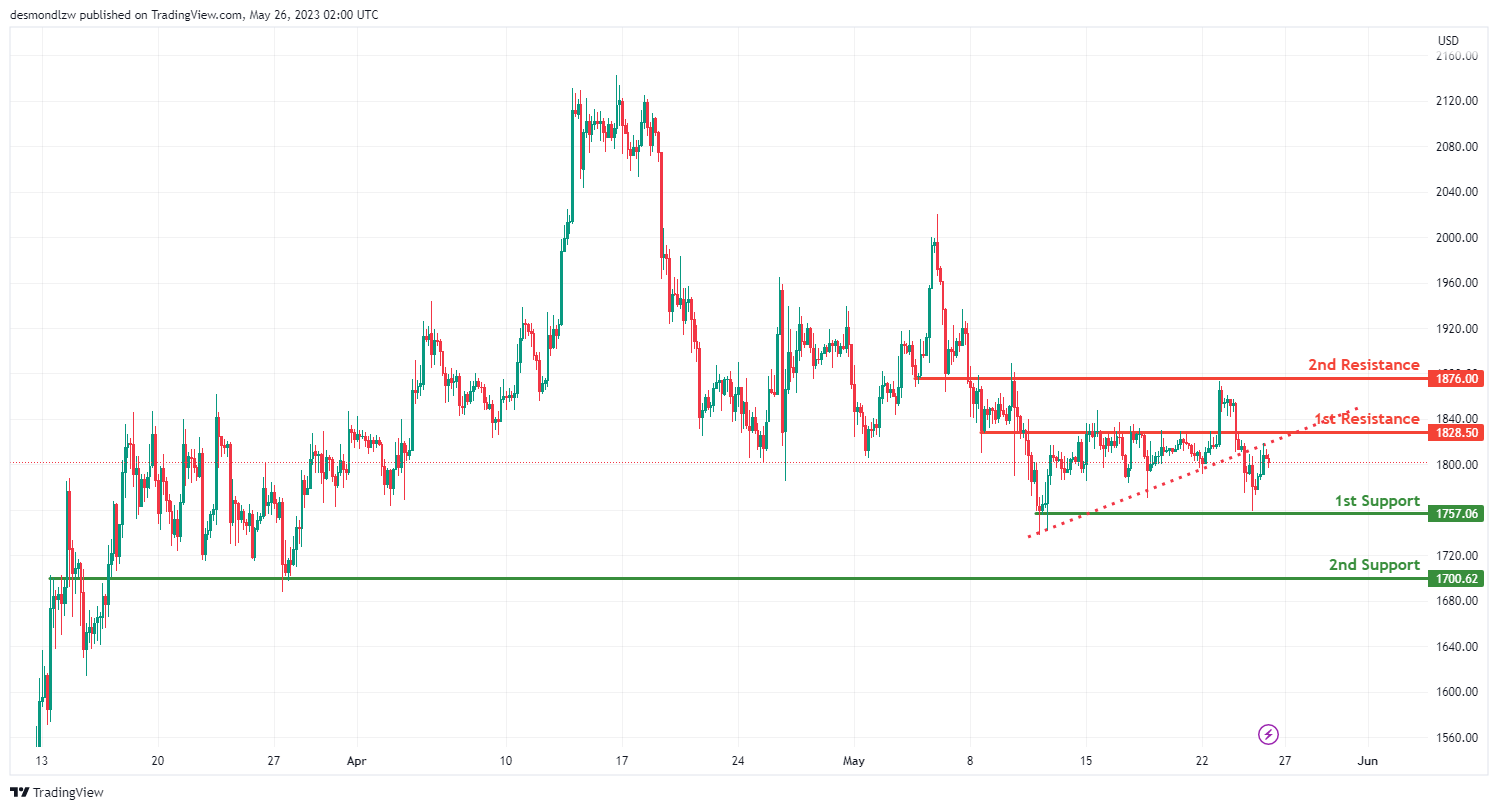
The ETH/USD chart currently shows a bearish momentum, which seems to have been triggered by the price breaking below an ascending support line.
In the short term, we could see a bearish response at the first resistance level of 1828.50, leading to a drop towards the first support level of 1757.06. This first resistance level is recognized as an overlap resistance, suggesting its potential to act as a barrier to price increases.
A second resistance level at 1876.00, also classified as an overlap resistance, could further challenge upward price movements.
In terms of support, the first support level at 1757.06, known as a multi-swing low support, could provide a sturdy base to prevent additional price drops. Furthermore, there’s a second support level at 1700.62, which is identified as an overlap support. This could add further strength to the price support in the event of a downward shift in price.
WTI/USD:
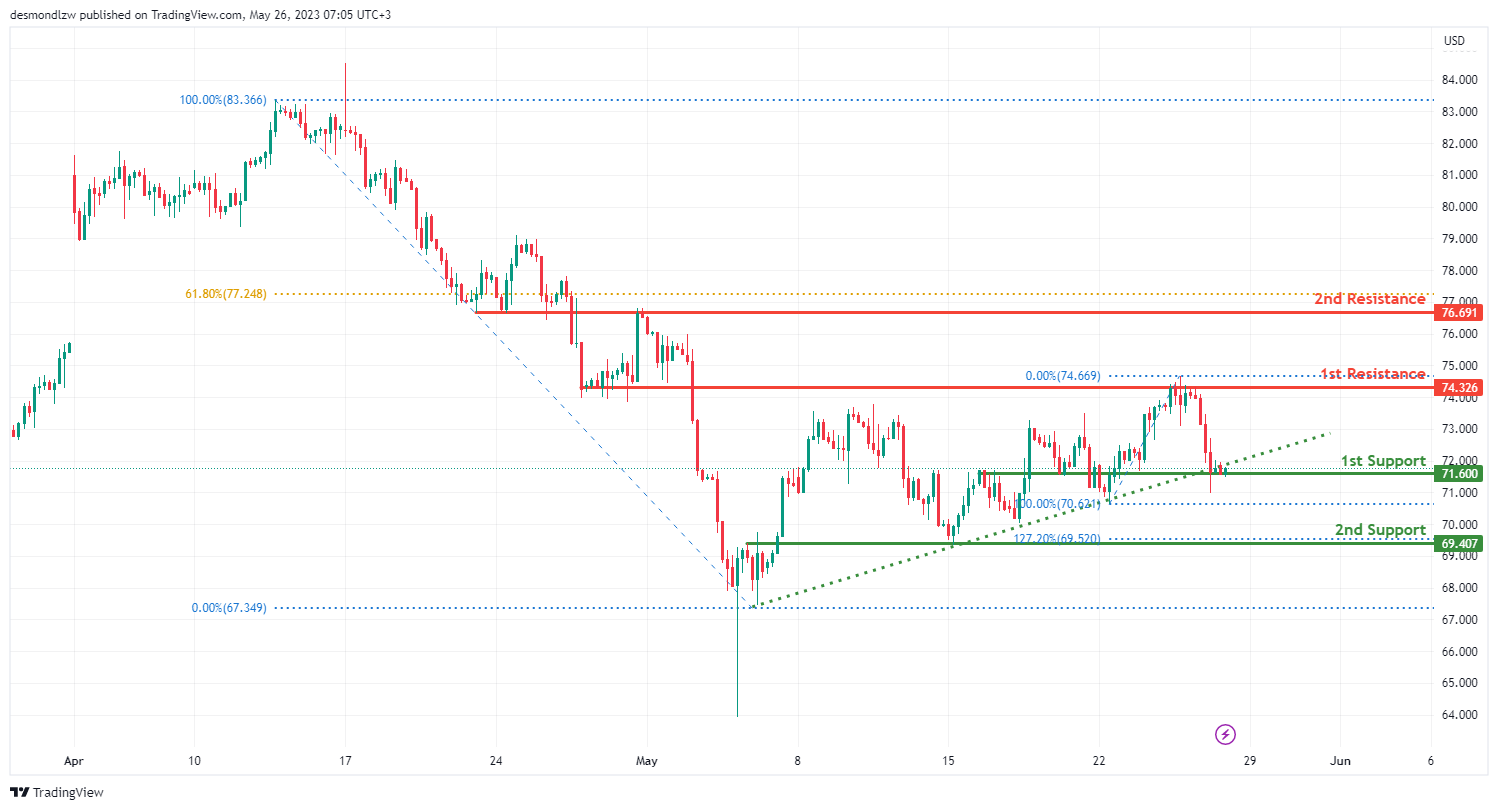
The WTI chart currently shows a bullish momentum, which seems to be reinforced by the price being above a major ascending trend line, indicating a potential for further upward movement.
In the near term, we could see a bullish bounce off the first support level at 71.60, followed by an upward movement towards the first resistance level at 74.32. This first support level is identified as a pullback support, suggesting its potential to act as a solid base to prevent further price decreases.
A second support level exists at 69.40, also recognized as an overlap support, which could further bolster the potential for price support in the event of a downward shift in price.
On the other hand, the first resistance level at 74.32, classified as an overlap resistance, could pose a challenge to further price increases. Similarly, a second resistance level at 76.69, also identified as an overlap resistance, could pose an additional challenge to upward price movements.
XAU/USD (GOLD):
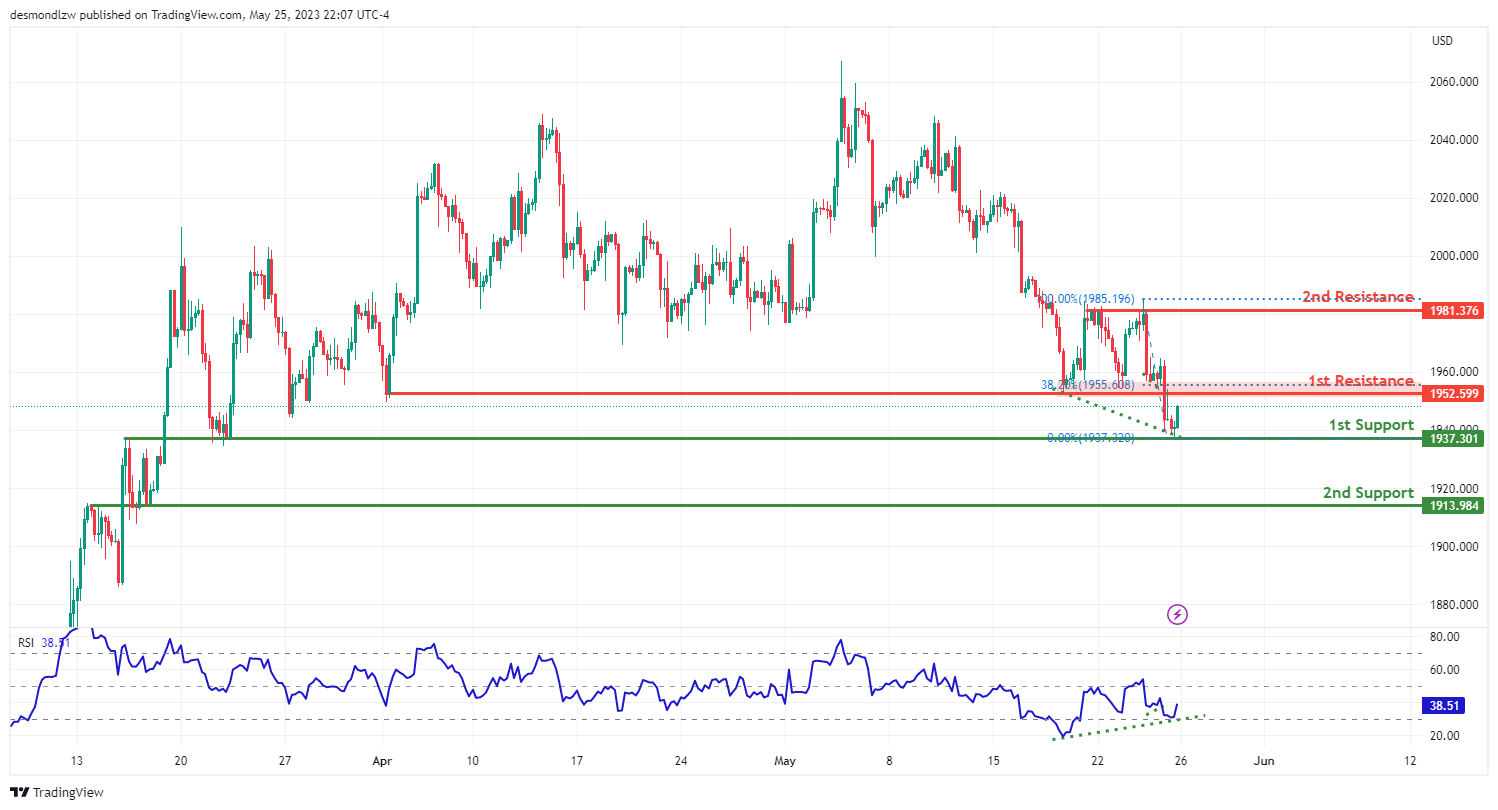
The XAU/USD (Gold) chart currently shows bullish momentum. We could potentially see a bullish bounce off the first support level at 1937.30, leading to an increase towards the first resistance at 1952.59.
The first support level at 1937.30 is an overlap support, which could act as a solid base to prevent further price decreases. If the price drops further, a second support level exists at 1913.98, also identified as an overlap support.
On the resistance side, the first resistance level is at 1952.59, and is considered a pullback resistance and corresponds to the 38.20% Fibonacci retracement level. If the price breaks this level, it could face a second resistance at 1981.37, which is identified as a multi-swing high resistance. This is a critical level that has been tested multiple times in the past, making it a strong resistance level.
The Relative Strength Index (RSI) is also displaying bullish divergence versus price, which can often be a signal of potential bullish reversal. This suggests that the price of Gold might see a rapid increase soon. However, always consider other factors and use appropriate risk management strategies when trading.
USD/JPY Extends Rally, US GDP Grows 1.3% in Q1
Key Highlights
- USD/JPY climbed further higher above the 140.00 resistance.
- A key bullish trend line is forming with support near 138.90 on the 4-hour chart.
- EUR/USD and GBP/USD declined to new monthly lows.
- The US Gross Domestic Product grew 1.3% in Q1 2023 (Preliminary).
USD/JPY Technical Analysis
The US Dollar started a major increase above the 137.50 resistance against the Japanese Yen. USD/JPY traded above the 138.50 resistance to move further into a positive zone.
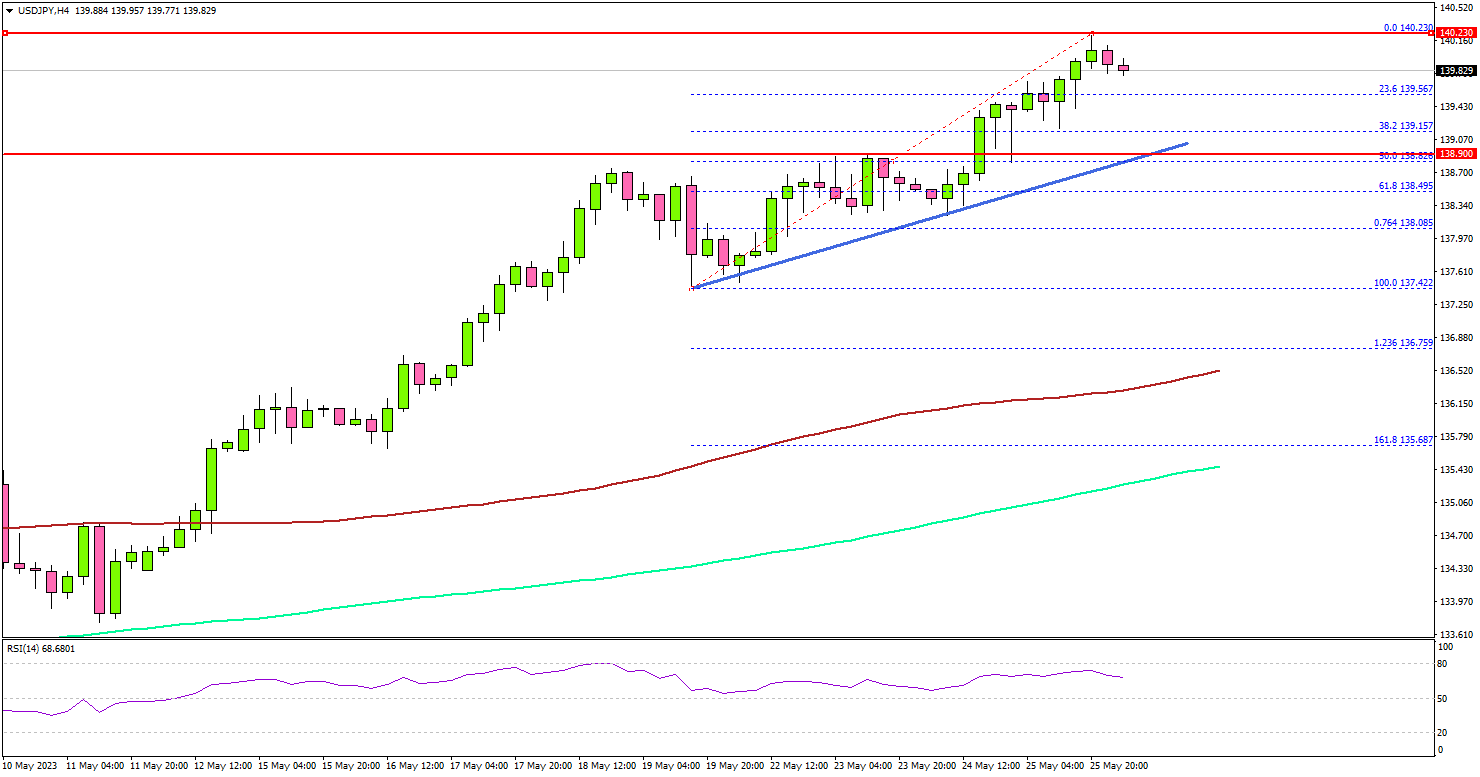
Looking at the 4-hour chart, the pair settled above the 138.80 level, the 100 simple moving average (red, 4 hours), and the 200 simple moving average (green, 4 hours).
The upward move was such that the pair traded above the 140.00 resistance. It seems like the bulls are in control and might aim for more upsides above 140.00. The next major resistance is near 140.80, above which the pair could rise toward the 142.00 level.
On the downside, the pair might find support near 139.00. The next major support is near the 138.80 level. There is also a key bullish trend line forming with support near 138.90 on the same chart.
If there is a downside break below the trend line support, the pair could decline toward the 138.00 support level. The next major support sits near the 137.40 level.
Looking at EUR/USD, the pair failed to start a recovery wave and extended its decline below the 1.0750 support zone.
Economic Releases
- US Personal Income for April 2023 (MoM) - Forecast +0.4%, versus +0.3% previous.
- US Durable Goods Orders for April 2023 – Forecast -1% versus +3.2% previous.
Elliott Wave View: USDJPY Approaching Turning Area
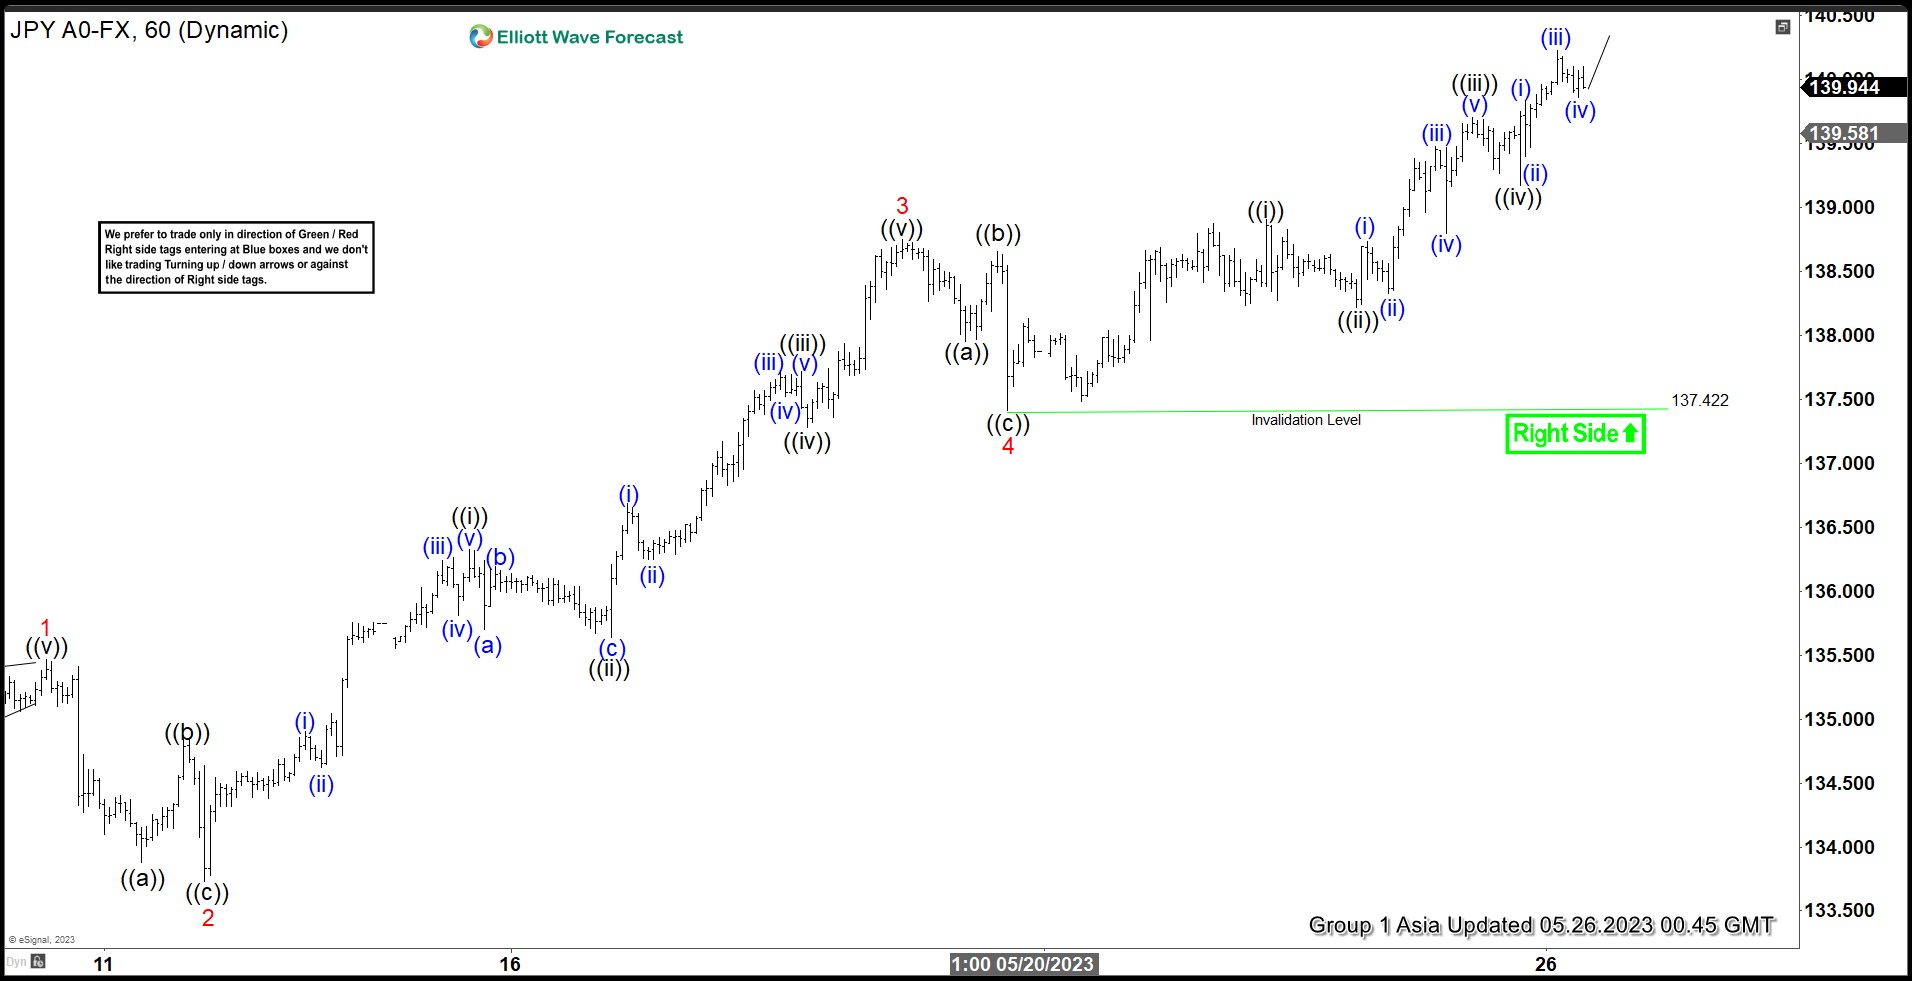
Rally in USDJPY from 1.16.2023 low takes the form of a 3 swing and about to reach the extreme area. The 100% – 161.8% Fibonacci extension form 1.16.2023 low comes at 140.4 – 147.1 where sellers can appear. This suggests that USDJPY is close to the time window where pair can see at least a 3 waves pullback. Short term, USDJPY’s rally from 5.4.2023 low is in progress as a 5 waves impulse Elliott Wave structure as the 1 hour chart below shows. Up from 5.4.2023 low, wave 1 ended at 135.47 and pullback in wave 2 ended at 133.73. Internal subdivision of wave 2 unfolded as a zigzag where wave ((a)) ended at 133.88, wave ((b)) ended at 134.84, and wave ((c)) lower ended at 133.73. This completed wave 2 in higher degree.
Pair resumes higher in wave 3 with internal subdivision as another 5 waves in lesser degree. Up from wave 2, wave ((i)) ended at 136.32 and pullback in wave ((ii)) ended at 135.64. Pair resumes higher in wave ((iii)) towards 137.72 and dips in wave ((iv)) ended at 137.27. Final leg wave ((v)) ended at 138.74 which completed wave 3. Pair then pullback in wave 4 towards 137.42 with internal subdivision as a zigzag. Down from wave 3, wave ((a)) ended at 137.95, wave ((b)) ended at 138.65, and wave ((c)) ended at 137.42. Wave 5 higher is in progress as a 5 waves. Up from wave 4, wave ((i)) ended at 138.9 and wave ((ii)) ended at 138.22. Wave ((iii)) ended at 139.69 and pullback in wave ((iv)) ended at 139.17. As far as pivot at 137.42 low stays intact, expect pair to find support in 3, 7, or 11 swing for further upside.
USDJPY 60 Minutes Elliott Wave Chart
USDJPY Elliott Wave Video
https://www.youtube.com/watch?v=Lkockd_iig4