

Sample Category Title
Tokyo Core-Core CPI Continues to Accelerate With USD/JPY Now Below Key 141.00
- Tokyo core-core CPI (excluding fresh food & energy) accelerated to a 31-year high
- BoJ’s latest guidance from Governor Ueda is no longer making wage growth as a main priority, raising the possibility of a monetary policy normalization in H2 2023.
- The 5-month rally of USD/JPY is now coming close to key short-term resistance at 141.00.
This week’s latest release of key leading economic data out of Japan has indicated signs of sustained inflationary growth and a recovery in demand that could boost economic growth in the second half of 2023.
The May flash manufacturing purchasing managers’ index (PMI) has increased to an eight-month high of 50.8 from 49.5 printed in April and exited from a contraction mode. Likewise, the services PMI has shown signs of resilience, increasing to 56.3 in May from 55.4 in April, its ninth consecutive month of growth expansion.
Tokyo (excluding fresh food & energy) CPI for May accelerated to a 31-year high
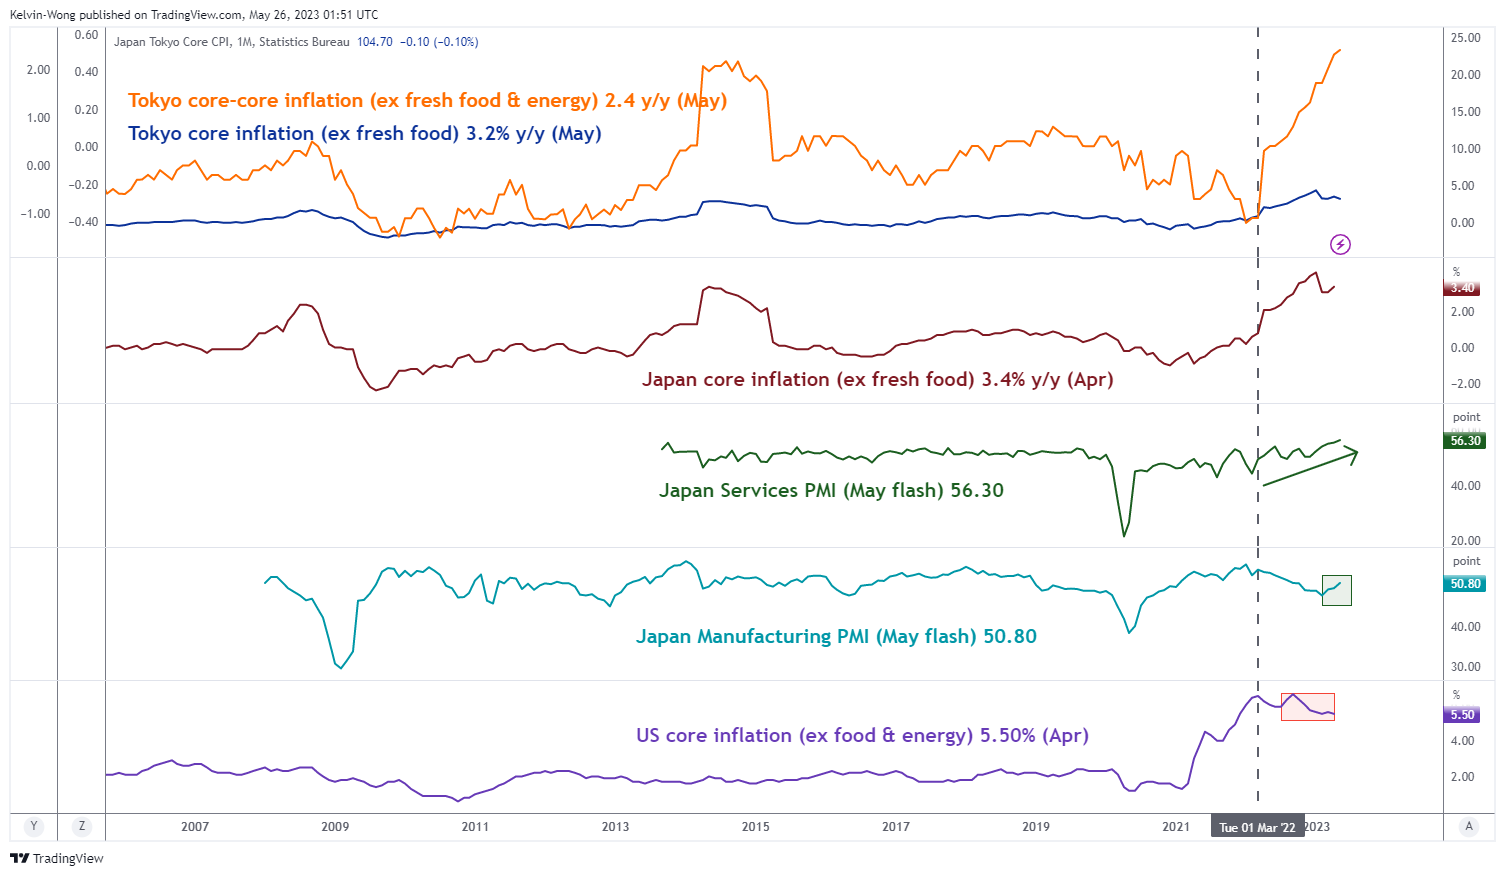
Fig 1: Tokyo inflation, Japan manufacturing & services PMIs for May 2023 (Source: TradingView, click to enlarge chart)
Tokyo consumer inflation data for May, a leading indicator for Japan’s nationwide price trends grew at a slower pace of 3.2% year-on-year for its core component (excluding fresh food) from an increase of 3.5% in April, slightly below the consensus forecast of 3.3%. But it has surpassed the Bank of Japan’s (BoJ) 2% inflation target for twelve consecutive months.
In addition, the Tokyo core-core inflation (excluding fresh food and energy), a measurement of sticky inflationary pressure is on a path of acceleration where it rose to 2.4% year-on-year, its highest level in almost 31 years from a gain of 2.3% recorded in April.
Thus, this latest set of upbeat leading economic data has further opened the “window of opportunity” for BoJ not to “drag its feet” to normalize its current ultra-easy monetary policy in 2023 amid rising global interest rates.
BoJ is playing a “Game of Thrones” with speculators
The latest public speeches and guidance made by the new BoJ Governor Kazuo Ueda have been less direct and clear in terms of the type of economic data and variables that BoJ is watching for it to be more confident to bring forward monetary policy normalization.
Yesterday, 25 May, Ueda in his first group media interview indicated a shift on its “core data watchlist”; stated that wage growth in Japan was not a sole target to determine the setting of BoJ’s monetary policy and the key point was whether inflation would rise in a stable and sustainable manner at 2%.
This latest remark from Ueda has played down the importance of wage growth, a reversal in April when Ueda chaired his first monetary policy meeting that highlighted wage growth as BoJ’s new policy guidance; as wage growth is still lacklustre, this prior guidance has generated some form of expectations that BoJ will be more patient in changing course, wait for more clear signs of upward momentum in wage growth and wait until the results of next year spring’s wages negotiation before it decides to normalize its accommodative monetary policy.
It seems that BoJ does not want to give clear-cut guidance of its monetary policy to prevent speculators from timing its exit from negative interest rates and its Yield Curve Control programme (YCC) on the yield of the 10-year Japanese Government Bond (JGB). Hence, an element of surprise needs to be implemented to prevent a significant spike in the JGBs yields that can trigger a massive bond selloff in the financial markets reinforced by microstructure risk in terms of liquidity absorption where BoJ has owned a record of 52% of outstanding JGBs as of end December 2022.
Net foreign inflow into the Japanese equities for the eighth consecutive week
Meanwhile, the Japanese stock market has roared back to life, the benchmark Nikkei 225 has recorded a month-to-day return of +7.10% for May at this time of the writing and surpassed its previous major swing high of 30,715 printed on February 2021.
It has also outperformed the MSCI All-Country World Index on a year-to-date basis; 18.5% versus 7.8%. These positive observations have led to significant foreign inflows into the Japanese stock market. Net buying by foreign investors totalled 747.6 billion yen between 15 May 15 and 19 May, up 32% from the previous week. This extended the streak into an eighth week, the longest since June 2017. A net amount of 3.6 trillion yen in stock was purchased over that period, the largest eight-week sum in nearly a decade.
In our previous analysis dated 19 April, we have highlighted the key supporting factors that may see a persistent tactical outperformance of the Japanese stock market into the second half of 2023.
Overall, the improving economic backdrop in Japan with accelerating sticky inflation coupled with a buoyant stock market that is supported by foreign net inflows has opened a window of opportunity for BoJ to normalize its ultra-easy monetary policy at least via a further widening of the YCC band in the first step, perhaps in July when it publishes its latest quarterly outlook report that comes with its latest projections of inflation and economic growth trend.
USD/JPY Technical Analysis – Below key 141.00 short-term resistance with exhaustion elements
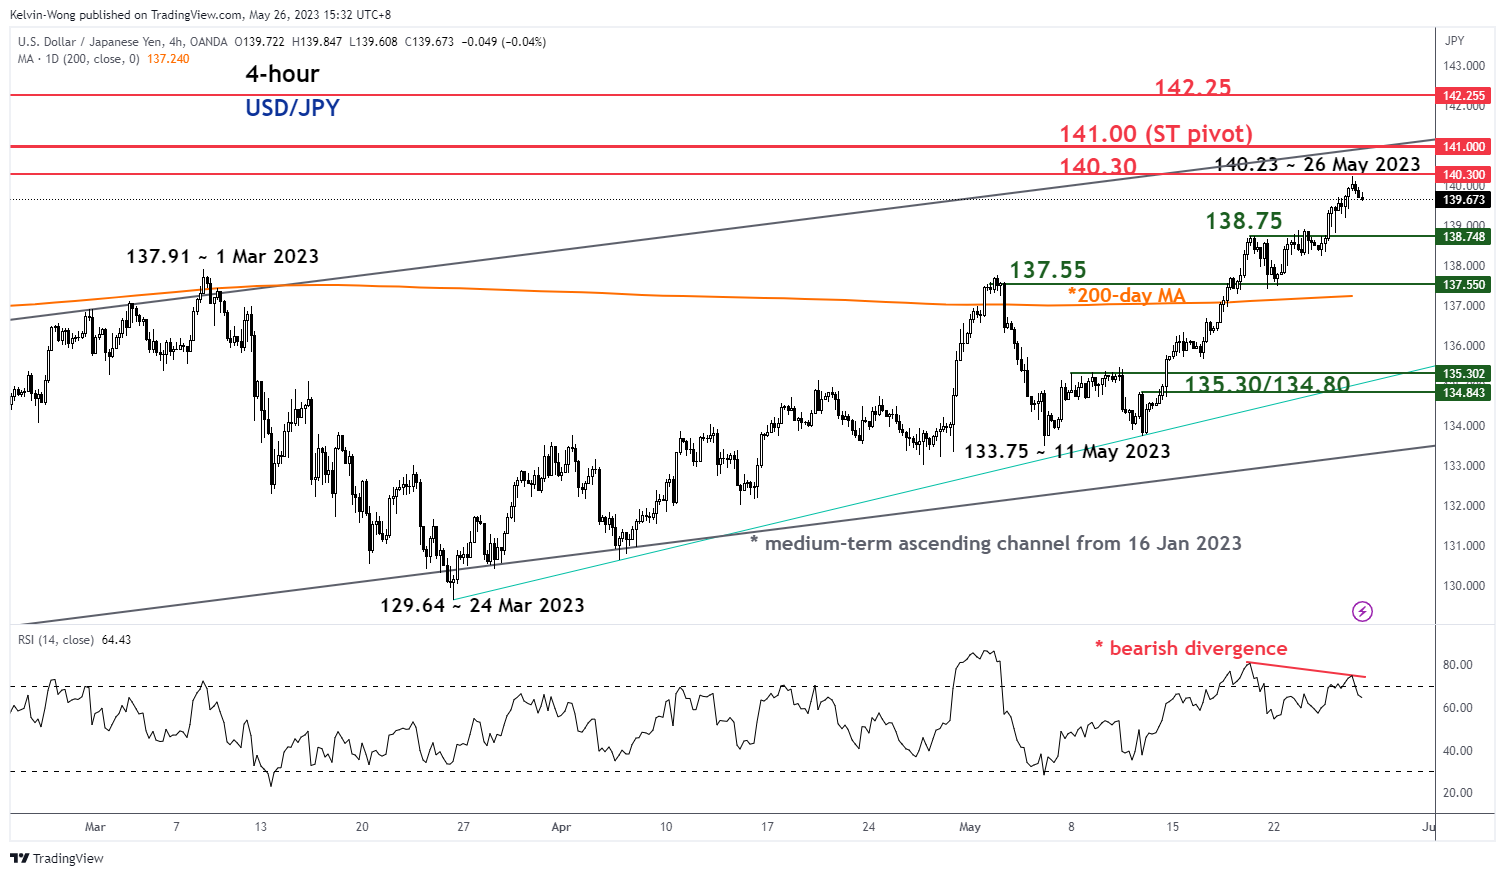
Fig 2: USD/JPY trend as of 26 May 2023 (Source: TradingView, click to enlarge chart)
In the recent week, the USD/JPY has rallied to its highest level so far seen this year, printing an intraday high of 140.23 during yesterday, 25 May US session.
Interestingly, the 5-month up move from its 16 January 2023 low of 127.22 is now coming close to the upper boundary of an ascending channel now acting as a resistance at around 141.00. The upside momentum of the most recent up move from the 11 May 2023 low of 133.75 is showing signs of exhaustion as the 4-hour RSI oscillator has just flashed out a bearish divergence signal at its overbought region.
Hence, the USD/JPY is now at risk of at least a short-term bearish reversal below the 141.00 key short-term pivotal resistance with the next supports coming in at 138.75 and 137.55 (also confluences with the 200-day moving average).
However, a clearance above 141.00 sees the next resistance at 142.25 which is defined by the 61.8% Fibonacci retracement of the prior major down move from the 21 October 22 high to the 16 January 2023 low and the swing high area of 21/22 November 2022
EUR/USD Technical Analysis
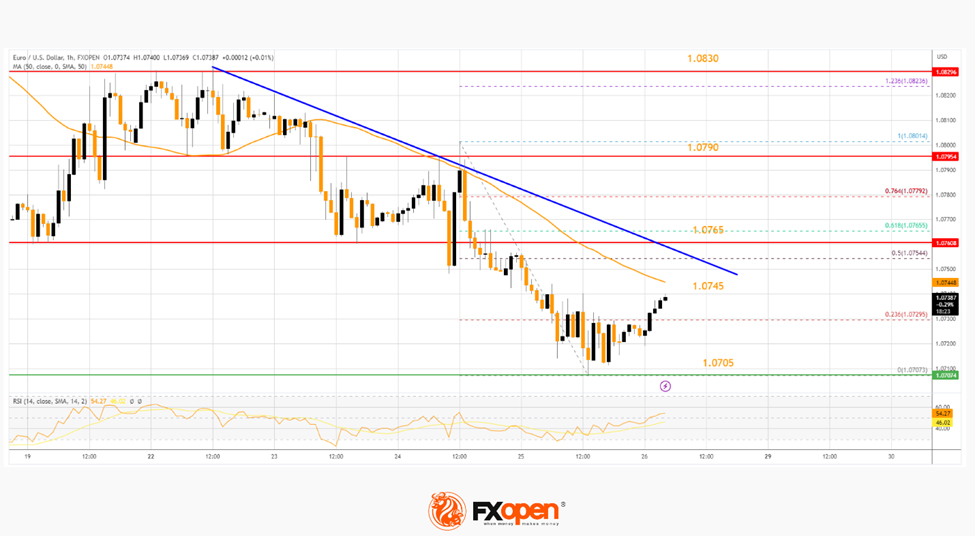
On the hourly chart of EUR/USD at FXOpen, the pair started a fresh decline below the 1.0790 support. The Euro declined below the 1.0765 support against the US Dollar.
The pair traded close to the 1.0700 zone and tested 1.0705. It is now consolidating losses and facing resistance near the 50-hour simple moving average at 1.0745. The first major resistance is near a connecting bearish trend line on the same chart at 1.0765.
A break above the 1.0765 resistance zone could start a decent increase toward the 1.0790 zone. A close above the 1.0790 level might start a strong increase toward the 1.0830 resistance.
Conversely, the pair might resume its decline from the 1.0745 level. Initial support is near the 1.0705 zone. The next major support is near 1.0680, below which EUR/USD could test the 1.0650 support.
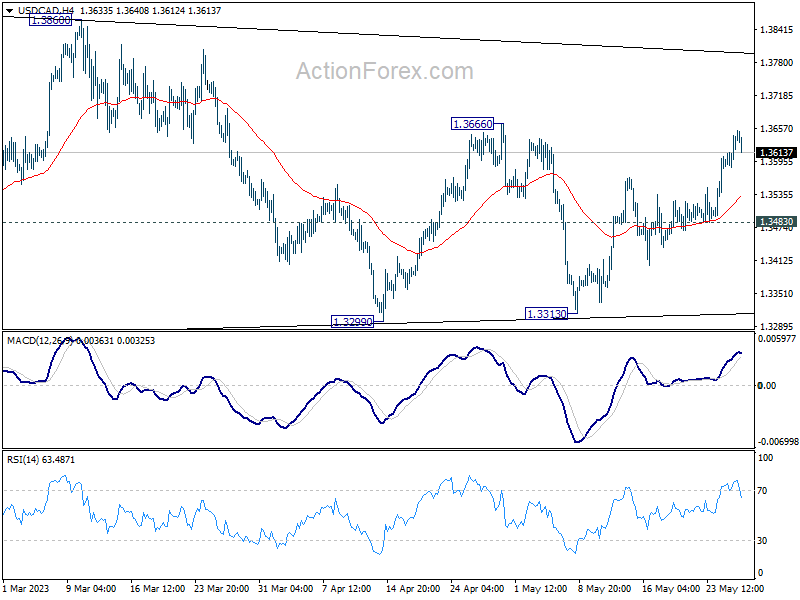
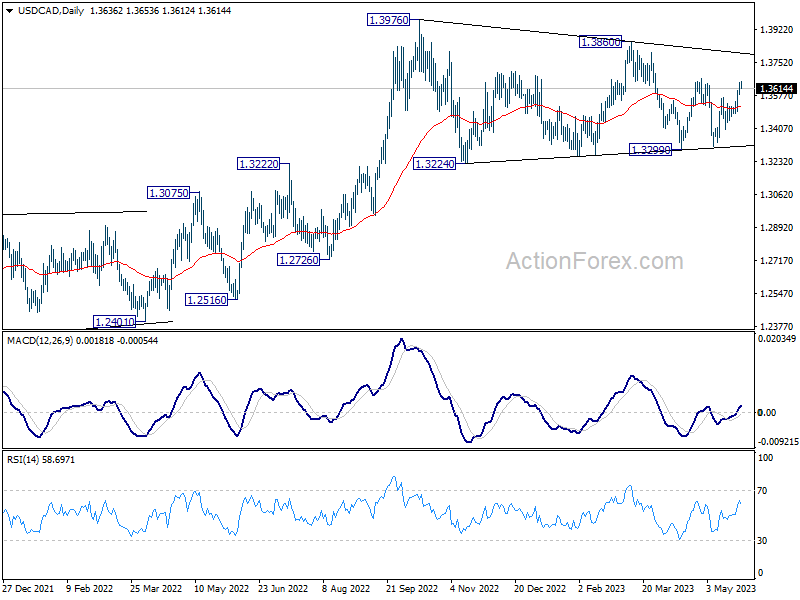
USD/CAD Daily Outlook
Daily Pivots: (S1) 1.3605; (P) 1.3626; (R1) 1.3664; More....
Intraday bias in USD/CAD remains on the upside at this point. Break of 1.3666 resistance will extend the rise from 1.3313 to 1.3860 resistance next. Price actions from 1.3976 are seen as a triangle consolidation pattern. Firm break of 1.3860 will argue that larger up trend is ready to resume through 1.3976 high. Nevertheless, break of 1.3483 minor support will turn intraday bias neutral again.
In the bigger picture, as long as 55 W EMA (now at 1.3333) holds, up trend from 1.2005 (2021 low) is still in favor to resume through 1.3976 at a later stage. However, sustained trading below the EMA and 38.2% retracement of 1.2005 to 1.3976 at 1.3233 will raise the chance of bearish reversal. Deeper should then be seen to 61.8% retracement at 1.2758 next.
AUD/USD Daily Report
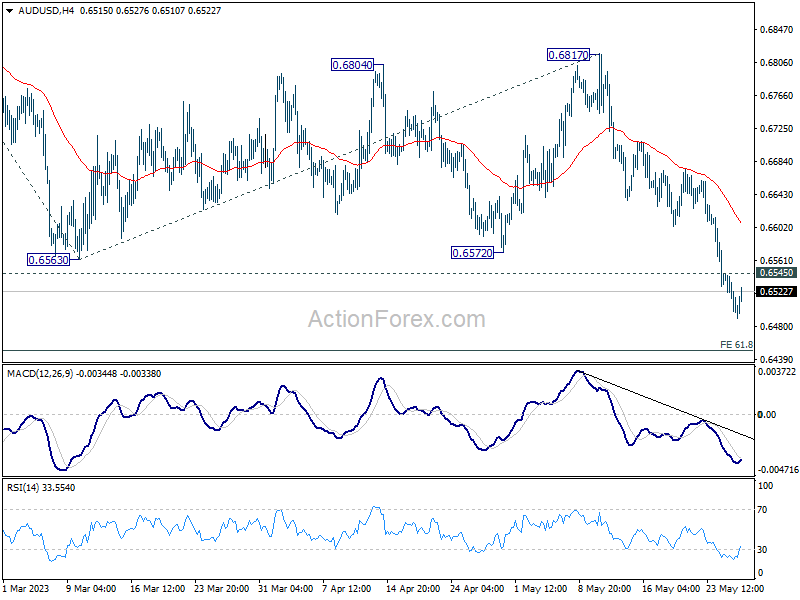
Daily Pivots: (S1) 0.6487; (P) 0.6517; (R1) 0.6536; More...
Intraday bias in AUD/USD stays on the downside for the moment. Current decline from 0.7156 should target 61.8% projection of 0.7156 to 0.6563 from 0.6817 at 0.6451. Firm break there will target 100% projection at 0.6224. On the upside, above 0.6545 minor resistance will turn intraday bias neutral first.
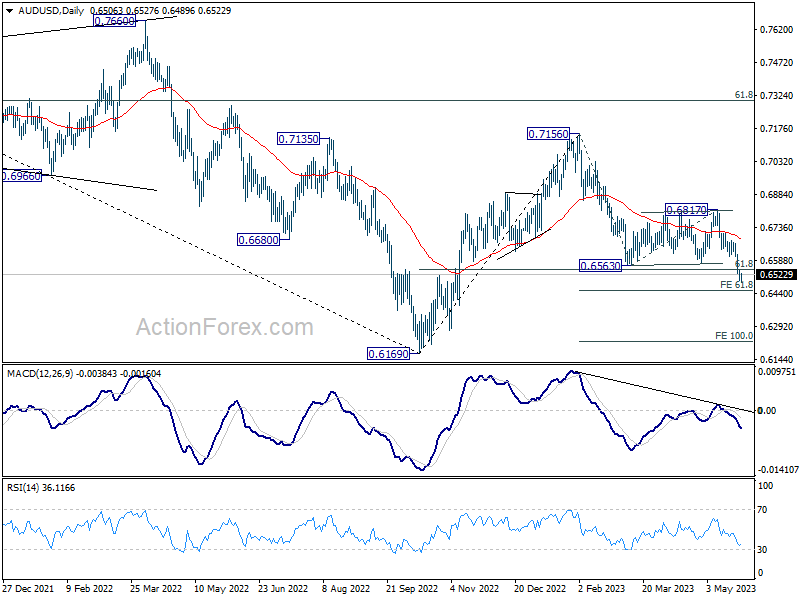
In the bigger picture, rejection by 55 W EMA (now at 0.6822) keeps medium term outlook bearish. Firm break of 61.8% retracement of 0.6169 to 0.7156 at 0.6546 now suggests that whole rebound from 0.6169 has completed at 0.7156 already. Larger down trend from 0.8006 (2021 high) might be ready to resume through 0.6169 low. This will now remain the favored case as long as 0.6817 resistance holds.
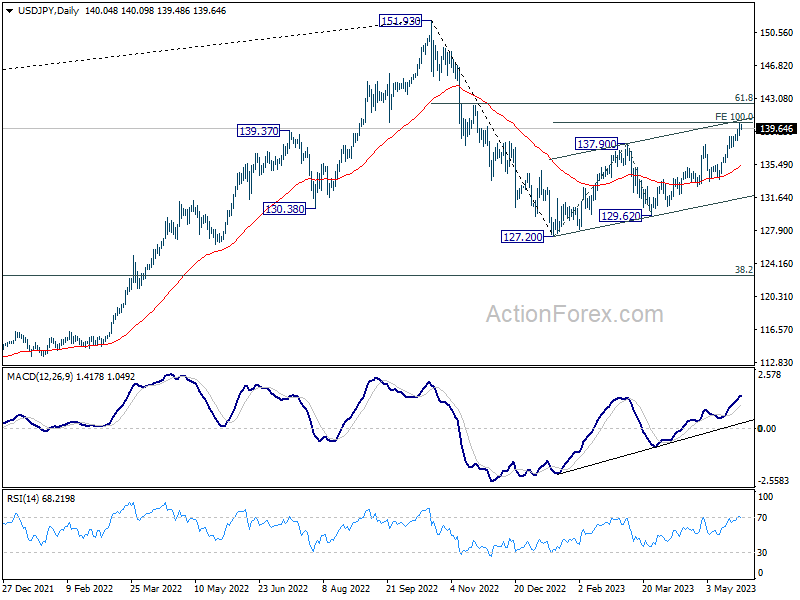
USD/JPY Daily Outlook
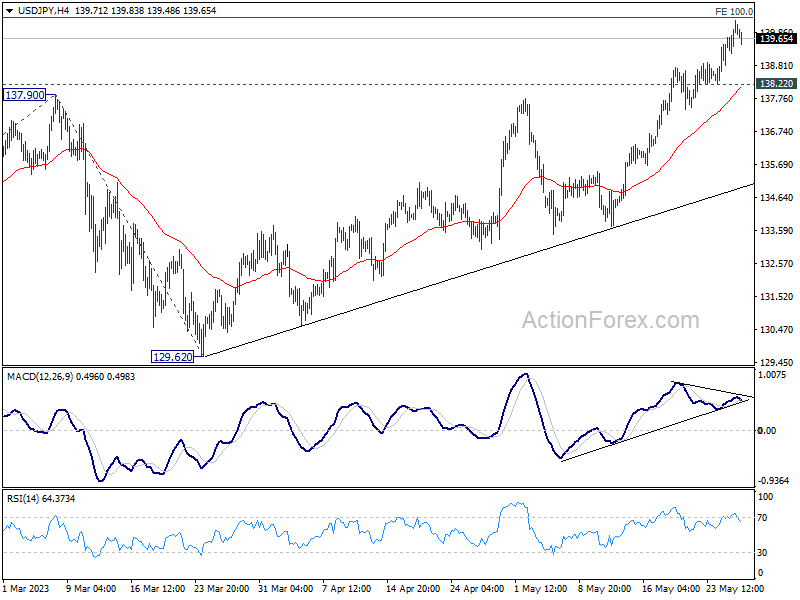
Daily Pivots: (S1) 139.18; (P) 139.70; (R1) 140.57; More...
Intraday bias in USD/JPY is turned neutral first with current retreat. On the downside, break of 138.22 support indicate short term topping, after failing 100% projection of 127.20 to 137.90 from 129.62 at 140.32. Intraday bias will turn back to the downside for 55 D EMA (now at 135.39). ON the upside, through, break of 140.32 will extend the rise from 127.20 to 142.48 fibonacci level.
In the bigger picture, rise from 127.20 is seen as the second leg of the corrective pattern from 151.93 high. Stronger rally would be seen to 61.8% retracement of 151.93 to 127.20 at 136.34. Sustained break there will pave the way back to retest 151.93. On the downside, however, break of 133.73 support will argue that the pattern could have started the third leg through 127.20 low.
USD/CHF Daily Outlook
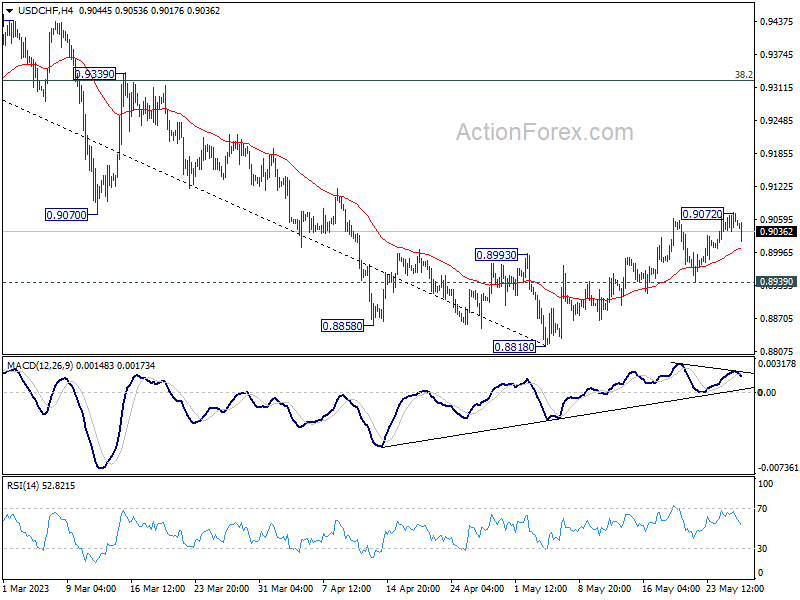
Daily Pivots: (S1) 0.9040; (P) 0.9056; (R1) 0.9075; More...
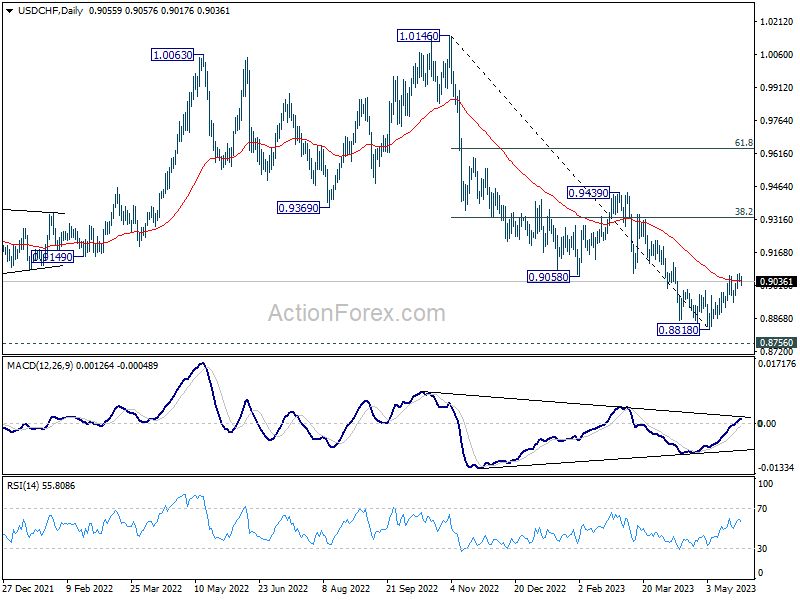
Intraday bias in USD/CHF is turned neutral with current retreat. But further rally is in favor as long as 0.8939 support holds. On the upside, sustained trading above 55 D EMA (now at 0.9039) should confirm that current rally is at least correcting whole down trend from 1.0146. Further rise should then be seen to 38.2% retracement of 1.0146 to 0.8818 at 0.9325. On the downside, though, break of 0.8939 will bring retest of 0.8818 low instead.
In the bigger picture, fall from 1.1046 (2022 high) is seen as a leg in the long term range pattern from 1.0342 (2016 high). So, downside should be contained by 0.8756 to bring reversal. Sustained break of 0.9058 support turned resistance will be the first sign of medium term bottoming. However, decisive break of 0.8756 will carry larger bearish implications.
EUR/USD Daily Outlook
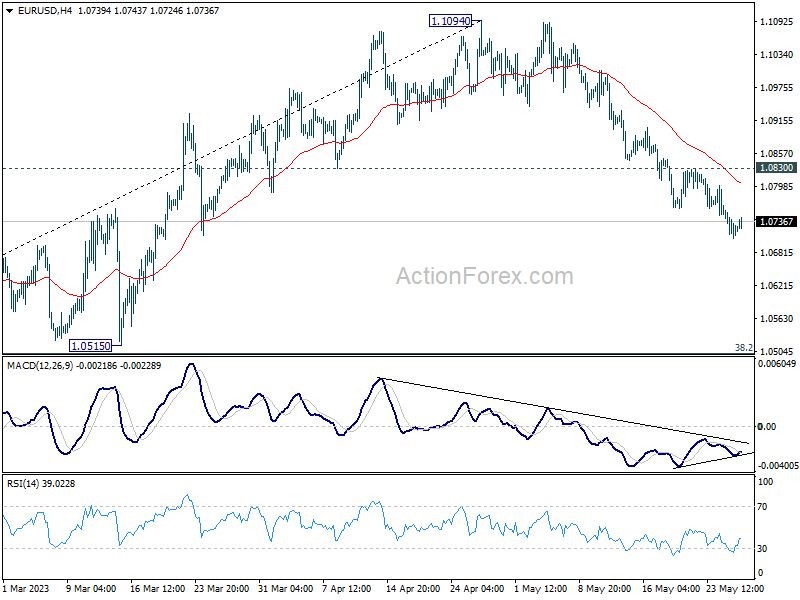
Daily Pivots: (S1) 1.0703; (P) 1.0730; (R1) 1.0752; More...
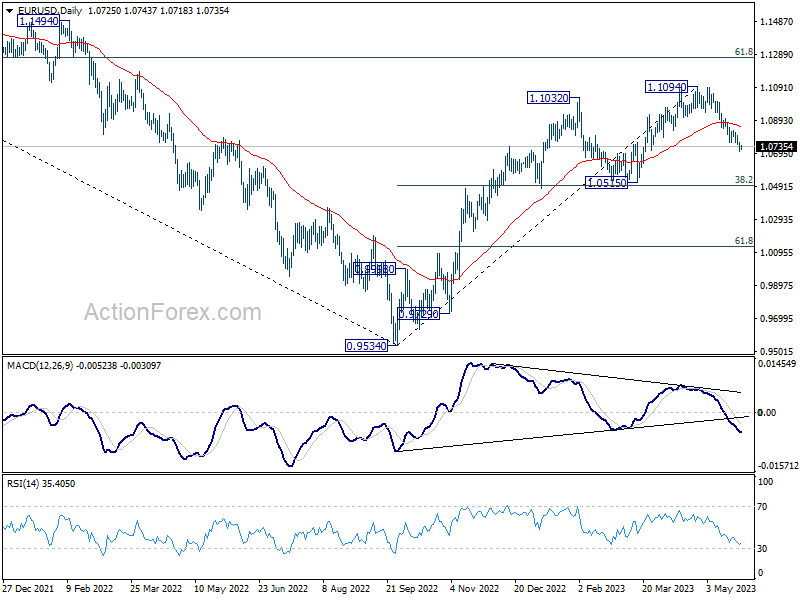
EUR/USD is losing some downside momentum as seen in 4H MACD. But further decline is still expected as long as 1.0830 resistance holds. Current fall from 1.1094 is seen as correcting whole up trend from 0.9534. Deeper decline should be seen to 1.0515 cluster support, 38.2% retracement of 0.9534 to 1.1094 at 1.0498. On the upside, above 1.0830 minor resistance will turn bias to the upside for stronger rebound.
In the bigger picture, as long as 1.0515 support holds, rise from 0.9534 (2022 low) would still extend higher. Sustained break of 61.8% retracement of 1.2348 (2021 high) to 0.9534 at 1.1273 will solidify the case of bullish trend reversal and target 1.2348 resistance next (2021 high).
NZD/USD: The Intermediate Impulse is Half Built – We are Waiting for Its Continuation
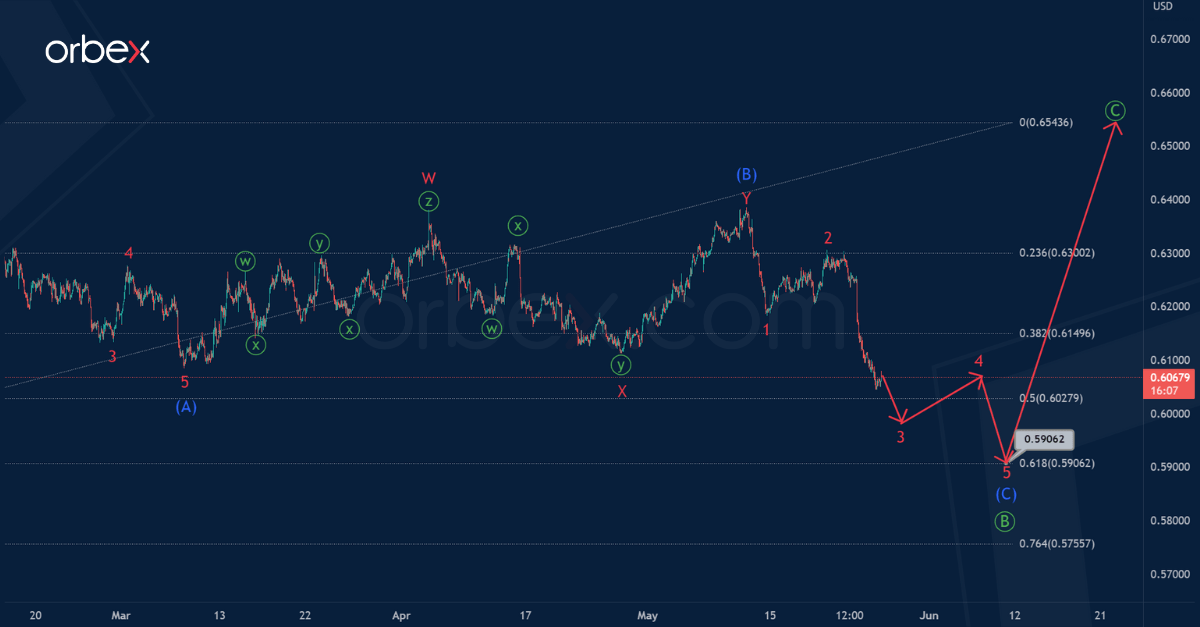
We talked about NZDUSD three weeks ago. The pair presumably builds a correction zigzag pattern consisting of three primary waves Ⓐ-Ⓑ-Ⓒ.
Primary impulse wave Ⓐ completed successfully. The bearish correction Ⓑ is under development, its structure is similar to the standard zigzag (A)-(B)-(C). Impulse (A) and correction (B) can be considered completed, it is a minor double zigzag.
Now the price is moving down in the intermediate impulse (C) towards 0.590. At that level, primary correction Ⓑ will be at 61.8% of actionary wave Ⓐ.
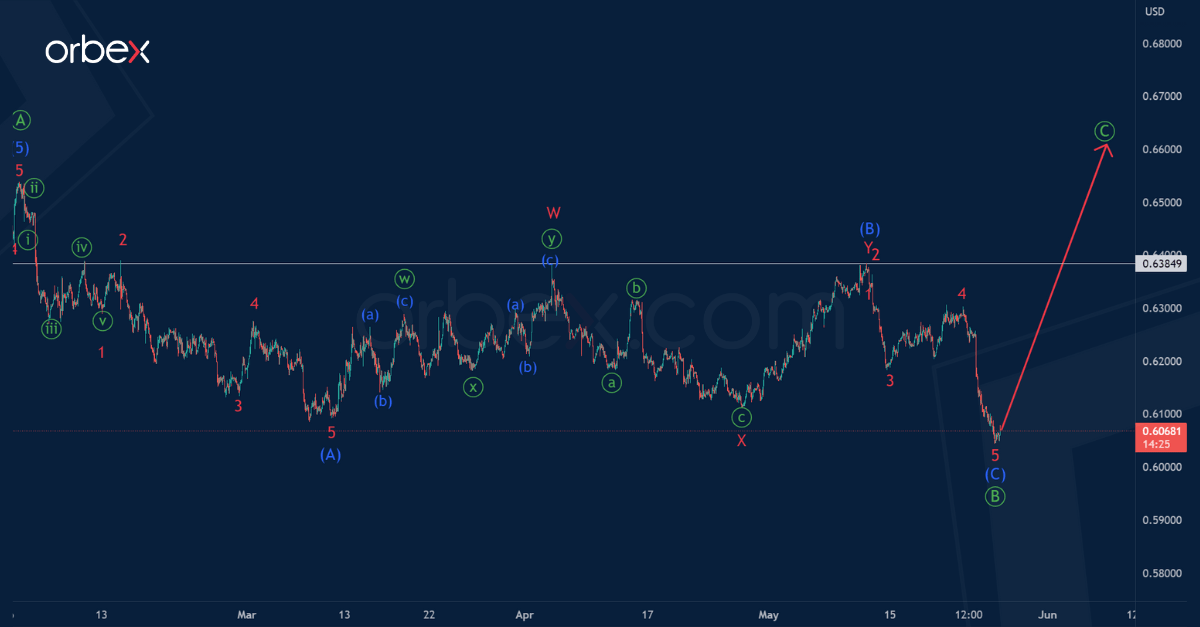
Alternatively, the primary correction Ⓑ could be fully completed. It is a standard intermediate zigzag (A)-(B)-(C). The intermediate sub-waves (A) and (C) are impulses, correction (B) has the form of a double zigzag.
Thus, if the current option is confirmed, in the near future market participants may expect the development of the initial part of the final wave Ⓒ.
The first target for the bulls is a maximum of 0.638. The minor sub-waves W and Y of the correction (B) were completed on it.
US PCE Deflators and Durable Goods Orders Scheduled
Markets
UK bonds crashed for a second day straight with yields adding 10.6-19.2 bps across the curve. UK money markets discount an additional 100 bps tightening by December following the big upside CPI surprise Wednesday morning. Sterling initially revisited YtD highs but unable to force a break higher, technical return action kicked in. EUR/GBP eventually closed narrowly above 0.87. Bonds in the US and Germany slid as well with huge underperformance of the former. US yields ripped between 0.9 (30-y) and 15.6 (2-y) bps higher. Second-tier but above-consensus data including weekly jobless claims spurred the move with recessionary along with financial stability concerns easing. Markets even fully priced in a July rate hike. Optimism about US negotiators reaching a debt ceiling deal also helped sentiment. A two-year suspension in return for spending cuts is on the table. German yields followed from a distance. Changes varied from +3.7 to 6.2 bps with the belly underperforming the wings and the 10-y yield testing the 2.53% resistance area. ECB’s Nagel, Knot and Villeroy hit the wires on a hawkish note. The US dollar performed strongly, even as Wall Street posted gains up to 1.7% (Nasdaq, Nvidia-sparked rally). EUR/USD closed around important support of 1.0727. The trade-weighted index took a look beyond 104.089 resistance to close at 104.25 – the highest since mid-March. USD/JPY ventured north of 140 for the first time since November last year.
The Asian session this morning is a quiet one. Aside from Tokyo CPI (see below) there’s little news. Speaker of the House McCarthy vowed to continue working until a debt ceiling deal is reached. We wouldn’t be surprised if they’d strike one during the weekend. In the run-up, we still have US PCE deflators and durable goods orders scheduled for release today. The former are the Fed’s preferred inflation gauge and seen accelerating from 4.2% to 4.3% on a 0.3% m/m pace for the headline. Core PCE should come in at an unchanged 4.6% (0.3% m/m). An outcome in line with expectations probably is enough to sustain the current bond yield trend, be it on a less blistering pace. The technical charts offer help as well with the US 2-y and 10-y yield surpassing 4.50% and 3.80% levels respectively. A weekly close above that level would be a major plus. This also goes for the DXY dollar closing above 104.089 level and EUR/USD sub 1.0727. Both levels are being tested as we write. UK April retail sales this morning surprised to the upside, with the core gauge double the 0.4% that was expected. It comes with a downward revision of the March figure though. EUR/GBP in a first reaction barely budges. The 0.87 big figure for the time being survives.
News and views
The Reserve Bank of South Africa yesterday raised its policy rate by 50 bps to 8.25%. This was expected by the majority of analysts. The Bank slightly upwardly revised its growth forecast for this year from 0.2% to 0.3%. Expected growth for 2024 and 2025 was left unchanged at 1.0% and 1.1% respectively. Forecasts for 2023 and 2024 inflation were raised to 6.2% (from 6.0) and 5.1% (from 4.9%). The SARB targets an inflation between 3-6%. Risks to the inflation outlook still are assessed as being to the upside. At the current repurchase rate level, policy is labelled as being restrictive, consistent with elevated inflation and risks. The Bank also sees a growing external financing need with the current account deficit expected to rise from 2.5% this year to 3.6% in 2025. SARB Governor Kganyago mentioned the risk that globally tighter financial conditions are raising the risk profiles of countries needing foreign capital. In this respect, the rand weakened sharply further yesterday reaching a record low against the dollar near USD/ZAR 19.84.
Inflation excluding fresh food in the Tokyo area in May slowed more than expected from 3.5% on April to 3.2%. At the same time, the core measure excluding food and energy unexpectedly rose from 3.8% to 3.9%, the highest level in more than 40 years. The Tokyo data are seen as a good precursor for the national data. The data suggest that inflation still might hold above the BoJ 2.0% inflation target for quite some time, fueling the debate whether the Bank should gradually tweak its ultra-easy policy. The combination of higher US yields recently and the ongoing easy policy stance of the BoJ overnight temporarily propelled the USD/JPY cross rate north of the psychological barrier of 140 (currently 139.7).
AI-Bubble in the Making?
Nvidia’s impressive Q1 results and the $11bn revenue forecast for the second quarter blew investors’ minds away.
Major US stock indices gained yesterday. The S&P500 added 0.88%, while Nasdaq 100 jumped almost 2.50%, thanks to a 24% rally in Nvidia which rocketed to a fresh-all-time high of almost $395 a share. The company is now just shy of a trillion-dollar valuation, and is worth more than Tesla (market cap of around $580bn), Meta (around $650bn) and more than Intel, Broadcom and TSM combined.
So, we are naturally brought to ask whether this year’s tech rally hasn’t stretched too far. Fidelity’s MSCI Information Technology ETF, which allocates 23% to Apple, 19% to Microsoft and 6% to Nvidia was up by more than 3.50% yesterday, and 40% since last October 2022 dip. It currently trades 30 times the earnings, while the S&P500’s PE ratio is only around 22.
In compassion, Nvidia’s PE ratio spiked to 219 yesterday.
Consequently, we are probably seeing a bubble in the making in the AI related stocks. Although no one questions the potential of AI, the valuations seem to have gone ahead of themselves and it could soon be time for correction.
Still no deal
The technology stocks were euphoric yesterday, but the rest of the sectors were much less appetizing. US debt ceiling talks continued, there was again some optimism on the headlines, but no deal has been reached and the clock is ticking louder into the June1st deadline. The US Treasury’s cash balance fell below $50bn on Wednesday, and as Janet Yellen warns so loudly, the US may not reach the mid-June safe zone, where the tax money will fall in, to avoid a default.
If investors are not extremely worried about the debt ceiling talks, it’s because they know it’s just an unnecessary political theater and that the debt ceiling will end up being raised, anyway.
But in the extreme event of a political accident, the consequences would be catastrophic. US and global stocks could dive more than 20% and the US’ self-induced economic crisis would push the world economy into a deep recession by the end of the year.
Speaking of recession…
Germany doesn’t need a US political accident to have a taste of recession. Data released yesterday revealed that the German GDP shrank 0.3% in Q1, following a 0.5% contraction the quarter earlier. Despite the mild winter and no energy shortage, the German economy – so reliant on cheap Russian energy - couldn’t avoid recession at the second winter of the Ukrainian war.
As such, Germany became the first big nation to enter recession since the pandemic. High energy costs, high inflation and the aggressive European Central Bank (ECB) policy tightening took a toll on the world’s fourth biggest economy.
The disappointing German growth gave euro bears a solid reason to send the EURUSD below a Fibonacci support. The pair tipped a toe below the 1.0730 level, the minor 23.6% Fibonacci retracement on September to May rebound, and is struggling to hold ground just above this level this morning. Slowing German growth, combined with a 4.5% fall in Spanish yearly PPI figures clearly softened the ECB rate hike expectations.
Crude bounces lower after hitting important resistance
US crude fell more than 3% yesterday, after hitting the 50-DMA the day before on Saudi Prince Abdulazziz bin Salman’s threat to sellers.
Energy bulls found no solid ground to extend the rally above the 50-DMA, and the price of a barrel fell all the way down to the $70.80 pb.
OPEC will likely announce another output cut to boost prices when it meets next week, but any OPEC-led price boost to market prices should be interesting top selling opportunity as the Chinese reopening story doesn’t give a jolt to the global economy, Germany steps into recession, US recession odds increase by the day, with or without the debt ceiling deal, and there is little reason for the slowing economic trend to reverse.
And higher oil prices will only make global growth prospects worse, and may not even fill the coffers of OPEC as much as they wish.