Sample Category Title
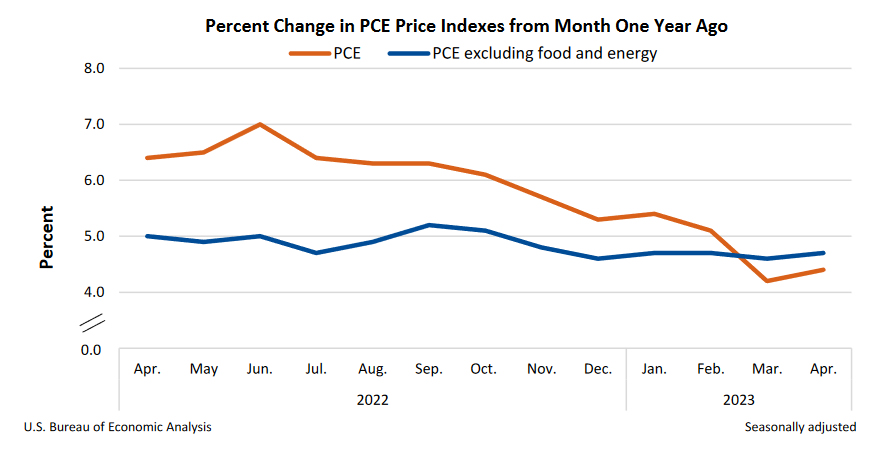
US PCE rose to 4.4% yoy, core PCE up to 4.7% yoy
US personal income rose 0.4% mom or USD 80.1B in April, matched expectations. Personal spending rose 0.8% mom or USD 151.7B, above expectation of 0.4% mom.
For the month, PCE price index rose 0.4% mom. Core PCE price index (excluding food and energy) rose 0.4% mom. Goods prices increased 0.3% mom while services prices increased 0.4% mom. Food prices decreased less than -0.1% mom. Energy prices rose 0.7% mom.
From the same month one year ago, headline PCE price index rose from 4.2% yoy to 4.4% yoy, above expectation of 3.9% yoy. Core PCE price index also ticked up from 4.6% yoy to 4.7% yoy, above expectation of 4.6% yoy. Prices for goods were up 2.1% yoy and prices for services were up 5.5% yoy. Foods prices increased 6.9% yoy. Energy prices decreased -6.3% yoy.
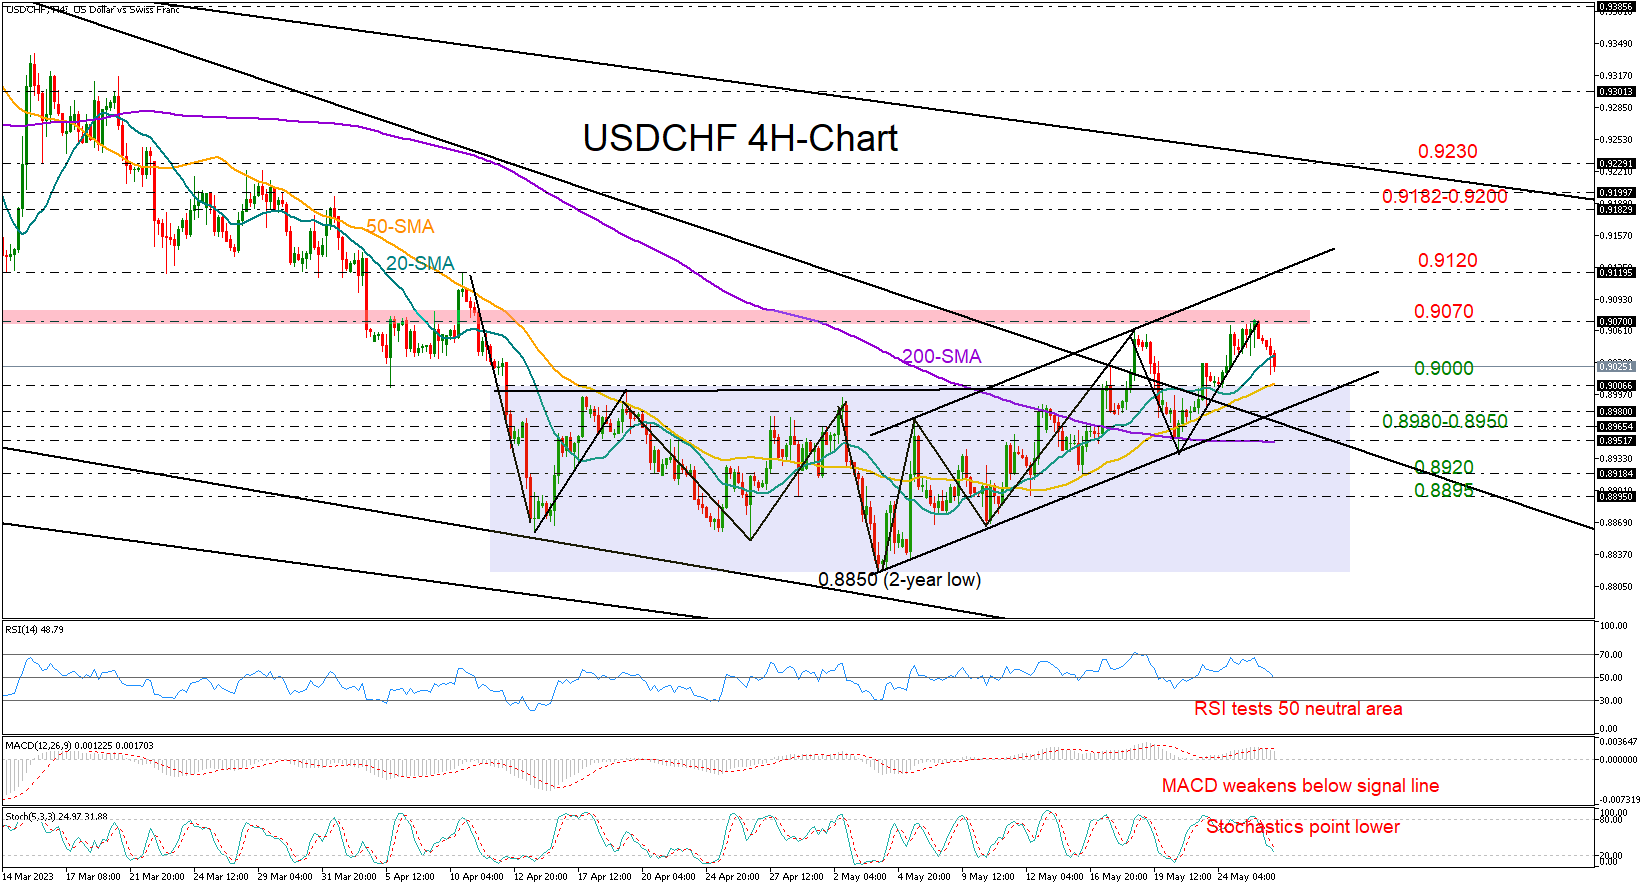
USDCHF Trims Gains Within Bullish Channel
USDCHF drifted down to 0.9017 after facing resistance around the familiar long-term constraining zone of 0.9070.
The negative slope in the RSI and the Stochastic oscillator on the four-hour chart suggests market sentiment may remain downbeat in the coming sessions. The MACD has slipped back below its red signal line, increasing the likelihood of another leg down too.
Still, with the pair trading within a bullish channel and having marked new higher highs above the 0.9000 level recently, which looks to be the neckline of an inverse head and shoulders pattern, the current downside move could be a corrective part of the upward pattern.
The 50-period simple moving averages (SMAs) could provide some footing at 0.9000 ahead of the channel’s lower boundary seen near 0.8980. Should the bears breach the latter point, the pair may have another opportunity for a rebound somewhere between the broken descending trendline from November 2022 at 0.8950 and the 200-period SMA. If the sell-off continues, the next floor could be around 0.8920 or lower at 0.8895.
On the upside, buyers will wait for an extension above 0.9070 before they target the channel’s upper band at 0.9120. Note that the price peaked around the same location on April 10th. Hence, a continuation higher could motivate fresh buying towards the 0.9180-0.9200 region. We will closely watch the key descending line from June 2022 as well at 0.9230.
Summing up, the ongoing bearish action in USDCHF could gain new legs in the short-term. That said, traders may not get upset unless the sell-off extends below the bullish channel and the 0.8950 level.
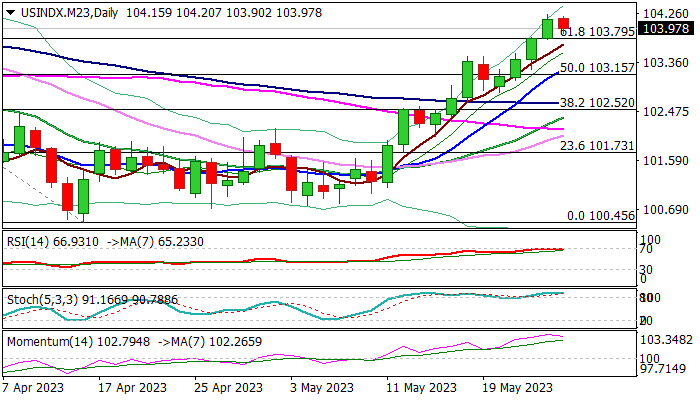
Dollar Index: Bulls Pausing After Strong Rally in Past Four Days
The dollar index price edges lower on Friday, as bulls take a breather after strong acceleration in past four days pushed the price to the highest in ten weeks.
The action was boosted by renewed expectations that the Fed may keep high interest rates for longer period, to curb stubbornly high inflation and uncertainty over debt ceiling talks.
Economic data from the US, released on Thursday, further brightened dollar’s outlook as first estimation of US Q1GDP was revised higher while the number of people applying for unemployment benefits fell below expectations last week.
Talks between the White House and Republicans on raising debt ceiling and avoiding catastrophic default scenario were so far unsuccessful, but overall tone is getting more optimistic and suggesting that two sides may reach the deal ahead of next Thursday’s deadline.
Eventual agreement would negatively impact dollar bulls on sidelining strong component of uncertainty, though other factors are expected to continue to fuel bulls and partially offset potential negative impact.
Friday’s price easing could be accelerated by profit-taking after four-day rally and ahead of extended weekend due to US bank holiday.
Overbought daily studies and 14-d momentum turning south contribute to such scenario.
Near-term action is holding above initial support at 103.79 (broken Fibo 61.8% of 105.85/100.45), with extended dips to find solid ground above the top of thick daily cloud, reinforced by daily Tenkan-sen (103.15) to keep bulls in play.
Res: 104.23; 104.70; 105.30; 105.55.
Sup: 103.79; 103.47; 103.15; 102.79.
WTI Oil: Oil Consolidating after Strong Fall on Thursday
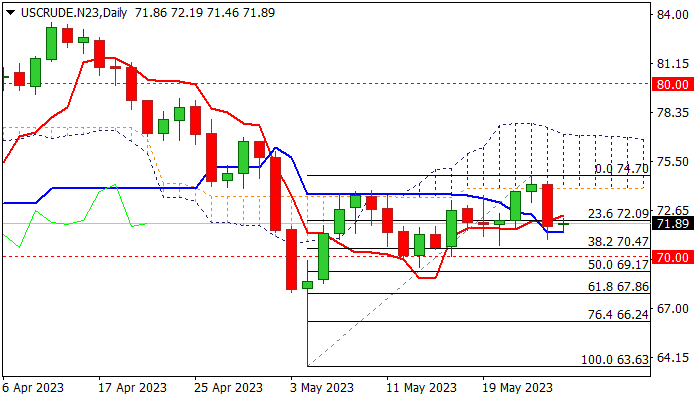
Oil price regained traction and edged higher on Friday morning, after falling over 3% previous day, following comments from Russian member of OPEC+ that the cartel is unlikely to further cut production at their meeting on June 4.
Thursday’s strong fall (the biggest daily loss since May 3) confirmed a double rejection at the base of thick daily cloud and generated bearish signal on completion of reversal pattern on daily chart, though the signal is still to be justified on break of $70.65/47 pivots (May 22 spike low / Fibo 38.2% of $63.63/$74.70 upleg).
Daily studies are turning to full bearish mode as falling 14-d momentum broke into negative territory, moving averages are in bearish setup and thick daily cloud weighs, suggesting that bears may re-take control after limited consolidation (to be capped under 5DMA at $72.75).
Weekly studies are also bearishly aligned, though the action of this week is on track to end in the shape of Doji candle, which signals indecision and seeks for fresh direction signal.
Res: 72.09; 72.75; 73.27; 73.93.
Sup: 71.39; 70.98; 70.42; 70.00.
ECB Lane: Reversal of energy prices will feed into lower core
ECB Chief Economist Philip Lane has asserted that falling energy prices could lead to lower core inflation due to reduced living costs and, consequently, restrained wage increases. However, he stressed the timeline and extent of this effect remain uncertain.
Speaking at a conference in Dubrovnik, Lane said, "I don't think it's symmetric... but when energy prices fall, core inflation does follow, because there is less pressure from an energy cost, there's less pressure on the cost of living, therefore on nominal wage increases
"So, we do think this spectacular reversal of energy prices will feed into lower core, but the timeline for that and the scale of it is uncertain," he added.
Lane further observed that wage growth is generally progressing at a moderate pace, with many people still bound to older contracts. "The latest deals are coming in at above 5%, but (this is in the) ballpark of what we expect," he noted.
Despite this, he expects nominal wage growth to peak this year and suggested it would take real wages until 2025 to recover back to their 2019 level.
GBP/JPY Daily Outlook
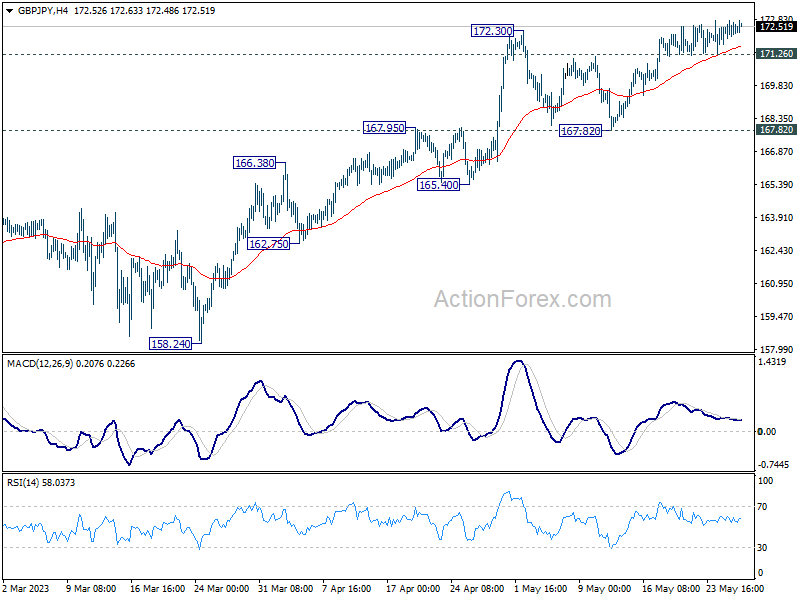
Daily Pivots: (S1) 171.92; (P) 172.35; (R1) 172.98; More...
While GBP/JPY continues to lose upside momentum,. there is no sign of topping yet. Further rally is expected with 171.26 minor support intact. Current rally should target 100% projection of 148.93 to 172.11 from 155.33 at 178.51. Nevertheless, break of 171.26 minor support will delay the bullish case, and turn bias to the downside for deeper retreat.
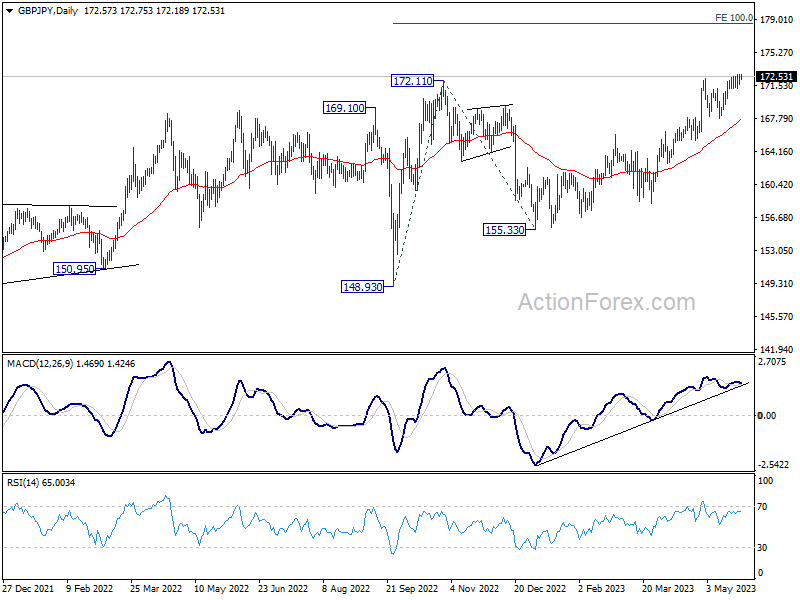
In the bigger picture, focus stays on 172.11 resistance (2022 high). Decisive break there will resume whole up trend from 123.94 (2020 low). Next target will be 161.8% projection of 122.75 (2016 low) to 156.59 (2018 high) from 123.94 at 178.69. Nevertheless, firm break of 165.40 support will indicate rejection by 172.11 and extend the corrective pattern from there with another falling leg.
EUR/JPY Daily Outlook
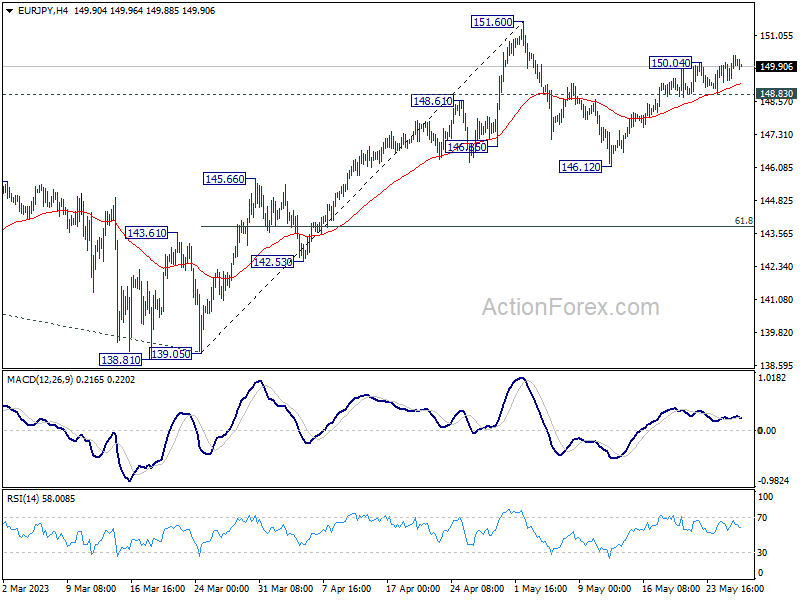
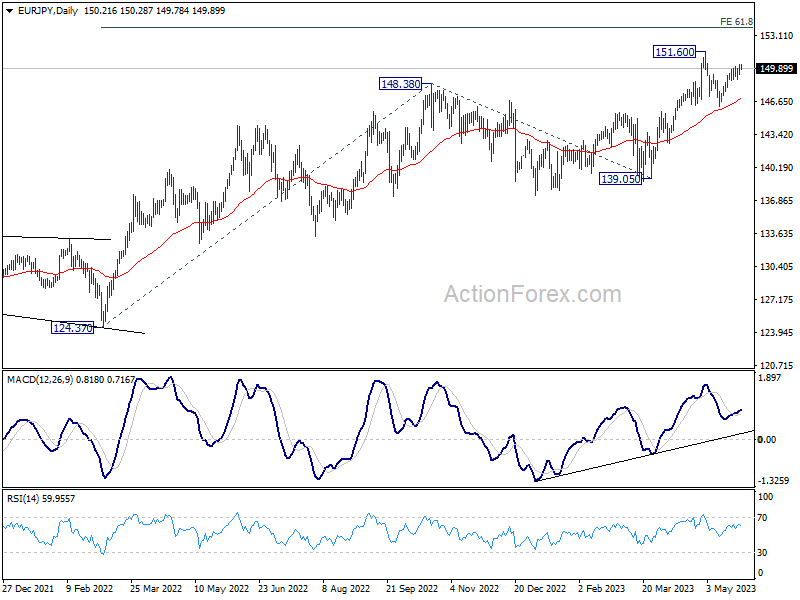
Daily Pivots: (S1) 149.56; (P) 149.94; (R1) 150.57; More....
Intraday bias in EUR/JPY is back on the upside with break of 150.04 temporary top. Rebound from 146.12 is in progress for retesting 151.60 high. Decisive break there will resume larger up trend. On the downside, however, break of 148.83 minor support should extend the corrective pattern from 151.60 with another falling leg towards 146.12.
In the bigger picture, rise from 114.42 (2020 low) is in progress. Next target is 61.8% projection of 124.37 to 148.38 from 138.81 at 153.64. Sustained break there will pave the way to 100% projection at 162.82. For now, medium term outlook will remain bullish as long as 139.05 support holds, even in case of deep pull back.
EUR/GBP Daily Outlook
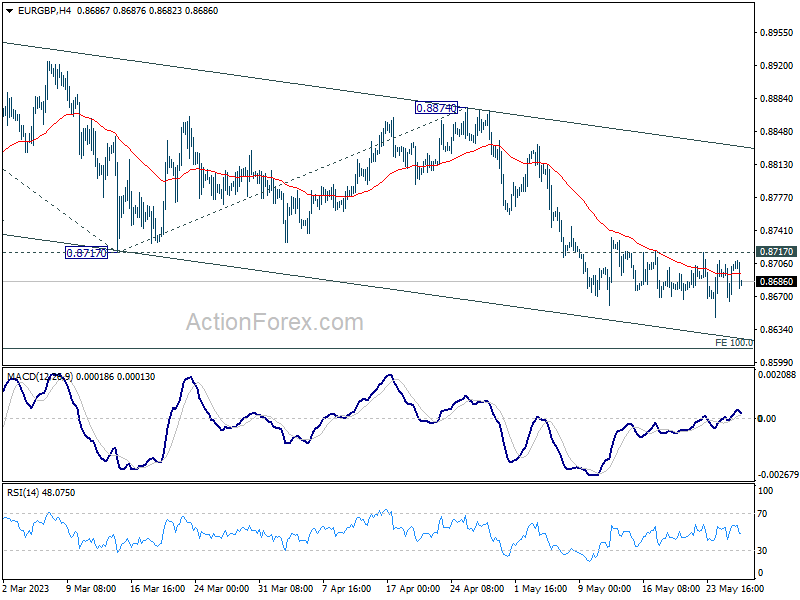
Daily Pivots: (S1) 0.8678; (P) 0.8692; (R1) 0.8718; More...
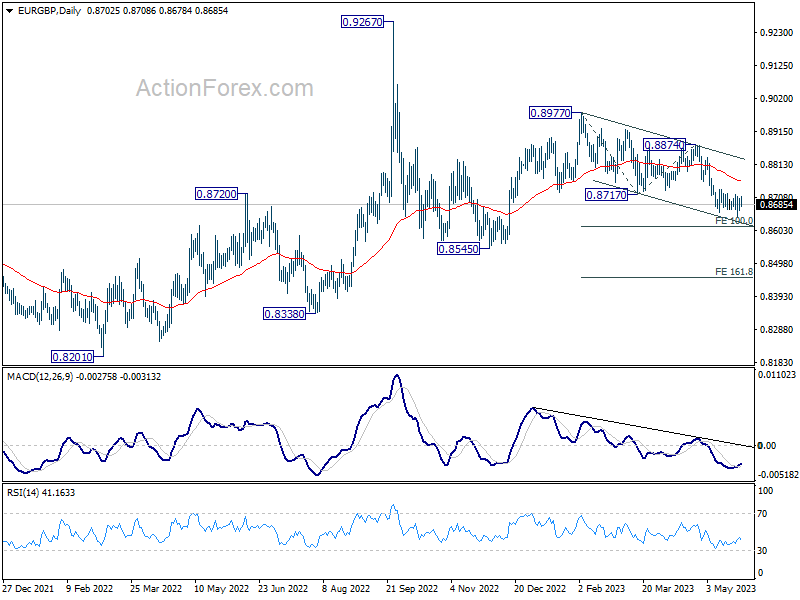
Further decline is still in favor in EUR/GBP with 0.8717 resistance intact. Current fall from 0.8977 should target 100% projection of 0.8977 to 0.8717 from 0.8874 at 0.8614. On the upside, however, break of 0.8717 will indicate short term bottoming, and turn bias back to the upside for stronger rebound.
In the bigger picture, current development argues that whole decline from 0.9267 (2022 high) is still in progress. This is part of the long term range pattern from 0.9499 (2020 high). Deeper fall would be seen through 0.8545 support. This will now remain the favored case as long as 0.8874 resistance holds.
EUR/AUD Daily Outlook
Daily Pivots: (S1) 1.6430; (P) 1.6464; (R1) 1.6520; More...
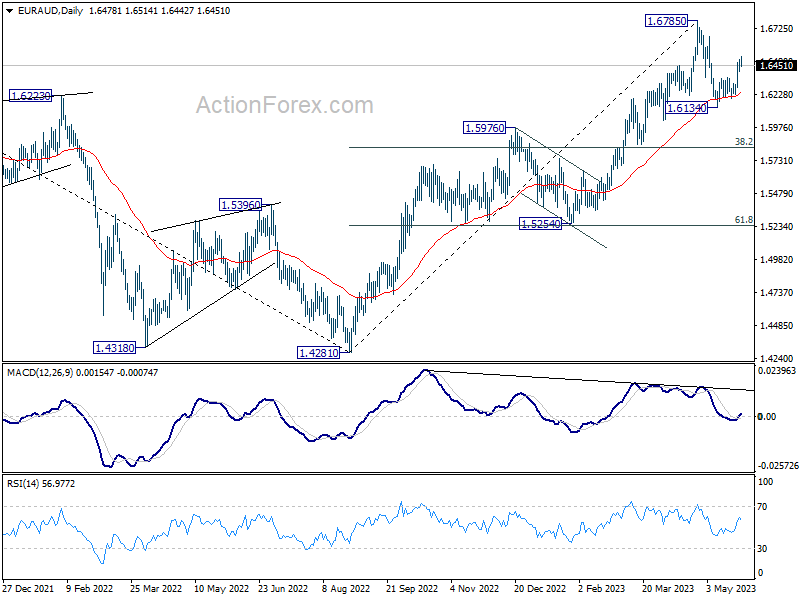
Intraday bias in EUR/AUD stays on the upside for the moment. Pull back from 1.6785 should have completed at at 1.6134, after drawing support from 55 D EMA (now at 1.6222). Further rally should be seen to retest 1.6785 high next. On the downside, however, break of 1.6309 minor support will dampen this view and turn bias neutral first.
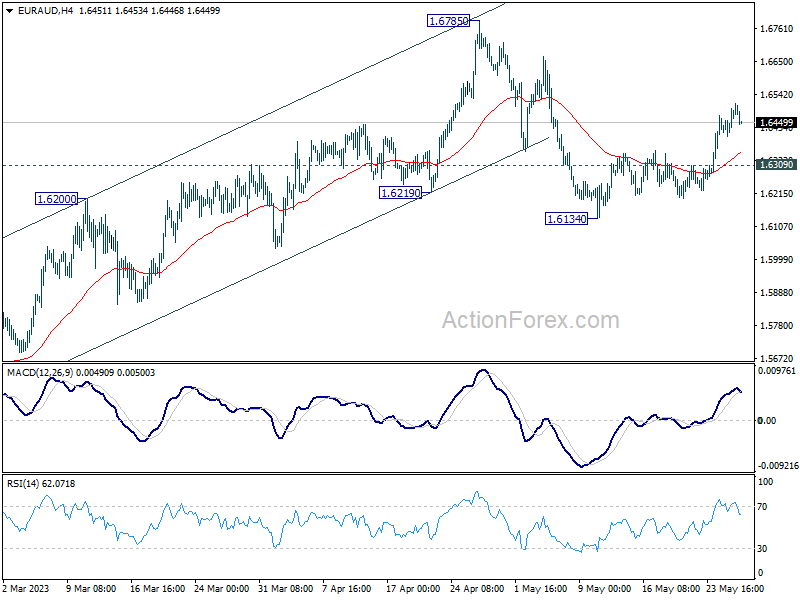
In the bigger picture, whole down trend from 1.9799 (2020 high) should have completed at 1.4281 (2022 low). Further rise should be seen to 61.8% retracement of 1.9799 to 1.4281 at 1.7691 next. For now, outlook will stay bullish as long as 1.5976 resistance turned support holds, even in case of deep pull back.
EUR/CHF Daily Outlook
Daily Pivots: (S1) 0.9699; (P) 0.9717; (R1) 0.9733; More...
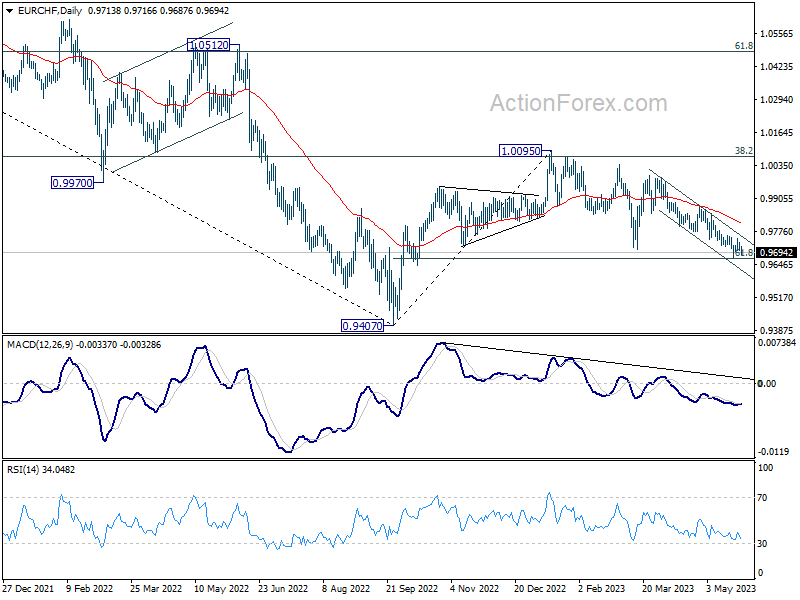
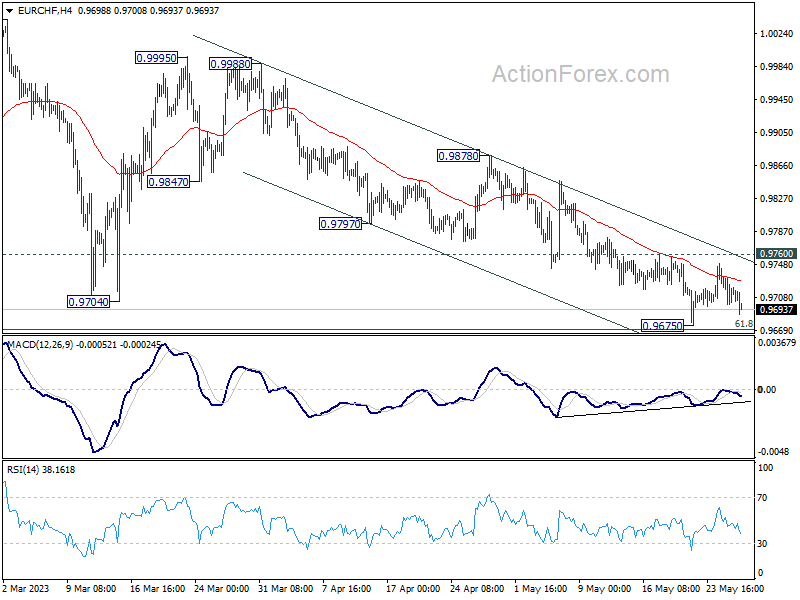
Intraday bias in EUR/CHF remains neutral for the moment. Strong support should still be seen around 61.8% retracement of 0.9407 to 1.0095 at 0.9670 to complete the whole corrective pattern from 1.0095. On the upside, firm break of 0.9760 resistance will confirm short term bottoming, and turn bias back to the upside for 0.9878 resistance next. However, sustained break of 0.9670 will pave the way back to 0.9407 low instead.
In the bigger picture, prior rejection by 38.2% retracement of 1.1149 to 0.9407 at 1.0072 suggests that medium term outlook is staying bearish. The pair is also capped below 55 W EMA (now at 0.9963). Down trend from 1.2004 is not completed yet and is in favor to resume through 0.9407 at a later stage. However, decisive break of 1.0095 resistance will raise the chance of bullish trend reversal. Rise from 0.9407 should then target 1.0505 cluster resistance (2020 low at 1.0505, 61.8% retracement of 1.1149 to 0.9407 at 1.1484).