

Sample Category Title
USD/CAD Daily Outlook
Daily Pivots: (S1) 1.3526; (P) 1.3565; (R1) 1.3635; More....
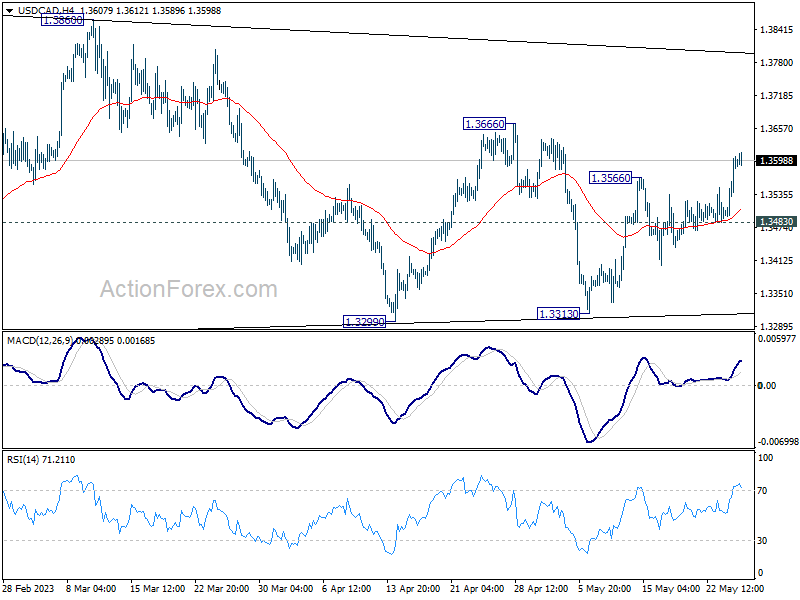
USD/CAD's rise from 1.3313 resumed by breaking through 1.3566 resistance and intraday bias is back on the upside. Break of 1.3666. will target 1.3860 resistance next. Price actions from 1.3976 are seen as a triangle consolidation pattern. Firm break of 1.3860 will argue that larger up trend is ready to resume through 1.3976 high. Nevertheless, break of 1.3483 minor support will turn intraday bias neutral again further.
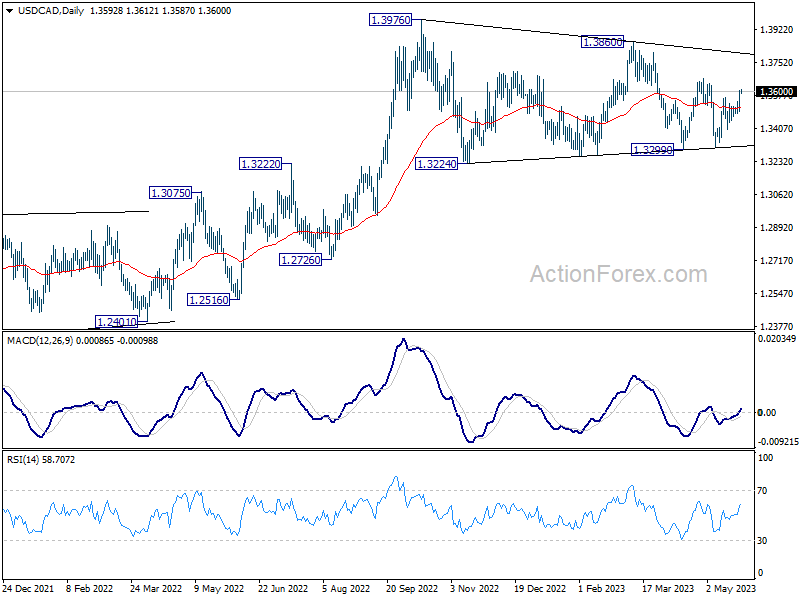
In the bigger picture, as long as 55 W EMA (now at 1.3333) holds, up trend from 1.2005 (2021 low) is still in favor to resume through 1.3976 at a later stage. However, sustained trading below the EMA and 38.2% retracement of 1.2005 to 1.3976 at 1.3233 will raise the chance of bearish reversal. Deeper should then be seen to 61.8% retracement at 1.2758 next.
NZD Turns Lower
NZD/USD breaks critical support
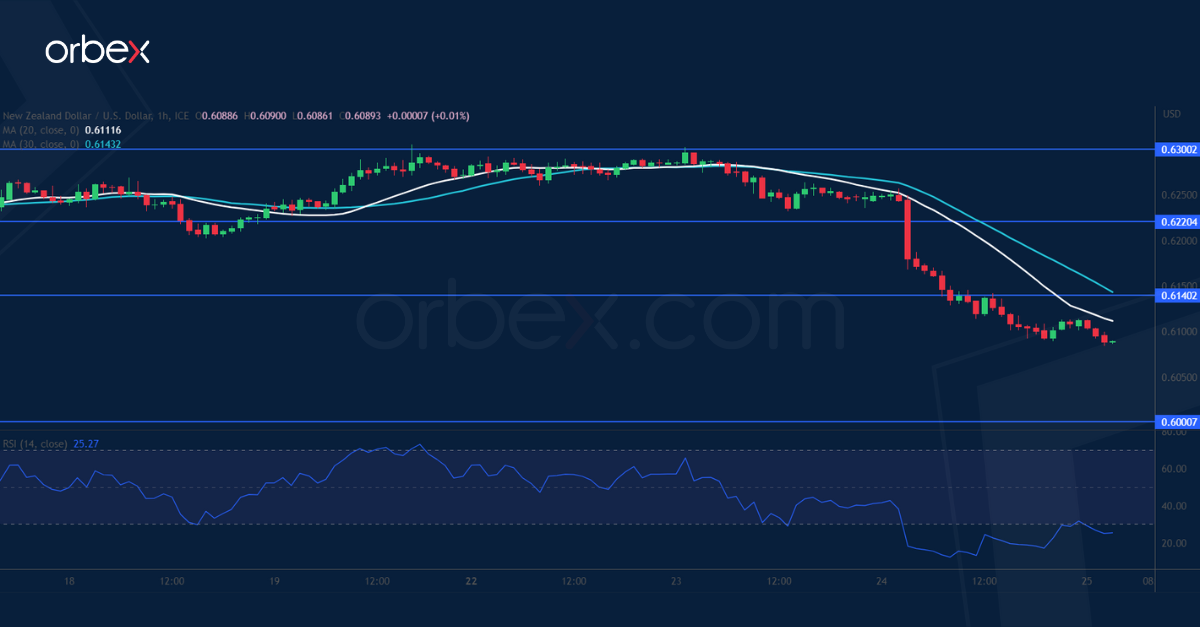
The New Zealand dollar plunged after the RBNZ put an end to its interest rate hikes. A sweep below the demand zone around 0.6200 was a sign of liquidation, invalidating the rebound over the past two months. Then a close below the double bottom around 0.6100 on the daily chart confirms that the bears have taken over, making the psychological level of 0.6000 the next stop. The RSI’s oversold situation might trigger a limited rebound but stiff selling pressure could be expected at the former demand zone near 0.6140.
GBP/USD struggles for bids
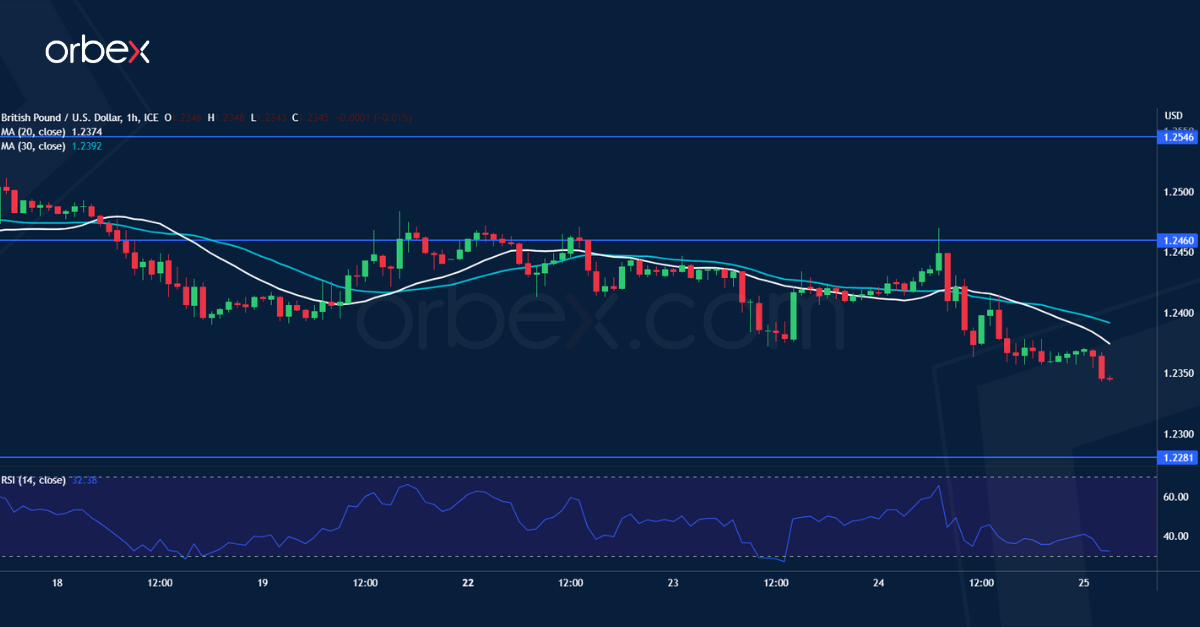
The pound softened after Britain’s services PMI fell short of expectations in May. A drop below the first daily support of 1.2450 has increasingly put the buy side on the defensive. Then a break below 1.2350 at the lower end of a previous consolidation and in the key demand zone of the daily chart would force more buyers out and stir up volatility, opening the door to a reversal to 1.2280 then 1.2200. On the upside, 1.2460 is the first obstacle to lift to stabilise the price before a recovery could materialise.
UK Oil to test key resistance
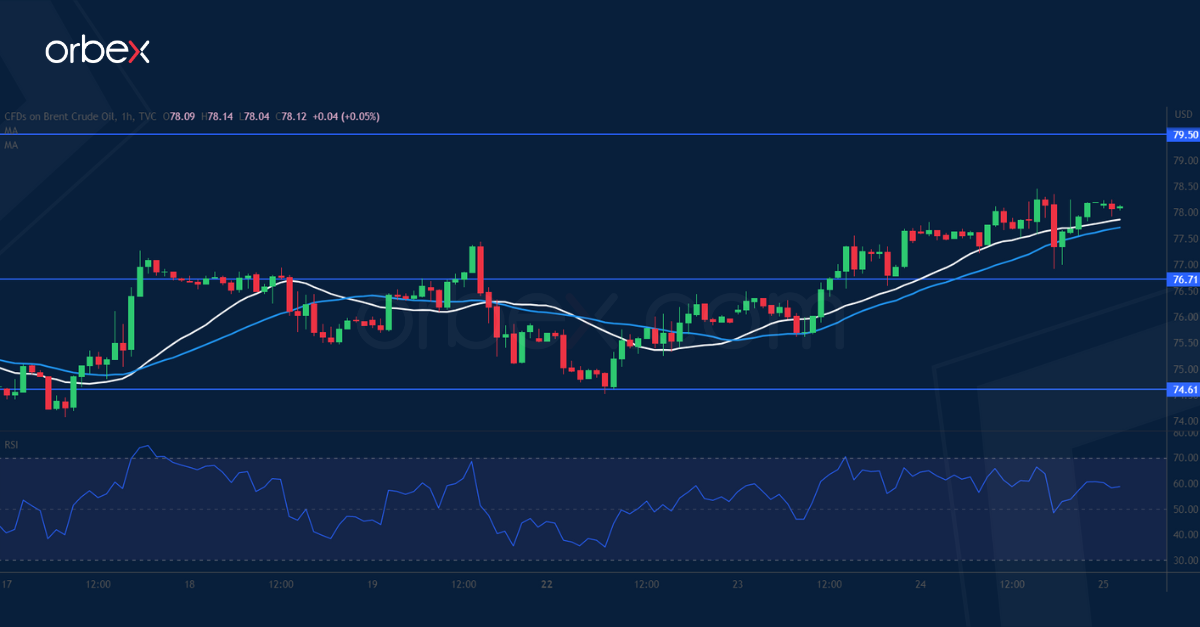
Brent crude bounces on rumours that OPEC+ could consider further production cuts. The bulls are striving to keep the late March rebound valid after the price seems to have secured a foothold above 71.50 with 76.70 as the closest support. A close above 77.50 suggests that the bounce is gaining traction and heading to its first major test at 79.50. A combination of profit-taking and fresh selling could be expected as the market mood remains cautious at best but a bullish breakout may pave the way for an extended rally.
Nvidia Jumps 25% as Earnings, Revenue Beat Estimates
US stocks and bonds fell on Wednesday as the US politicians still didn’t seal a deal to raise the debt ceiling and the Federal Reserve (Fed) minutes showed dissatisfaction with the speed at which inflation slows.
The Fed wants to either keep rates steady or further hike the rates to continue their battle against inflation.
The funny thing is inflation is good for reducing debt. Back in the 1940s, the US Treasury had forced the Fed’s hand to keep the rates at relatively low levels to tackle the exponentially rising debt – and the US has been successful in reversing the debt-to-GDP trend along with strong demographics and a solid post-war growth. But today, the central bank independence rules out any divine intervention from the treasury to keep the debt-to-GDP ratio in control, and the Fed is not helping to slow the US debt burden.
And now Fitch threatens to cut the US’ AAA rating as the political theatre has real-life implications for the economy, and for investors. JPM now sees the US default risk at 25% - whatever default means for them.
US T-bills maturing on June 6th are now yielding above 6.5% while those maturing by the end of the month are yielding just around 3%.
Besides the fact that the US could default on its payments, no one knows what default would look like to bond holders. Will the holders of the potentially defaulted bonds lose all, will they lose a couple of days payments, what will be the legal implications. No one wants to take the risk, or the headache until a debt ceiling deal is reached.
Nvidia’s shining like a new penny after Q1 results
Nvidia beat both earnings and revenue expectations in Q1. The shares soared nearly 25% in the afterhours trading on relief that investors were not fully wrong on betting that Nvidia would be the winner of the AI craze as its chips are well suited for training AI machines by bombarding them with data.
As a result, Nvidia will continue its journey to the moon. The shares were down almost 70% between the November 2021 all-time high and October 2022 dip. But today, not only have they entirely recovered 70% of losses, but the shares will be hitting a fresh record. What a comeback!
Zooming out, Nvidia’s 25% jump pushed Nasdaq futures up overnight, but the rising US yields on hawkish Fed comments and the debt ceiling saga which now turns into a credit downgrade threat for the US are not necessarily supportive of further easy gains.
The US 2-year yield is pushing steadily higher, while the probability of a June hike has now rose to around 30%.
There is now the talk that even if the Fed pauses in June, it will still raise in July. This is what people talk about when they say, the Fed will maybe ‘hop’ in June.
Today, the US GDP is expected to confirm a 1.1% growth in Q1, and a rise in PCE prices to 4.2%, from 3.7% printed a month earlier. Higher price pressures will certainly boost the Fed hawks, regardless of slowing growth, and loosening job market.
So, all this is reflected in a better appetite for the US dollar. The US dollar index is now preparing to test a minor Fibonacci resistance near the 104 level. And the EURUSD is a couple of pips to its own 23.6% Fibonacci support on its September to May rebound, which stands near the 1.0730 level.
Cable’s positive push following yesterday’s inflation print remained short-lived. Even though the UK inflation came as another slap on the Bank of England’s (BoE) face and revived the hawkish bets that the BoE’s policy rate will now peak around 5.5%, Cable slipped to the lowest levels since the beginning of May… but the UK’s 2-year yield jumped almost 6% yesterday and is getting closer to the levels last seen during Liz Truss’ mini budget chaos. Just saying…
Elsewhere, traders can’t have enough of shorting the yen against the dollar as well. The USDJPY is about to hit the 140 mark. The divergence between a still-hawkish Fed and sleeping BoJ pushes the spread between US and Japan to highest levels since March, meaning that buying USDJPY, or shorting yen against the US dollar continue to make perfect sense.
Oil Ignored Sour Risk Sentiment
Market movers today
Today in the US, we have revised Q1 GDP data. It will also be interesting to see if initial jobless claims continue higher.
The Swedish National Debt Office releases a new borrowing forecast, see more below.
The central bank of Turkey concludes a meeting where consensus is for an unchanged repo rate of 8.50%.
We will also keep an eye on the early May Tokyo inflation release we get overnight. Increasing inflation in Japan is adding pressure on the BoJ to loosen the grip on the yield curve.
The 60 second overview
US: FOMC minutes from the latest meeting dismissed the near-term possibility of rate cuts and signalled a more cautious stance on the need for more rate hikes. Finally, it repeated the message that the Fed stands ready to act if debt ceiling situation would risk financial stability.
Fed: Another day went by with no solution to the debt ceiling. House Speaker McCarthy said a deal was possible before 1 June, which could mark the so-called x-date, where US risks running out of money. Meanwhile anxiety grows in the T-bill market about what would happen if US reaches the debt ceiling. Yields on T-bills maturing in the first week of June rose to around 7% yesterday. Fitch moved US to 'rating watch negative', which threatens its AAA-rating.
Oil: Brent rose to around USD78/bbl yesterday as the oil market defied the overall setback in risk sentiment seen across equity markets and the rest of commodity markets. The weekly US inventory report showed further US selling of strategic reserves last week, albeit the pace of selling has slowed.
Equities: Global equities fell yesterday, reversing the Tuesday gains and rotations. Not one single trigger for the risk-off mode yesterday, but one could point at UK CPI, German IFO, FOMC minutes or lag of breakthrough in debt ceiling debt as arguments for taking some chips of the table. One thing for sure, Fed and BoE got reprised yesterday and correlation between yields and equities shifted back into negative territory. Hence, it would be fair to blame a bit of the risk-off on renewed inflation fear. In US yesterday Dow -0.8%, S&P 500 -0.7%, Nasdaq -0.6% and Russell 2000 -1.2%. Asian markets are lower this morning led by China while Japan is rising against the trend. Please note how Japan has been outperforming lately despite value being underperforming. US and European futures are marginally higher this morning. However, focus is on the Nasdaq futures rallying as much as 1.7% after Nvidia surged more than 25% on strong revenue outlook.
FI: Surprisingly high UK CPI data sent global yields higher from the morning, although seen over the day the European rates were broadly unchanged in the 5-10y region. The curve flattened from the long end as investors added further bp to the peak, further rate hikes both in the UK and the Euro area. For the ECB, markets added 3bp and are now pricing in a peak policy rate of 3.83% in ECB, which is the highest since one month ago.
FX: Overall poor risk sentiment continues to underpin the USD vs G10 peers. Meanwhile, divergent cross-Atlantic macro momentum (PMIs and IFO this week) helps pull EUR/USD lower. Scandies and antipodeans underperform. EUR/SEK took out a new year high and is now trading above 11.50 whilst EUR/NOK is stuck around 11.80.
Credit: The credit markets were categorised by a full risk-off session yesterday on the back of elevated concerns about the US debt ceiling. Itraxx Main widened 3bp to 84.6bp while Xover widened 12bp to 444.5bp. The otherwise very busy primary market took a breather yesterday, although still alive as exemplified by Stora Enso issuing a two tranched green EUR benchmark deal where the 3Y maturity fixed at 4% while the 6Y segment fixed at 4.3%.
Nordic macro
Sweden. Today the Swedish National Debt Office (SNDO) will present a new borrowing forecast. Central government budget outcomes for the three months since the latest borrowing forecast in February have surprised to the upside by some SEK30bn. We expect the Debt Office to adjust T-bill funding with corresponding amount but keeping bond issuance unchanged. The capital injection to Riksbank remains a clear upside risk to borrowing requirements later on, but as in February we expect the SNDO to leave it outside the forecast as the Riksbank have yet to specify the amount required. For a full preview, see Swedish Debt Office Preview, 17 May. We also get Statistics Sweden Labour Force Survey, which is likely to yet again show a very robust labour market following the PES data released earlier this month. We especially keep an eye on hours worked and how employment is developing.
Technical Outlook and Review
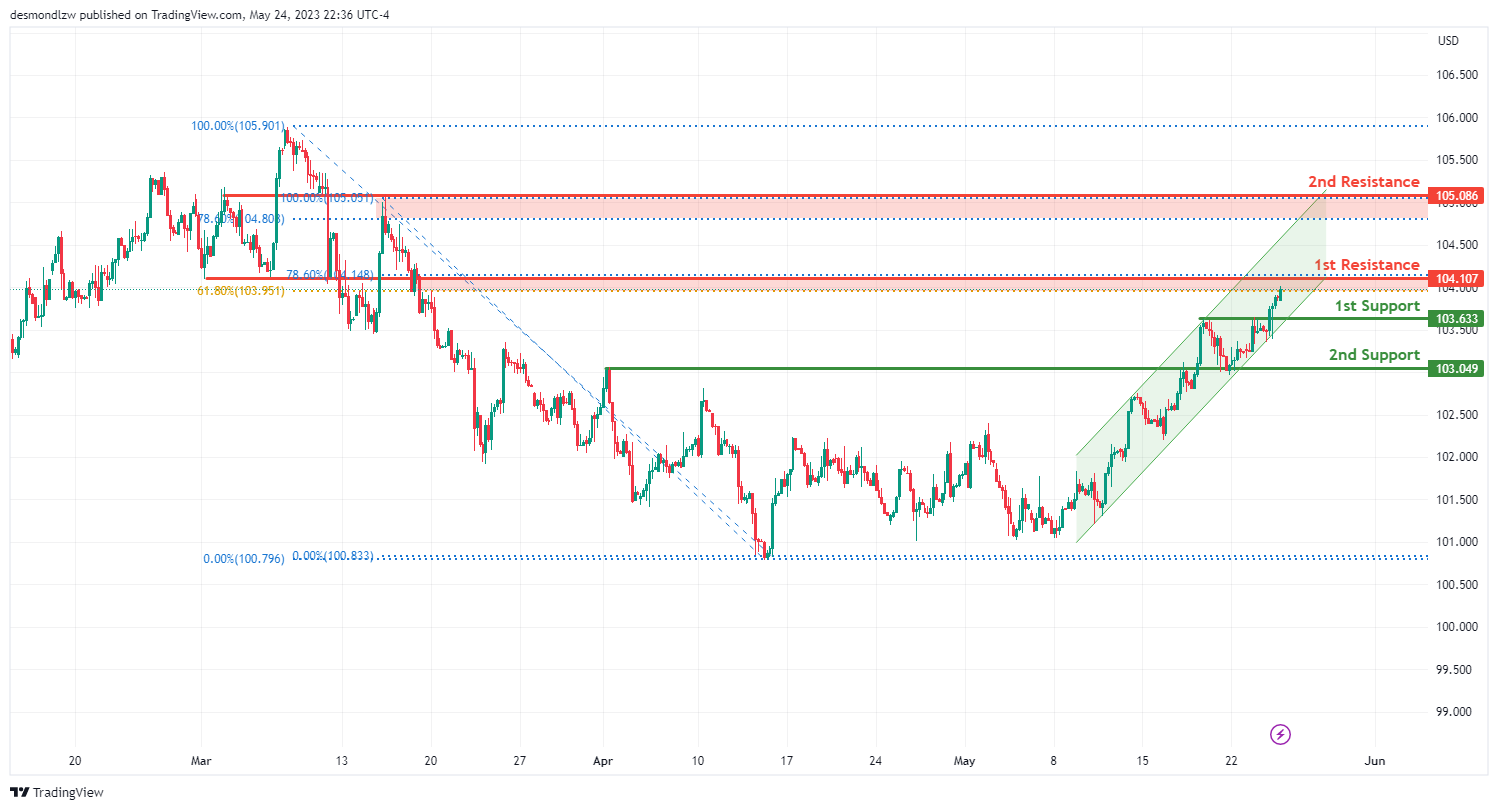
DXY:
The DXY chart is currently demonstrating bullish momentum. This trend is backed by the price movement, which is in a bullish ascending channel.
In the near term, the price could potentially decline further to the first support level at 103.63 before bouncing back and ascending towards the first resistance level. The first support level, identified as a multi-swing low support, may offer a strong base to prevent further price decline.
There is also a second support level at 103.04. This level, recognized as an overlap support, could also act as a floor to stop any further drop in price.
On the resistance side, the first resistance level at 104.10, which also serves as a pullback resistance, could challenge any upward price movement. This level is further reinforced by the presence of Fibonacci confluence, coinciding with the 61.80% and 78.60% Fibonacci retracement levels.
The second resistance level is at 105.08. Recognized as an overlap resistance and also aligning with the 78.60% Fibonacci retracement level, this could offer a significant barrier to any price increase.
EUR/USD:
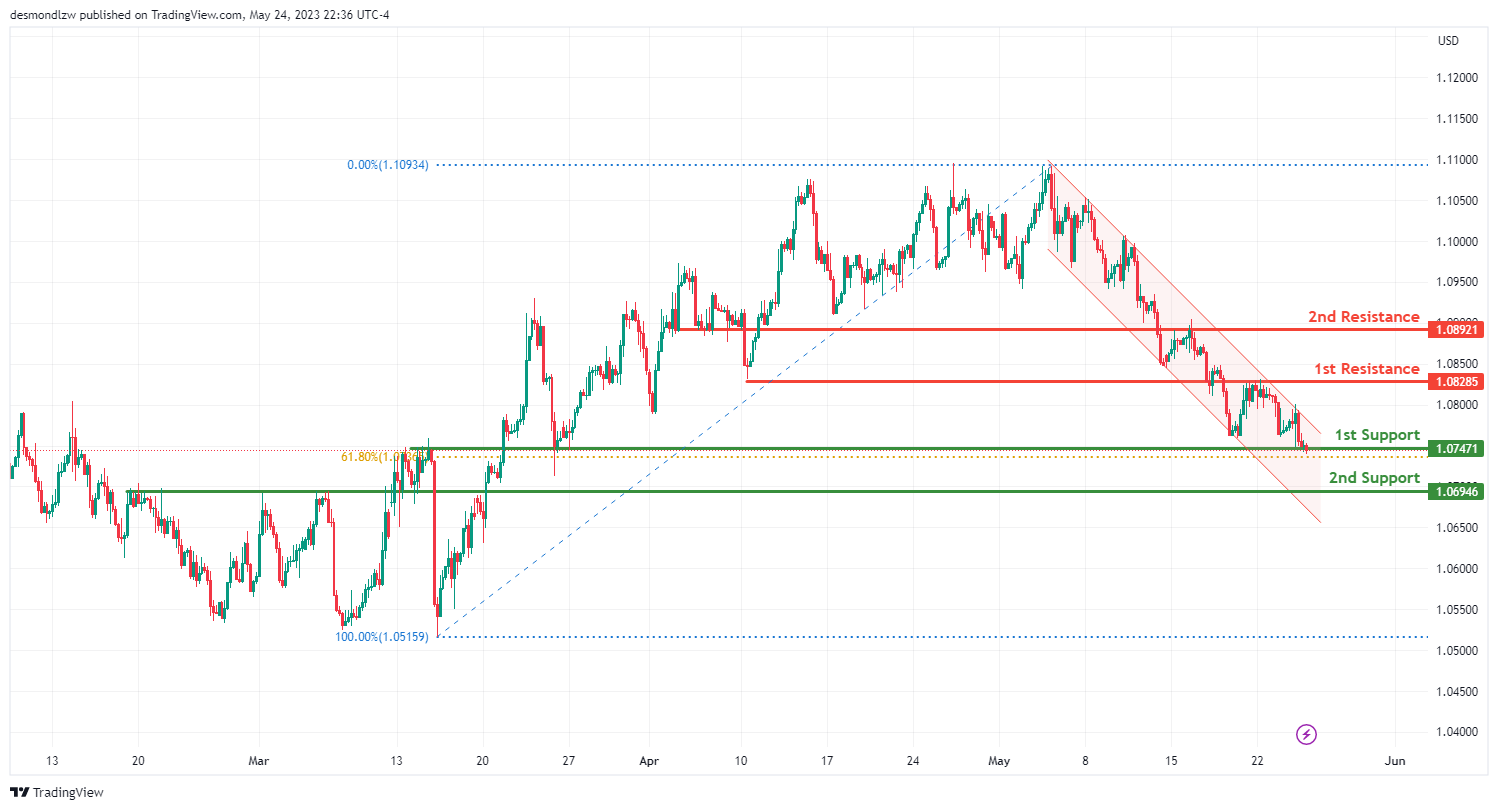
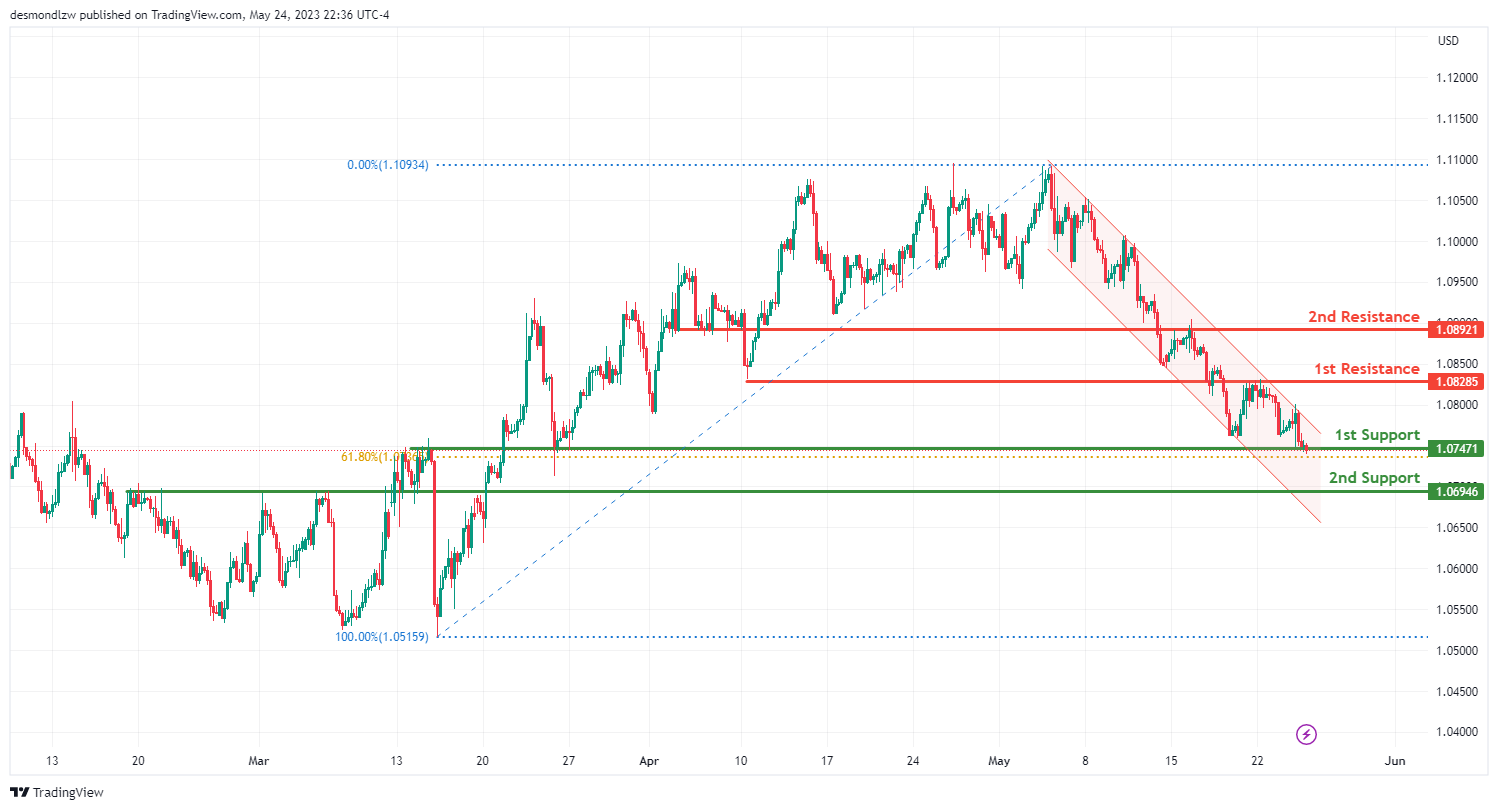
The EUR/USD chart is currently showing a bearish momentum, with the price being in a bearish descending channel. This suggests the possibility of a bearish reaction from the first support level, potentially leading to a drop towards the second support level.
The first support level is at 1.0747, which is an overlap support and aligns with the 61.80% Fibonacci retracement level. This suggests that it’s a significant level where the price could potentially halt or reverse its downward trajectory.
The second support level is situated at 1.0694, also identified as an overlap support. This could provide a further barrier to prevent any additional downward price movement.
Conversely, should the price attempt to reverse its bearish momentum, it could encounter resistance at 1.0828. This level acts as an overlap resistance and could potentially halt an upward price movement.
The second resistance level is at 1.0892, serving as another overlap resistance. This could present a significant hurdle for the price in the event of an upward swing.
GBP/USD:
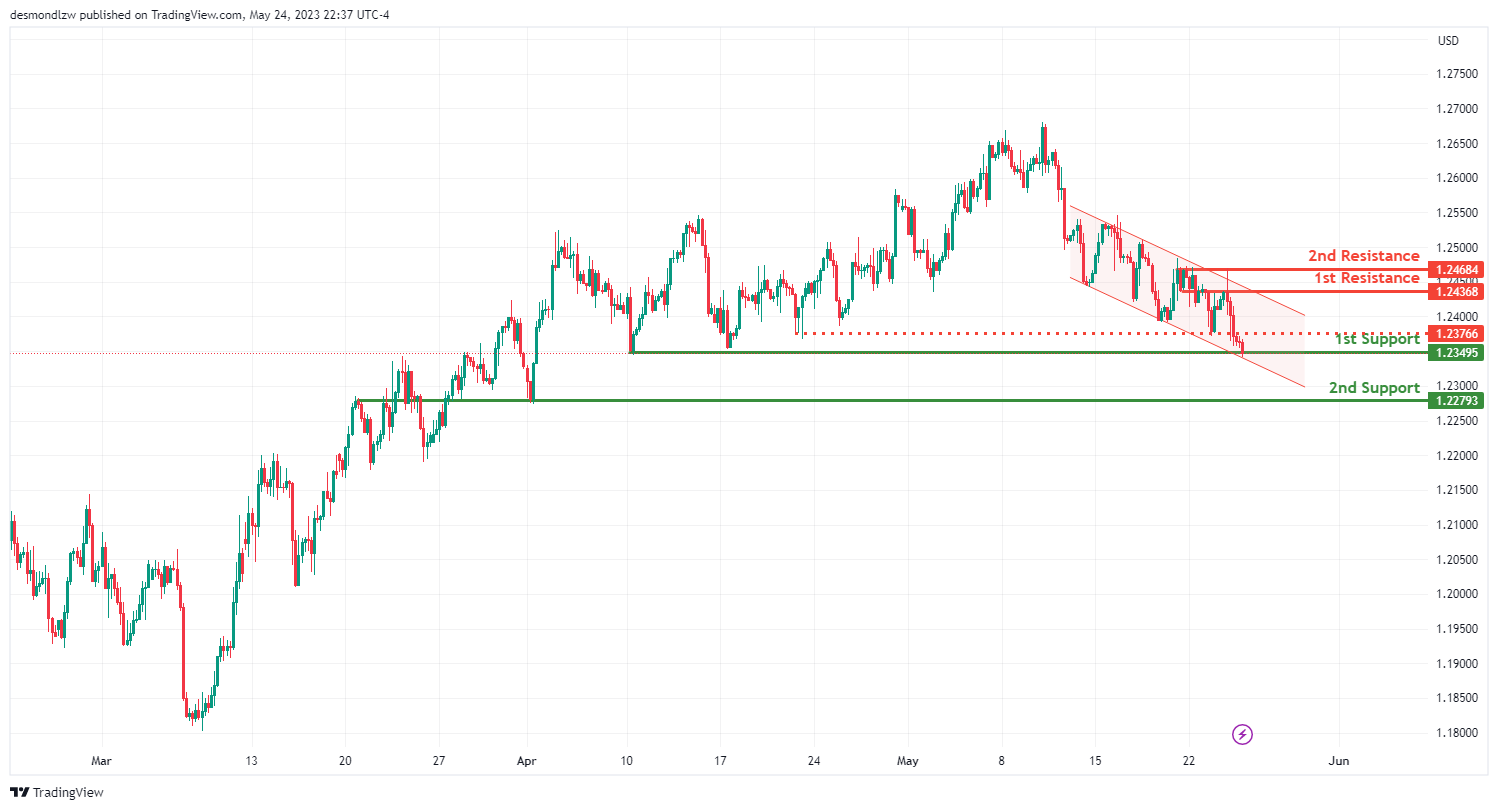
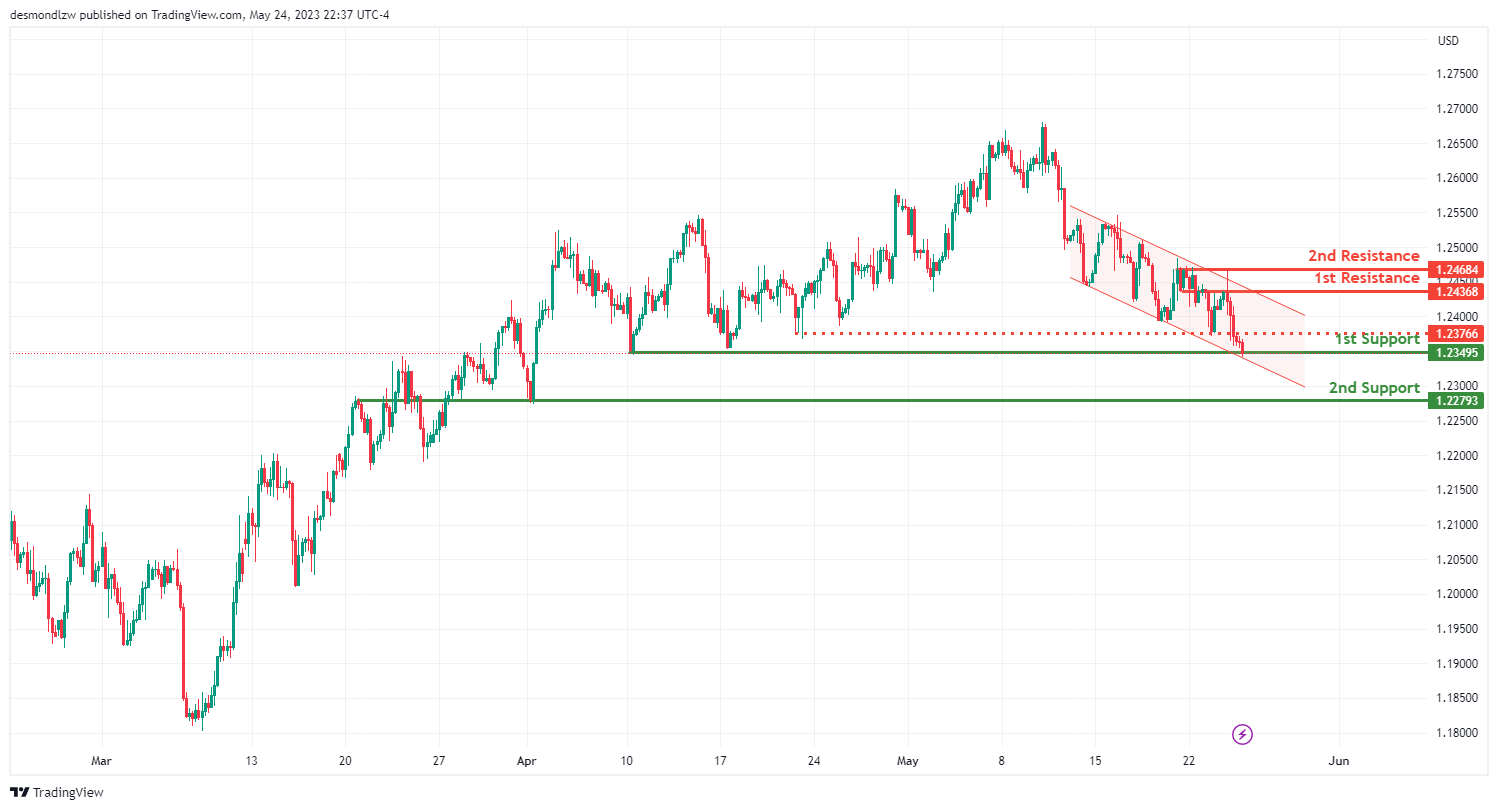
The GBP/USD pair currently shows a bearish trend, reflected by the price descending within a bearish channel. This hints at the likelihood of a bearish break from the first support level, which may subsequently lead to a drop towards the second support level.
The primary support level is positioned at 1.2747, which is recognized as a multi-swing low support. This denotes it as a level where the price has bottomed out multiple times in the past, providing a potentially robust level to halt further declines.
The secondary support level lies at 1.2279, which is known as an overlap support. This offers an additional potential floor to counter further downward movement in the price.
On the flip side, if the price attempts to reverse its current bearish direction, it could encounter resistance at 1.2436. This level is known as an overlap resistance, which could potentially curb any upward price movement.
The second resistance level is situated at 1.2468, which is recognized as a multi-swing high resistance. This indicates it as a level where the price has reached a peak multiple times in the past, thereby acting as a potential barrier against further increases in price.
Additionally, there is an intermediate resistance level at 1.2376, which serves as a pullback resistance. This could offer another potential barrier to upward movement in the price.
USD/CHF:
The USD/CHF chart is currently exhibiting bullish momentum, suggesting potential for continued upward movement as the price is above a significant ascending trend line.
In the short term, there’s a potential for a bullish break through the first resistance level at 0.9062, subsequently leading to a rise towards the second resistance level at 0.9097. The first resistance level is considered a multi-swing high resistance, indicating its significance as a potential price ceiling.
Additionally, the second resistance level is recognized as a pullback resistance, coinciding with a 127.20% Fibonacci Extension. This level further reinforces the potential for resistance in the event of a price increase.
On the support side, the first support level at 0.9005 is an overlap support, coinciding with a 50% Fibonacci Retracement, which may provide a solid base to halt any potential price pullbacks.
Furthermore, there’s a second support level at 0.8984, identified as an overlap support, contributing to the potential for support in case of a price decline.
Moreover, there’s an intermediate support level at 0.9028, acting as a pullback support, providing another potential base to halt any price declines.
USD/JPY:
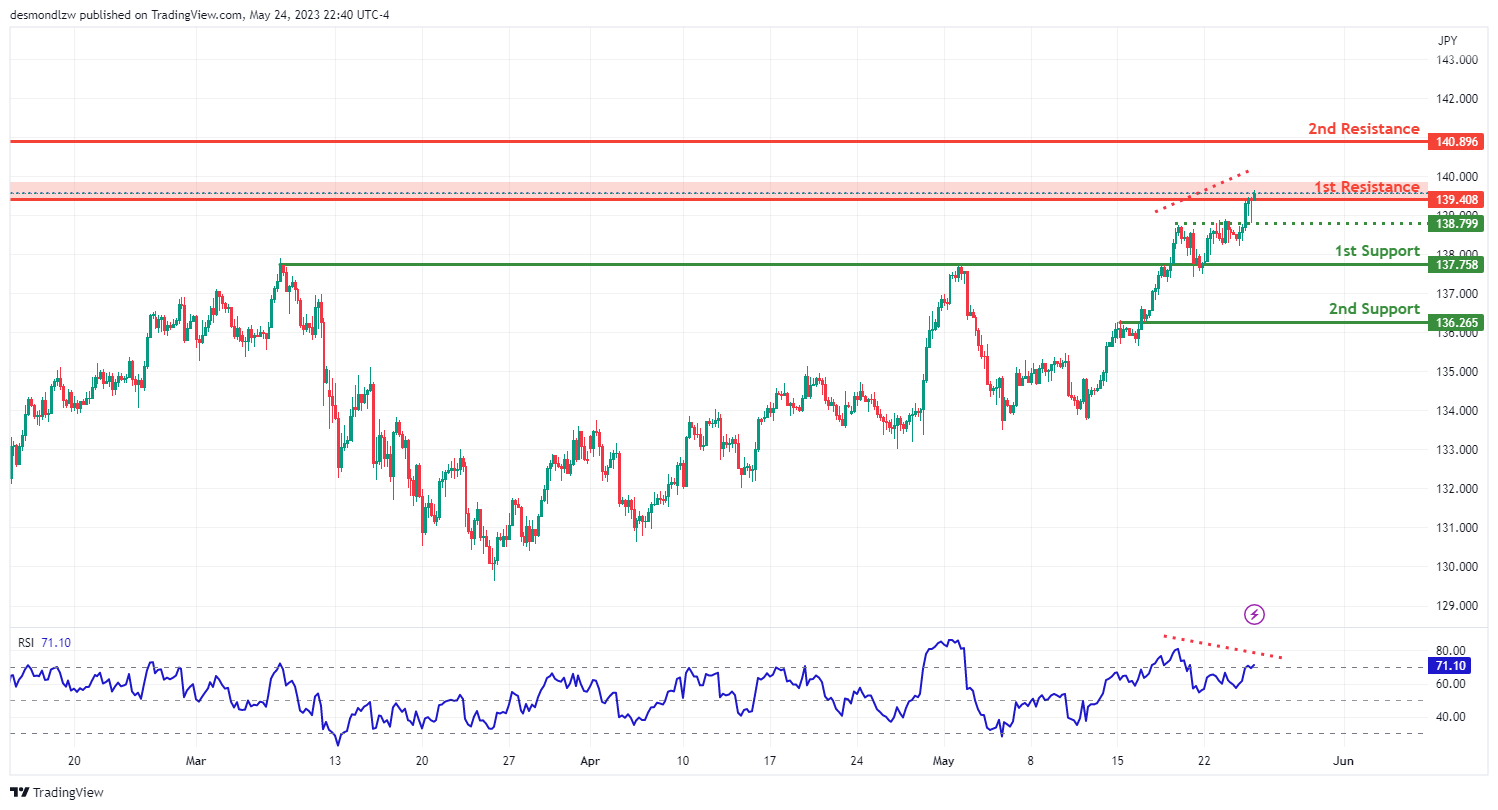
The USD/JPY chart is currently demonstrating a bearish trend, implying potential for continued downward movement.
In the short term, there’s a likelihood for a bearish reaction off the first resistance level at 139.40, leading to a drop towards the first support level at 137.75. The first resistance level is considered a multi-swing high resistance, indicating its significance as a potential price ceiling, and it coincides with a 50% Fibonacci retracement.
Additionally, there’s a second resistance level at 0.91, recognized as a pullback resistance. This level could further halt an upward price movement.
On the support side, the first support level at 137.75 is an overlap support, which might provide a solid base to prevent further price drops.
Furthermore, there’s a second support level at 136.26, also identified as an overlap support, contributing to the potential for support in case of a price decline.
Moreover, there’s an intermediate support level at 138.79, acting as a pullback support, providing another potential base to halt any price drops. The Relative Strength Index (RSI) is also displaying bearish divergence versus price, suggesting that a reversal might occur soon.
AUD/USD:
The AUD/USD chart is currently reflecting a bearish trend, indicating the likelihood of a further downward movement.
In the immediate future, there’s potential for a bearish continuation towards the first support level at 0.6508. This support level is identified as a pullback support and coincides with a 127.20% Fibonacci extension, suggesting its strength as a possible price floor.
Moreover, there’s a second support level at 0.6403, known as an overlap support. This level aligns with a 161.80% Fibonacci extension, providing another potential base in case of a downward price movement.
On the other hand, if the price attempts to reverse its bearish trend, it could encounter resistance at 0.6578, which is identified as a multi-swing high resistance. This level could potentially halt an upward price movement.
There’s a second resistance level at 0.6608, recognized as a pullback resistance. This level might further obstruct an upward price movement, should the trend reversal occur.
NZD/USD
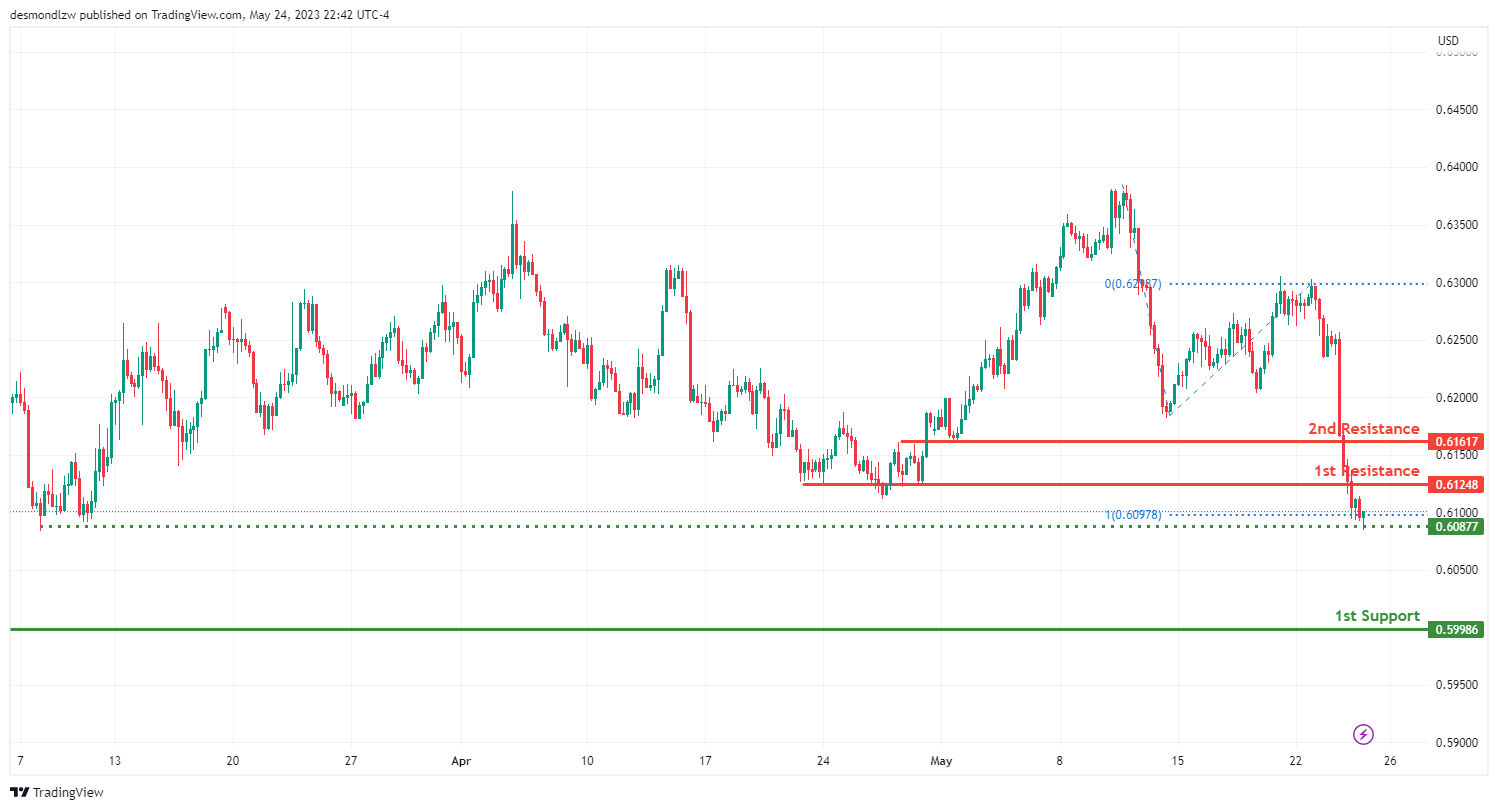
The NZD/USD chart currently exhibits a bearish trend, suggesting a potential continuation of the downward movement.
The price may potentially make a bearish continuation towards the first support level at 0.5998, known as a pullback support. This level might provide a potential floor for price, slowing or reversing any further declines.
There’s an intermediate support level identified at 0.6087, termed as a swing low support. This level might provide additional stability to the price, should it continue to drop.
Conversely, if the price attempts to counter its bearish trajectory, it could encounter the first resistance at 0.6128. Identified as a pullback resistance, this level might obstruct the upward movement of the price.
Additionally, there’s a second resistance level at 0.6161, also recognized as a pullback resistance. This level might further challenge any attempts by the price to rise, potentially causing a halt or reversal.
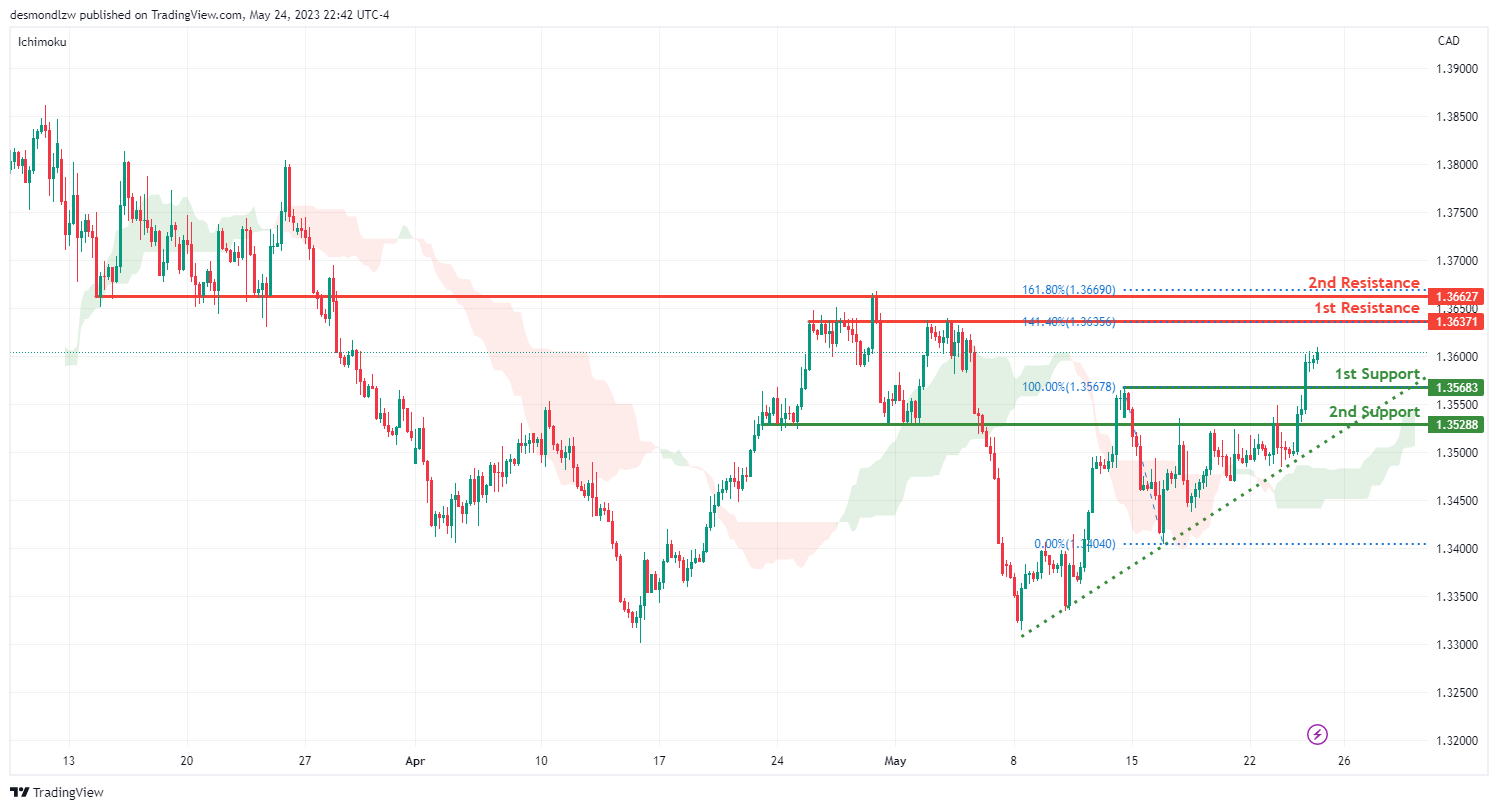
USD/CAD:
The USD/CAD t is currently showing a bullish trend. This can be attributed to the price being above a major ascending trend line and above the bullish Ichimoku cloud, indicating that further bullish momentum may be on the cards.
In the short term, it is expected that the price may continue its bullish movement towards the first resistance level at 1.3637. This level is identified as an overlap resistance, suggesting it could serve as a potential barrier to price increases.
Furthermore, there’s a second resistance level at 1.3662. This overlap resistance, combined with its alignment with the 161.80% Fibonacci Extension, strengthens the possibility of it acting as a significant obstacle to further price rise.
In terms of support, the first support level is situated at 1.3568, functioning as a pullback support. This could potentially provide a base to stop or reverse any price declines.
Additionally, a second support level is located at 1.3528, also acting as a pullback support. This further reinforces the potential for support in case of a downward price movement.
DJ30:
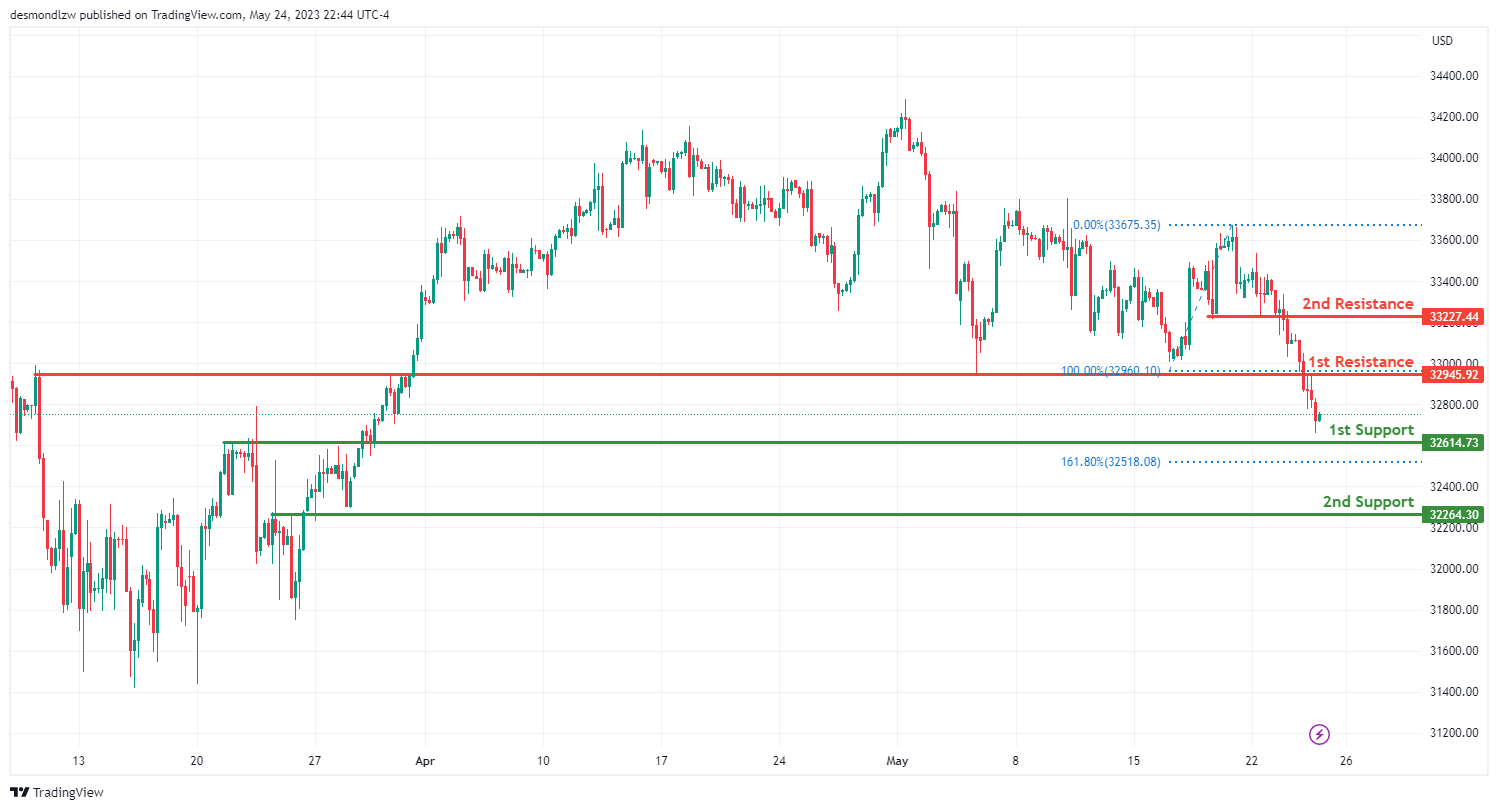
The DJ30 index is currently exhibiting a bearish trajectory. It is expected that the price may continue its bearish trend towards the first support level.
The first support level is at 32614.73 and serves as a pullback support, potentially providing a solid foundation to stop or reverse any further price declines.
A second support level can be found at 32264.30, which is identified as an overlap support, bolstering its potential as a buffer against additional price drops.
Conversely, if the price attempts to reverse its bearish trend, it will face the first resistance at 32945.92, which acts as a pullback resistance. This could potentially halt an upward price movement.
The second resistance level is at 33227.44, serving as an overlap resistance. If the price reaches this level, it might find it challenging to continue its upward trajectory and may instead reverse back towards its support levels.
GER30:
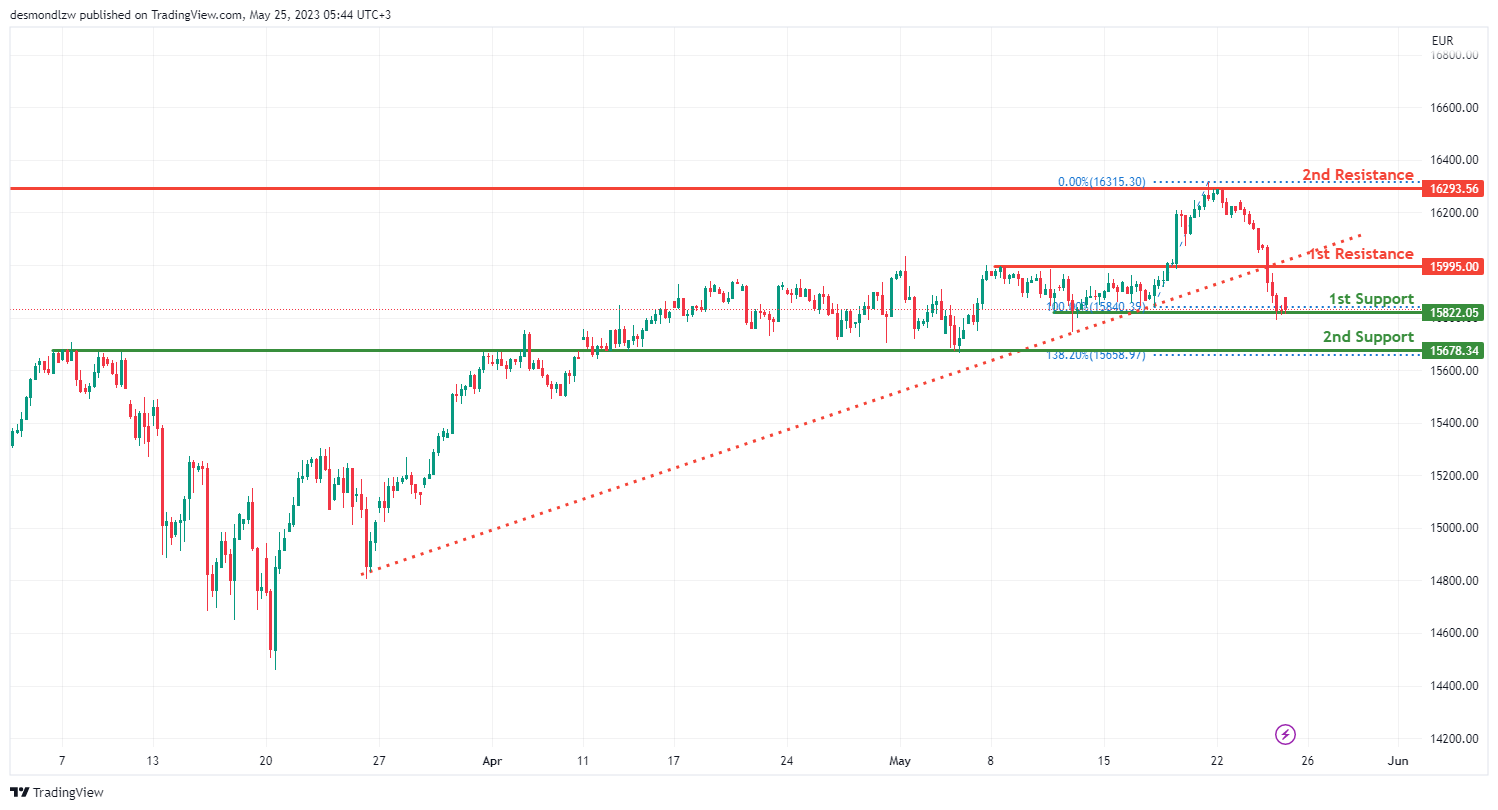
The GER30 index is currently on a bearish trend, prompted by the breaking below an ascending support line, indicating the potential for a continued bearish shift.
The price might potentially follow a bearish path, breaking off from the first support and heading towards the second support level.
The first support level is marked at 15822.05, acting as a multi-swing low support. This point, where the price has bottomed out multiple times in the past, could potentially provide a strong base to prevent further declines.
The second support level is at 15678.34, recognized as an overlap support, providing another potential floor for the price in case of a downward shift.
On the flip side, if the price attempts to counter its bearish trend, it could face resistance at 15995.00, identified as a pullback resistance. This level could potentially interrupt an upward price movement.
The second resistance level is at 16293.56, acting as a swing high resistance. Should the price reach this level, it might face difficulty continuing its upward trajectory, possibly leading to a reversal towards the support levels.
BTC/USD:
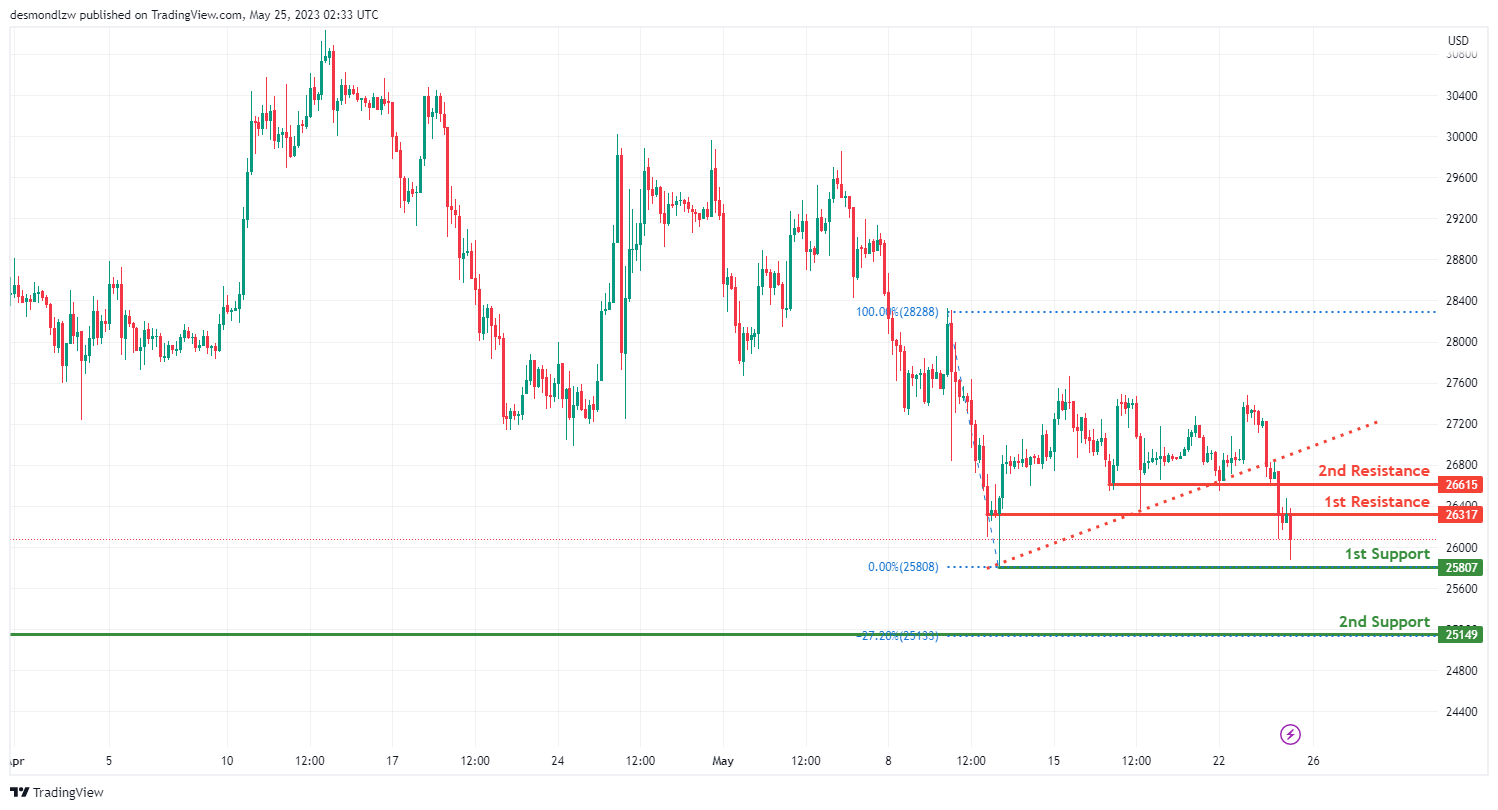
The BTC/USD pair is currently displaying a bearish momentum, prompted by the price breaking below an ascending support line, indicating potential for a bearish shift.
The price might potentially react bearishly off the first resistance and decline towards the first support level.
The first support level is situated at 25807, acting as a swing low support. This level, where the price has hit a low point in the past, could potentially provide a strong barrier to further declines.
The second support level is at 25149, which serves as a pullback support, providing another potential floor for the price in case of a downward movement.
Conversely, if the price attempts to counter its bearish trend, it could face resistance at 26317, identified as a pullback resistance. This level could potentially interrupt an upward price movement.
The second resistance level is at 26615, acting as another pullback resistance. If the price reaches this level, it might find it challenging to maintain its upward momentum and could possibly reverse back towards the support levels.
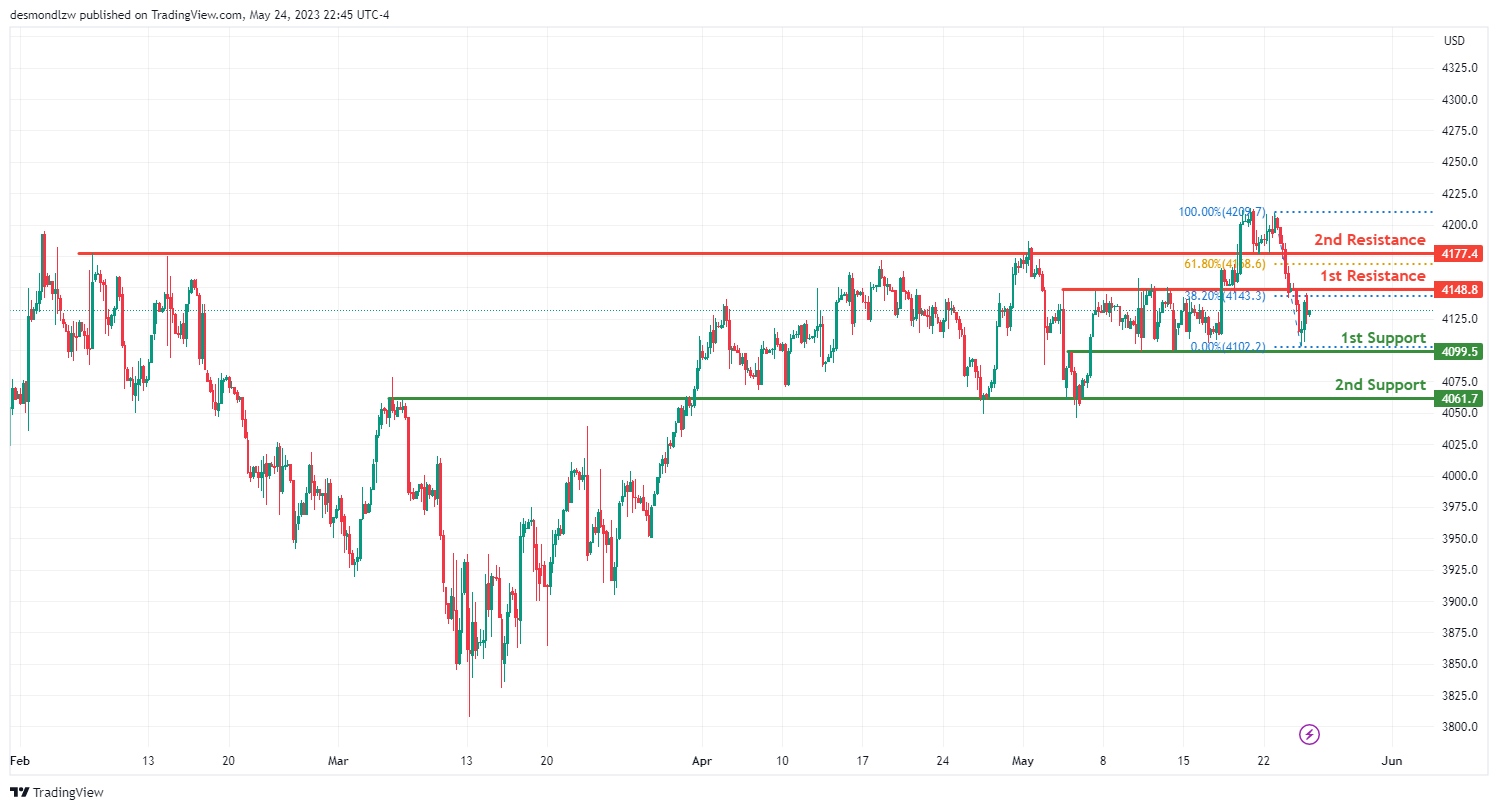
US500
The US500 instrument currently displays a bearish momentum, with the potential for a continued bearish shift towards the first support level.
The initial support level is located at 4099.5, functioning as a swing low support. This level represents a point where the price has previously bottomed out, providing a potential floor to prevent further price drops.
The secondary support level is at 4061.7, identified as an overlap support. This level could potentially halt further declines, acting as another base for the price.
Conversely, if the price tries to reverse its bearish trend, it may face resistance at 4148.8. This level, identified as an overlap resistance, might obstruct an upward price trajectory, particularly as it represents the 38.20% Fibonacci retracement level.
The following resistance level is at 4177.4, acting as a pullback resistance. This level, corresponding to the 61.80% Fibonacci retracement, may make it difficult for the price to maintain an upward trajectory and could potentially result in a reversal towards the support levels.
ETH/USD:
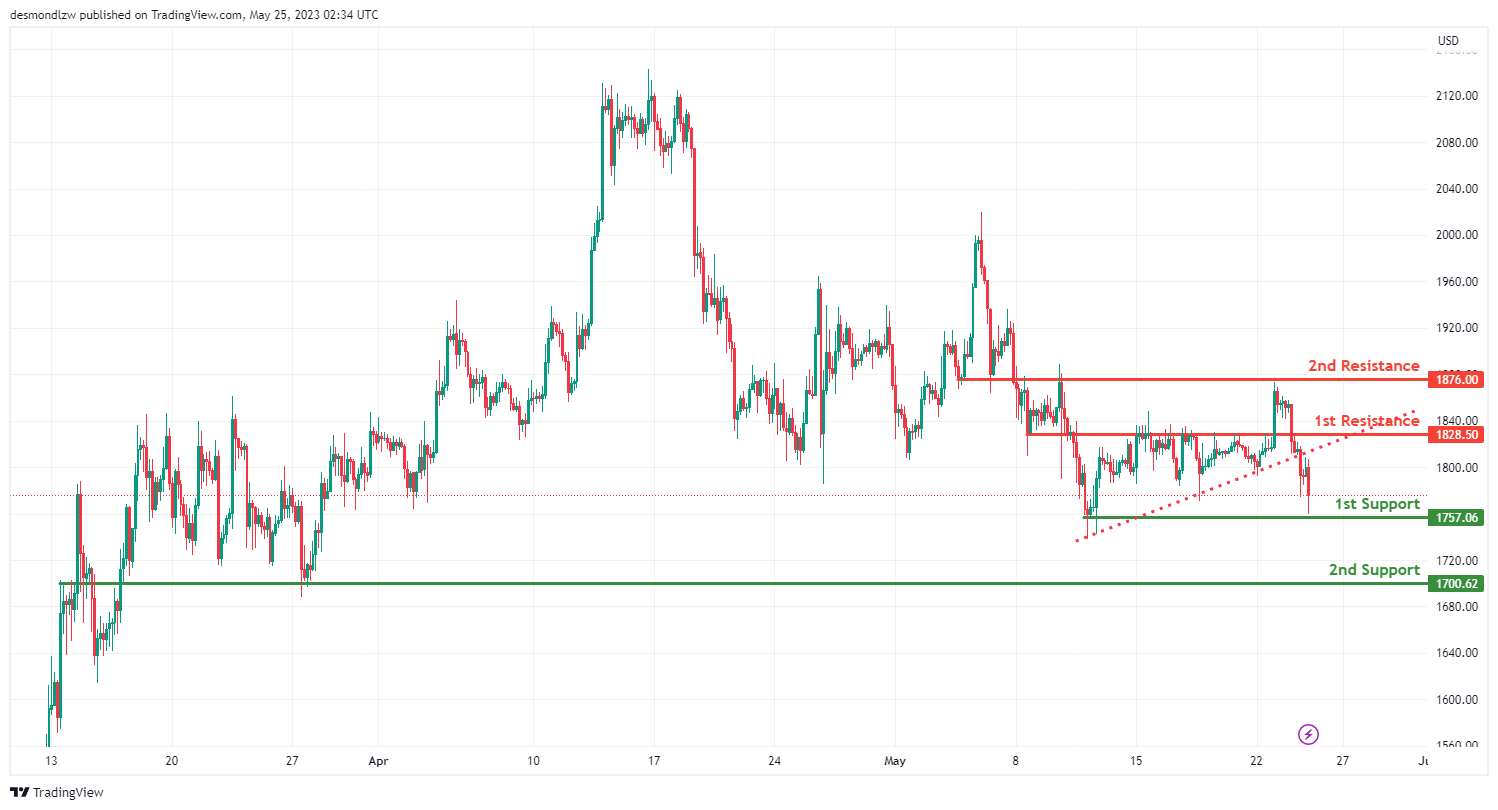
The ETH/USD instrument is currently demonstrating a bearish trend, largely driven by the price breaking below an ascending support line, which indicates a potential for further bearish moves.
The primary support level is found at 1757.06 and is recognized as a multi-swing low support, a point where the price has reached a low multiple times in the past. This could potentially provide a strong barrier against further declines.
The second support level is located at 1700.62. Identified as an overlap support, this level may serve as another floor to halt further price decreases.
In the event of a potential price reversal, the first resistance level at 1828.50 could obstruct the price from rising. This overlap resistance level represents a potential ceiling that could curb any bullish momentum.
The second resistance level is found at 1876.00 and is also recognized as an overlap resistance. This means that it’s a point where the price has previously topped out, reinforcing its potential to act as a barrier against price increases.
WTI/USD:
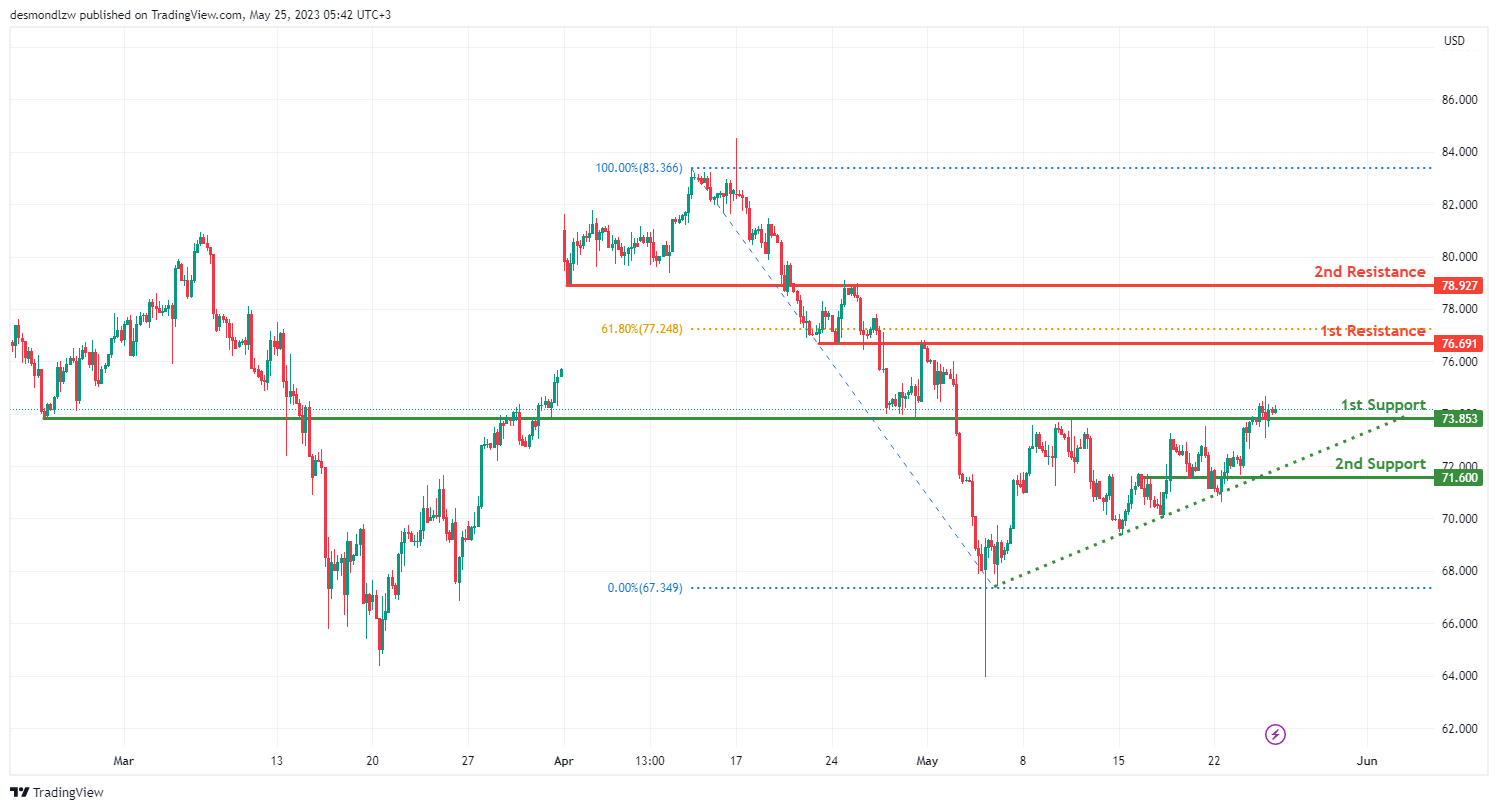
The WIT instrument is currently exhibiting a bullish trend, largely due to the price being above a significant ascending trend line, which suggests the likelihood of continued bullish momentum.
The first level of support is at 1757.06 and is identified as an overlap support. This indicates that it’s a point where the price has historically bottomed out, suggesting its potential to stop further price declines.
The second support level is located at 71.60 and is also recognized as an overlap support, further reinforcing its potential to halt further price decreases.
On the other hand, if the price attempts to continue its bullish trend, it could encounter resistance at 76.69. This overlap resistance level is also at the 61.80% Fibonacci retracement level, and it could potentially obstruct upward price movements.
The second resistance level is at 78.92 and is recognized as an overlap resistance, suggesting its potential to act as a ceiling for any price increases.
XAU/USD (GOLD):
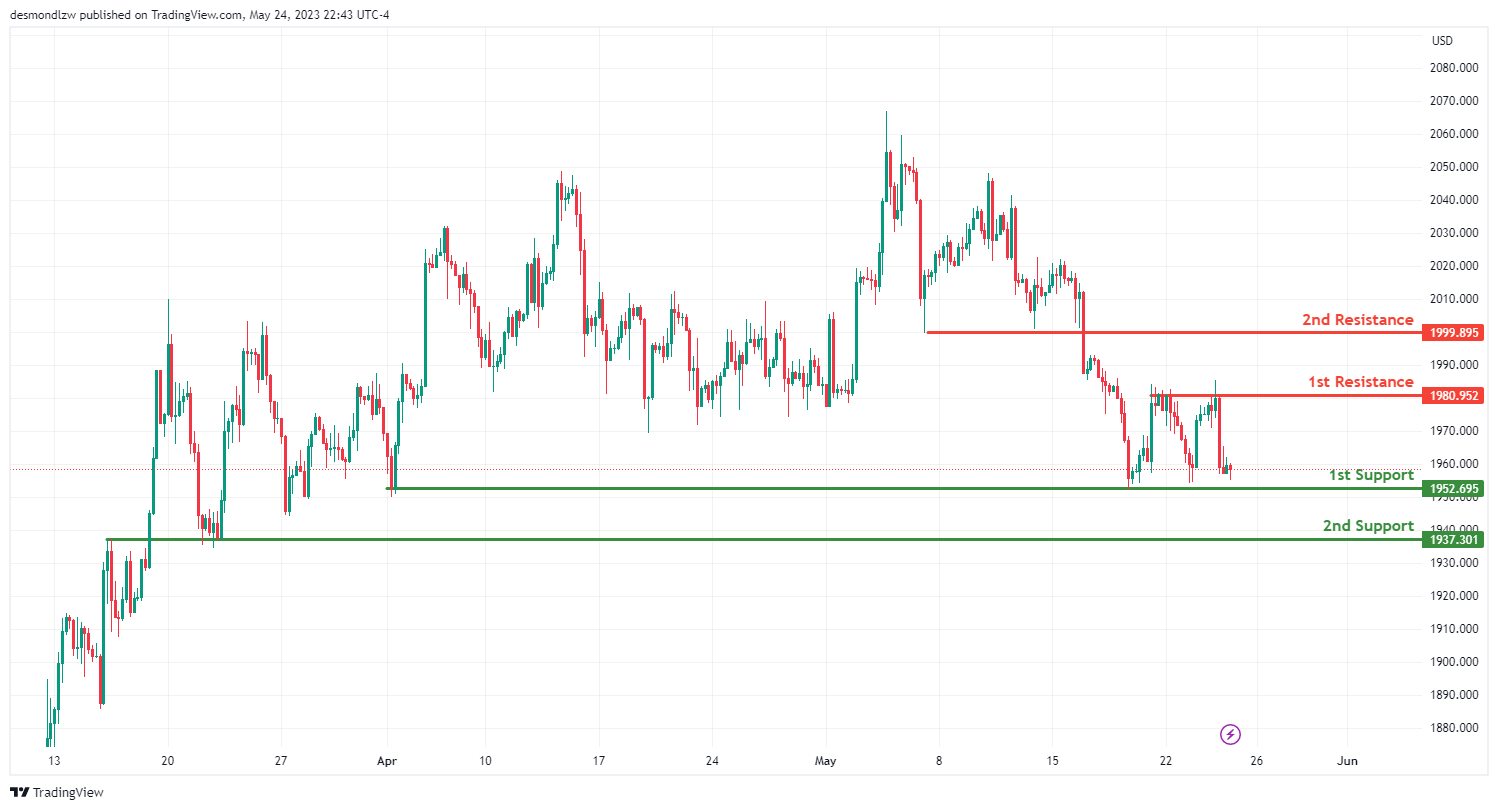
The XAU/USD instrument is currently displaying a neutral trend, meaning the price is likely to fluctuate between certain levels.
The initial support level is located at 1952.69 and is classified as a multi-swing low support. This means it’s a point where the price has reached a low multiple times in the past, potentially providing a strong barrier against further price decreases.
The second support level is found at 1937.30, known as an overlap support, which suggests it’s a level where the price has historically bottomed out, hence it could halt further price declines.
On the flip side, if the price seeks to increase, it could encounter resistance at 1980.95. This level is acknowledged as a multi-swing high resistance, indicating that it’s a point where the price has peaked multiple times in the past, and may potentially obstruct upward price movements.
The next resistance level is at 1999.89, known as a pullback resistance. This level might act as a ceiling for any price increases.
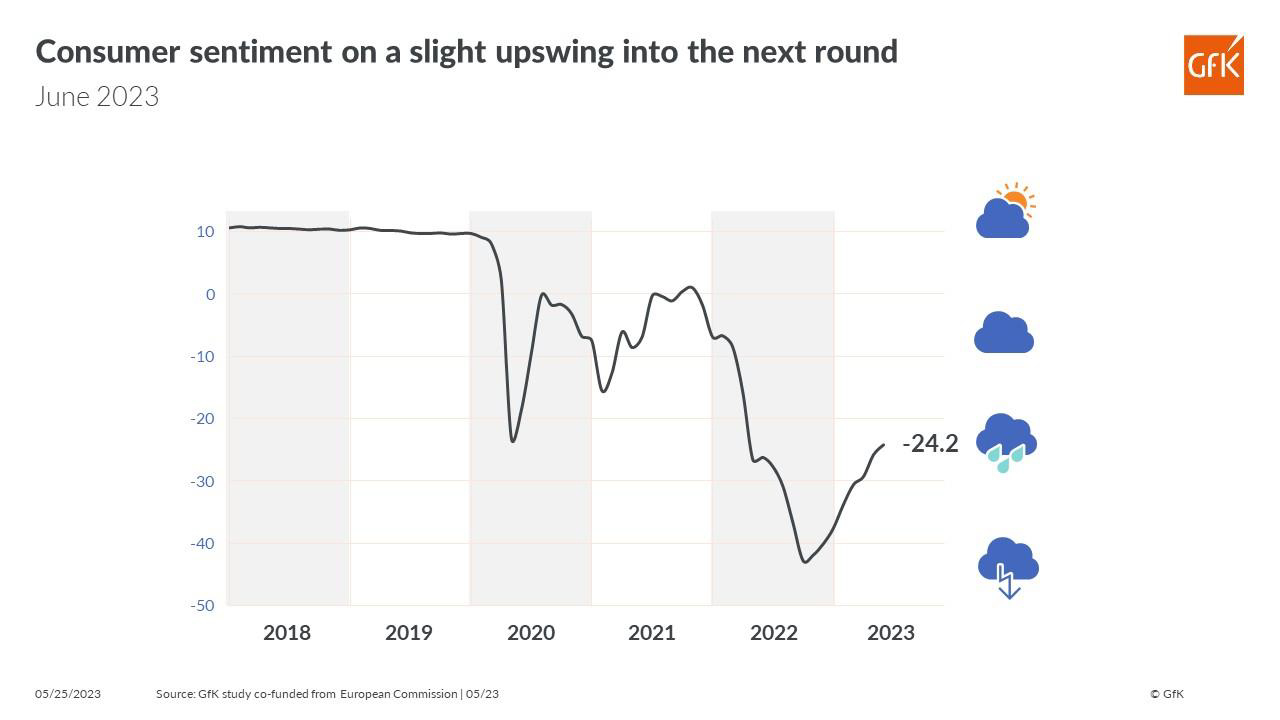
Germany Gfk consumer sentiment rose to -24.2, not showing a clear up trend
Germany Gfk consumer sentiment for June rose slightly from -25.8 to -24.2, above expectation of -24.5. In May, economic expectations dropped from 14.3 to 12.3. Income expectations rose from -10.7 to -8.2. Propensity to buy dropped from -13.1 to -16.1.
"Consumer sentiment is not showing a clear upward trend at present. As a result, the rise in consumer climate index has slowed again somewhat," explains Rolf Bürkl, GfK consumer expert.
"A lower propensity to save has prevented the recovery in consumer sentiment from stagnating this month. However, it is still below the low level of spring 2020 during the first Covid-19 lockdown."
Here’s What Silver Investors Need to Know
Observations over the years reveal that hedge fund managers tend to extrapolate current trends of financial markets into the future -- just like most Main Street investors.
In other words, hedge fund managers are just as much a part of the "crowd" as the little guy.
So, this 2021 headline from the American Enterprise Institute is not surprising:
The SP 500 Index Out-performed Hedge Funds over the Last 10 Years. And It Wasn't Even Close
Hedge funds and trend followers are known as Large Speculators in the Commitment of Traders report published by the Commodity Futures Trading Commission. They usually take the opposite side of the trade from a group known as the Commercials; insiders who participate in a business related to a given commodity. The Commercials usually turn out to be on the right side of a trade.
With this in mind, let's focus on silver. Here's a chart and commentary from our May 15 U.S. Short Term Update:

Large Specs... are strongly betting that [Silver]'s rally will continue. The middle graph on the chart shows the Large Spec net long or net short position as a percentage of total non-spreading open interest. Two weeks ago, it was 23.49%. Last week, despite a 9% decline in silver prices over just five days, Large Specs are net long 23.14%, hardly budging from their prior stance... We will keep you apprised of new developments.
The U.S. Short Term Update makes clear that Commitment of Traders positions are not a great short-term timing tool. At the same time, be aware that extreme positions often occur at key trend turns.
Also keep in mind that silver's Elliott wave structure can help you to anticipate price turns.
Indeed, here's a quote from the Frost & Prechter's Wall Street classic, Elliott Wave Principle: Key to Market Behavior:
It is our practice to try to determine in advance where the next move will likely take the market. One advantage of setting a target is that it gives a sort of backdrop against which to monitor the market's actual path. This way, you are alerted quickly when something is wrong and can shift your interpretation to a more appropriate one if the market does not do what you expect. The second advantage of choosing a target well in advance is that it prepares you psychologically for buying when others are selling out in despair, and selling when others are buying confidently in a euphoric environment.
No matter what your convictions, it pays never to take your eyes off what is happening in the wave structure in real time. Ultimately, the market is the message, and a change in behavior can dictate a change in outlook. All one really needs to know at the time is whether to be long, short or out, a decision that can sometimes be made with a swift glance at a chart and other times only after painstaking work.
If you'd like to read the entire online version of the book, you may do so for free once you join Club EWI, the world's largest Elliott wave educational community.
A Club EWI membership is also free and members enjoy complimentary access to a wealth of Elliott wave resources on investing and trading.
Get started now by following this link: Elliott Wave Principle: Key to Market Behavior – get free access.
AUD/USD Daily Report
Daily Pivots: (S1) 0.6510; (P) 0.6564; (R1) 0.6597; More...
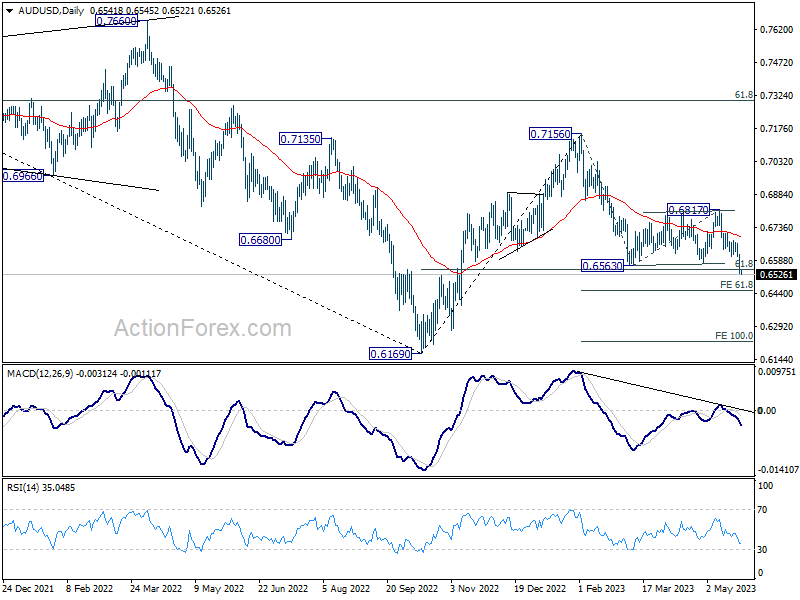
AUD/USD's break of 0.6563 support confirms resumption of whole decline from 0.7156. Intraday bias stays on the downside for 61.8% projection of 0.7156 to 0.6563 from 0.6817 at 0.6451. Firm break there will target 100% projection at 0.6224. On the upside, above 0.6604 resistance will turn intraday bias neutral first.
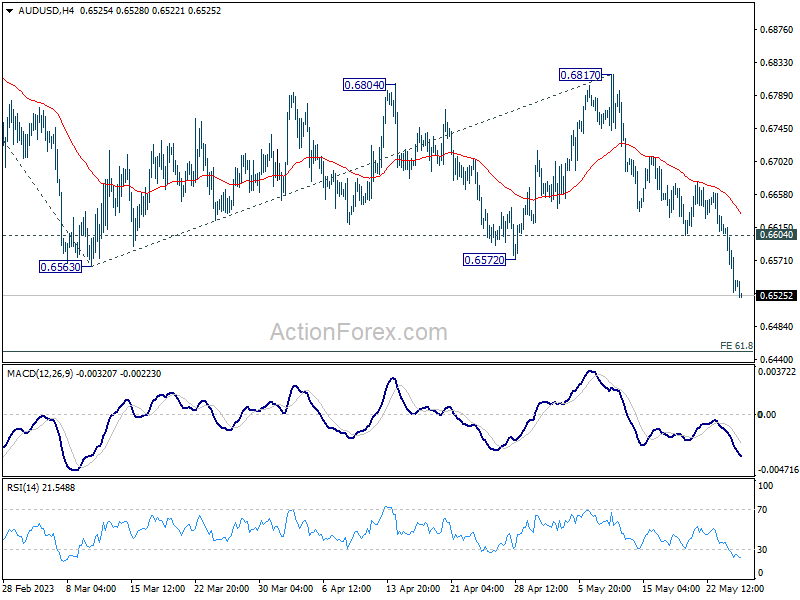
In the bigger picture, rejection by 55 W EMA (now at 0.6822) keeps medium term outlook bearish. Firm break of 61.8% retracement of 0.6169 to 0.7156 at 0.6546 now suggests that whole rebound from 0.6169 has completed at 0.7156 already. Larger down trend from 0.8006 (2021 high) might be ready to resume through 0.6169 low. This will now remain the favored case as long as 0.6817 resistance holds.
Dollar Soars after FOMC Minutes and Fed Comments
Dollar surged overnight trade and maintained its momentum into today's Asian trading session. This robust performance followed the release of FOMC minutes, which depicted a high degree of uncertainty regarding the future trajectory of monetary policy. Despite this ambiguity, a pause in the tightening cycle by June does not necessarily signal its end, and any rate cuts appear to be a distant prospect.
Trailing behind the greenback, Euro ranks as the second strongest currency for the week so far, followed closely by Swiss Franc. Conversely, New Zealand Dollar is the worst performer, followed by Australian Dollar and Japanese Yen. Canadian dollar and British Pound are mixed in the current trading environment.
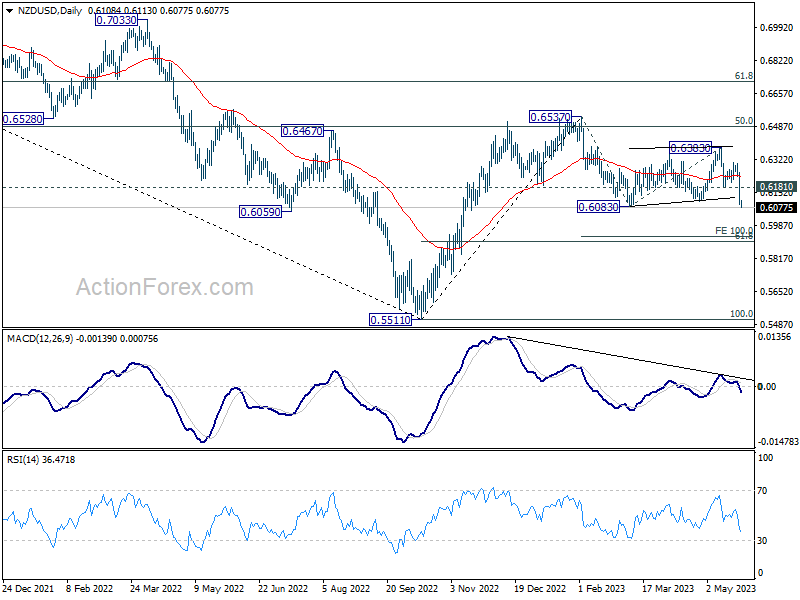
As a follow-up on NZD/USD, the selloff accelerated as expected after breaking 0.6181 support. Now that 0.6181 support is also broken, the whole decline from 0.6537 should be resuming. Near term outlook will stay bearish as long as 0.6181 support turned resistance holds. Next target is 100% projection of 0.6537 to 0.6083 from 0.6383 at 0.5929. It should be noted that AUD/USD also broke 0.6563 support to resume the whole fall from 0.7156. So, both would likely resume pressured against the greenback for the near term at least.
In Asia, at the time of writing, Nikkei is up 0.22%. Hong Kong HSI is down -2.06%. China Shanghai SSE is down -0.37%. Singapore Strait Times is down -0.18%. Japan 10-year JGB yield is up 0.0198 at 0.428. Overnight, DOW dropped -0.77%. S&P 500 dropped -0.73%. NASDAQ dropped -0.61%. 10-year yield rose 0.021 to 3.719.
FOMC minutes reveal uncertainty over future policy tightening
According to minutes from May 2-3 meeting of FOMC, there's a cloud of uncertainty over the prospect of future policy tightening. The committee's participants "generally agreed" that the cumulative effects of monetary policy tightening and the possible impact of further tightening on the economy render the extent of future target range increases "less certain".
The minutes report, "Participants generally expressed uncertainty about how much more policy tightening may be appropriate." This theme of uncertainty was echoed throughout the document, with the committee members emphasizing the need to "'retain optionality" after the meeting.
Moreover, the minutes reveal, "Several participants noted that if the economy evolved along the lines of their current outlooks, then further policy firming after this meeting may not be necessary." This implies that should economic conditions continue on their current trajectory, additional policy tightening may not be required, underscoring the tentative stance adopted by the FOMC.
Fed Waller: Hike or pause in June, but no stop
Fed Governor Christopher Waller said in a speech that the upcoming data over the next few months is unlikely to clearly indicate that the terminal rate has been reached.
Waller stated, "I do not support stopping rate hikes unless we get clear evidence that inflation is moving down towards our 2 percent objective."
He went on to say that the decision about whether to raise rates or hold off in the upcoming June meeting would be contingent on the data collected over the next three weeks.
Waller noted, "We will get additional labor market data, with some information about wages, and additional inflation numbers in the next few weeks that will continue to shape my view on where we stand relative to the FOMC's dual mandate."
Fed Bostic foresees no rate cut until well into 2024
Atlanta Fed President Raphael Bostic recently made some forward-looking remarks on monetary policy in an interview with MarketPlace, stating that the likelihood of a rate cut before 2024 is low given the current inflation levels.
He noted, "My best case is that we won't be thinking about a cut until well into 2024. And, you know, inflation is just double what our target is by just about every measure."
"I don't see scenarios where the economy is going to evolve in a way such that inflation gets close enough to our target where we might contemplate any kind of cut," he added.
RBNZ Orr sees potential for rate cut after early next year
In his address to the parliament's finance and expenditure committee, RBNZ Governor Adrian Orr noted that the country's interest rates are already significantly above neutral, thereby suppressing spending and investment.
"They (interest rates) are well above what we would consider neutral, are constraining spending and investment," Orr said. He further stated, "The committee is confident monetary policy is restrictive and doing its job."
Orr characterized yesterday's 25bps rate hike as "an extra bit of insurance." The RBNZ committee voted five to two in favor of raising the OCR with two dissenting votes advocating for holding. Orr was quick to downplay any notion of discord within the committee. "On the division in the committee, the voting, there is no division. It's a committee decision," he told the parliamentary committee.
Looking forward, Orr hinted that the RBNZ might start easing interest rates in early next year. "The committee expects the OCR to remain steady until early next year. At that point, we may be able to start easing interest rates," he noted.
Looking ahead
Germany Gfk consumer confidence and Q1 GDP final will be released in European session. US will release jobless claims GDP revision and pending home sales later in the day.
AUD/USD Daily Report
Daily Pivots: (S1) 0.6510; (P) 0.6564; (R1) 0.6597; More...
AUD/USD's break of 0.6563 support confirms resumption of whole decline from 0.7156. Intraday bias stays on the downside for 61.8% projection of 0.7156 to 0.6563 from 0.6817 at 0.6451. Firm break there will target 100% projection at 0.6224. On the upside, above 0.6604 resistance will turn intraday bias neutral first.
In the bigger picture, rejection by 55 W EMA (now at 0.6822) keeps medium term outlook bearish. Firm break of 61.8% retracement of 0.6169 to 0.7156 at 0.6546 now suggests that whole rebound from 0.6169 has completed at 0.7156 already. Larger down trend from 0.8006 (2021 high) might be ready to resume through 0.6169 low. This will now remain the favored case as long as 0.6817 resistance holds.
Economic Indicators Update
| GMT | Ccy | Events | Actual | Forecast | Previous | Revised |
|---|---|---|---|---|---|---|
| 06:00 | EUR | Germany Gfk Consumer Confidence Jun | -24.5 | -25.7 | ||
| 06:00 | EUR | Germany GDP Q/Q Q1 F | 0.00% | 0.00% | ||
| 12:30 | USD | Initial Jobless Claims (May 19) | 253K | 242K | ||
| 12:30 | USD | GDP Price Index Q1 P | 4% | 4% | ||
| 12:30 | USD | GDP Annualized Q1 P | 1.10% | 1.10% | ||
| 14:00 | USD | Pending Home Sales M/M Apr | 1.20% | -5.20% | ||
| 14:30 | USD | Natural Gas Storage | 100B | 99B |
RBNZ Orr sees potential for rate cut after early next year
In his address to the parliament's finance and expenditure committee, RBNZ Governor Adrian Orr noted that the country's interest rates are already significantly above neutral, thereby suppressing spending and investment.
"They (interest rates) are well above what we would consider neutral, are constraining spending and investment," Orr said. He further stated, "The committee is confident monetary policy is restrictive and doing its job."
Orr characterized yesterday's 25bps rate hike as "an extra bit of insurance." The RBNZ committee voted five to two in favor of raising the OCR with two dissenting votes advocating for holding. Orr was quick to downplay any notion of discord within the committee. "On the division in the committee, the voting, there is no division. It's a committee decision," he told the parliamentary committee.
Looking forward, Orr hinted that the RBNZ might start easing interest rates in early next year. "The committee expects the OCR to remain steady until early next year. At that point, we may be able to start easing interest rates," he noted.