

Sample Category Title
BoE Bailey hints at possible pause in rate hikes
BoE Andrew Bailey, in an interview with Bloomberg TV, suggested that the central bank could soon hit a plateau in its cycle of rate hikes. However, he underscored the need for clear evidence before making such a call.
"We are approaching a point when we should be able to in a sense rest in terms of the level of rates," Bailey stated. However, he was quick to caution that BoE hadn't seen sufficient evidence yet to make that determination. "We have to be evidence driven," he emphasized.
When queried if BoE was nearing a pause in rate increases, Bailey responded, "Well, I'm going to say I hope we are because this is the 12th consecutive increase in rates." He reiterated, however, BoE's dependence on tangible data, adding "we will be guided by the evidence as it comes to us."
Bailey's comments reflect a careful balancing act. While he hints at a potential easing in rate hikes, he firmly anchors this possibility to empirical data, thereby preventing premature conclusions. He also clarified that BOE is not "giving a direction one way or the other" on rates and that their future moves would be "shaped by the evidence."
Fed Kashkari: The real question is, when is inflation going to come down
Minneapolis Fed President Neel Kashkari said at an event in Marquette, Michigan, "The real question is, when is inflation going to come down."
He warned of the potential risks to banks should high inflation persist, necessitating an extended period of tight monetary policy and an inverted yield curve. Such a scenario, Kashkari cautioned, "creates real problems for banks of all sizes. We are very aware of that."
However, he also offered a more positive outlook tied to market expectations of easing inflation. If inflation does indeed fall rapidly, Kashkari suggested that "one might imagine interest rates normalizing, the yield curve uninverting and then the pressure on banks and their deposit bases becomes much smaller."
Bank of England Review – A Data Dependent Approach
- In line with our expectation, the BoE today hiked policy rates by 25bp, bringing the Bank Rate to 4.50%.
- With both growth and domestic inflation having surprised to the topside and given BoE's message today we pencil in an additional 25bp hike in June 2023.
- We now expect the Bank Rate to peak at 4.75%. We still do not envision rate cuts from BoE before 2024.
In line with our expectation, the Bank of England (BoE) hiked the Bank Rate (key policy rate) by 25bp to 4.50% with 7 members voting for a 25bp hike and two members voting for keeping the Bank Rate unchanged.
Given the past months strong data releases we have for some time contemplated revising our call to include another hike in our profile. With the communication from the BoE today, we think this marks the final nail in the coffin. The BoE continues to keep the door open for further increases in the Bank Rate repeating that "if there were to be evidence of more persistent pressures, then further tightening in monetary policy would be required." The majority of the Monetary Policy Committee (MPC) voted for an increase of 25bp as they deemed it "important to continue to address the risk of more persistent strength in domestic price and wage setting". The updated inflation projections showed that the BoE has revised its inflation projections higher across the forecast period, now expecting inflation to reach its 2% target in 2025. Additionally, the MPC sees the "risks around the inflation forecast [as] skewed significantly to the upside". The key concern for the BoE remains developments in wage data as well as service inflation and thus is the key data to follow.
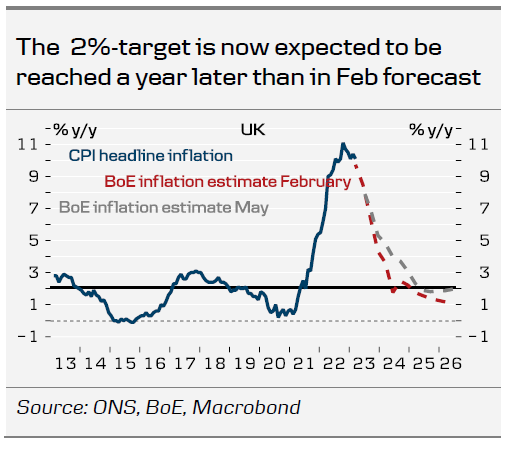
With both the global backdrop, inflation and wage growth having surprised to the topside, we do not believe that data will have weakened enough for the BoE to pause its hiking cycle at the June meeting. We thus revise our forecast to include a 25bp hike in June, marking a peak in the Bank Rate at 4.75%. Likewise, we believe that upcoming data releases have to prove worse than expected for a pause to be warranted considering the forecasts presented in the Monetary Policy Report (MPR).
Rates. Initially, Gilts yields moved 5bp higher across the curve. However, during the press conference, yields began to trend downwards, reaching their lowest level in a week. Probably rather influenced by developments in European and US yields, rather than any new information at the press conference. The peak rate of 4.8% remained unchanged.
FX. EUR/GBP initially moved slightly lower but fully retraced the move during the press conference. Overall, we regard the relative central bank outlook to be a positive for EUR/GBP but with other factors acting as a headwind, we increasingly see a case for continued range trading in the cross around 0.87-0.88.
Our call. We now expect another hike of 25bp at the June meeting. In order for BoE to keep policy rates unchanged we believe that we would have to see data releases prove considerably worse than what we currently pencil in. Our call is fairly closely in line with market pricing (33bp until September). Markets are pricing in a likelihood for a cut in December (-6bp). We still believe that the first rate cuts will not be delivered before Q2 2024.
Swiss Franc Falls Despite SNB Jordan’s Hawkish Message
- SNB’s Jordan says cannot exclude further hikes
- US PPI dips, unemployment claims jump
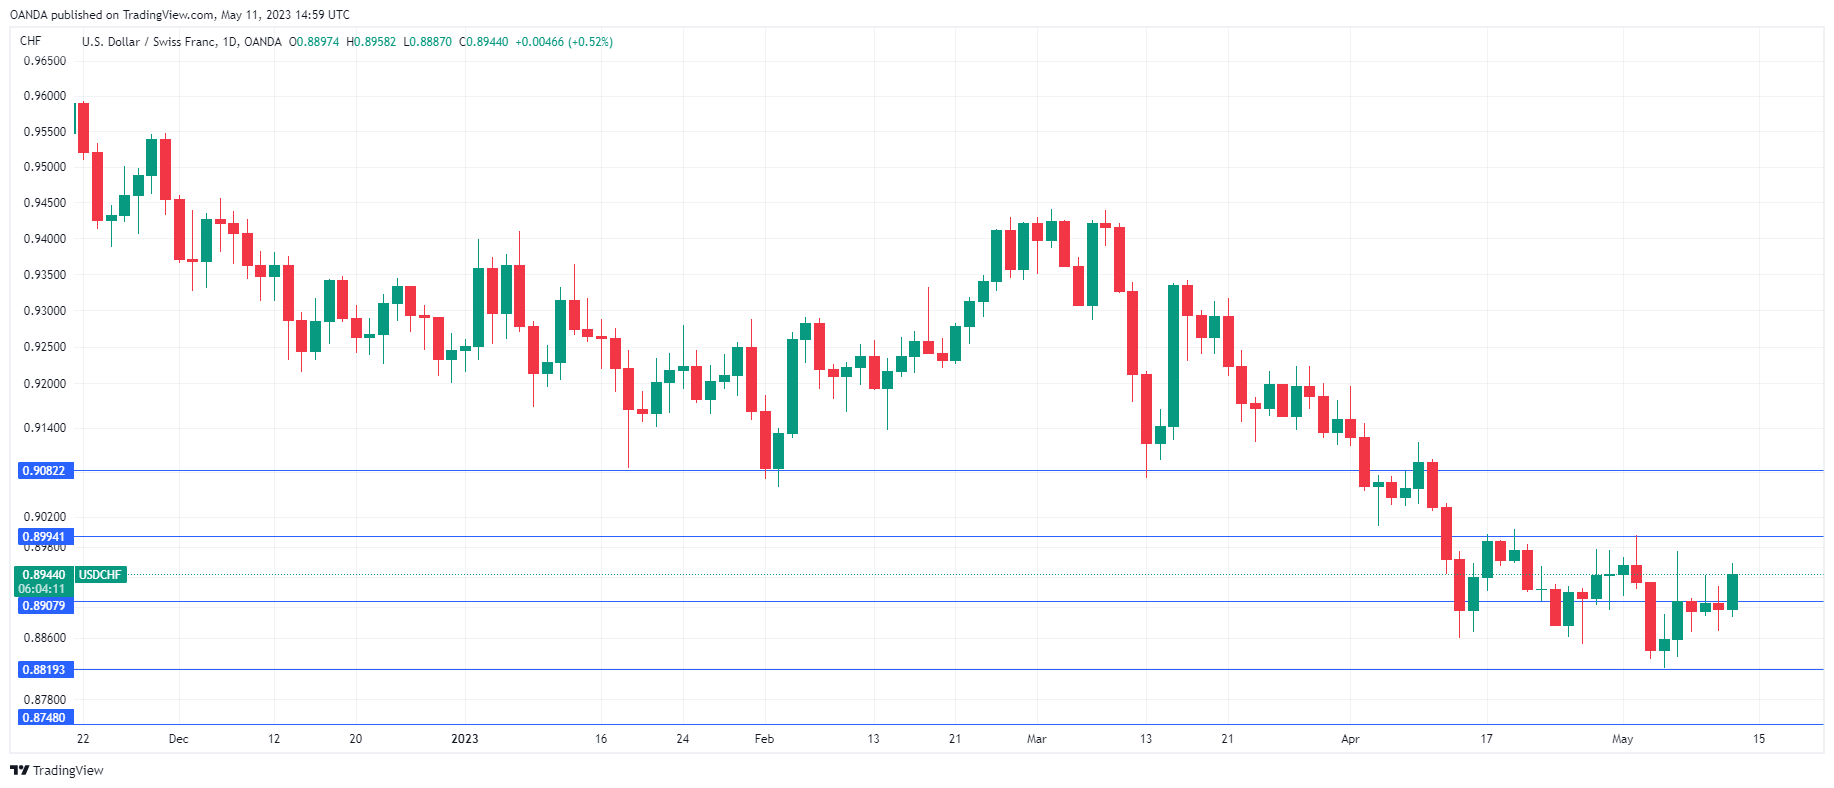
The Swiss franc has fallen considerably on Thursday. In the North American session, USD/CHF is trading at 0.8950, up 0.59% on the day.
SNB head Jordan says more tightening possible
Swiss National Bank President Jordan reiterated a hawkish message on Wednesday that he sent out a week ago. Jordan said that he could not rule out further rate hikes, noting that current monetary policy was not restrictive enough. In other words, the SNB is unhappy with inflation levels, which although relatively low at 2.6%, have been above the Bank’s target of 0-2% since February 2022. Inflation fell from 2.9% to 2.6% in April, and there is one final inflation report before the SNB’s next meeting on June 22nd. The SNB has not shied away from being aggressive and delivering oversize hikes as high as 0.75% in the current rate-hike cycle, and we could see another hike if inflation doesn’t fall close to 2.0% in the next release.
The Swiss franc continues to appreciate, much to the consternation of SNB policymakers, as a stronger Swissy makes exports more expensive. The Swiss franc has soared about 500 points since March 1st and Jordan made sure to remind his listeners that the central bank was prepared to intervene in the forex markets if necessary.
In the US, unemployment claims surprised to the upside, rising to 264,000, up from 245,000 and higher than the consensus estimate of 242,000. This was the highest total since January 2022, and although it’s just one report, it will likely raise speculation that the labour market is showing cracks. On the inflation front, the Producers Price Index, taking the lead from CPI, softened in April. The headline reading fell from 2.7% to 2.3% (2.4% est). The core rate dropped from 3.4% to 3.2% (3.3% est).
USD/CHF Technical
- USD/CHF has pushed past resistance at 0.8907. The next resistance line is 0.8994
- 0.8819 and 0.8732 are providing support
GBP/USD Wave Analysis
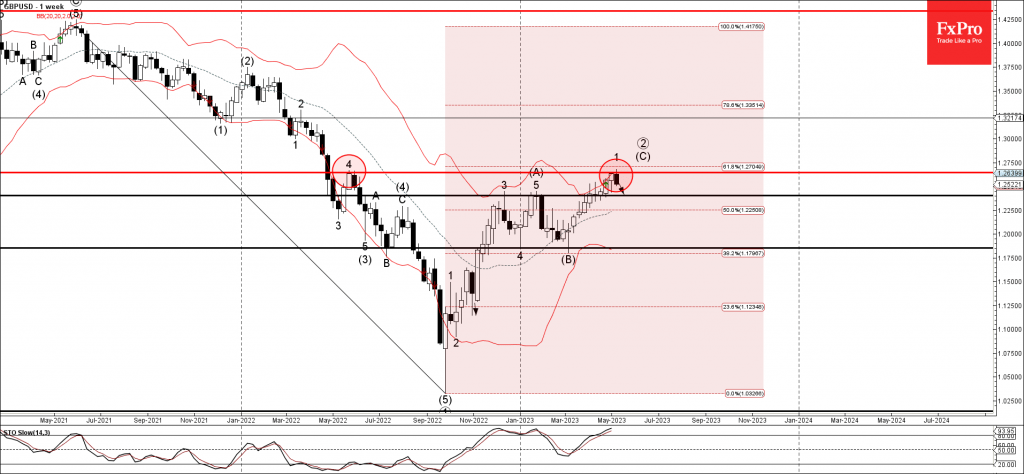
- Sterling reversed from resistance level 1.2640
- Likely to fall to support level 1.2400
Sterling under the bearish pressure after the price reversed down from the long-term resistance level 1.2640 (former top of the weekly correction 4 from 2022).
The downward reversal from the resistance level 1.2640 stopped the earlier weekly impulse sequence 1 of wave (C) from March.
Given the overbought weekly Stochastic, Sterling can be expected to fall toward the next support level 1.2400.
AUDUSD Wave Analysis
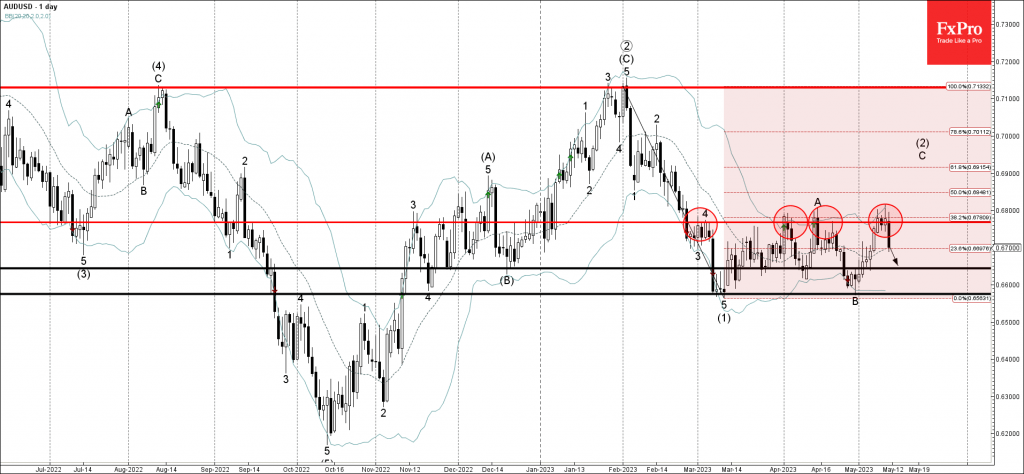
- AUDUSD reversed from resistance level 0.6765
- Likely to fall to support level 0.6650
AUDUSD currency pair recently reversed down from the pivotal resistance level 0.6765 (which has been steadily reversing the price from the start of March).
The resistance level 0.6765 was strengthened by the upper daily Bollinger Band and by the intersecting 38.2% Fibonacci correction of the downward impulse (1) from February.
AUDUSD can be expected to fall further in the active minor correction toward the next support level 0.6650.
Platinum Wave Analysis
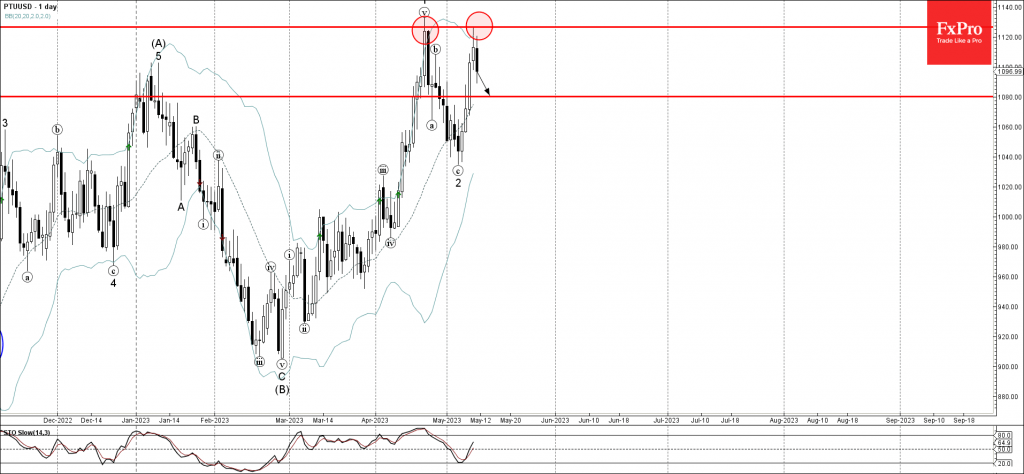
- Platinum reversed from resistance level 1125.00
- Likely to fall to support level 1080.00
Platinum recently reversed down from the major resistance level 1125.00 (which stopped the previous sharp upward impulse in April), strengthened by the nearby upper daily Bollinger Band.
The downward reversal from the resistance level 1125.00 stopped the previous minor impulse wave 3 from the start of May.
Given the strength of the resistance level 1125.00, Platinum can be expected to fall further toward the next support level 1080.00.
Weak Chinese Inflation is Bad for the Markets
While slowing inflation in the US and Europe is being greeted with relief by financial markets, weak figures from China are causing concern.
China’s consumer inflation slowed to just 0.1% y/y in April, down from 0.7% the previous month and the expected 0.3%. This is the lowest rate since February 2021, when the lockdown impacted prices. However, the situation is more alarming in this case as producer prices continue their downward trend.
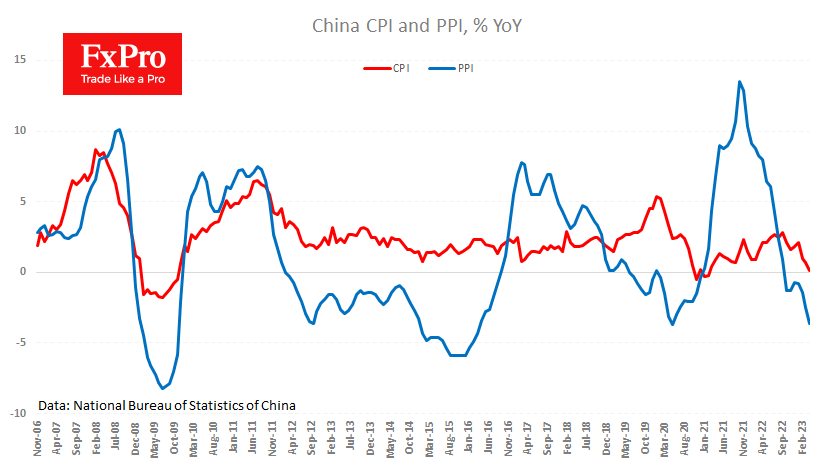
Last month’s Producer Price Index was 3.6% lower than a year earlier. The fall in the PPI warns that pressure on consumer prices will continue in the coming months. But investors and traders see it more as a signal of weakening industrial activity in the “global factory”, which is seen as a warning of a global slowdown.
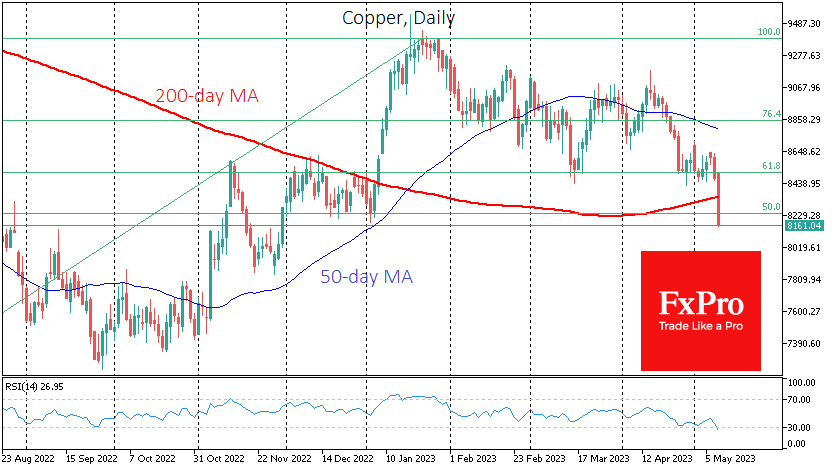
Copper is down over 4% today on the news, having fallen to lows not seen since November last year, and has been in a downtrend since January this year, falling below its 200-day average. This decline has gone beyond the traditional correction after a rally. This is bad news for the stock market, which acts as a leading indicator for the economy.
Weak inflation is also bad news for the renminbi, which has fallen to 6.95 per dollar, close to testing its 200-day average and the psychologically important 7.0 level.
ETHUSD Analysis: Bearish Engulfing Pattern Is Below $1,972
Bulls couldn’t take control of the market, and after touching a high of $1,972 on 06 May, the ETH/USD pair is moving in a bearish trend, touching a low of $1,792 on 10 May.
ETH/USD is under mild bearish pressure after its decline below the $1,850 handle, with immediate targets of $1,800 and $1,750 visible in the H1 timeframe.
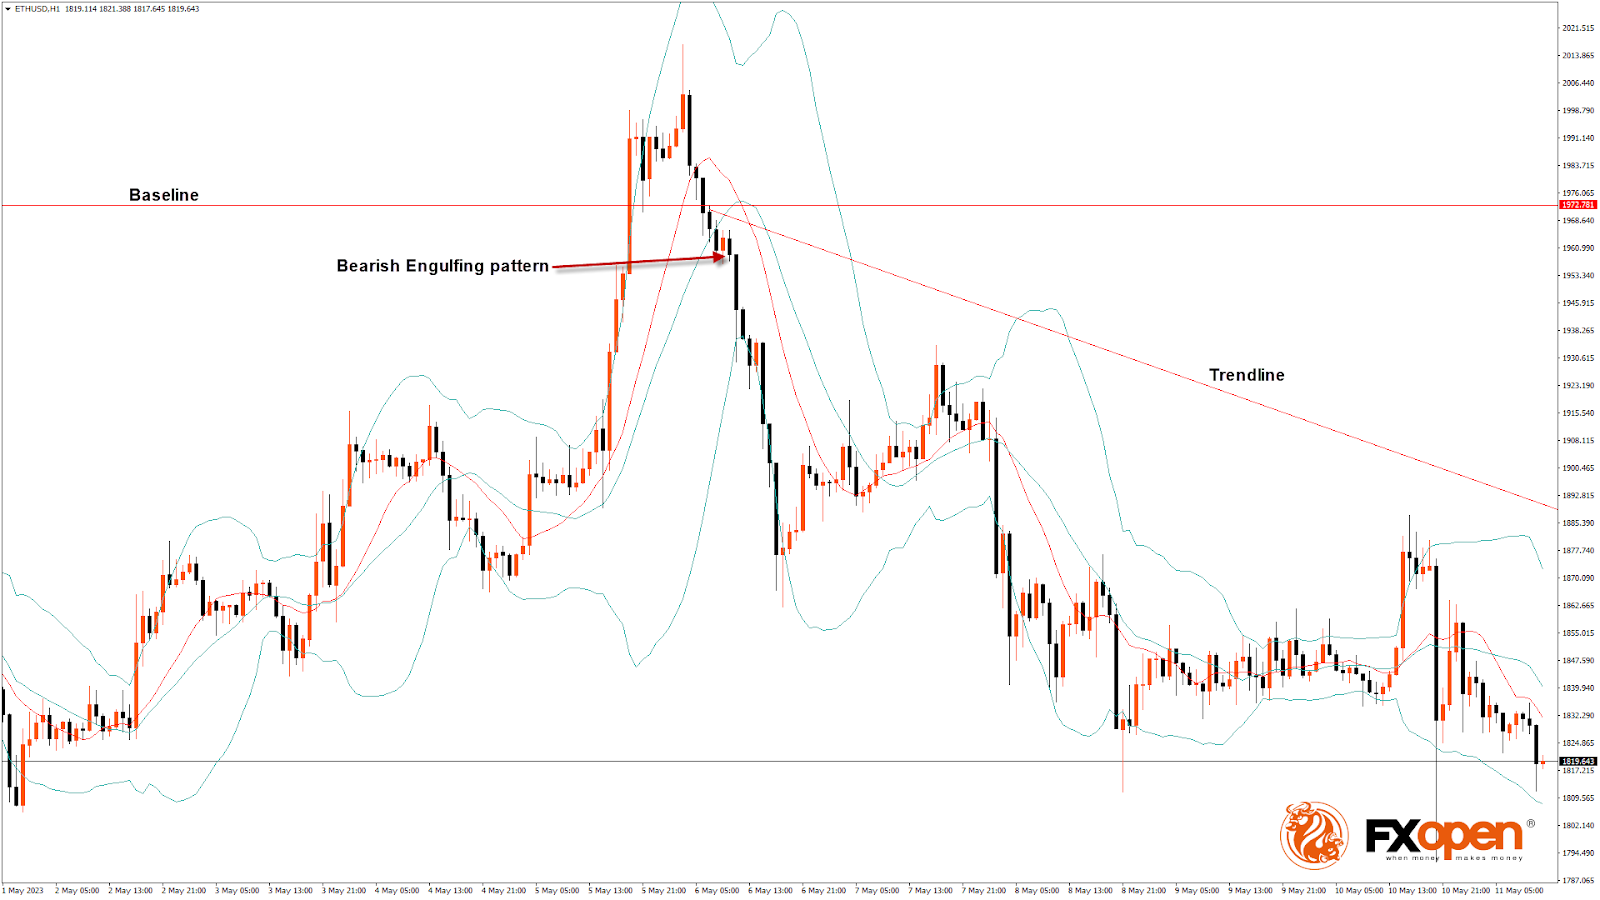
The bearish engulfing pattern is below the $1,972 handle, signifying the end of a bullish phase.
The relative strength index is at 36.51, indicating very weak demand for Ether and a continuation of the selling pressure in the market.
Both the STOCHRSI and Williams %R are signalling the ETH is oversold, meaning that the Ethereum price is expected to correct upwards in the short-term range.
ETH price is now trading below 100-hour simple and 200-hour exponential moving averages.
- ETH price bearish reversal is seen below the $1,972 mark.
- The short-term range is expected to be mildly bearish.
- The average true range indicates low market volatility.
- The CCI indicator formed a bearish divergence with the price chart.
ETH bearish reversal is seen below $1,972
On the daily chart, the ETH price is trading just below its pivot level of $1,820 and is moving into a mild bearish channel.
Some of the technical indicators are also signalling a neutral tone of the markets. Most of the technical indicators are bearish. Most moving averages are bearish at the current market level of $1,819. The Parabolic SAR indicator provides a bearish reversal signal in the 4-hour timeframe.
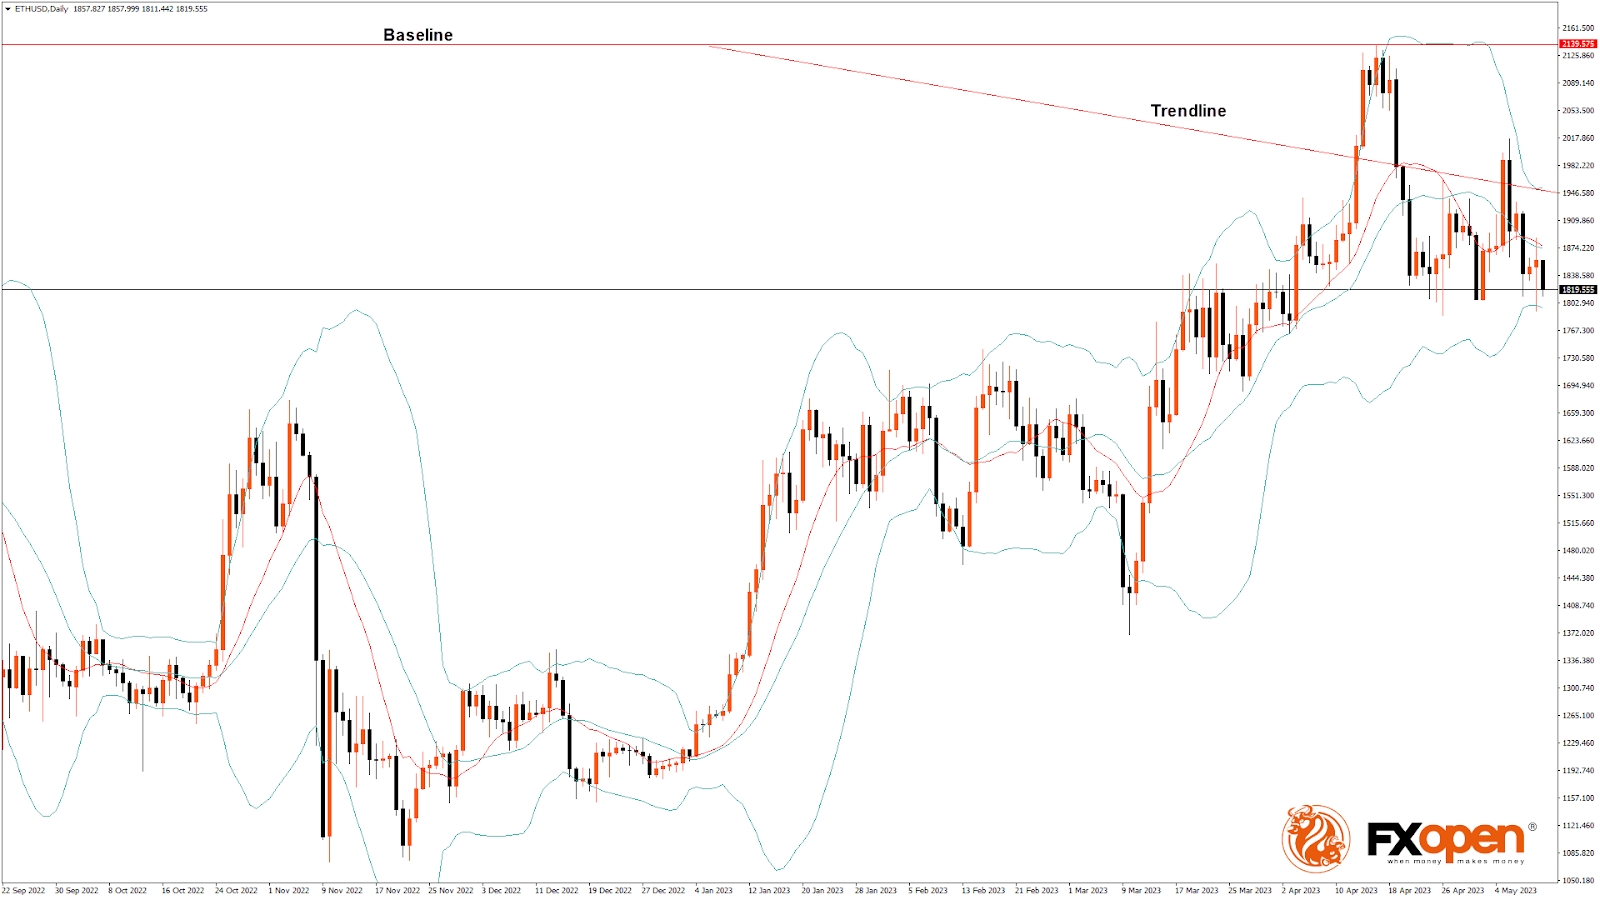
The price is about to break its classic support level of $1,805 and its Fibonacci support level of $1,811; further supports are $1,809, $1,794, which is a 1-month low, and $1,755, which is a 50% retracement from 13-week high/low.
The Week Ahead
Ethereum to USD exchange rate continues declining, below $1,850, and is expected to move towards the $1,750 level in the medium-term range in the H1 timeframe.
We see a short-term bearish trend line forming from $1,972 towards the $1,808 level.
The immediate short-term outlook for ETH has turned mildly bearish, the medium-term outlook has turned bearish, and the long-term outlook is neutral in present market conditions.
The resistance zone is at $1,847, which is a pivot point, and at $1,870, which is a 14-day RSI at 50.
The weekly outlook is $1,750 with a consolidation zone of $1,800.