

Sample Category Title
Dollar Rallies Above Key Technical Level Despite Soft Inflation, Jobs Data
As expected, the Bank of England (BoE) raised the rates by 25bp for the 12th time yesterday, and Governor Bailey left the door open for further rate hikes.
Bailey said that the lagging effects of the past rate hikes will weigh more on the economy in the coming quarters, that the BoE expects inflation to fall quickly this year, but reckoned that ‘inflation remains too high’ and that ‘repeated surprises’ pointed to the resilience of the economy and added to price pressures. As a result, the BoE will ‘stay the course’ to bring it down with further rate increases, he said.
British policymakers also made the biggest upgrade to their growth projections since the BoE gained independence since1997 – added Bloomberg.
Cable fell, and tipped a toe below the 1.25 mark, but the selloff was mostly driven by a broadly stronger US dollar.
Even though the US PPI data came in softer than expected, and US jobless claims reached the highest since October 2021 and PacWest slumped 22% after announcing that its deposits fell nearly 10% last week, and the US 2-year yield fell - all these factors normally being bearish for the dollar -, the US dollar jumped above a two-month bearish trend top.
Was yesterday’s move just a flight to safety, is it sustainable?
Looking at the EURUSD chart, it looks like the failure to clear the 1.10/1.11 offers now leads to a toppish sentiment, and that we could see a further downside correction in the EURUSD before a rebound to bring us to the 1.12 medium term target area.
In equities, the S&P500 was little changed yesterday, the S&P500 was slightly downbeat on renewed bank selloff, but Nasdaq100 extended gains to fresh highs since last summer. The falling yields clearly boost appetite in Big Tech stocks.
Decision time for Turkey
In Turkey, the BIST100 rallied almost 8% yesterday, as Muhammer Ince, one of the candidates to the presidential election, withdrew from the race, a day after he denied the ‘authenticity of an alleged sex tape and claims that he took bribes to run for president and split the opposition vote’.
His votes will still count – because there is also a parliamentary election happening simultaneously, but Mr Ince leaving the presidential race ramps up the chances for a defeat for the running President Erdogan, although Ince didn’t favour a candidate when he retreated.
On the currency front, the USDTRY continues gently to push higher.
Note that despite the ultra-lose monetary policy, abnormally low interest rates and deeply negative real rates, a massive FX intervention program from the Central Bank of Turkey kept the Turkish lira at levels significantly above the fair market value against major currencies.
It is a timebomb ready to explode in any misstep.
And a misstep could be an eventual Erdogan defeat – which would smash the castle of cards.
Right now, the actual President Erdogan's defeat is being priced in as the base case scenario. No one knows what that means for the lira, but if the lira is left to move free, it would certainly face a significant devaluation.
In the base case scenario, the formation of a new government is expected to end Turkey's ultra-loose monetary policy, halt heavy FX intervention, and readjust interest rates significantly higher to restore an understandable and orthodox monetary policy. In this case, not only that we would see a wild volatility in lira which could send the USDTRY all the way up to the 35/45 range, but we would also see Turkish policy rate lifted to 40/45% in the months following the election to match the official inflation level, while inflation would pop higher due to a potentially devastating devaluation in the lira.
Elsewhere, the Turkish equities would jump, not because investors are happy with higher rates, but because the valuation of the companies should also readjust to a new exchange rate - a significantly more expensive US dollar, hence a significantly higher valuation for Turkish stocks in terms of Turkish liras.
On a personal note, for me and my generation who have never seen Turkey ruled by anyone else than Mr. Erdogan, and any government other than his AKP party, the shock of a change would go well beyond what we could see in the markets.
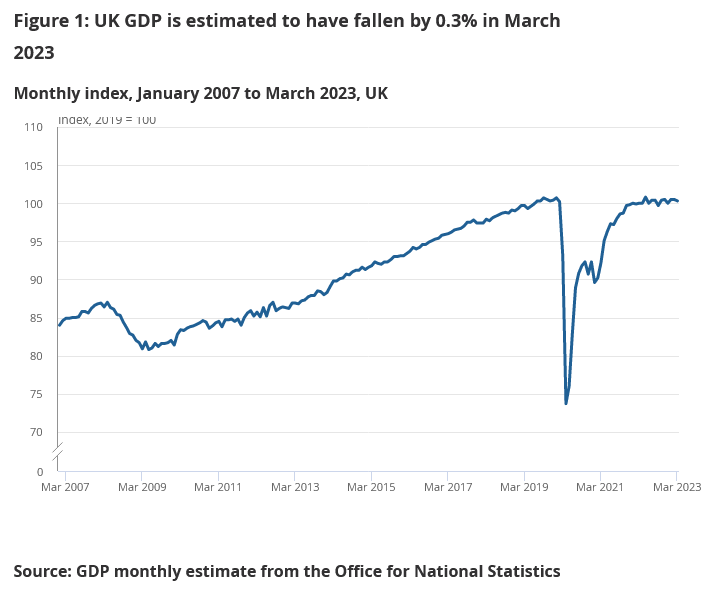
UK GDP contracted -0.3% mom in March; services main contributor to decline
UK GDP saw a contraction of -0.3% mom in March, significantly underperforming against expectations of being flat. The contraction was primarily driven by the services sector, which slipped by -0.5% in the month, following an unrevised dip of 0.1% in February.
However, not all areas of the economy were in decline. Production output experienced its strongest monthly growth since May 2021, with a 0.7% increase in March, rebounding from a 0.1% fall in February. Similarly, construction sector showed modest growth of 0.2% in March, albeit much slower than February's robust 2.6% rise.
On a quarterly basis, GDP growth for Q1 met expectations at 0.1% qoq. In output terms, services sector eked out 0.1% growth over the quarter, fueled by advancements in information and communication, and administrative and support service activities. Construction sector also saw growth at 0.7%, while the production sector managed a marginal 0.1% increase, with a slightly better 0.5% growth in manufacturing.
Year-on-year, the implied GDP deflator for Q1 2023 rose by 6.3%, indicating a slowdown from the 7.3% seen in Q4 2022. This suggests a softening of inflationary pressures within the UK economy over this period.
Technical Outlook and Review
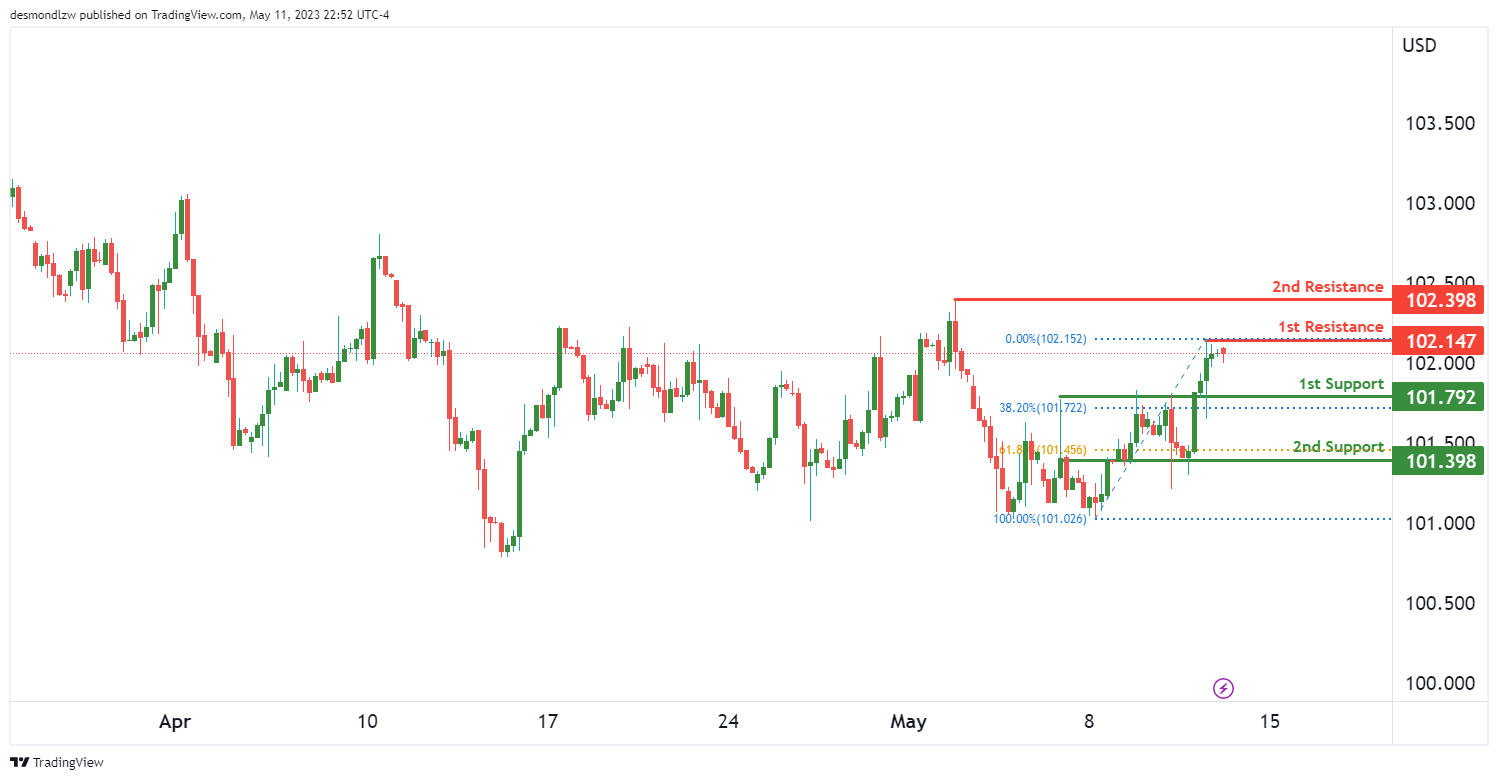
DXY:
Currently, the DXY is demonstrating a robust bullish momentum. Despite this, there’s a possibility of a further drop to the 1st support in the short term. However, the bullish outlook suggests a potential rebound from this level, pushing the price upwards towards the 1st resistance.
The 1st support is situated at 101.79. This level is characterized as an overlap support, which is a point that has previously functioned as both support and resistance. Furthermore, this level coincides with a 38.20% Fibonacci retracement, providing additional strength to the support.
The 2nd support lies at 101.39. Similar to the 1st support, this level is also an overlap support, but it aligns with a 61.80% Fibonacci retracement. This deeper retracement level could serve as a robust safety net for any potential price pullbacks.
Moving upwards, the 1st resistance is at 102.14. This level has been identified as a multi-swing high resistance, suggesting that it has consistently capped price advances in the past. If the price rebounds from the 1st support and gains momentum, it could rise to meet this resistance level.
The 2nd resistance is found at 102.39. This level is known as a swing high resistance, marking a high point in a price swing. If the bullish momentum persists and the price breaches the 1st resistance, it could potentially aim for the 2nd resistance.
EUR/USD:
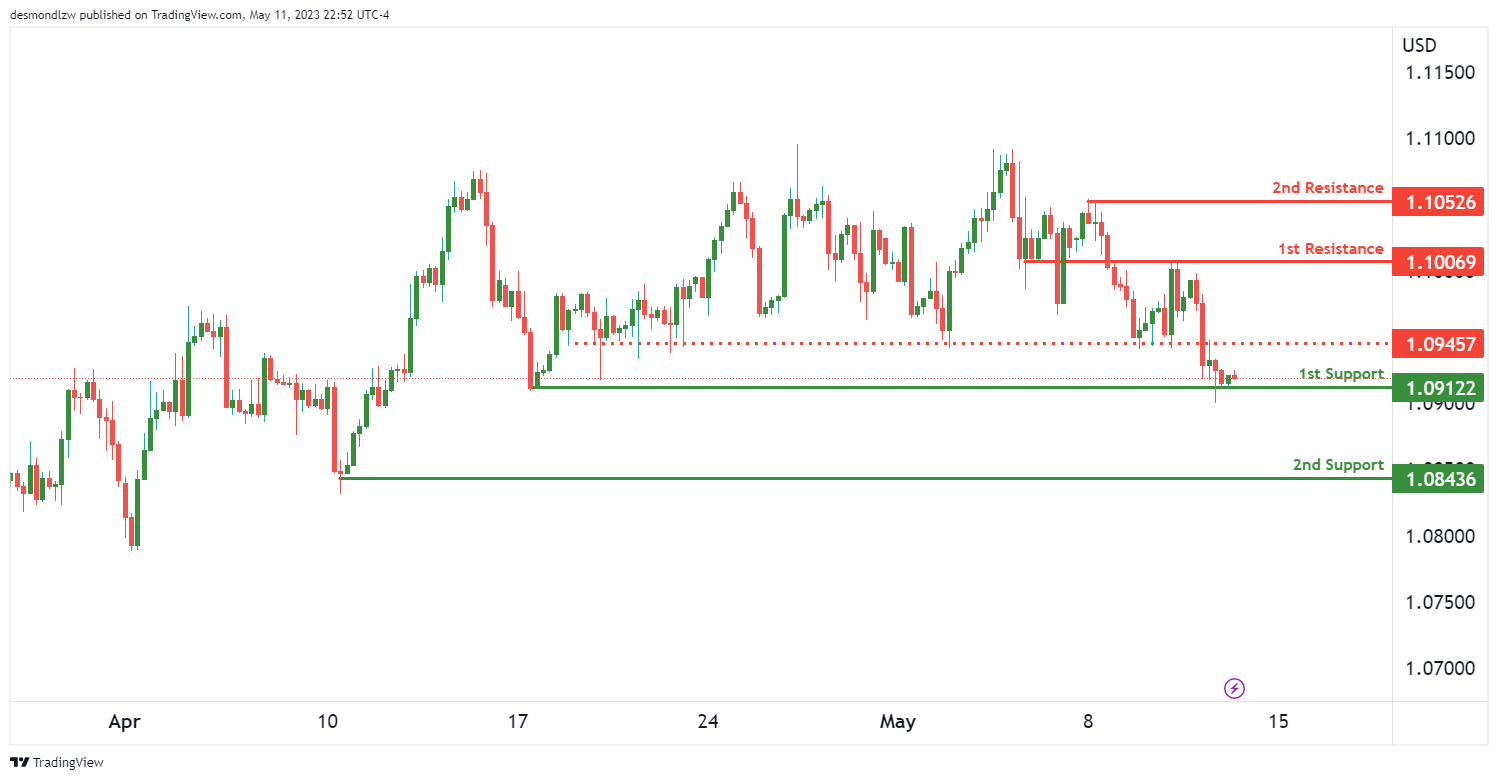
In the current situation, EUR/USD is demonstrating a bearish momentum, with the potential for a bearish break off the 1st support and a drop towards the 2nd support.
The 1st support level is found at 1.0912, which is of significance due to its multi-swing low support. This level has demonstrated its reliability over multiple trading sessions, with the price bouncing back from this point on numerous occasions. If the price were to break this first support, it could drop towards the 2nd support level.
The 2nd support is located at 1.0843. This level is known as a swing low support, which means it has previously served as a low point in the price swing. This makes it a critical level that could potentially halt further price drops, leading to a price rebound.
The 1st resistance level is at 1.1006. This level acts as an overlap resistance, which has previously served as both support and resistance. It is a critical level that could potentially halt a bullish price move and reverse the trend.
In between the current price and our 1st resistance is an intermediate resistance at 1.0945. This level is also an overlap resistance and could potentially halt a bullish price move. A break of this intermediate resistance could trigger a bearish acceleration towards our 1st resistance.
The 2nd resistance is situated at 1.1052. This level acts as a multi-swing high resistance, indicating that it has halted the price rise on multiple occasions in the past. If price were to break the 1st resistance, it could potentially rise towards the 2nd resistance. However, given the overall bearish momentum, this scenario might be less likely.
GBP/USD:
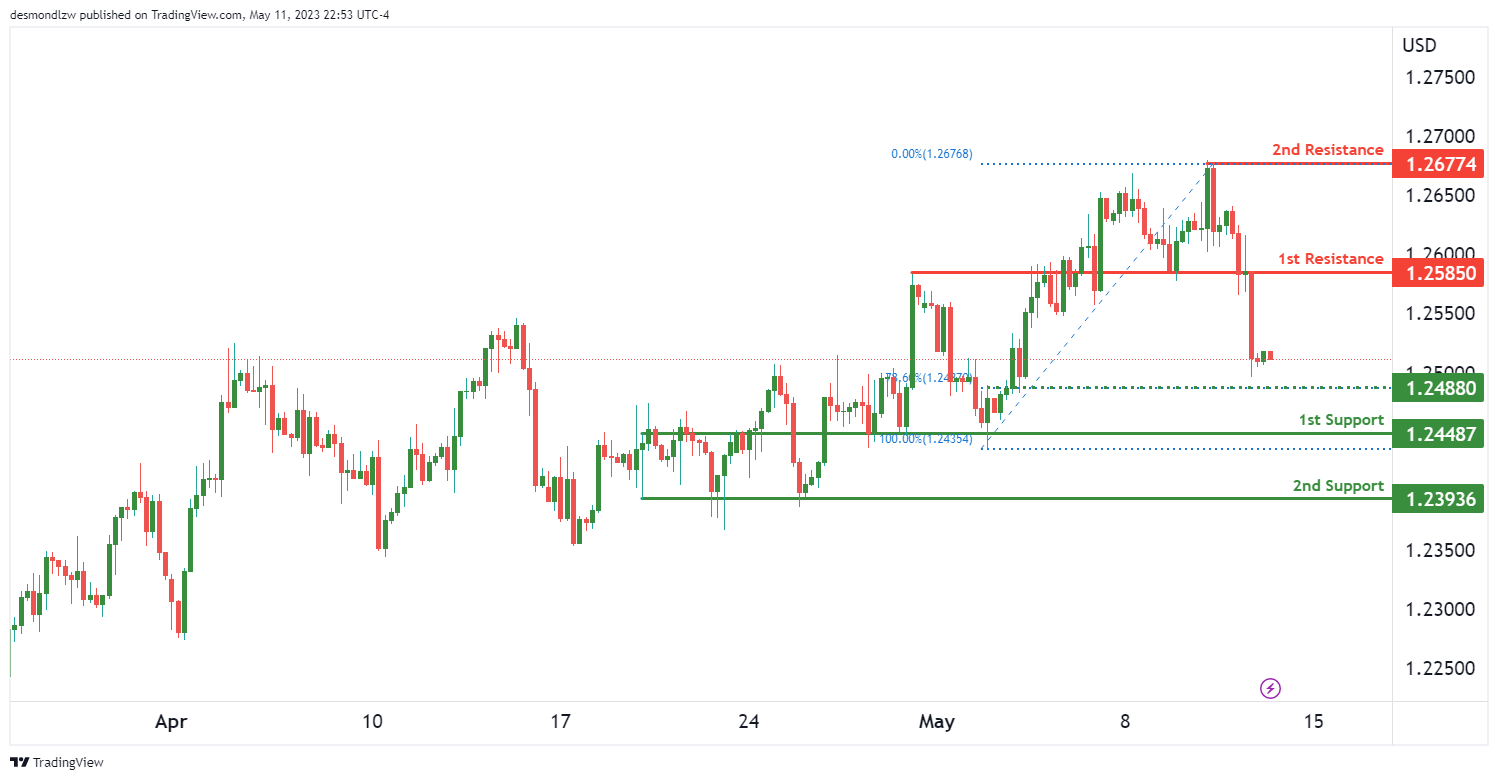
The GBP/USD is currently exhibiting a bearish momentum. The expectation is for a bearish continuation towards the 1st support.
The 1st support is located at 1.2448. This level is significant as it is an overlap support, which means it has previously acted as both a support and a resistance level. This makes it a critical level that could potentially halt further price drops, leading to a price rebound.
The 2nd support is situated at 1.2393. This level is notable for being a multi-swing low support, indicating that it has halted the price fall on multiple occasions in the past. If the price breaches the first support, it could drop towards this level.
The 1st resistance level is at 1.2585. This level is an overlap resistance, which has served as both a support and resistance point in the past. If the bearish trend reverses and the price begins to rise, this level could act as the first significant barrier to upward movement.
The 2nd resistance level is at 1.2677. This level is a swing high resistance, indicating that it has previously served as a high point in the price swing. If the price breaks through the 1st resistance, it could potentially rise towards the 2nd resistance.
In between the current price and our 1st support is an intermediate support at 1.2488. This level is also an overlap support and coincides with a 78.60% Fibonacci retracement. A break of this intermediate support could trigger a strong bearish acceleration towards our 1st support.
USD/CHF:
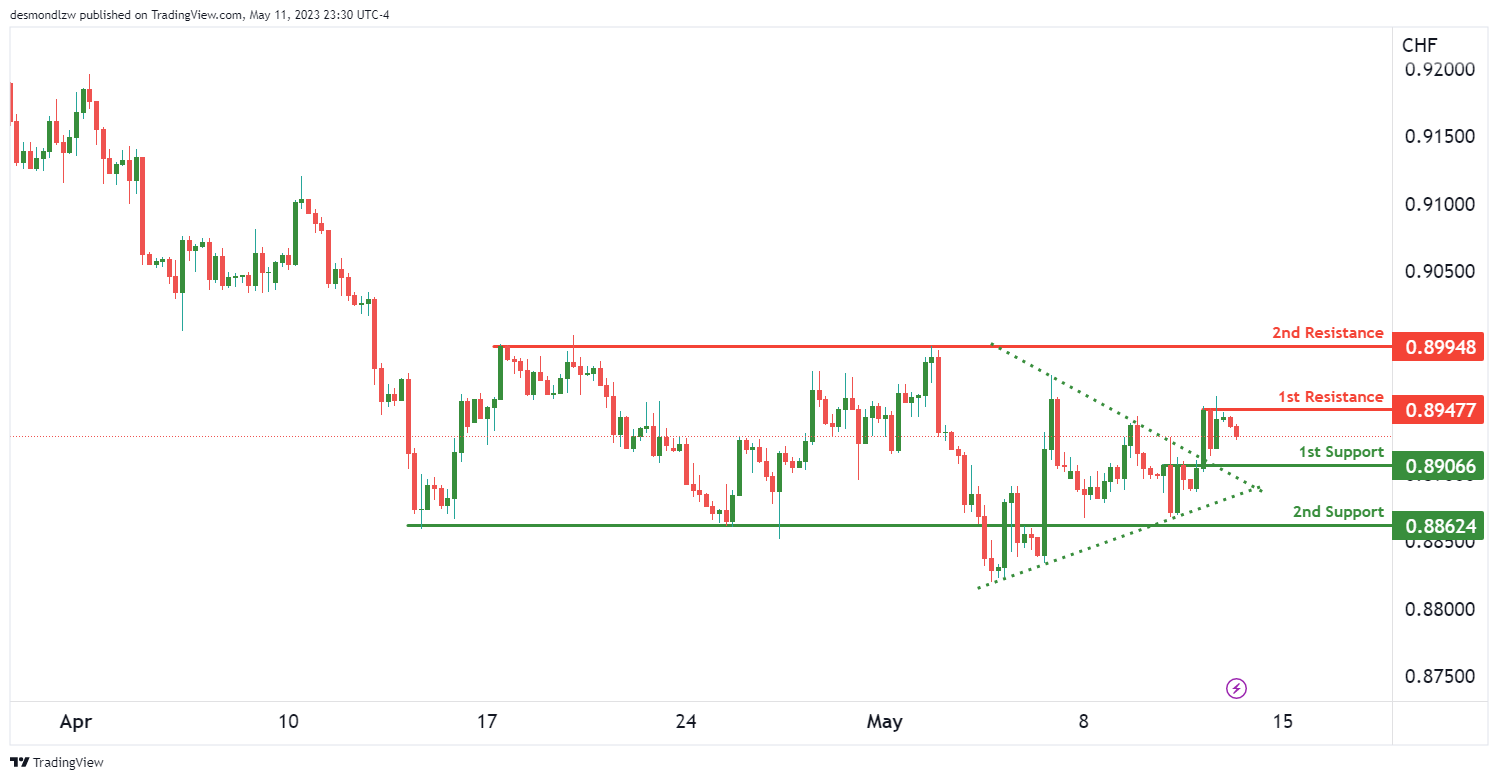
The USD/CHF is currently displaying strong bullish momentum. However, in the short term, the price could potentially drop further towards the 1st support before rebounding and rising to the 1st resistance.
The 1st support is positioned at 0.8906. This level is considered a pullback support, which signifies that it is a potential rebound point for the price following a temporary retreat from a recent upward trend.
The 2nd support is located at 0.8862. It is an overlap support, meaning it has previously acted as both a support and resistance level. If the price breaks through the first support, it could potentially drop to this level before a possible rebound.
The 1st resistance level lies at 0.8947. This level is defined as a multi-swing high resistance, indicating it has capped price advances multiple times in the past. If the price rebounds from the 1st support and gains momentum, it could rise to meet this 1st resistance.
The 2nd resistance level is situated at 0.8994. This level, similar to the 1st resistance, is a multi-swing high resistance. If the bullish momentum continues and the price breaches the 1st resistance, it could potentially aim for the 2nd resistance.
Moreover, it is worth noting that the price has broken above a symmetrical triangle chart pattern. A break above the upper trendline of the pattern could signal a bullish breakout.
USD/JPY:
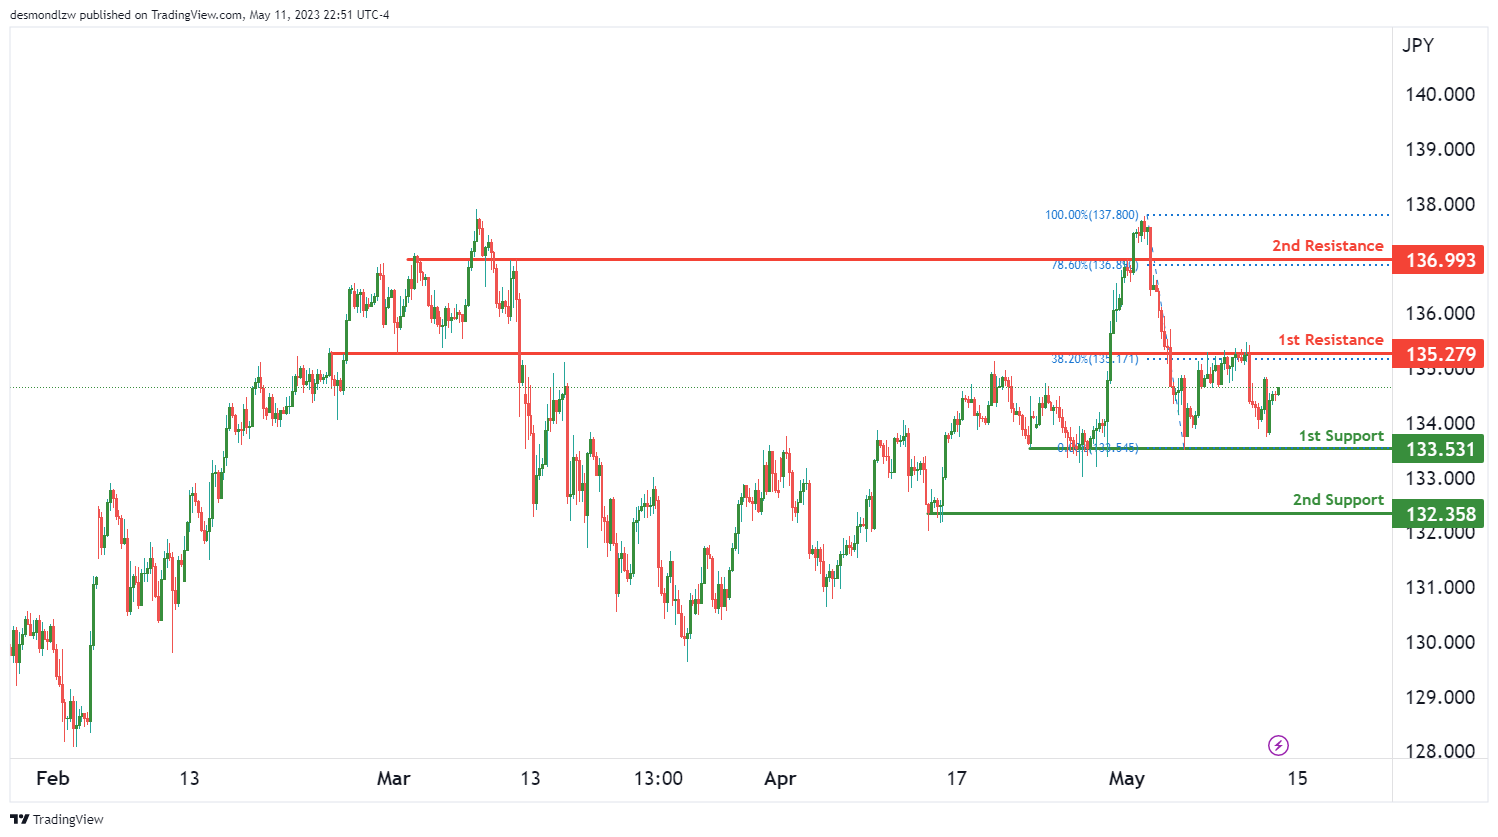
The USD/JPY is presently experiencing a bullish momentum. The price could potentially continue this trend towards the 1st resistance.
The 1st support level is found at 133.53. This level is identified as a multi-swing low support, suggesting that it has repeatedly halted price declines in the past. This level could serve as a significant barrier to further price drops and could potentially trigger a price rebound.
The 2nd support level is located at 132.35. Much like the first, it is also a multi-swing low support. If the price breaks through the 1st support, it could potentially descend to this level before a possible rebound.
Moving upwards, the 1st resistance level is at 135.27. This is an overlap resistance level, meaning it has previously acted as both support and resistance. Moreover, it coincides with a 38.20% Fibonacci retracement, adding to the strength of this resistance. If the price rebounds from the support and gains momentum, it might rise to meet this resistance level.
The 2nd resistance level is situated at 136.99. This level is also an overlap resistance but aligns with a deeper, 78.60% Fibonacci retracement. If the bullish momentum persists and the price breaches the 1st resistance, it could aim for this 2nd resistance.
AUD/USD:
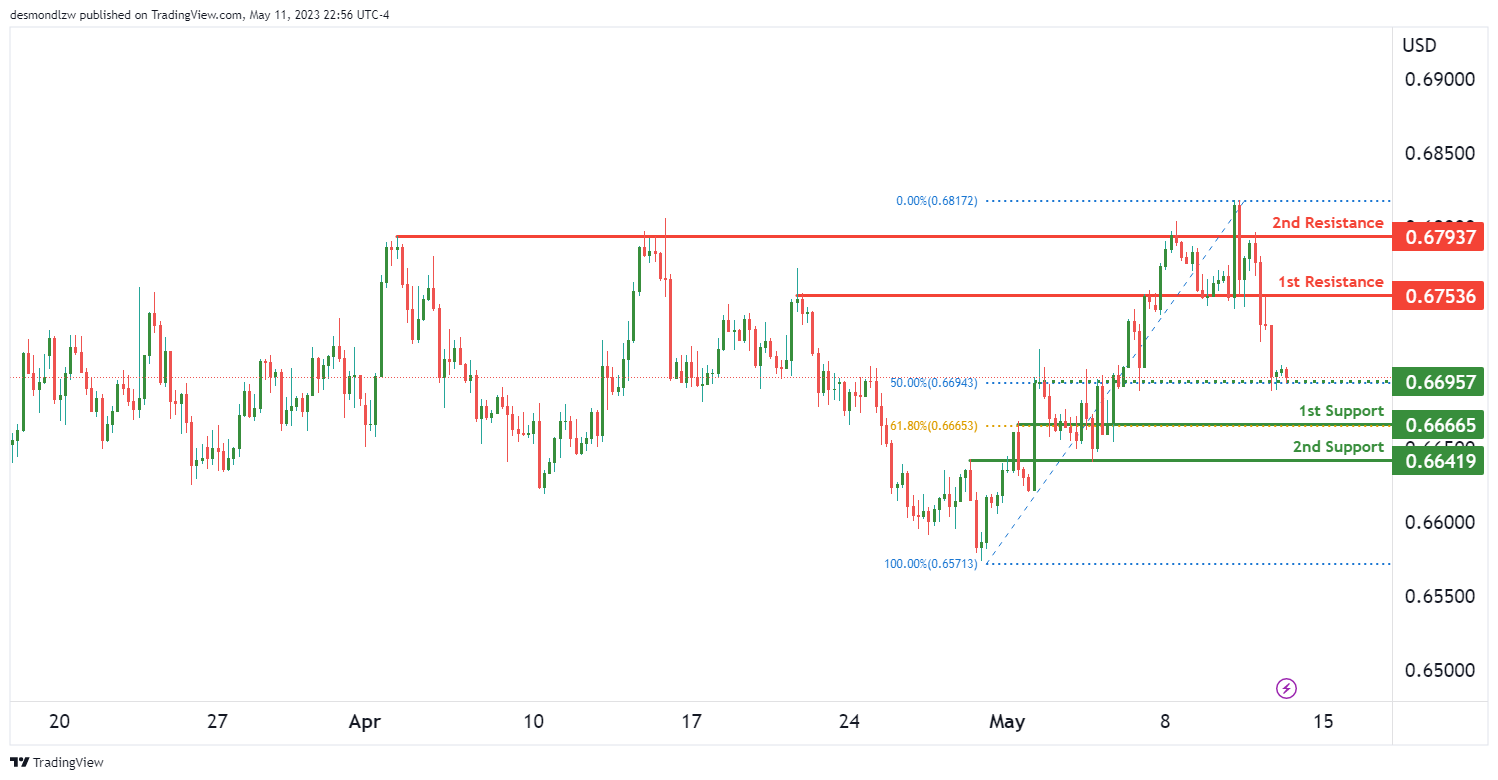
The AUD/USD is currently demonstrating a bearish momentum. The price could potentially continue this downward trend towards the 1st support.
The 1st support level is situated at 0.6666. This is a pullback support, which means it might be a potential point of price rebound following a temporary retreat from a recent upward trend. Furthermore, this support level coincides with a 61.80% Fibonacci retracement, which often serves as a crucial level in market retracements.
The 2nd support level lies at 0.6641. This level is an overlap support, indicating that it has previously served as both a support and resistance level. If the price breaks through the first support, it could potentially descend to this level before a possible rebound.
The 1st resistance level is located at 0.6753. This is an overlap resistance, meaning it has previously acted as both support and resistance. If the price reverses its current bearish momentum and begins to rise, it could potentially reach this resistance level.
The 2nd resistance level is positioned at 0.6793. This level, much like the first, is an overlap resistance. If a bullish reversal occurs and the price surpasses the 1st resistance, it could aim for this 2nd resistance.
Moreover, there is an intermediate support level at 0.6695. This level, which is an overlap support, coincides with a 50% Fibonacci retracement, further strengthening its significance.
NZD/USD
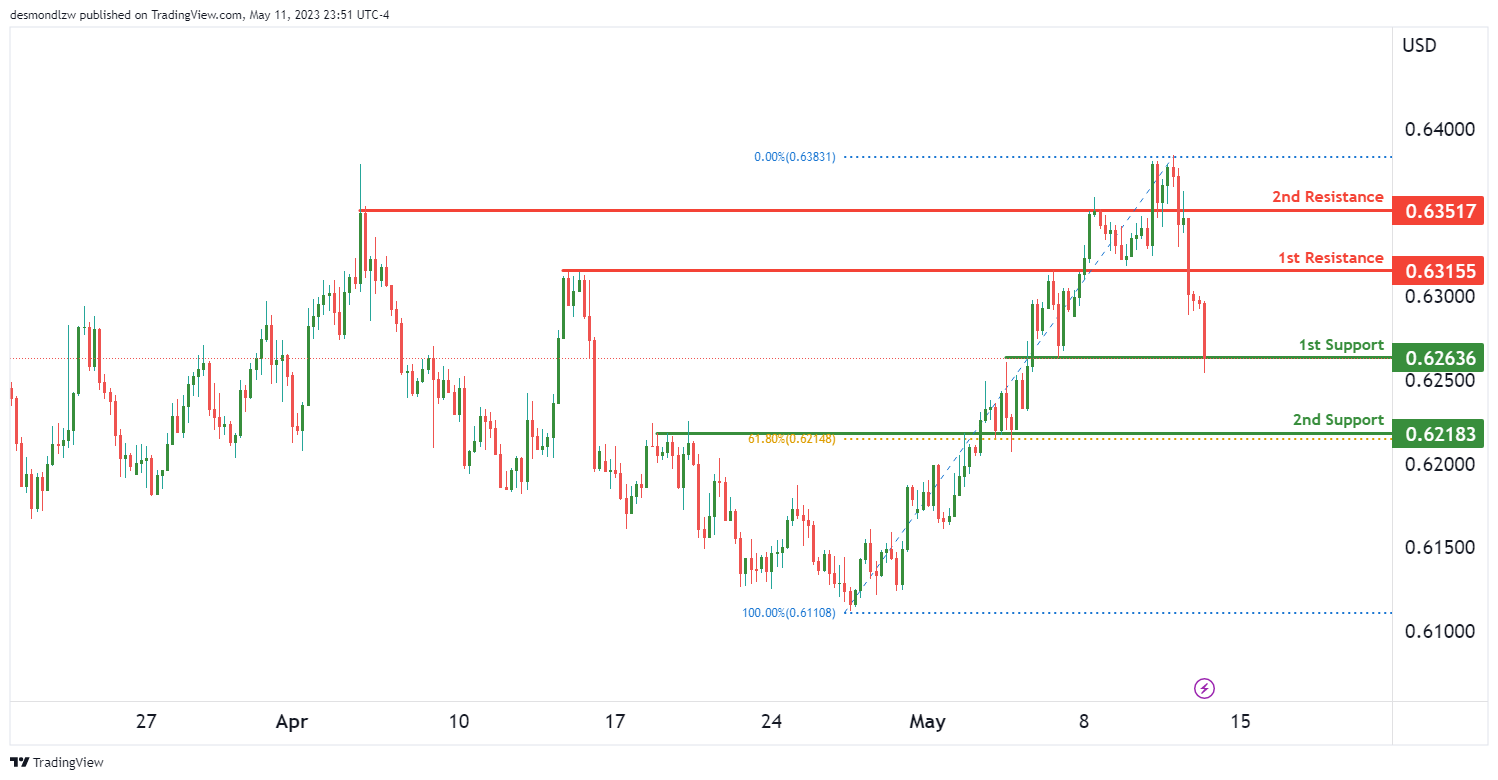
Currently, the NZD/USD is exhibiting a bearish momentum. The price may continue this downward trend, possibly moving towards the 1st support.
The 1st support level is located at 0.6263. It is an overlap support, indicating that it has previously acted as both a support and resistance level. This level may serve as a significant barrier against further price declines, potentially causing the price to bounce.
The 2nd support level is at 0.6218. This level, too, is an overlap support, but it aligns with a deeper 61.80% Fibonacci retracement, adding to its potential strength. If the price breaches the 1st support, it could continue its descent to this level before a possible rebound.
The 1st resistance level is set at 0.6315. It is a pullback resistance, meaning it could be a point where the price reverses its current downward trend. If the price were to rebound and start to rise, it might meet this resistance.
The 2nd resistance level is at 0.6351. This level is an overlap resistance, suggesting that it has previously served as both support and resistance. If the price breaks through the 1st resistance, it could potentially ascend towards this level.
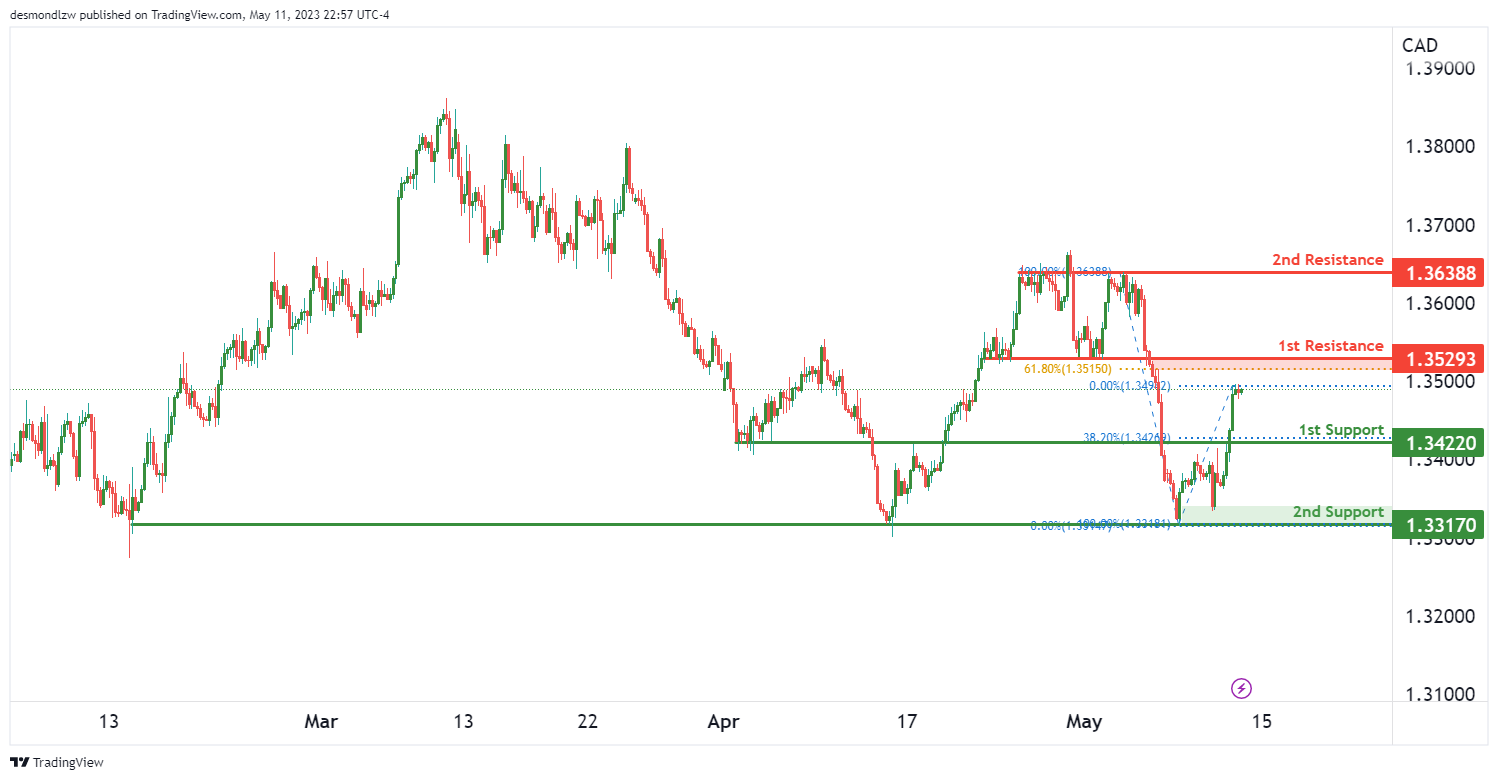
USD/CAD:
Currently, the USD/CAD is presenting a bullish momentum. The price could potentially continue this upward trajectory towards the 1st resistance.
The 1st support level is situated at 1.3422. This level serves as a pullback support, which could be an area where the price may bounce after a short-term retreat from its current upward momentum. This support aligns with a 38.20% Fibonacci retracement, further enhancing its potential strength.
The 2nd support level is set at 1.3317. It serves as a multi-swing low support, indicating that it has been a point of rebound for the price multiple times in the past. If the price falls below the 1st support, it could potentially descend to this level before experiencing a potential rebound.
The 1st resistance level is located at 1.3529. This pullback resistance could potentially be a level where the price may face resistance in its current upward movement. It coincides with a 61.80% Fibonacci retracement, which often acts as a significant barrier in a bullish market.
The 2nd resistance level is at 1.3638. This level is an overlap resistance, suggesting that it has previously acted as both support and resistance. If the price breaks through the 1st resistance, it could aim to reach this 2nd resistance.
DJ30:
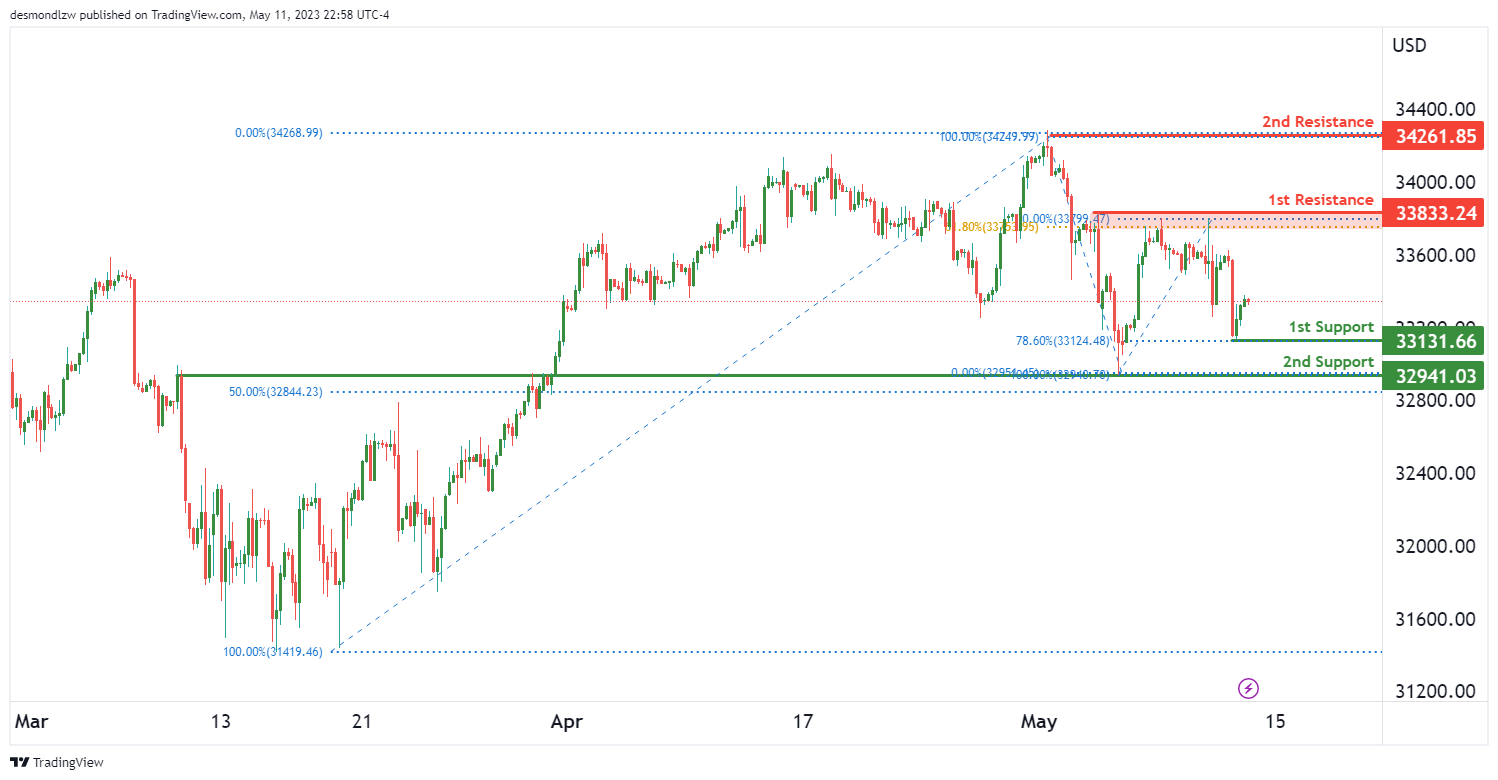
the Dow Jones Industrial Average (DJ30) is displaying a bullish momentum. The price could potentially continue its upward movement towards the 1st resistance.
The 1st support level is located at 33131.66. This level serves as a pullback support and is a potential area where the price may bounce after a short-term decrease from its current upward momentum. This support aligns with a 78.60% Fibonacci retracement, further strengthening its potential robustness.
The 2nd support level is set at 32941.03. This level acts as an overlap support, indicating that it has previously served as both a resistance and support level. Moreover, it coincides with a 50% Fibonacci retracement, which could reinforce this level’s significance. If the price retreats below the 1st support, it could potentially descend to this level before making a potential rebound.
The 1st resistance level is situated at 33833.24. This level is a multi-swing high resistance and could potentially be a point where the price may face resistance in its current upward movement. It coincides with a 61.80% Fibonacci retracement, adding to its significance as a potential barrier in the market.
The 2nd resistance level is at 34261.85. This level is a multi-swing high resistance, suggesting that it has been a point of reversal for the price multiple times in the past. If the price breaks through the 1st resistance, it could strive to reach this 2nd resistance.
GER30:
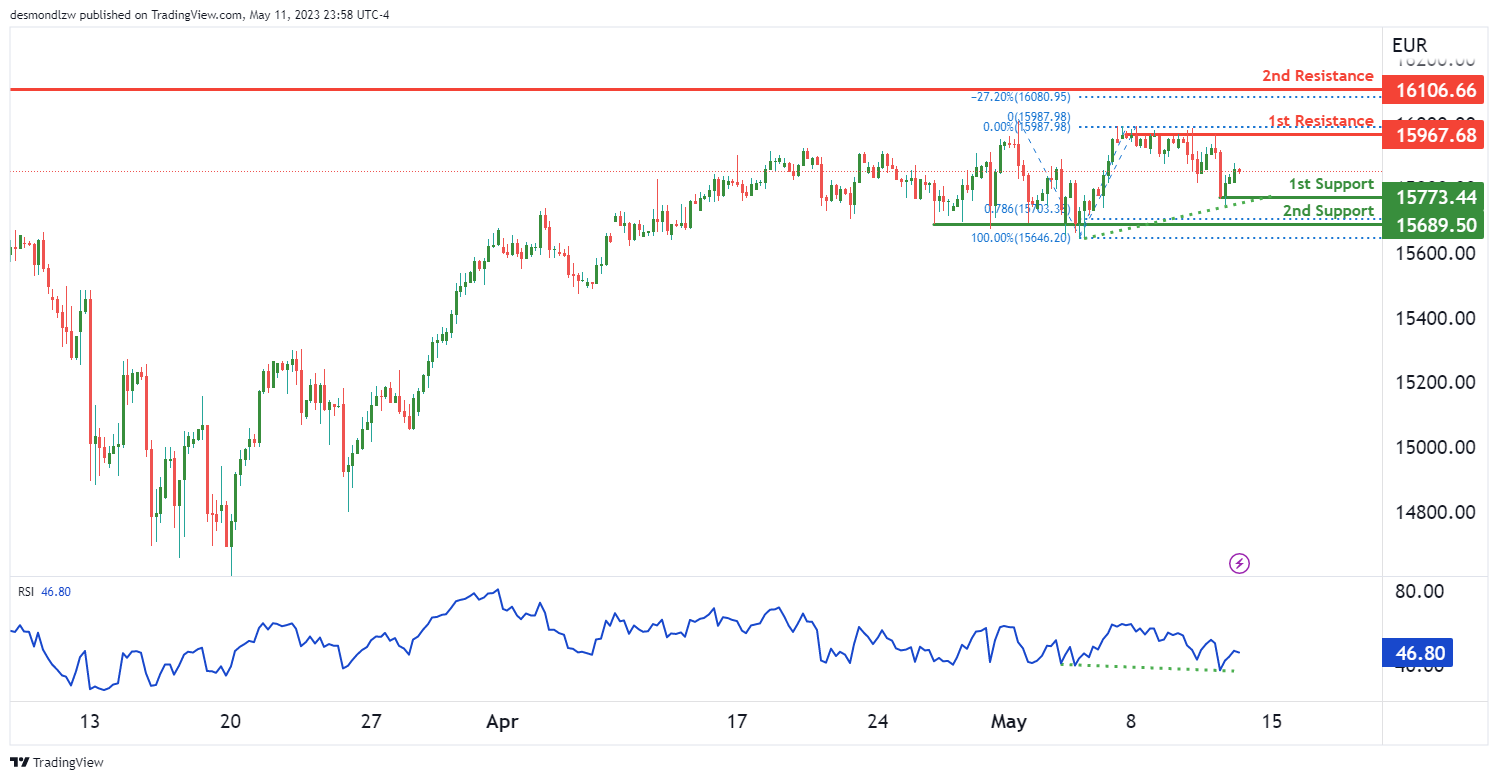
The German Stock Index, also known as the GER30 or DAX30, currently shows bullish momentum in the chart. This suggests that we could potentially see a continuation of this upward trend, with the price aiming to reach the 1st resistance level.
The 1st support level is at 15773.44. This level is significant due to it being a swing low support, a point where the price has previously reversed direction from decreasing to increasing.
The 2nd support level is at 15689.50. It is a multi-swing low support, indicating that it has been a point of price reversal multiple times in the past. Additionally, this level aligns with a 78.60% Fibonacci projection, which strengthens its potential robustness as a support level.
Moving to resistance, the 1st resistance level is located at 15967.68. This is a multi-swing high resistance, suggesting it has previously been a point of reversal for the price. If the bullish trend continues, we may see the price aim for this level.
The 2nd resistance level, at 16106.66, is another significant level to monitor. It represents a swing high resistance and coincides with a -27% Fibonacci expansion, further highlighting its potential as a critical resistance point.
It is also worth noting that the Relative Strength Index (RSI), a momentum oscillator, is displaying hidden bullish divergence versus the price. This situation usually suggests a possible trend reversal or a strengthening of the current trend. In this case, with the existing bullish momentum, it suggests a likely rapid incline in price.
BTC/USD:
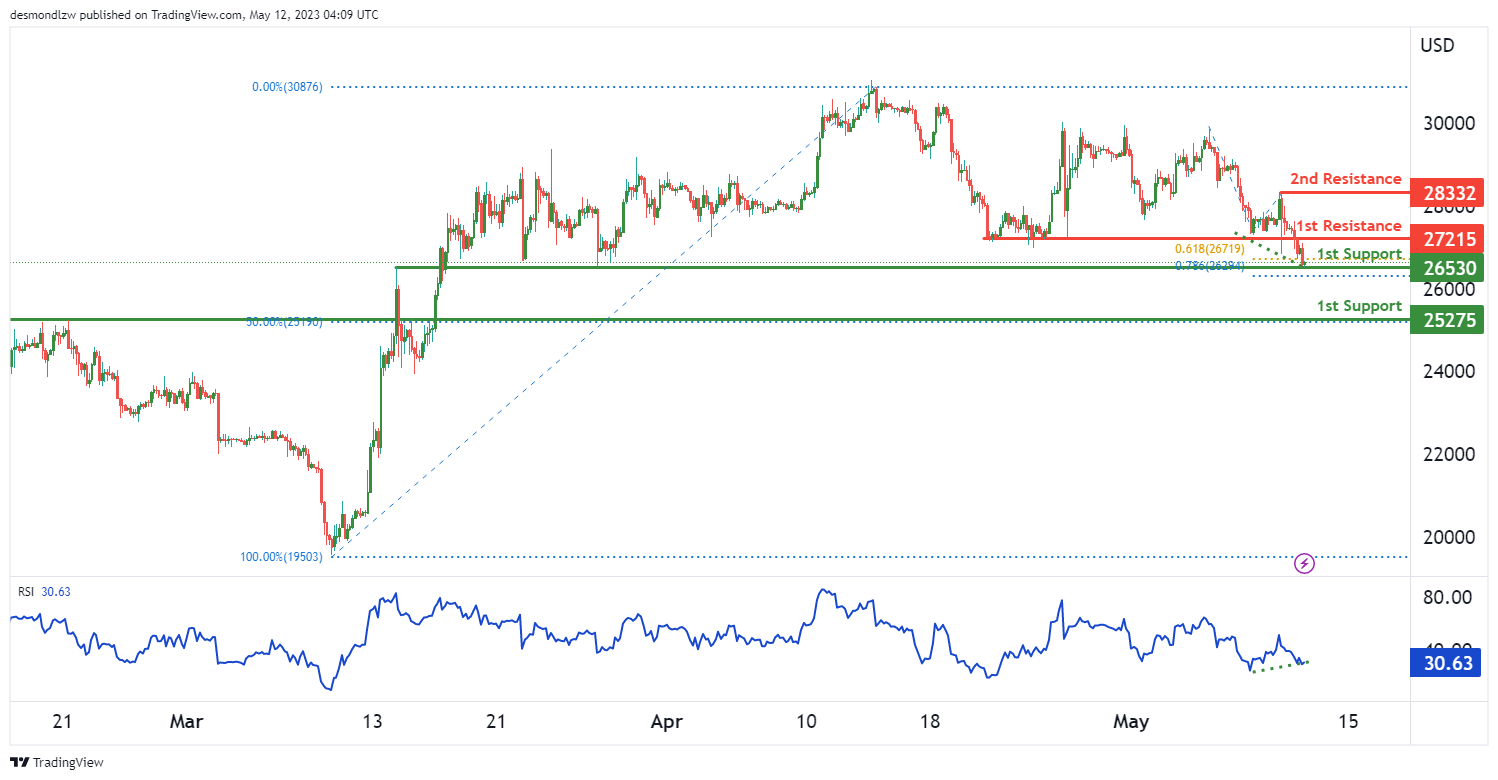
The Bitcoin to US Dollar (BTC/USD) pair currently demonstrates a bullish momentum on its chart, potentially heading for a continuation towards its 1st resistance level.
The 1st support level is stationed at 26530. It is seen as a significant point, acting as an overlap support. This level has historically served as both support and resistance, which gives it its importance.
The 2nd support level, a pullback support, is marked at 25275. A pullback support is a level where we might expect the price to ‘retrace’ during a downtrend before potentially resuming its overall bullish trend.
On the flip side, if the bullish momentum maintains its course, the 1st resistance level at 27215 could be the next target. This level acts as an overlap resistance, indicating that it has been a turning point where the price has previously switched from a rising to a falling trend.
The 2nd resistance level is set at 28332, identified as a swing high resistance. This point is where the price has previously reached a peak before reversing to a downtrend.
Another essential factor to consider is the Relative Strength Index (RSI), which is currently displaying bullish divergence versus the price. This divergence suggests that there could be a rapid incline in price in the near future.
US500
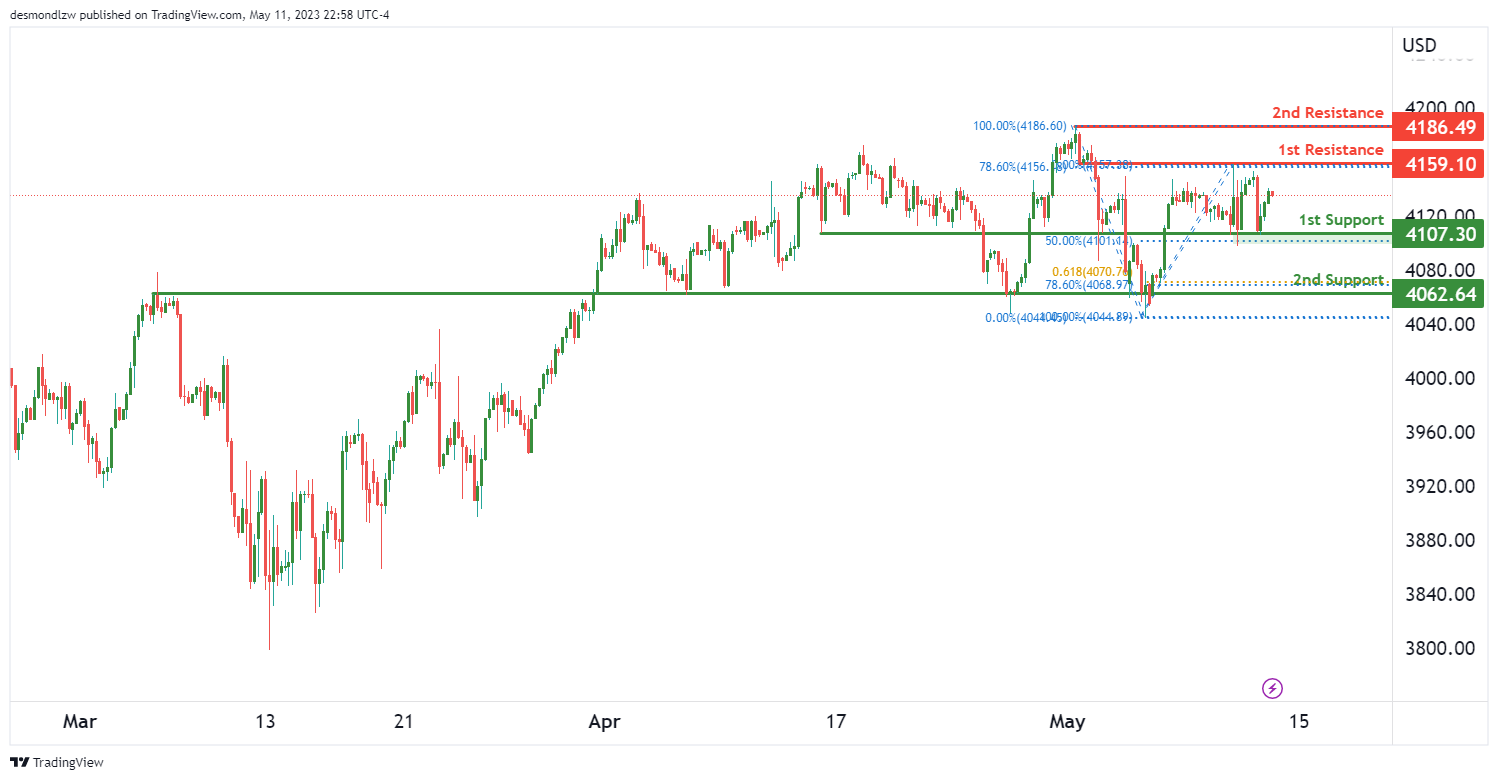
The US500, also known as the S&P 500 Index, is currently showcasing a bullish momentum in its chart dynamics. The momentum indicates the potential for a bullish continuation towards the first resistance level.
The first support level is pinpointed at 4107.30. This level, identified as an overlap support, is also reinforced by its alignment with the 50% Fibonacci retracement level. The Fibonacci retracement is a popular tool among traders to predict potential areas of support and resistance. This overlap support is historically significant as it has seen the price bouncing back on previous occasions.
The second support level is situated at 4062.64, another crucial overlap support. This level further aligns with both the 78.60% Fibonacci retracement and the 61.80% Fibonacci projection, increasing its significance. These Fibonacci levels suggest that this support level might be a strong area for potential price rebounds.
Looking upward, if the bullish momentum persists, we could witness the price reaching towards the first resistance level at 4159.10. This level, identified as an overlap resistance, also aligns with the 78.60% Fibonacci retracement, making it a substantial level to overcome for the continuation of the bullish trend.
The second resistance level is observed at 4186.49, recognized as a swing high resistance. This level is important as it has historically acted as a ceiling for the price, where the price reversed its uptrend.
ETH/USD:
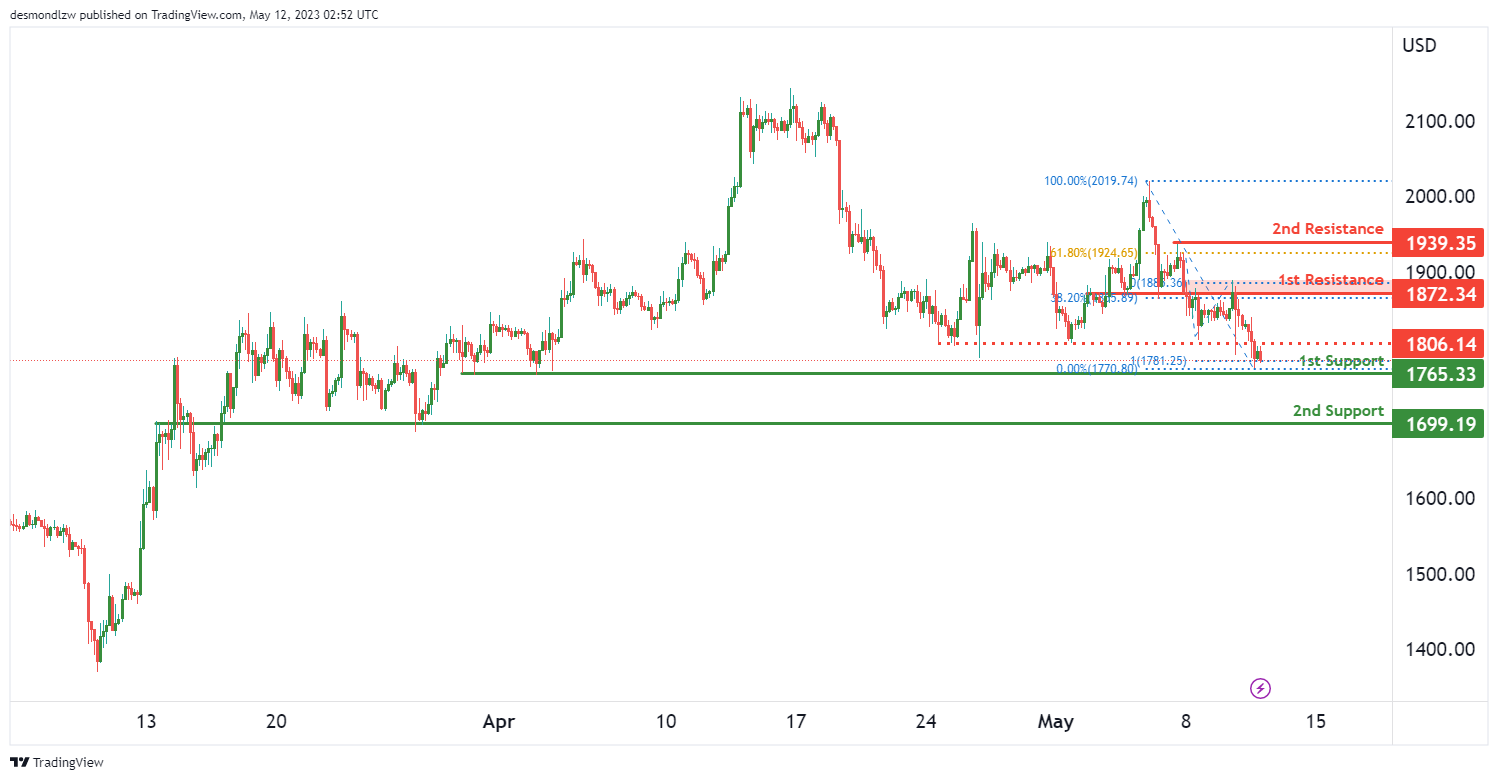
The Ethereum is currently showing bullish momentum. However, in the short term, the price could potentially drop further to the first support level before bouncing back and rising towards the first resistance level.
The first support level is identified at 1765.33. This level, designated as a multi-swing low support, is also noteworthy because of its alignment with the 100% Fibonacci projection level. This coincidence can potentially make it a strong area for price bounce-back.
The second support level is situated at 1688.19. This overlap support is also significant, as the price has previously bounced back from this level on multiple occasions.
If the price recovers from these support levels and the bullish momentum continues, the first resistance level to look out for is at 1872.34. This level, identified as an overlap resistance, also aligns with the 38.20% Fibonacci retracement level, suggesting it could be a substantial obstacle for the price to overcome.
The second resistance level is observed at 1939.35, which is recognized as a swing high resistance. It also coincides with the 61.80% Fibonacci retracement level, further reinforcing its significance as a potential hurdle for the upward price momentum.
There is also an intermediate resistance level at 1806.14, which is considered an overlap resistance. This could be another area where the price may face some resistance during its upward trajectory.
WTI/USD:
The WTI (West Texas Intermediate) crude oil market is currently showing a bearish momentum. However, in the short term, the price could potentially rise towards the first resistance level before reversing and dropping towards the first support level.
The first support level is situated at 69.79. This level, identified as a pullback support, also aligns with the 38.20% Fibonacci retracement level. This suggests it could be a significant area for price bounce-back if the downward trend continues.
The second support level is observed at 67.49. This multi-swing low support coincides with the 61.80% Fibonacci retracement level, potentially reinforcing its strength as a support level.
If the price manages a short-term rise, the first resistance level to look out for is at 71.66. This level, identified as an overlap resistance, could be a considerable obstacle for the price to overcome before it continues its downward momentum.
The second resistance level is found at 73.96, which is also an overlap resistance. It aligns with the 50% Fibonacci retracement level, further underlining its potential as a significant hurdle for the price.
XAU/USD (GOLD):
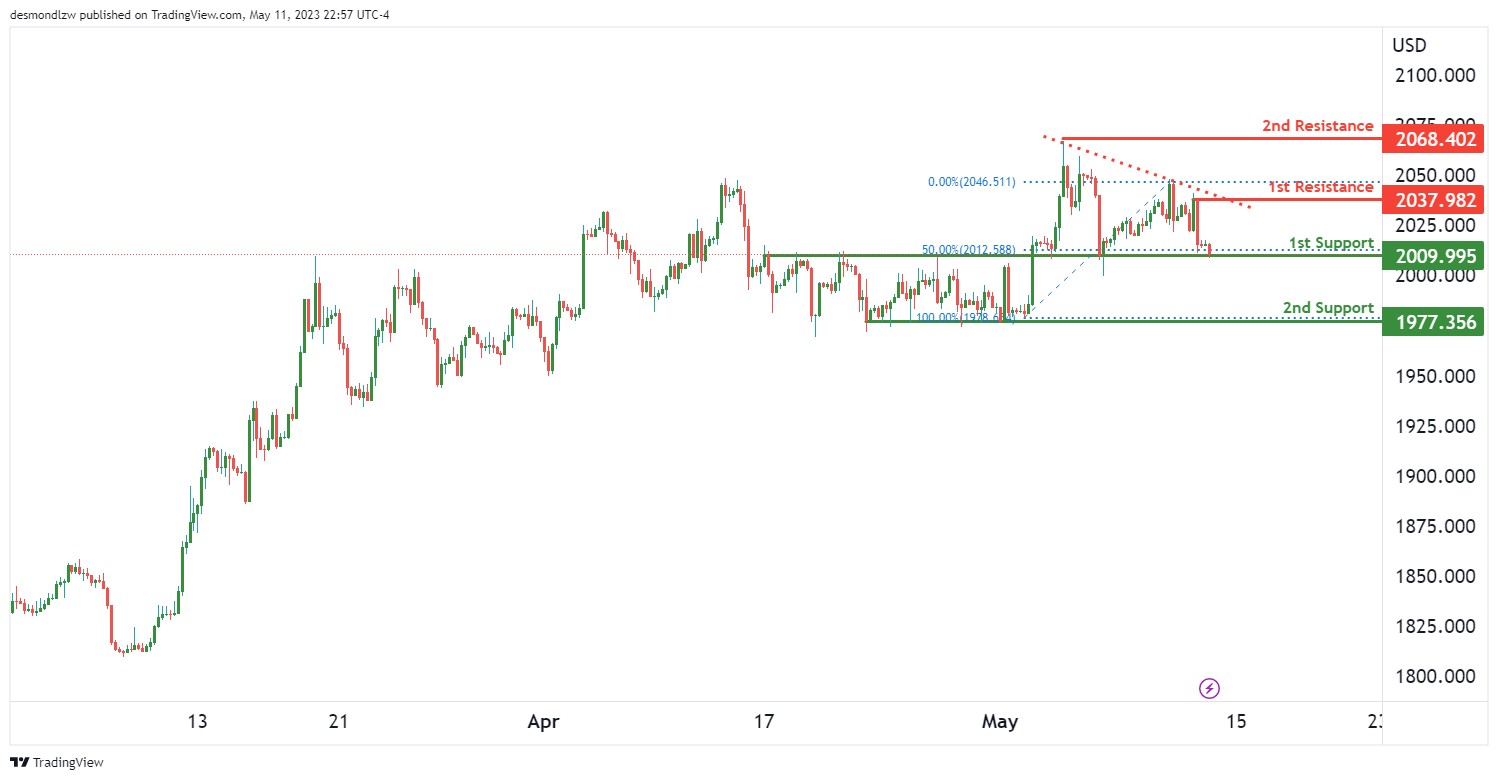
The XAU/USD pair (Gold against the US Dollar) currently shows a bearish momentum. A significant factor contributing to this momentum is that the price is below a major descending trend line, suggesting a potential continuation of the bearish trend.
In the short-term, the price could potentially make a bearish break off the first support level and drop towards the second support level.
The first support level is at 2009.99, identified as an overlap support. This level also coincides with the 50% Fibonacci retracement level, suggesting it could be a significant area for a potential price bounce-back if the downward trend continues.
The second support level is at 1977.35, characterized as a multi-swing low support. This could serve as a strong foundation for price reversal, given its historical significance.
On the upside, the first resistance level is at 2037.98, identified as a swing high resistance. This level could pose a significant barrier for price advancements.
The second resistance level is at 2068.40, also a swing high resistance. This level may further obstruct price movements upwards, given its historical relevance as a level where price reversals have occurred in the past.
GBP/JPY Daily Outlook
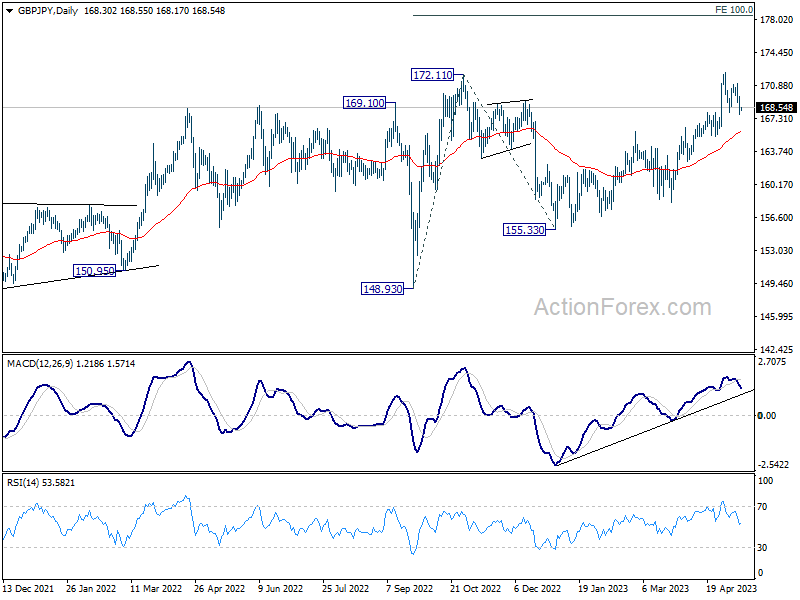
Daily Pivots: (S1) 167.55; (P) 168.66; (R1) 169.47; More...
GBP/JPY dropped notably overnight but recovering after hitting 167.95 resistance turned support. Intraday bias stays neutral first. Further rally could still be seen with 167.95 intact. On the upside, break of 172.30 will resume larger up trend to 100% projection of 148.93 to 172.11 from 155.33 at 178.51. Nevertheless, firm break of 167.95 should confirm short term topping, and turn bias back to the downside for deeper pull back to 165.40 support and possible below instead.
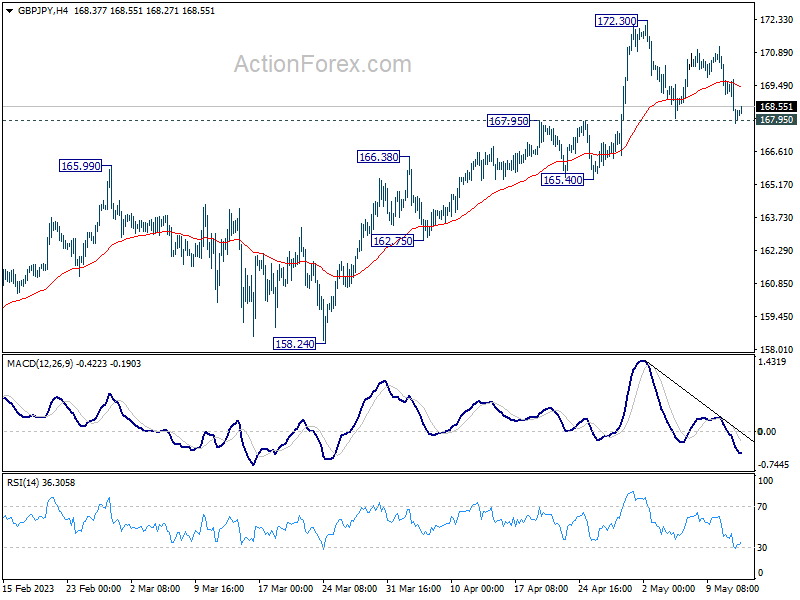
In the bigger picture, based on current momentum, up trend from 123.94 (2020 low) is likely ready to resume. Next target is 161.8% projection of 122.75 (2016 low) to 156.59 (2018 high) from 123.94 at 178.69. This will now remain the favored case as long as 165.40 support holds, in case of retreat.
Sterling Hit by BoE Bailey; Aussie Suffers Amid Copper Price Decline
In the wake of comments from BoE Governor Andrew Bailey suggesting a potential pause in rate hikes, Sterling has taken a sharp downward turn overnight. Despite the expected 25bps hike yesterday, Bailey's interview with Bloomberg TV sent ripples through the market, causing a broad sell-off of the Pound. With UK GDP data on the horizon, Sterling's performance remains under scrutiny. However, unless GDP figures significantly exceed expectations, it's more probable than not that Sterling will conclude the week as one of the weakest performers.
Meanwhile, Australian Dollar the worst performer for the week so far, taking a hit from the drastic fall in Copper prices and growing concerns over China's economy. Euro is trailing closely behind Sterling as the third weakest currency. New Zealand Dollar is also losing ground following RBNZ's inflation expectations survey. As risk aversion grows in the commodity sector, Yen, Dollar, and Swiss Franc are gaining traction.
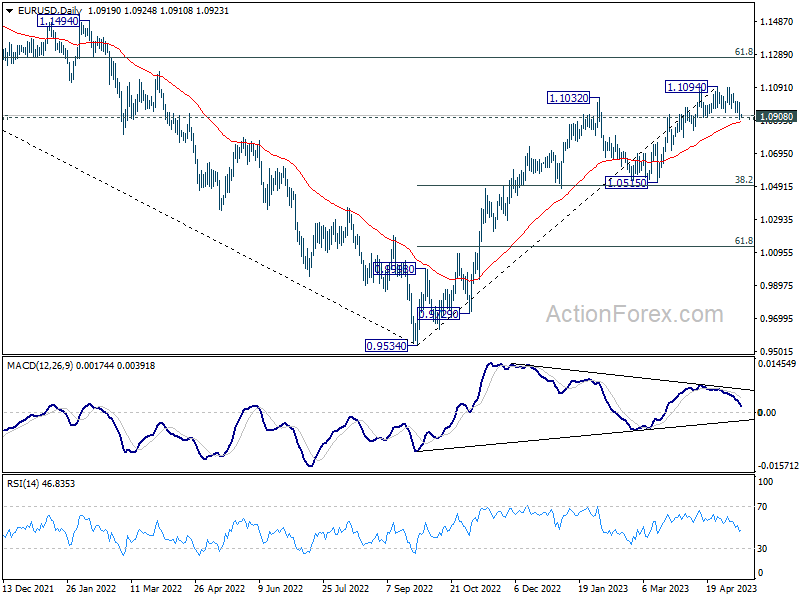
From a technical perspective, the unfolding scenarios in both EUR/USD and USD/CHF markets will be key areas of focus in the coming days. Should EUR/USD see a firm break of 1.0908 support, it would confirm a short-term top and suggest that the pair is already in correction to its entire uptrend from 2022 low of 0.9534. Concurrently, if USD/CHF can decisively break 0.8993 resistance, it would confirm short-term bottom at 0.8818, indicating a potential correction of its entire downtrend from 2022 high at 1.0146. If these scenarios materialize, we could see more upbeat Dollar outlook for the remainder of Q2.
In Asia, at the time of writing, Nikkei is up 0.87%. Hong Kong HSI is down -0.13%. China Shanghai SSE is down -0.40%. Singapore Strait Times is down -0.83%. Japan 10-year JGB yield is down -0.0187 at 0.373. Overnight, DOW dropped -0.66%. S&P 500 dropped -0.17%. NASDAQ rose 0.18%. 10-year yield dropped -0.042 to 3.397.
ECB de Guindos: What worries me is trend in service prices
ECB Vice President Luis de Guindos assured yesterday that "There is no doubt headline inflation will continue to ease". However, he added a note of caution, "But there are more doubts about underlying inflation."
De Guindos expressed particular concern about the inflation trend in service prices, a sector showing increased momentum due to rising demand and accelerating salary increases. "What worries me the most in the underlying inflation trend is the trend in service prices," he revealed. "Momentum in services... is rising. There's demand and that's because salary increases are accelerating."
When discussing future interest rate hikes, de Guindos stated, "There could be more interest rate hikes, but their size will depend on upcoming data and the effect tighter credit will have on economic activity."
Market expectations lean towards a 25bps increase at the June meeting, with a potential additional hike by summer's end, followed by rate cuts in early next year. However, de Guindos urged caution in predicting these outcomes. "Don't believe anybody who tells you what the terminal rate is going to be," he said. "I don't feel comfortable or uncomfortable but markets can be wrong about this."
New Zealand BNZ PMI rose to 49.1, but struggles continue
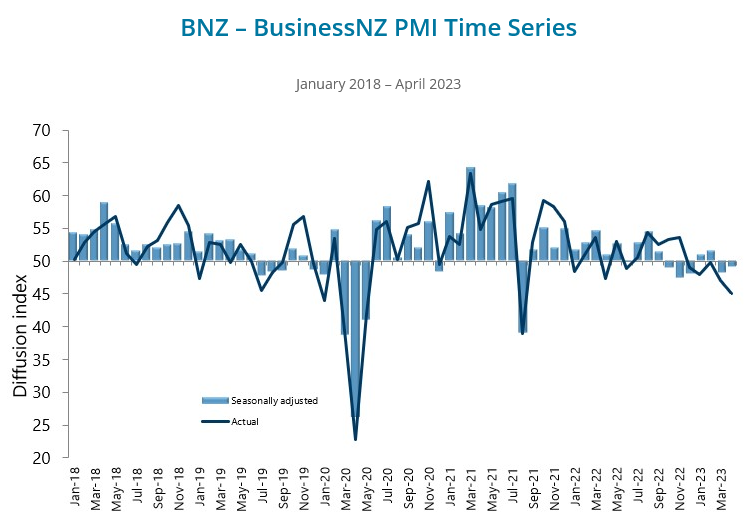
New Zealand's manufacturing sector is continuing to grapple with challenges as BusinessNZ Performance of Manufacturing Index edged up to 49.1 in April, from 48.1 in March, remaining below neutral 50.0 mark that separates expansion from contraction.
While the index ticked higher, five of the last seven months have seen contraction, indicating ongoing stress in the sector. In fact, the proportion of negative comments rose to 70.3% in April, compared with 63.2% in March and 60.2% in February. Manufacturers expressed concerns over price pressures, staffing issues, and lower demand, mirroring the broader economic challenges faced by the country.
Digging deeper into the data, we see that production rose from 43.4 to 47.0 and employment edged up from 47.3 to 47.8. New orders also improved, rising from 46.9 to 49.8, but these sub-indexes remained in contraction territory. Finished stocks increased from 48.5 to 52.5, while deliveries dropped from 53.9 to 51.5.
Catherine Beard, BusinessNZ's Director of Advocacy, commented on the tough conditions, noting the stresses and strains of the wider economy appear to be playing out in the manufacturing sector. She further added that despite the overall activity not straying too far into contraction, the sector seems unable to regain expansion mode, with key indicators of production and new orders failing to return positive results in April.
RBNZ survey sees notable decline in inflation expectations, NZD/USD tumbles
According to RBNZ Q2 Survey of Expectations (Business), inflation expectations for the year ahead took a notable dip, marking the largest drop since June 2020. The one-year-ahead inflation expectation declined by -83 basis points, moving from 5.11% down to 4.28%.
Further into the future, expectations for inflation over a two-year period also demonstrated a decrease. The mean two-year-ahead inflation expectation fell by -51 basis points from 3.30% to 2.79%, placing it back within RBNZ's target band of 1-3% for the first time since December 2021. The survey also found that the spread of responses has narrowed compared to the previous quarter, with a lower quartile of 2.00% and an upper quartile of 3.00%.
The survey's respondents also projected changes in the Official Cash Rate. By the end of June 2023, the OCR is expected to rise to 5.47%, an increase of 58 basis points from the last quarter's mean estimate of 4.89%. However, expectations suggest the OCR will fall back to 4.84% by March 2024, down from the previous quarter's estimate of 5.00%.
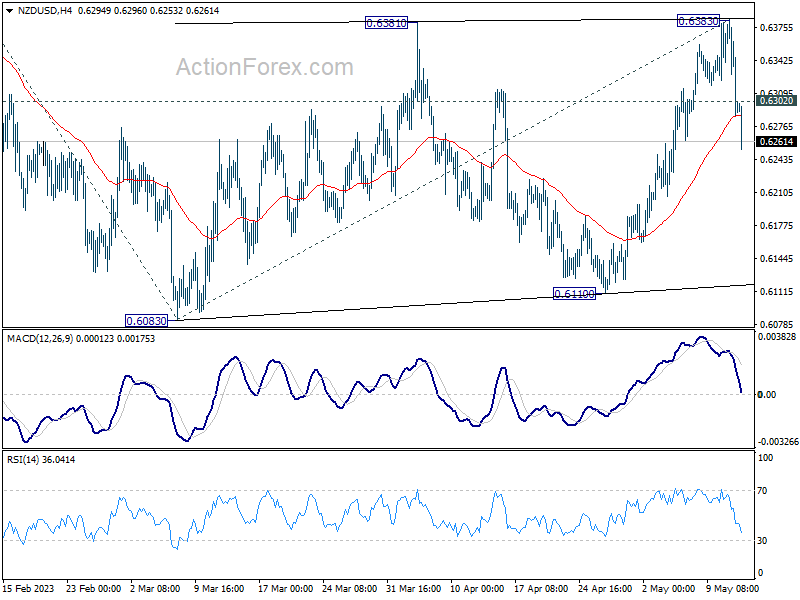
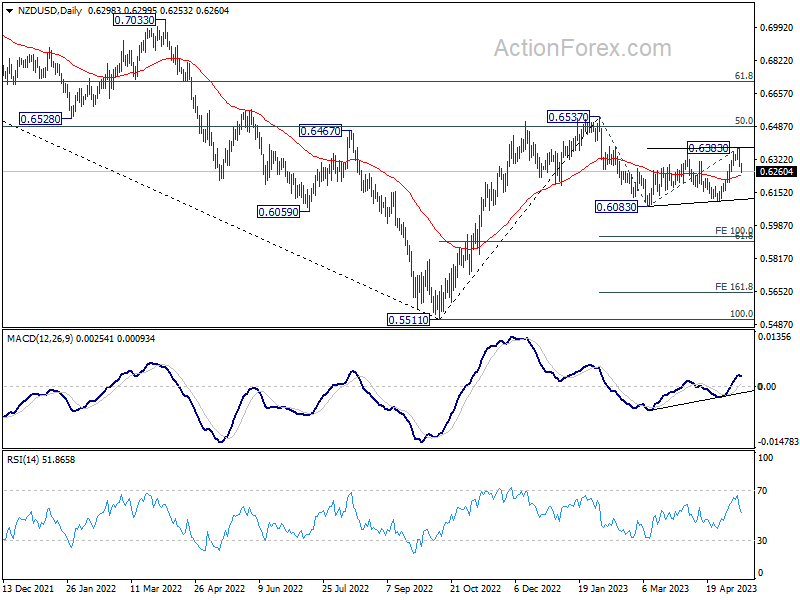
NZD/USD falls notably after the release and broke through 55 4H EMA decisively. The development suggests that rebound from 0.6110 has completed at 0.6383. More importantly, whole corrective pattern from 0.6083 might finished in a three-wave structure too. Deeper decline is now in favor back to retest 0.6083/6110 support zone. Decisive break there will resume whole fall from 0.6537. Meanwhile, break above 0.6302 minor resistance will mix up the near term outlook first.
Copper plummets on China outlook, may drag down AUD/USD
Copper prices experienced a precipitous drop this week, puncturing 3.8229 support level and reaching a nadir last seen in November. This sell-off was largely catalyzed by a stark contraction in Chinese import data, which plummeted by -7.9% yoy in April. Specifically, copper imports in the first four months lagged -13% behind 2022's pace.
This downward trend was exacerbated by release of China's CPI data, which showed a meager 0.1% yoy rise in April – the lowest since February 2021. Additionally, China's PPI took a nosedive by -3.6%, marking the steepest descent since May 2020.
These data, combined with recent PMI figures indicating a contraction in manufacturing in April, paint a picture of a modest post-lockdown rebound at best, with risks skewed to the downside.
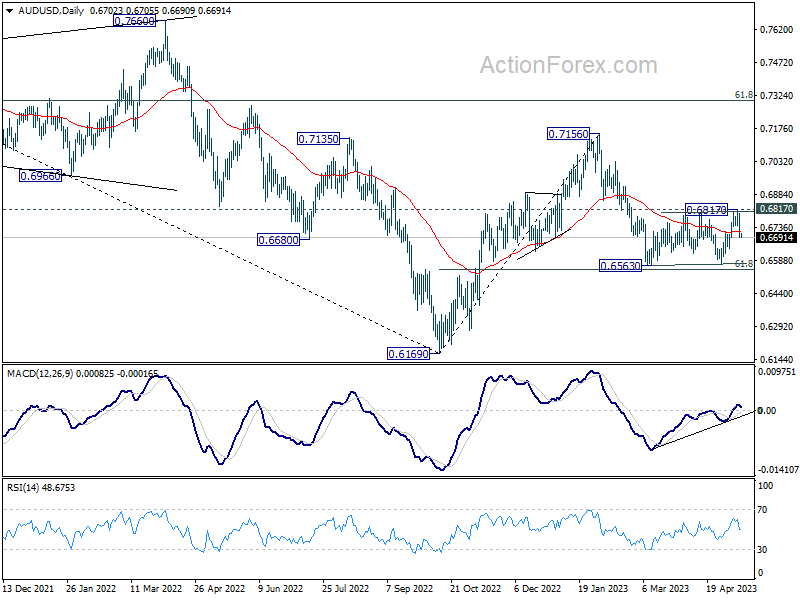
From a technical perspective, resumption of fall from 4.3556 puts immediate focus on 100% projection of 4.3556 to 3.8229 from 4.1743 at 3.6416. Should this level provide strong support and instigate a rebound through 3.950 resistance level, there's potential for a bullish resurgence leading to another rise above 4.3556. This would likely resume the whole rebound from 3.1314.
However, sustained break of 3.6416 could prompt downside acceleration towards 161.8% projection at 1.3124. It's premature to anticipate resumption of the whole fall from 5.0332. Decline from 4.3556 might just be the second leg of the pattern from 3.1314, even in a bearish scenario. But that would depend on the downside momentum of the move.
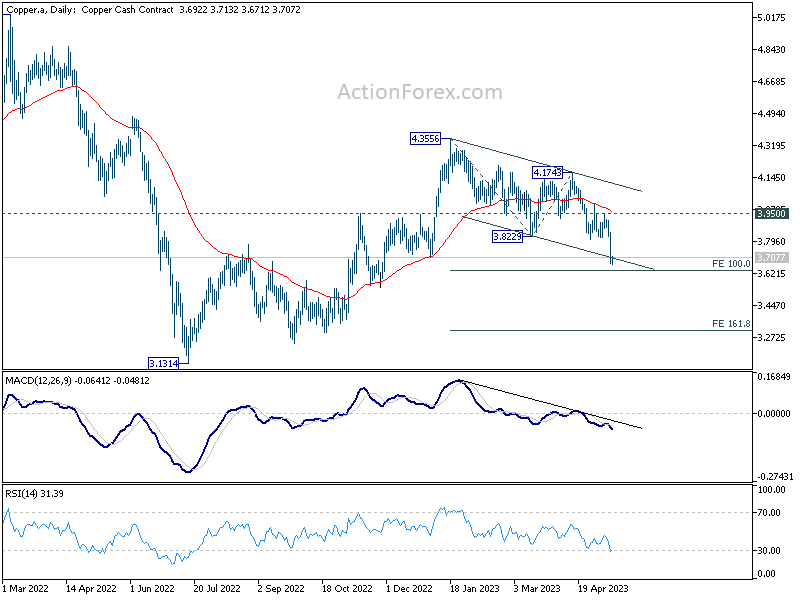
Furthermore, should the bearish Copper scenario materialize with a firm break of 3.6416 Fibonacci projection, AUD/USD could be dragged down through 0.6563 support level, thereby resuming the overall decline from 0.7156.
Looking ahead
UK GDP is a major focus is European session, while production and trade balance will be released. Later in the day, US will publish import price index and U of Michigan consumer sentiment final.
GBP/JPY Daily Outlook
Daily Pivots: (S1) 167.55; (P) 168.66; (R1) 169.47; More...
GBP/JPY dropped notably overnight but recovering after hitting 167.95 resistance turned support. Intraday bias stays neutral first. Further rally could still be seen with 167.95 intact. On the upside, break of 172.30 will resume larger up trend to 100% projection of 148.93 to 172.11 from 155.33 at 178.51. Nevertheless, firm break of 167.95 should confirm short term topping, and turn bias back to the downside for deeper pull back to 165.40 support and possible below instead.
In the bigger picture, based on current momentum, up trend from 123.94 (2020 low) is likely ready to resume. Next target is 161.8% projection of 122.75 (2016 low) to 156.59 (2018 high) from 123.94 at 178.69. This will now remain the favored case as long as 165.40 support holds, in case of retreat.
Economic Indicators Update
| GMT | Ccy | Events | Actual | Forecast | Previous | Revised |
|---|---|---|---|---|---|---|
| 22:30 | NZD | Business NZ PMI Apr | 49.1 | 48.1 | ||
| 23:50 | JPY | Money Supply M2+CD Y/Y Apr | 2.50% | 2.70% | 2.60% | 2.50% |
| 03:00 | NZD | RBNZ Inflation Expectations Q2 | 2.79% | 3.30% | ||
| 06:00 | GBP | GDP Q/Q Q1 P | 0.10% | 0.10% | ||
| 06:00 | GBP | GDP M/M Mar | 0.00% | 0.00% | ||
| 06:00 | GBP | Industrial Production M/M Mar | -0.10% | -0.20% | ||
| 06:00 | GBP | Industrial Production Y/Y Mar | -3.70% | -3.10% | ||
| 06:00 | GBP | Manufacturing Production M/M Mar | -0.10% | 0.00% | ||
| 06:00 | GBP | Manufacturing Production Y/Y Mar | -3.80% | -2.40% | ||
| 06:00 | GBP | Goods Trade Balance (GBP) Mar | -17.5B | -17.5B | ||
| 12:30 | USD | Import Price Index M/M Apr | 0.30% | -0.60% | ||
| 14:00 | USD | Michigan Consumer Sentiment Index May P | 63 | 63.5 |
RBNZ survey sees notable decline in inflation expectations, NZD/USD tumbles
According to RBNZ Q2 Survey of Expectations (Business), inflation expectations for the year ahead took a notable dip, marking the largest drop since June 2020. The one-year-ahead inflation expectation declined by -83 basis points, moving from 5.11% down to 4.28%.
Further into the future, expectations for inflation over a two-year period also demonstrated a decrease. The mean two-year-ahead inflation expectation fell by -51 basis points from 3.30% to 2.79%, placing it back within RBNZ's target band of 1-3% for the first time since December 2021. The survey also found that the spread of responses has narrowed compared to the previous quarter, with a lower quartile of 2.00% and an upper quartile of 3.00%.
The survey's respondents also projected changes in the Official Cash Rate. By the end of June 2023, the OCR is expected to rise to 5.47%, an increase of 58 basis points from the last quarter's mean estimate of 4.89%. However, expectations suggest the OCR will fall back to 4.84% by March 2024, down from the previous quarter's estimate of 5.00%.
NZD/USD falls notably after the release and broke through 55 4H EMA decisively. The development suggests that rebound from 0.6110 has completed at 0.6383. More importantly, whole corrective pattern from 0.6083 might finished in a three-wave structure too. Deeper decline is now in favor back to retest 0.6083/6110 support zone. Decisive break there will resume whole fall from 0.6537. Meanwhile, break above 0.6302 minor resistance will mix up the near term outlook first.
Copper plummets on China outlook, may drag down AUD/USD
Copper prices experienced a precipitous drop this week, puncturing 3.8229 support level and reaching a nadir last seen in November. This sell-off was largely catalyzed by a stark contraction in Chinese import data, which plummeted by -7.9% yoy in April. Specifically, copper imports in the first four months lagged -13% behind 2022's pace.
This downward trend was exacerbated by release of China's CPI data, which showed a meager 0.1% yoy rise in April – the lowest since February 2021. Additionally, China's PPI took a nosedive by -3.6%, marking the steepest descent since May 2020.
These data, combined with recent PMI figures indicating a contraction in manufacturing in April, paint a picture of a modest post-lockdown rebound at best, with risks skewed to the downside.
From a technical perspective, resumption of fall from 4.3556 puts immediate focus on 100% projection of 4.3556 to 3.8229 from 4.1743 at 3.6416. Should this level provide strong support and instigate a rebound through 3.950 resistance level, there's potential for a bullish resurgence leading to another rise above 4.3556. This would likely resume the whole rebound from 3.1314.
However, sustained break of 3.6416 could prompt downside acceleration towards 161.8% projection at 1.3124. It's premature to anticipate resumption of the whole fall from 5.0332. Decline from 4.3556 might just be the second leg of the pattern from 3.1314, even in a bearish scenario. But that would depend on the downside momentum of the move.
Furthermore, should the bearish Copper scenario materialize with a firm break of 3.6416 Fibonacci projection, AUD/USD could be dragged down through 0.6563 support level, thereby resuming the overall decline from 0.7156.
USD/JPY Above 135.20 Could Make Case for Fresh Increase
Key Highlights
- USD/JPY declined below the 135.20 and 135.00 support levels.
- It is trading above the key support at 133.80 and 133.50 on the 4-hour chart.
- EUR/USD traded below strong support at 1.0950.
- The UK GDP could grow 0.1% in Q1 2023 (QoQ) (Prelim).
USD/JPY Technical Analysis
The US Dollar started a strong decline from the 137.75 zone against the Japanese Yen. USD/JPY traded below the 135.50 level to move into a bearish zone.
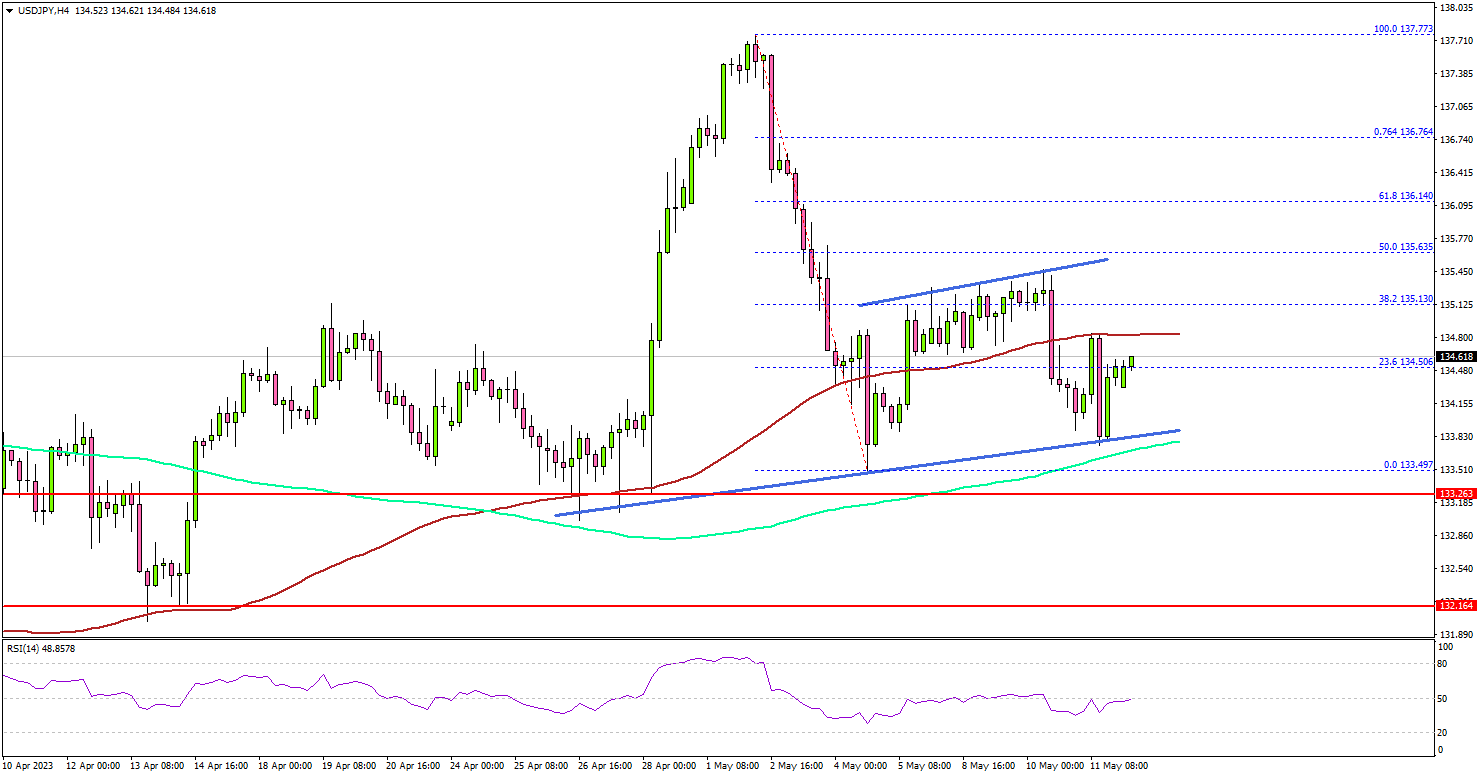
Looking at the 4-hour chart, the pair settled below the 135.00 level and the 100 simple moving average (red, 4 hours). However, the bulls appeared near the 133.80 support and the 200 simple moving average (green, 4 hours).
The pair is now consolidating losses above the 133.80 support. Immediate resistance on the upside is near the 134.80 level and the 100 simple moving average (red, 4 hours). The next key resistance is near the 135.00 level.
The main resistance sits near 135.20. A clear upside break and close above the 135.20 resistance might start another steady increase. The next key resistance is near the 136.20 zone. Any more gains might send the pair toward 137.00.
On the downside, the pair might find bids near 133.80. The next major support is near the 133.50 level. If there is a downside break below the 133.50 level, the pair could test the 132.50 level.
Looking at EUR/USD, the pair failed to climb above the 1.1050 resistance and traded below strong support at 1.0950.
Economic Releases
- UK Industrial Production for March 2023 (MoM) - Forecast 0%, versus -0.2% previous.
- UK Manufacturing Production for March 2023 (MoM) - Forecast -0.1%, versus 0% previous.
- UK GDP for Q1 2023 (QoQ) (Prelim) - Forecast +0.1%, versus +0.1% previous.
New Zealand BNZ PMI rose to 49.1, but struggles continue
New Zealand's manufacturing sector is continuing to grapple with challenges as BusinessNZ Performance of Manufacturing Index edged up to 49.1 in April, from 48.1 in March, remaining below neutral 50.0 mark that separates expansion from contraction.
While the index ticked higher, five of the last seven months have seen contraction, indicating ongoing stress in the sector. In fact, the proportion of negative comments rose to 70.3% in April, compared with 63.2% in March and 60.2% in February. Manufacturers expressed concerns over price pressures, staffing issues, and lower demand, mirroring the broader economic challenges faced by the country.
Digging deeper into the data, we see that production rose from 43.4 to 47.0 and employment edged up from 47.3 to 47.8. New orders also improved, rising from 46.9 to 49.8, but these sub-indexes remained in contraction territory. Finished stocks increased from 48.5 to 52.5, while deliveries dropped from 53.9 to 51.5.
Catherine Beard, BusinessNZ's Director of Advocacy, commented on the tough conditions, noting the stresses and strains of the wider economy appear to be playing out in the manufacturing sector. She further added that despite the overall activity not straying too far into contraction, the sector seems unable to regain expansion mode, with key indicators of production and new orders failing to return positive results in April.
ECB de Guindos: What worries me is trend in service prices
ECB Vice President Luis de Guindos assured yesterday that "There is no doubt headline inflation will continue to ease". However, he added a note of caution, "But there are more doubts about underlying inflation."
De Guindos expressed particular concern about the inflation trend in service prices, a sector showing increased momentum due to rising demand and accelerating salary increases. "What worries me the most in the underlying inflation trend is the trend in service prices," he revealed. "Momentum in services... is rising. There's demand and that's because salary increases are accelerating."
When discussing future interest rate hikes, de Guindos stated, "There could be more interest rate hikes, but their size will depend on upcoming data and the effect tighter credit will have on economic activity."
Market expectations lean towards a 25bps increase at the June meeting, with a potential additional hike by summer's end, followed by rate cuts in early next year. However, de Guindos urged caution in predicting these outcomes. "Don't believe anybody who tells you what the terminal rate is going to be," he said. "I don't feel comfortable or uncomfortable but markets can be wrong about this."