

Sample Category Title
NZ Dollar Slide Continues as Inflation Expectations Ease
- New Zealand Inflation Expectations falls to 2.79%
- US unemployment claims rise
- UoM consumer sentiment to be released later today
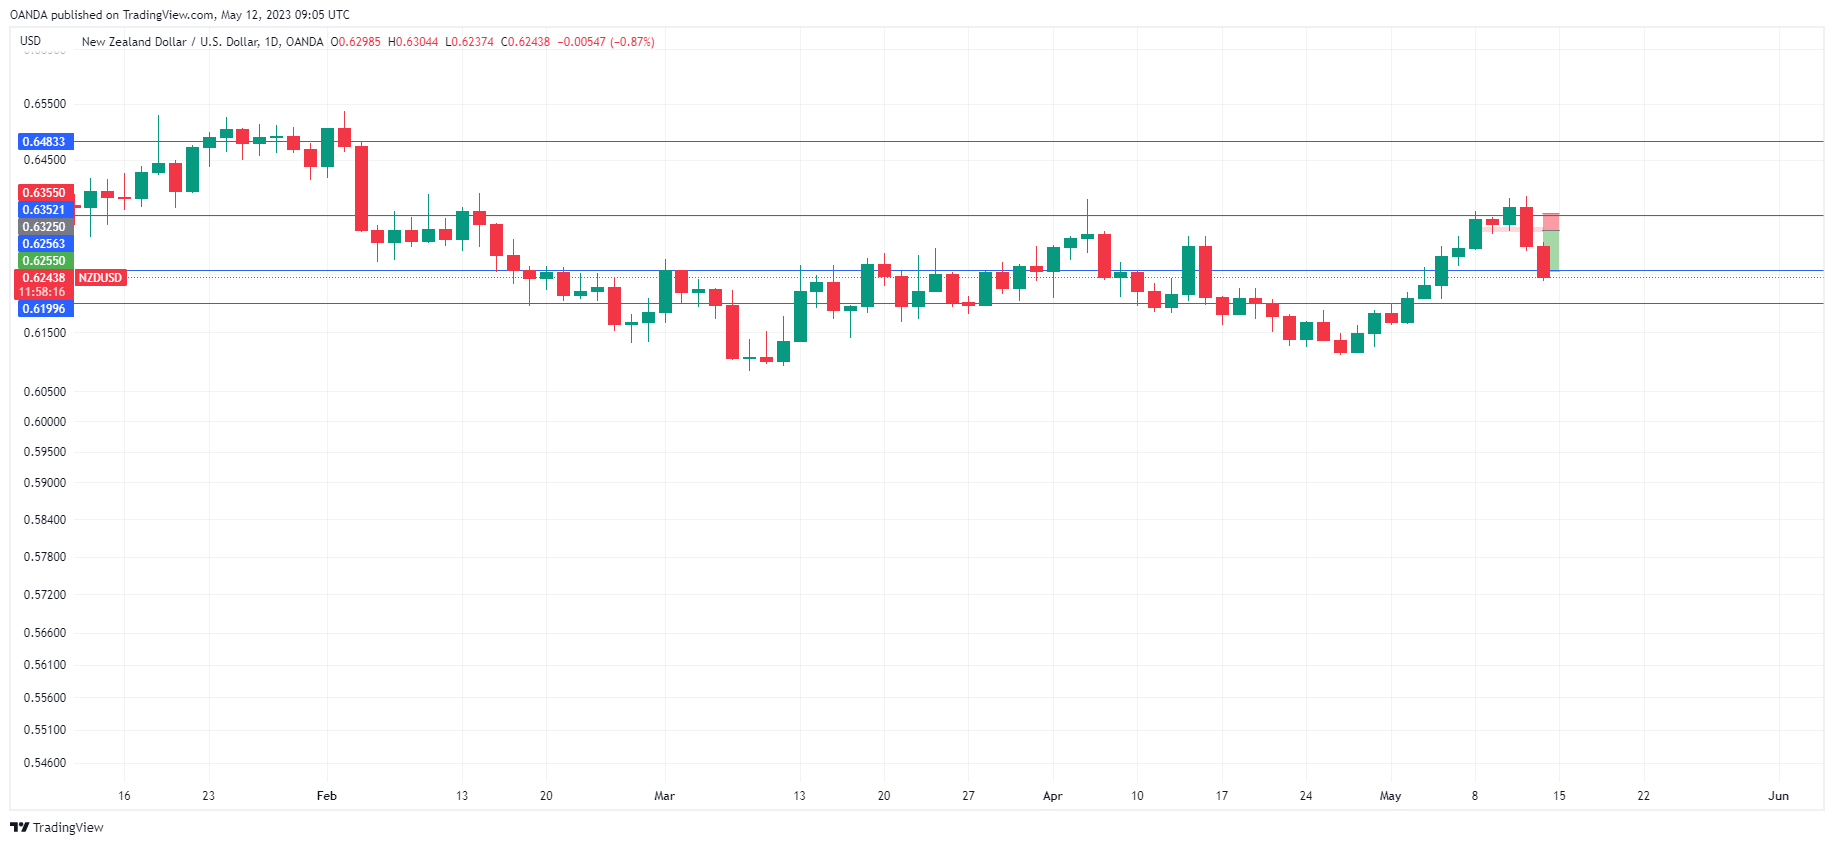
The New Zealand dollar is getting pummelled by the US dollar and is trading at 0.6240, down 0.93% on the day. This follows a drop of 1.07% on Thursday.
New Zealand inflation expectations decline
The week is ending on a high note for policy makers at the Reserve Bank of New Zealand. Inflation Expectations for the first quarter eased to 2.79%, down from 3.30% in Q4 of 2022. This marked a second straight deceleration and the first time inflation expectations have fallen below 3% in six months. The soft reading has pushed the New Zealand dollar sharply lower on expectations that the RBNZ might ease up on its rate hikes.
Central banks are constantly on the alert for inflation expectations becoming entrenched, which can generate inflation and complicate the battle to curb inflation. The RBNZ has been aggressive in its rate-hike cycle, raising the benchmark cash rate to 5.25%. At the April meeting, the RBNZ hiked by 50 basis points and the downturn in inflation expectations will provide support for the Bank to ease its pace of rate hikes at the May 24th meeting to 25 bp, depending on the data.
The US economy has been showing signs of cooling, and the markets are widely expecting the Fed to pause in June, after ten straight hikes. The labour market has been surprisingly resilient, despite the Fed’s aggressive tightening. Unemployment claims surprised on the upside on Thursday, rising from 245,000 to 264,000, well above the estimate of 242,000. This is just one weekly report, but it’s sure to raise speculation that the labour market is showing cracks.
The US wraps up the week with UoM Consumer Confidence, which hasn’t looked very strong. The indicator fell to 63.5 in April and is expected to ease to 63.0 in May. Weak consumer confidence can translate into a decrease in consumer spending, a key driver of economic growth.
NZD/USD Technical
- NZD/USD is testing support at 0.6257. The next support level is 0.6199
- There is resistance at 0.6352 and 0.6482
WTI Oil: Bears Regained Control But Struggling to Clear Key $70 Support
Oil price is holding in red for the third straight day, under fresh pressure on renewed concerns about economic situation in the world’s two largest oil consumers – US and China.
Crisis in banking sector and no results in solving problem with debt ceiling so far, mark the major issues in the US these days, as another regional bank came on shaky ground, while talks about rising the government’s debt ceiling have been postponed again, adding to warning from Treasury Secretary Janet Yellen about potential economic catastrophe on failure to raise debt ceiling before the deadline..
Economists are also not convinced that inflationary pressure is easing at desired pace despite sharp increase in borrowing costs, which also add to uncertainty about oil demand outlook.
Latest economic data from China signal that the pace of recovery from Covid restrictions was below expectations and could further hurt energy demand, though OPEC kept is forecast for global oil demand in 2023 unchanged and remain optimistic about growth of Chinese oil demand, which would offset immediate threats of slowdown.
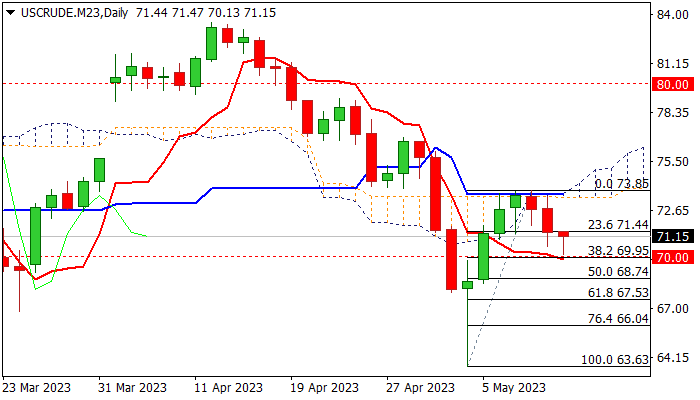
Technical picture on daily chart remains weak after recent recovery was capped by daily cloud and Kijun-sen (73.60), though fresh bears need clear break through pivotal $70 zone (psychological / Fibo 38.2% of $63.63/73.85 rally / daily Tenkan-sen) to confirm reversal and open way for deeper drop.
Traders remain cautious after last week’s strong downside rejection which left a bear-trap under 200DMA and also failed to register weekly close below cracked $70 support, pointing to strong headwinds that fresh bears face.
Res: 70.61; 71.68; 72.31; 73.57.
Sup: 70.00; 69.10; 68.74; 67.53.
Dollar Index : Dollar on Track for Biggest Weekly Advance in 11 Weeks
The dollar index remains constructive and extends higher in European trading on Friday, following 0.7% advance on Thursday.
The greenback benefited from renewed safe-haven demand, sparked by growing concerns over US debt ceiling case and further worries about banking sector crisis.
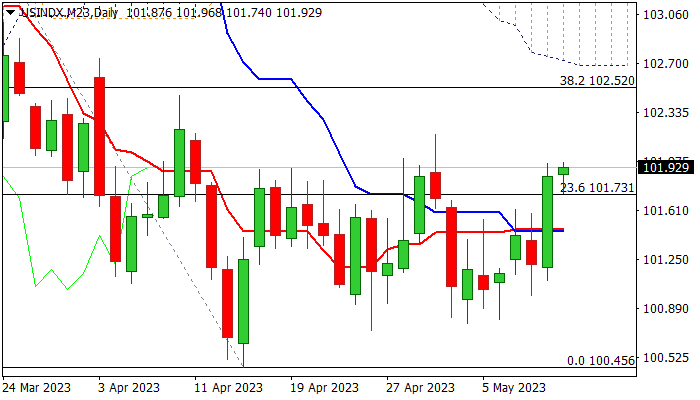
The price action is heading towards the top of near-term range (100.45/102.17), with sustained break higher to expose next targets at 102.52/68 (Fibo 38.2% of 105.85/100.45 fall / base of falling and thickening daily cloud) and add to initial reversal signal, if dollar-favorable conditions persist.
The dollar index is also on track for the biggest weekly gain since mid-February, which adds to positive near-term outlook, along with improving daily techs on rising bullish momentum, which keeps prospect for break above current congestion,
On the other hand, larger picture shows that the greenback remains in a downtrend from 114.72 (Sep 2022 multi-year peak), sparked and still mainly driven by cooling US inflation, while the latest data generated initial signal of slowing labor market and Fed signaled a pause after the last 25 basis points rate hike, which would add pressure on greenback and weigh on current recovery.
Res: 102.17; 102.52; 102.68; 103.15.
Sup: 101.73; 101.52; 100.66; 100.45.
US Debt Ceiling Meeting Postponed, and That’s Good News?
US President Joe Biden was scheduled to meet again today with congressional leaders to talk about resolving the debt ceiling. But it was abruptly postponed, without a reason given. A few hours later, it was reported that the delay was because staff discussions had made some progress. A new meeting is scheduled for next week, potentially so the leaders can announce the progress made by staff. Although, many in the markets remain skeptical.
June is seen as the deadline for reaching an agreement, meaning that there is still a month left to negotiate and generate headlines. Generally speaking, the art of brinkmanship doesn't include reaching an agreement week in advance of the deadline. Past confrontations have come down to the very limit, and the market would likely be surprised if a resolution was reached this early.
Repeating 2011, or something else?
There have been confrontations over the debt ceiling in the past, but the most dramatic was back in 2011. Which is why the current situation is being compared to that crisis. In that instance, a deal was not reached until two days before the debt ceiling was expected to be reached.
This time around, US credit default swaps (CDS), which are how much investors must pay to insure against a default on the US debt, have risen to levels far exceeding what was seen in 2011. Part of that is because there are much higher interest rates now, and the government's debt is significantly higher. Even if the ceiling crisis is resolved, there is still the pending issue of government deficits being extraordinarily high.
What exactly happens?
The debt ceiling shouldn't be confused with the budget limit, another political pressure tool that sometimes coincides with the debt limit. Lack of agreement on a budget result in a government shutdown, as spending has not been authorized. That most recently happened in 2019. The debt ceiling is about issuing new debt to cover spending that has already been authorized.
Before the ceiling is reached, the US Treasury can initiate what are called "extraordinary" measures, such as prioritizing certain payments or accounting actions such as redeeming certain treasuries. There isn't an exact estimated date for when the debt limit will be reached because officials can potentially come up with new ways to juggle payments. It also depends on how much tax the government receives. Typically, better economic growth translates into higher revenues, so if the US isn't heading into a recession as many expect, it could have more time on the debt clock.
Potential reactions
The US has never hit the debt ceiling before, so if it were to happen, it's uncharted territory. Markets would naturally not like that level of uncertainty. However, it doesn't automatically imply an immediate default on debt. The Treasury could prioritize paying interest on bonds over other expenditures, which would avoid technically falling into default.
But it doesn't have to go that far for there to be market consequences. In 2011, S&P cut the rating of US debt for the first time ever. Cutting the rating of debt increases borrowing costs, which in turn slows the economy. And the constantly rising CDS makes investing in US debt less attractive, weakening the dollar.
EUR/USD: Bears Gain Traction on Break of Pivotal Fibo Support/Recent Range Floor
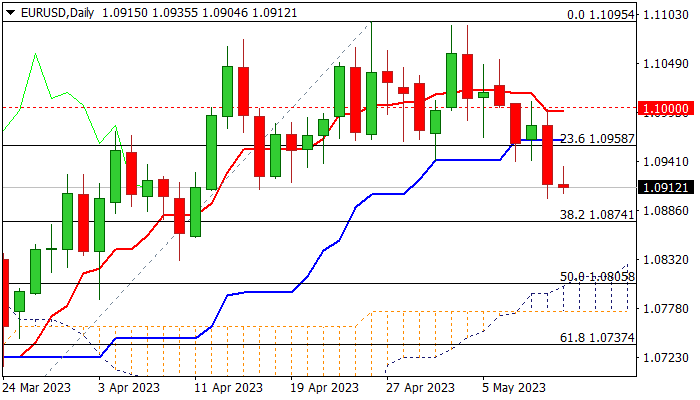
The Euro remains at the back foot in early Friday following 0.6% drop on Thursday, which generated bearish signal on eventual close below pivotal Fibo support at 1.0960 zone (23.6% retracement of 1.0516/1.1095 rally/daily Kijun-sen).
Eventual break and close below 1.0960 after several rejections at this zone signals an end of near-term directionless mode (the price was moving within 1.0940/1.1095 range for over three weeks) and shifts near-term focus lower.
Weakening daily studies (rising negative momentum/10/20DMA bear-cross) contribute to negative near-term outlook.
Fresh bears look for confirmation on weekly close below 1.0960, with extension through next key Fibo level at 1.0874 (38.2% retracement) to reinforce near-term bearish structure and open way for extension towards the top of rising and thickening daily cloud (1.0812).
Broken 1.0960 support reverted to solid resistance which should keep the upside protected and maintain fresh bearish bias.
Only bounce and close above 1.0995/1.10 (daily Tenkan-sen / psychological) would neutralize downside risk and revive bulls.
Res: 1.0940; 1.0960; 1.1000; 1.1032.
Sup: 1.0900; 1.0874; 1.0831; 1.0812.
XAG/USD: We Could See End of Bullish Trend at Top of 27.928
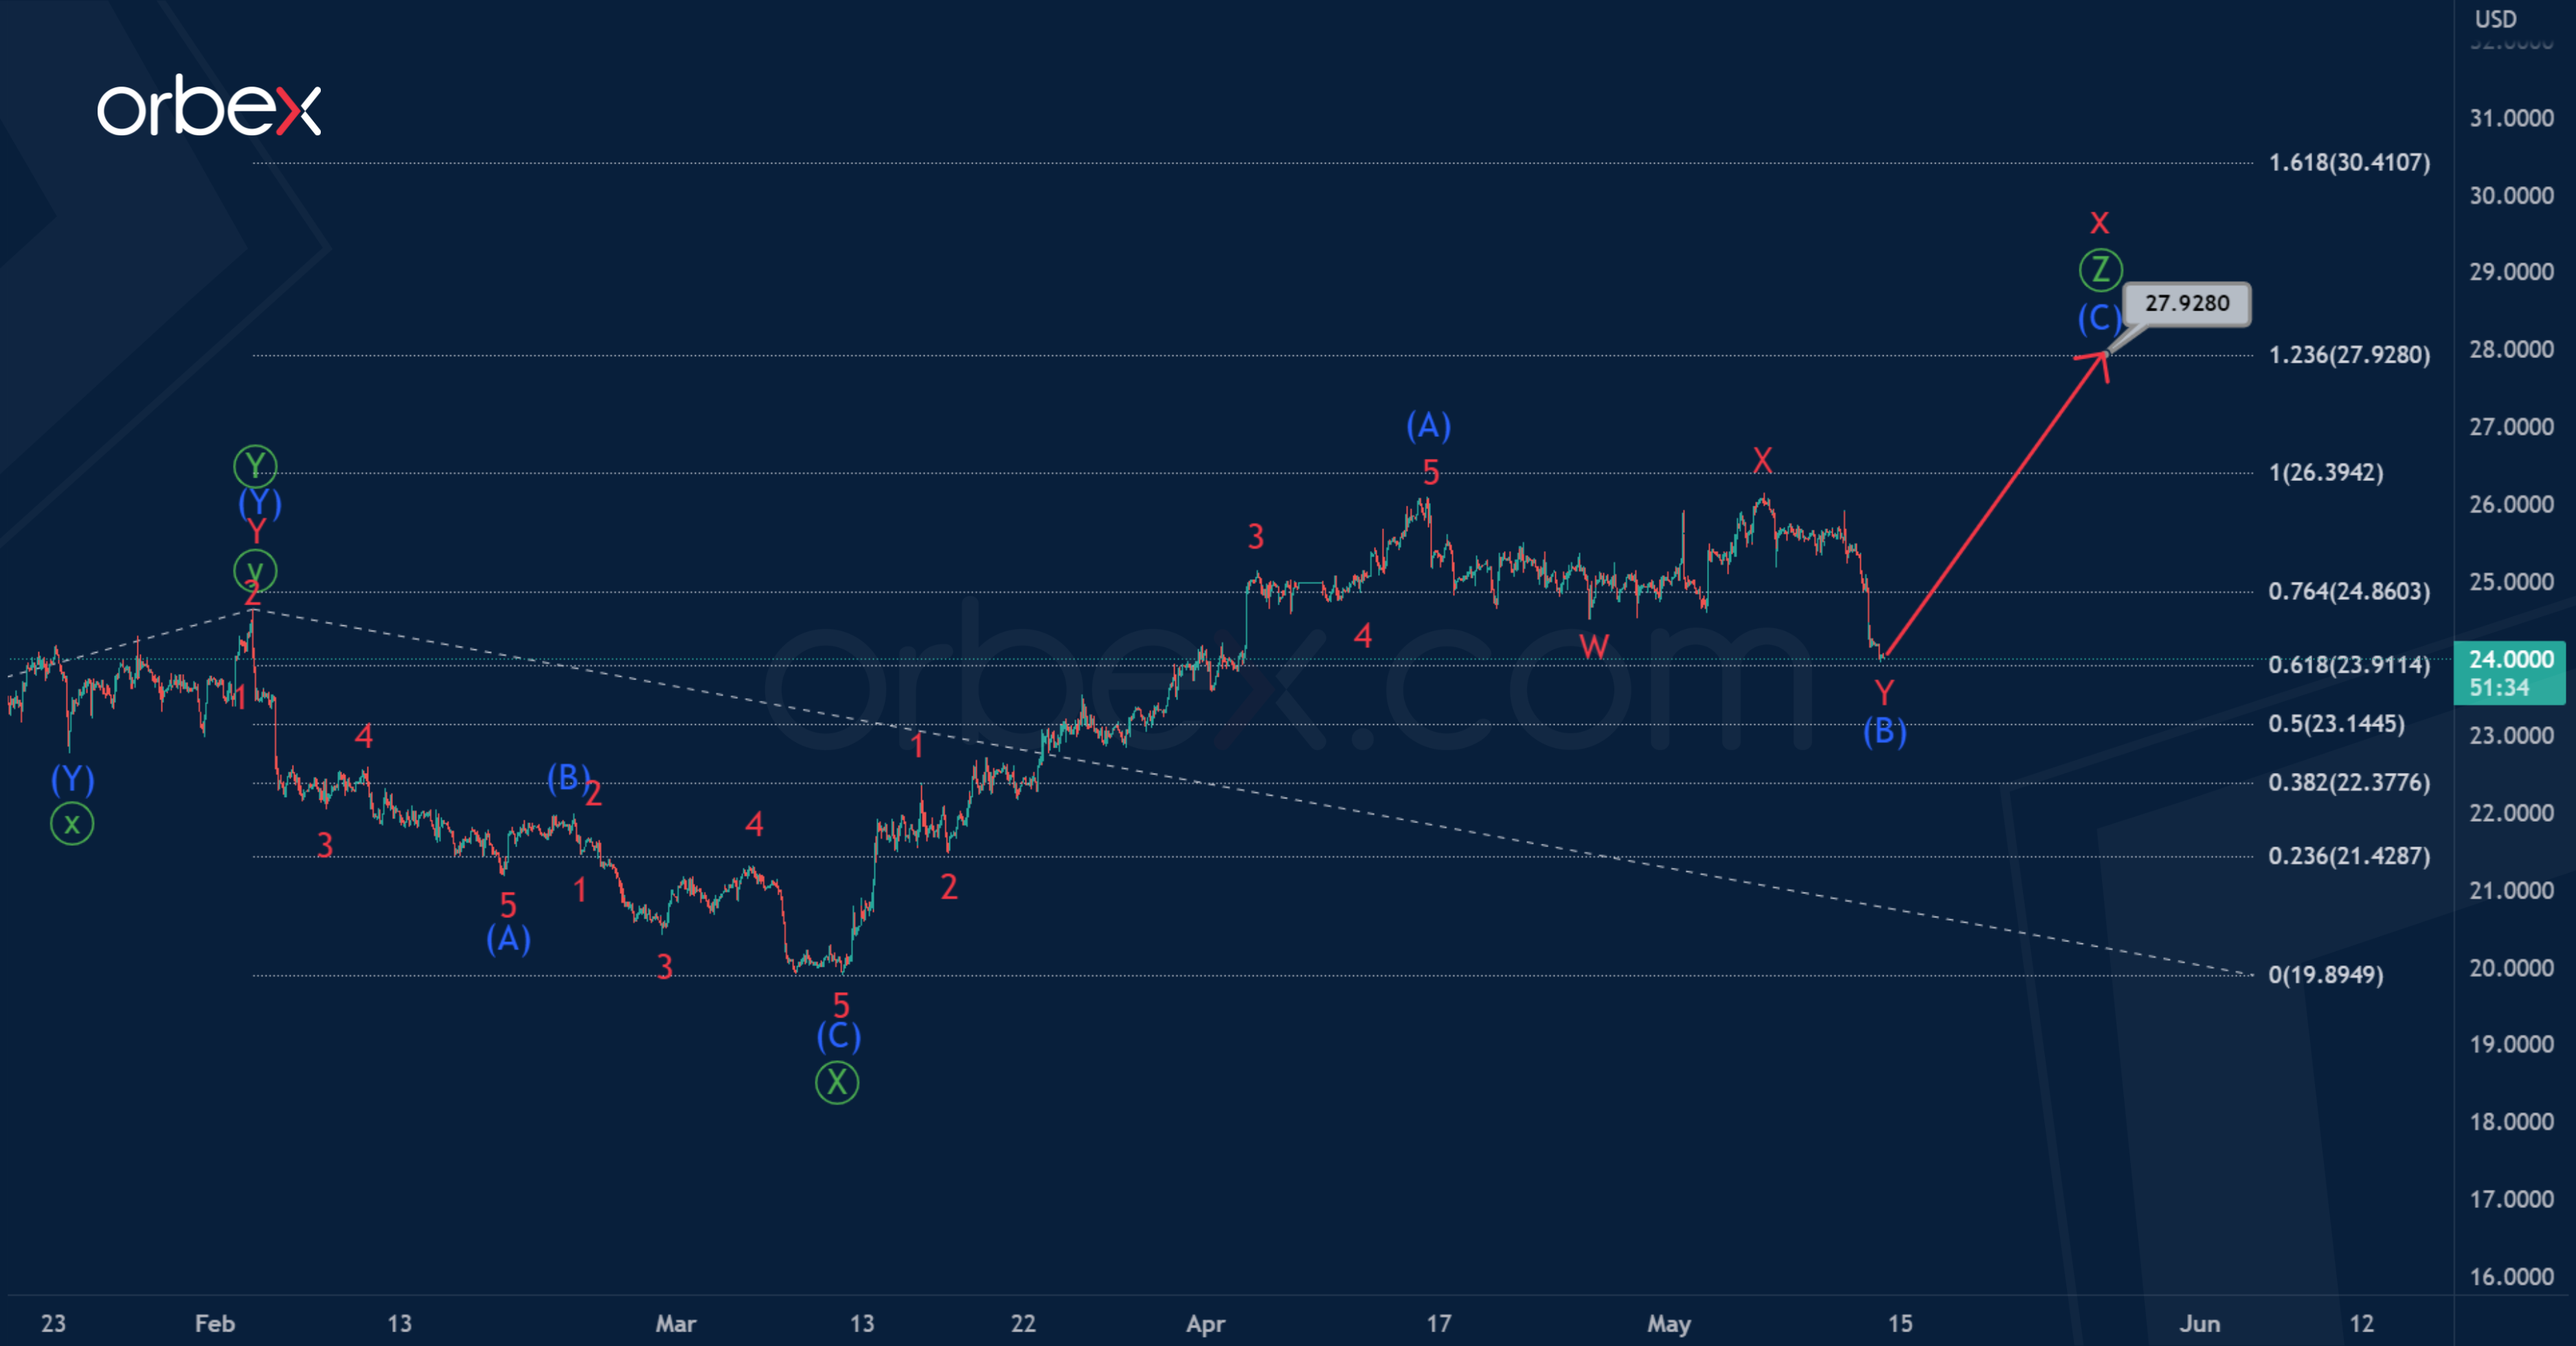
It is assumed that silver is moving inside the global corrective trend consisting of cycle waves w-x-y-x- z.
The current chart H1 shows the structure of the cycle intervening wave x, which in the near future can be completed by taking the form of a triple zigzag of the primary degree.
At the moment, the price may be in the primary wave. Perhaps this wave will be a standard zigzag, where the impulse and correction have already been completed. Wave (B) is a double zigzag.
In the near future, growth is expected in (C) approximately to 27.928, where the primary waves and will be equal.
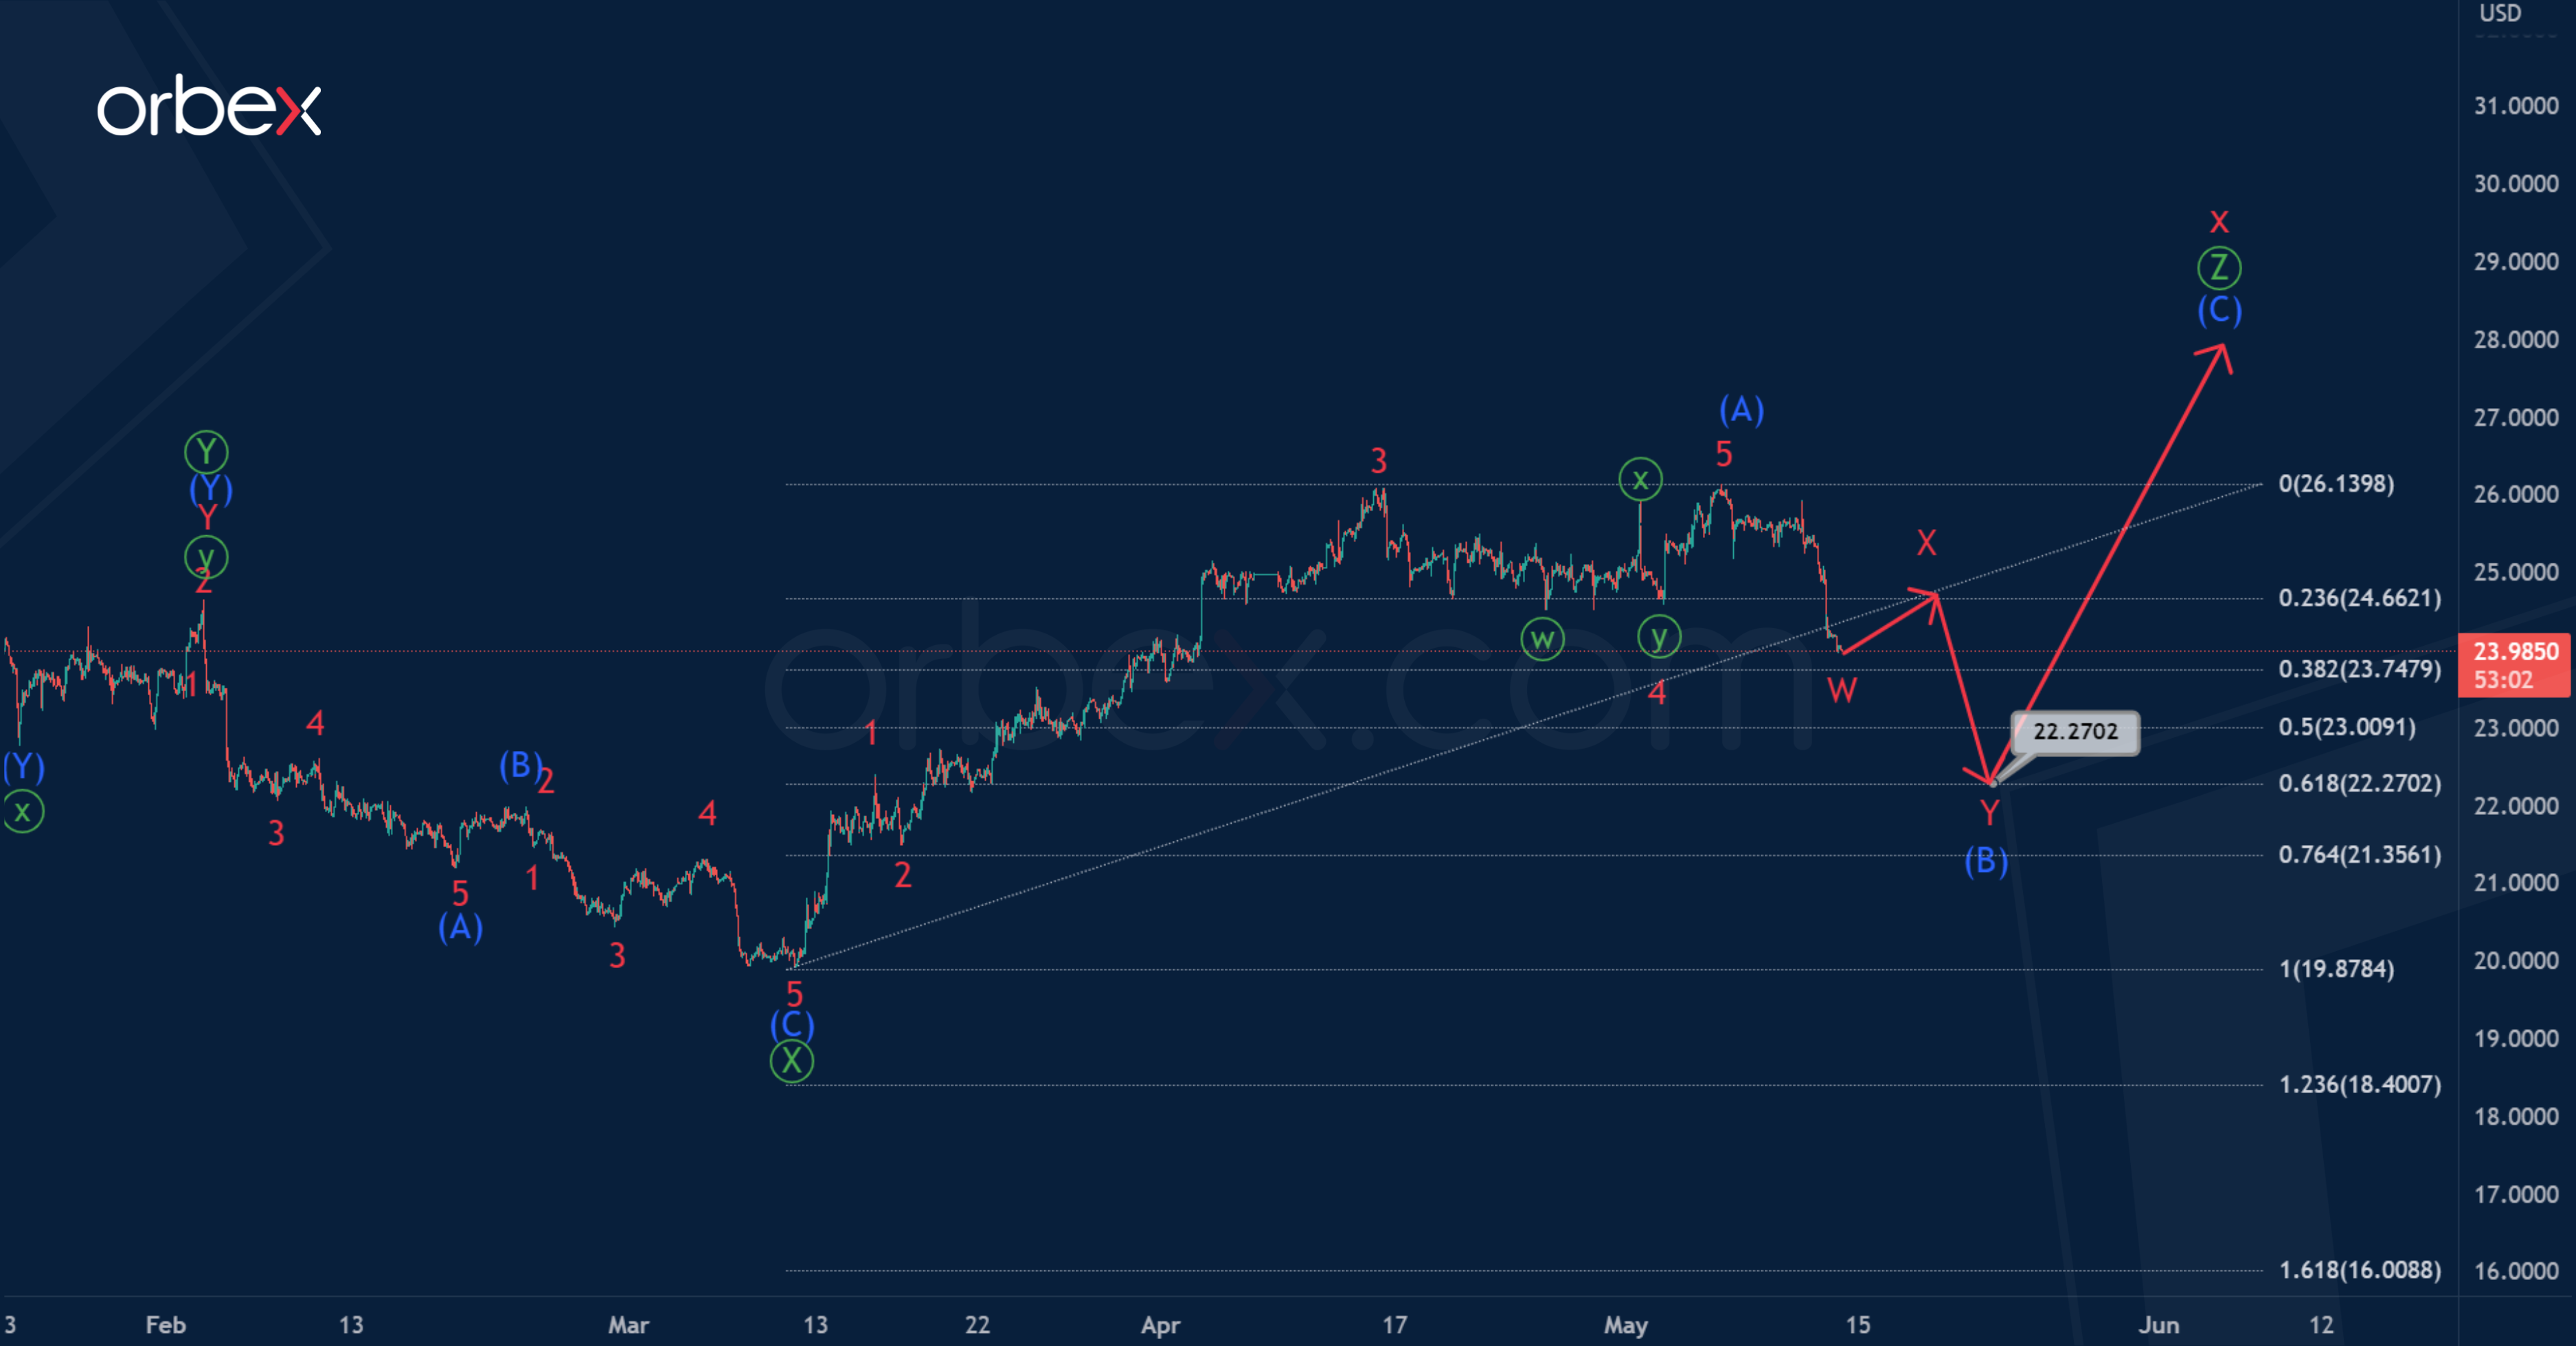
In the second scenario, market participants can observe the development of an intermediate wave (B). As in the main version, it can be a double zigzag, however, only its first part is completed the minor wave W.
In the near future, a slight rise is possible in the second part, namely in wave X, after which a decrease is expected in the final actionary wave Y.
It is assumed that the intermediate correction (B) will be at 61.8% of impulse (A), and will end near 22.270.
GBPJPY Rebounds Off 168.00 in Short-term
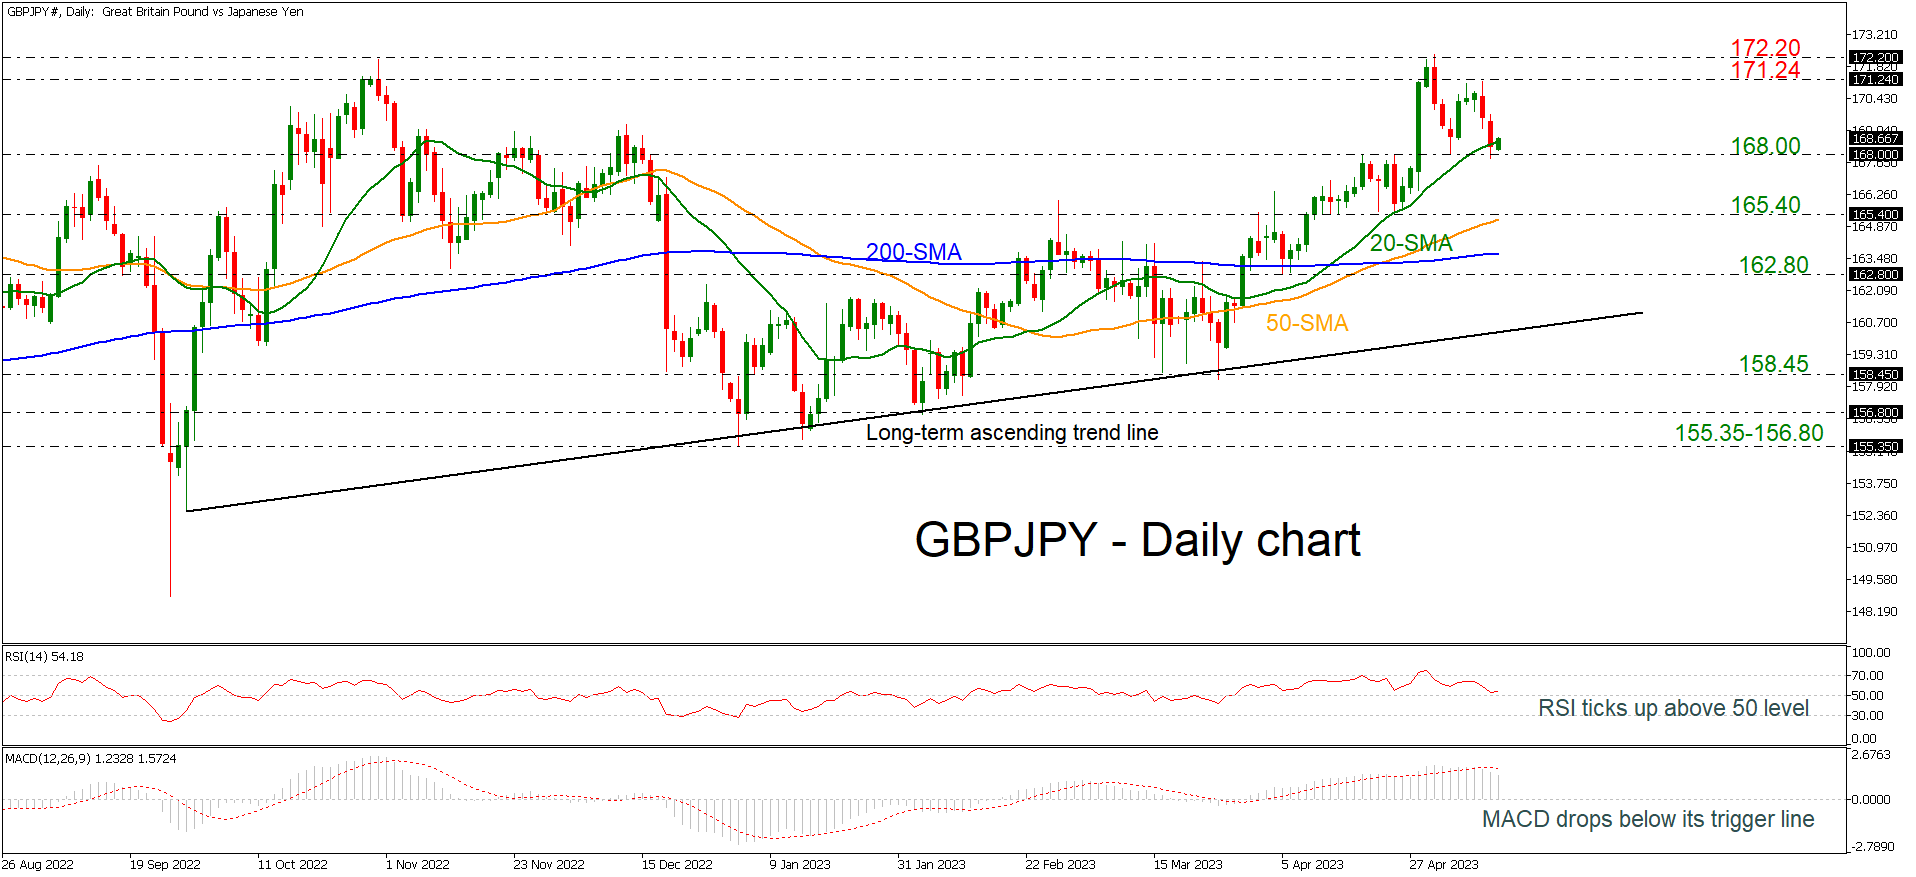
GBPJPY posted two consecutive red days, meeting the 168.00 support, and is currently holding near the 20-day simple moving average (SMA). When looking at the bigger picture, the pair is bullish as it is standing above the long-term uptrend line and the 200-day SMA.
From a technical perspective, the RSI is pointing upwards near the 50 level, while the MACD is losing momentum beneath its trigger line in the positive region.
If price action remains above 168.00 (immediate support), there is scope to test 171.24. Clearing this key level would see additional gains towards 172.20. This is considered to be a strong resistance area which has been rejected a few times in the past.
If the 168.00 support fails, then the focus would shift to the downside towards 165.40, which stands near the 50-day SMA. If this level is breached, the pair would increase downside pressure and bring about a reversal of the trend. From here, GBPJPY would be on the path towards the 200-day SMA at 163.65 and 162.80.
Overall, GBPJPY has been in a negative correction in the very short-term, but the broader outlook is bullish.
GBPCAD Bulls Catch Their Breath After Strong Rally
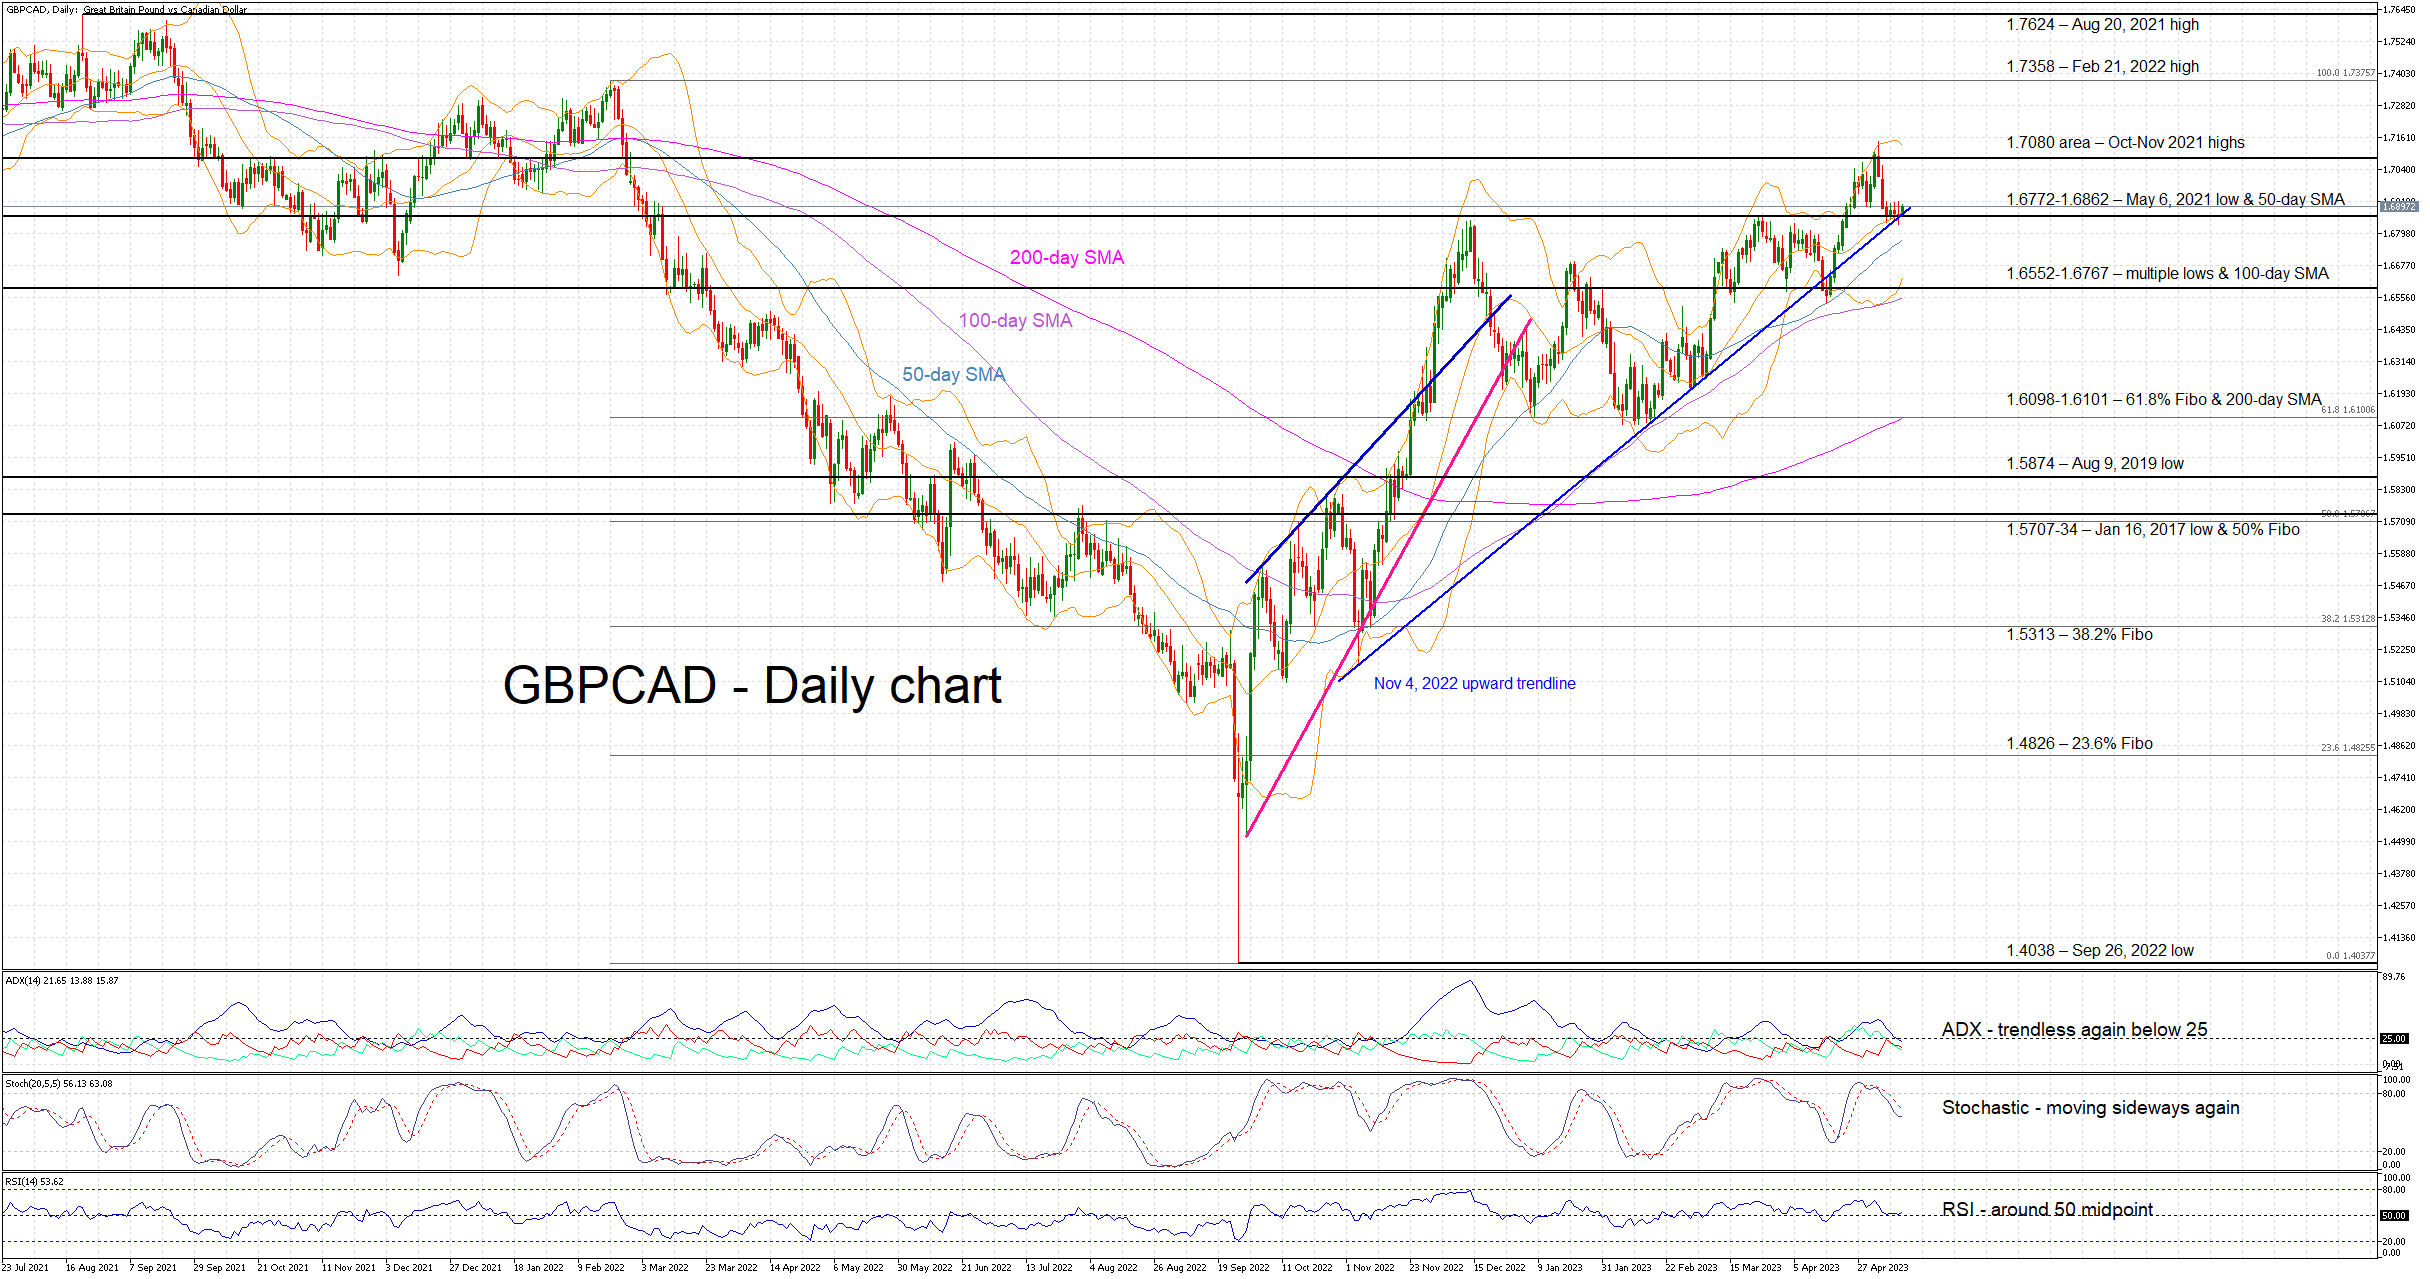
GBPCAD is currently hovering around the busy 1.6862 area as the bulls appear to be taking a breather after reaching a 14-month high last week. The move higher since mid-February has been very aggressive with GBPCAD recording a series of higher highs and higher lows. The bulls could be content with a local trough above the 1.6528 mark, acting as a basis for potentially another leg higher.
Should the bulls stage another rally and clear the 1.6862 level, they would attempt a retest of the 1.7080 level defined by the October-November 2021 highs. They would then set their eyes higher and more specifically at the February 21, 2022 and August 20, 2021 highs at 1.7385 and 1.7624 respectively.
GBPCAD bears are trying to find an opening and finally record a pullback. However, the momentum indicators are portraying a delicate balance. The Average Directional Movement Index (ADX) points to a trendless market and the RSI is just above its 50-midpoint. The stochastic oscillator made a break lower, but it now seems to be trading sideways.
If the bears manage to take over the reins and break the November 4, 2022 upwards sloping trendline and the 50-day simple moving average (SMA), they would come up against the busy 1.6552-1.6767 area. This is defined by multiple GBPCAD lows and the 100-day simple moving average (SMA). The path then appears to be clear until the 1.61 area.
To sum up, the bulls are taking a breather and prepping for the next upleg as the bears seem to find it hard to stage a decent pullback.
USDCAD Rebounds Strongly Above 200-day SMA
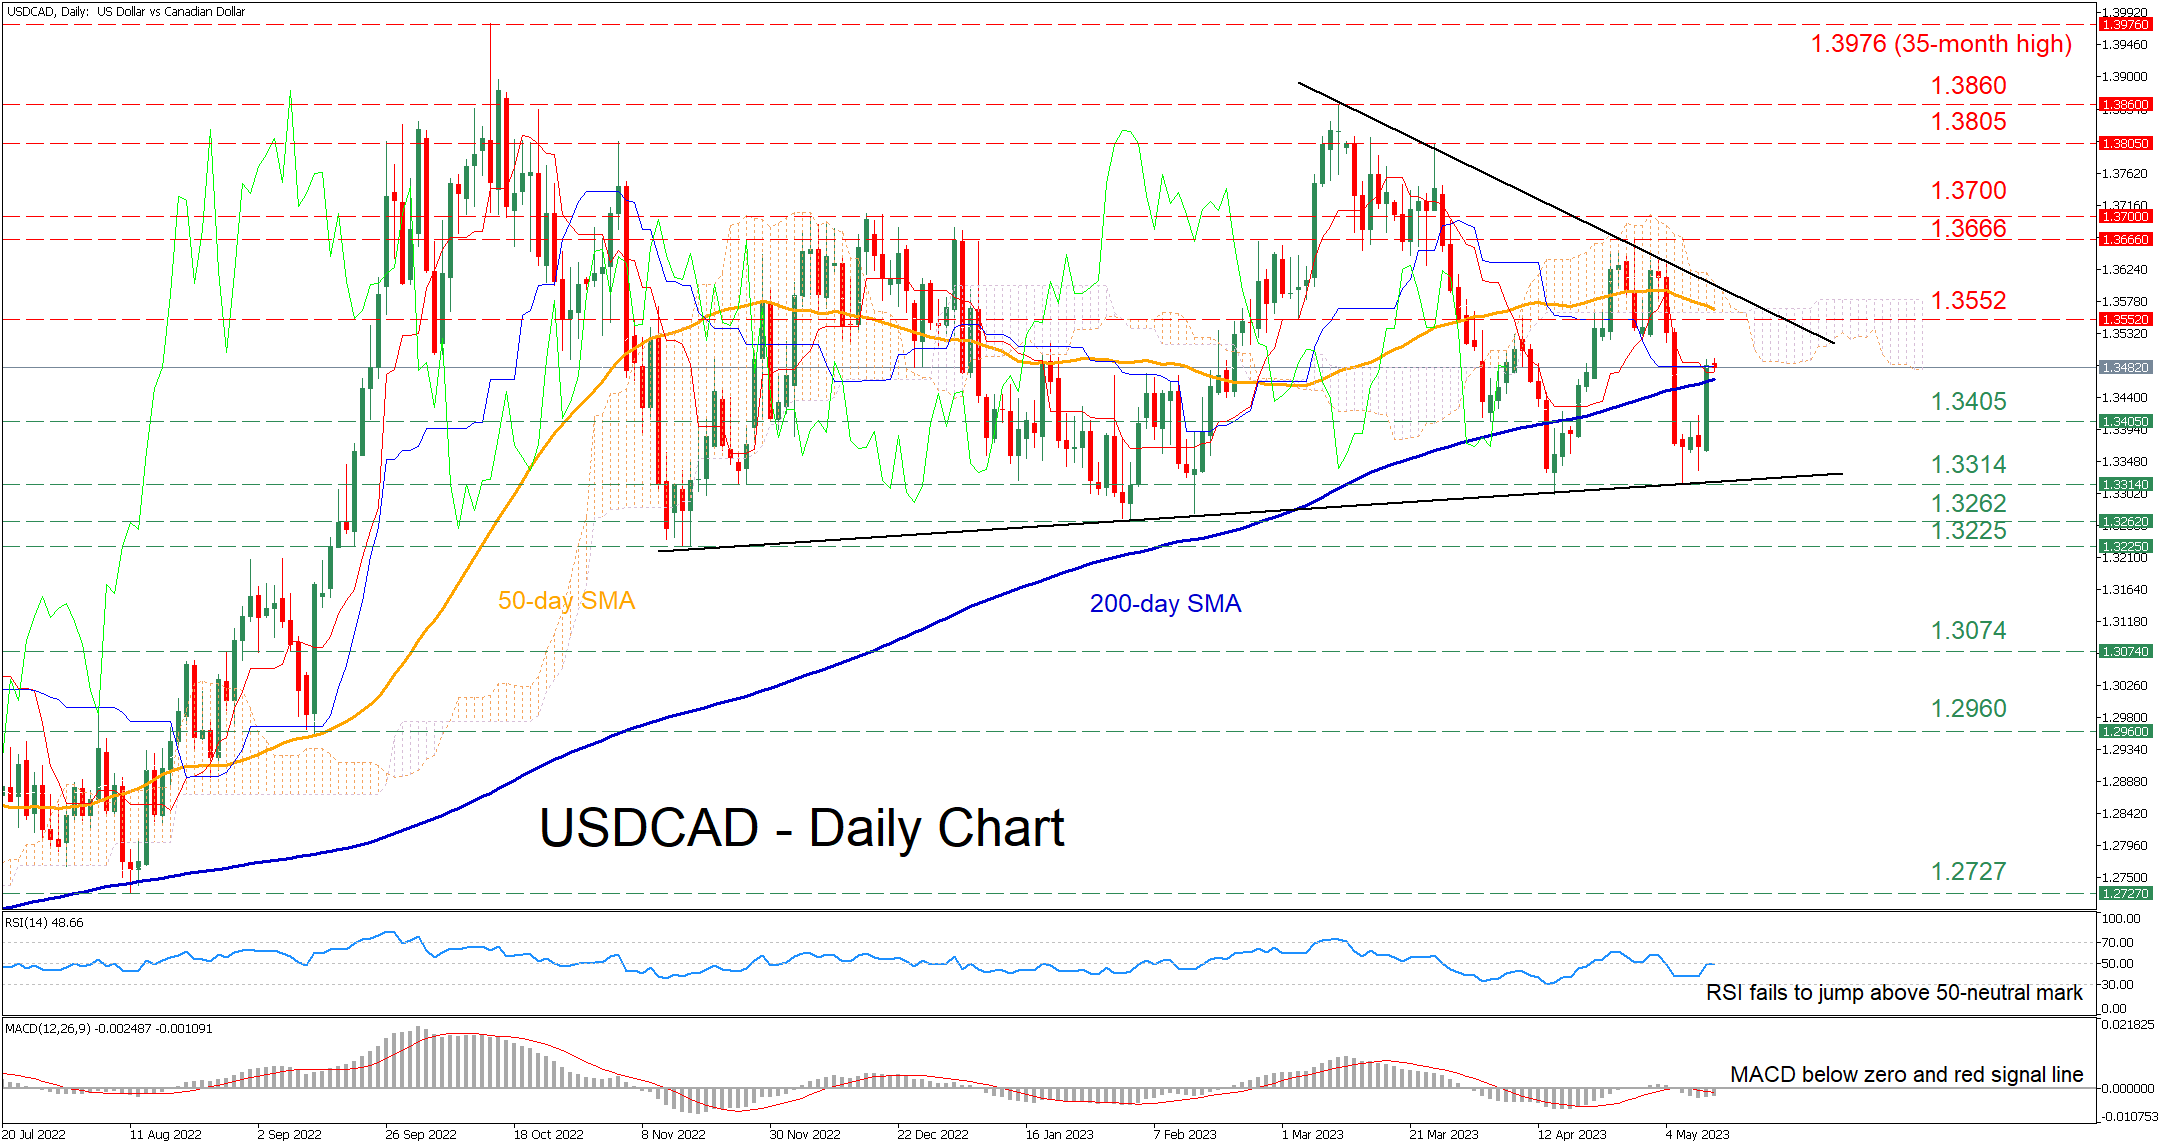
USDCAD has been generating a structure of lower highs after peaking at the 2023 high of 1.3860 in mid-March. Although the pair managed to bounce off its May low and reclaim the 200-day simple moving average (SMA), the developing bearish flag pattern is indicating that the price could soon experience a bearish breakout.
The momentum indicators currently suggest that despite the recent bounce, near-term risks remain tilted to the downside. Specifically, the RSI rebounded but failed to cross above the 50-neutral mark, while the MACD is holding below zero and its red signal line even after gaining significant ground.
Should the recovery resume, initial resistance could be met at the 1.3552 barrier. Breaching that region, the pair could advance towards the April peak of 1.3666 or higher to test the 1.3700 psychological mark that held strong in December 2022. Further advances could then cease at 1.3805.
Alternatively, if the price reverses lower and dips beneath its 200-day SMA, the April support of 1.3405 could act as the first line of defense. Should that floor collapse, the pair could descend towards the May low of 1.3314 before the 2023 bottom of 1.3262 gets tested. Even lower, the November 2022 support of 1.3225 may prove to be a tough one for the bears to overcome.
In brief, even though USDCAD experienced an upwards spike and crossed above its 200-day SMA, the technical indicators have not yet turned to the bullish side. Hence, for the rebound to strengthen the pair needs to surpass the restrictive trendline formed from its recent lower lows.
Gold Price and Crude Oil Price Could Extend Losses
Gold price is moving lower below the $2,025 support. Crude oil price is correcting gains and might decline toward the $68.85 support.
Important Takeaways for Gold and Oil Prices Analysis Today
- Gold price failed to clear the $2,060 resistance and corrected gains against the US Dollar.
- It broke a key contracting triangle with support near $2,025 on the hourly chart of gold at FXOpen.
- Crude oil prices are also moving lower below $72.00 and $71.50 levels.
- There was a break below a major bullish trend line with support near $73.00 on the hourly chart of XTI/USD at FXOpen.
Gold Price Technical Analysis
On the hourly chart of Gold at FXOpen, the price traded to a new all-time high before it started a downside correction. The price declined below the $2,060 level to move into a bearish zone.
The last swing high was near $2,048 and the price is now trading below the 50-hour simple moving average. It traded below a key contracting triangle with support near $2,025. The price is now trading below the 61.8% Fib retracement level of the upward move from the $1,999 swing low to the $2,048 high.
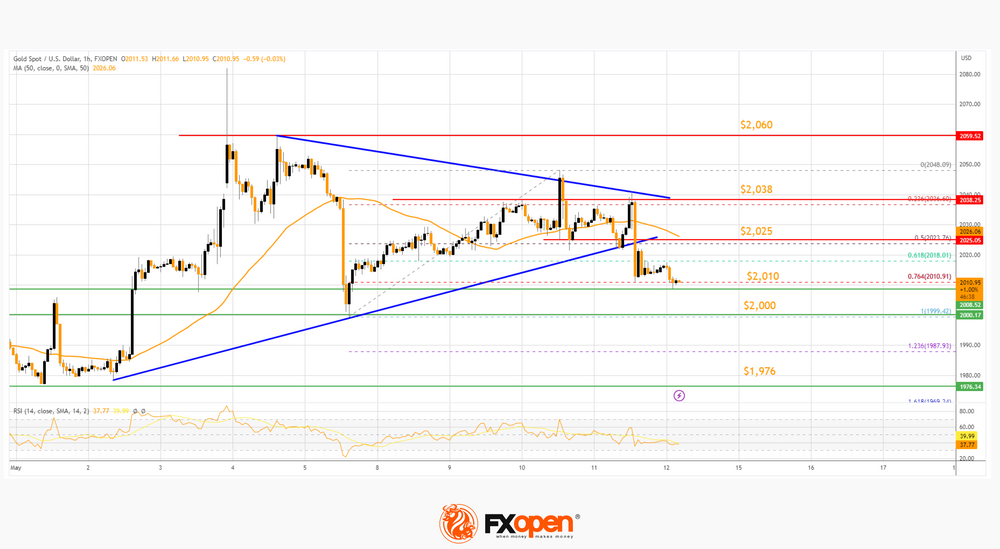
Initial support on the downside is near the 76.4% Fib retracement level of the upward move from the $1,999 swing low to the $2,048 high at $2,010.
The first major support is near the $2,000 level. The main support sits near the $1,976 level. If there is a downside break below the $1,976 support, the price might decline heavily.
The next major support is near $1,955, below which the bulls could aim for a test of $1,932. On the upside, the bulls are facing resistance near the 50-hour simple moving average at $2,025. The next major resistance is near the $2,038 level.
An upside break above the $2,038 resistance could send Gold price toward $2,060. Any more gains may perhaps set the pace for an increase toward the $2,080 level.
Oil Price Technical Analysis
On the hourly chart of WTI Crude Oil at FXOpen, the price struggled to recover further above the $74 resistance against the US Dollar. A high was formed near $73.79 and there was a downward move.
There was a break below a major bullish trend line with support near $73.00. The price declined below the 50-hour simple moving average at $72 and RSI dropped to 30. It is now showing bearish signs below the 23.6% Fib retracement level of the upward move from the $63.90 swing low to the $73.79 high.
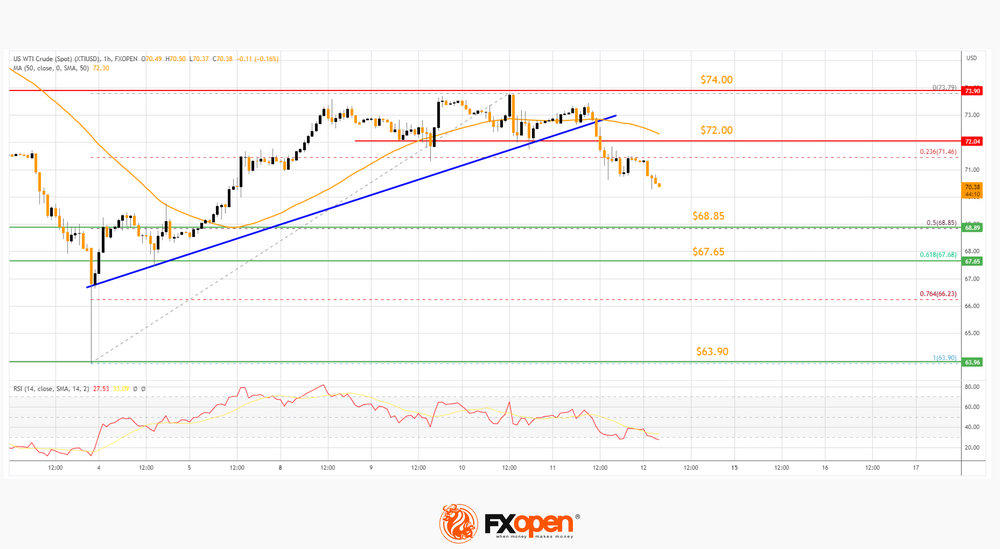
On the downside, support is near the 50% Fib retracement level of the upward move from the $63.90 swing low to the $73.79 high at $68.85.
The next major support on the WTI crude oil chart is near $67.65. If there is a downside break, the price might decline toward $63.90. Any more losses may perhaps open the doors for a move toward the $60.00 support zone.
On the upside, the price could struggle near the 50-hour simple moving average at $72.00. The first major resistance is near the $74.00 zone, above which the price might accelerate higher toward $76.00. Any more gains might send the price toward the $80.00 level in the coming days.