

Sample Category Title
Gold Price Analysis: Bulls Are Missing Out Again
Kitco is relaying an opinion on the price of gold from Karen Karniol-Tambour, co-chief investment officer at Bridgewater Associates:
→ Gold is undervalued.
→ Gold is supported by the tense geopolitical situation, including the military operations in Ukraine.
→ Inflation is volatile. There is a possibility that purchasing power will be lost.
It looks like a positive assessment should be taken as a long-term perspective, because so far the XAU/USD gold price chart shows a bearish trend.
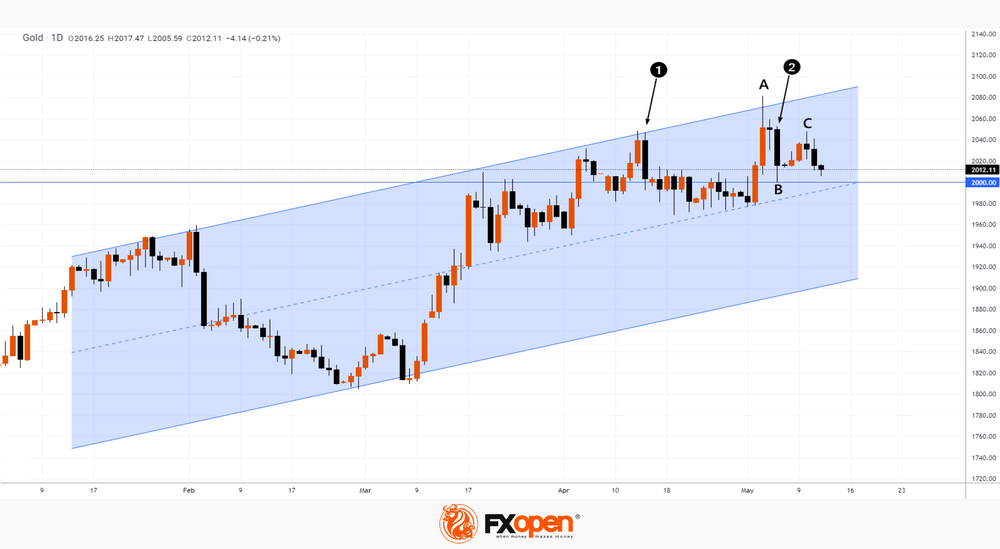
In April-May 2023, the price of XAU/USD exceeded the level of USD 2,000 for the third time (the first was in the summer of 2020, the second in the spring of 2022). But, judging by the analysis of the chart, this time the bulls will not be able to stay above this psychological mark.
→ On candles 1 and 2 bears are powerfully absorbing bullish efforts.
→ A long upper shadow on May 4 (A) indicates a lot of supply.
→ The rebound in B→C is approximately 50% of the decline in A→B
Therefore, there is a growing possibility that the price of gold XAU/USD may fall to the lower border of the current channel (shown in blue).
Chinese Inflation Miss Impacts AUD and the Elliott Wave outlook
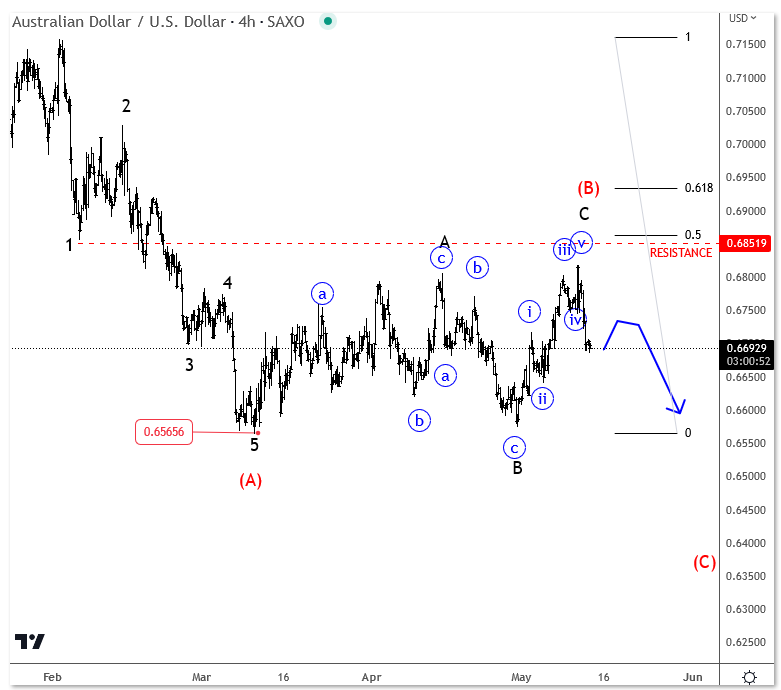
The Chinese economy continues to exhibit sluggish growth, with recent inflation data falling short of expectations at 0.1% year-on-year. Consequently, the Chinese yuan (CNH) experienced a decline, potentially influencing the performance of the Australian dollar (AUD), particularly when considering the additional factor of weak copper prices.
Upon examining the price chart, it becomes evident that the AUD has been displaying a bearish trend since February. During this period, the currency pair reached a significant peak, representing a higher degree impulse, as evidenced by the daily chart. Subsequently, a notable downward movement has transpired from the 0.7150 level, ideally leading to a higher degree correction that remains incomplete. Typically, corrections consist of three waves, but thus far, only wave (A) has materialized, followed by a wave (B) rally, which displays initial signs of completion around the resistance zone of 0.68-0.69. Presently, a compelling downward movement is underway. This implies the potential for further weakness in the upcoming weeks, with a probable retracement towards the 0.6565 area.
EUR/USD Technical Analysis
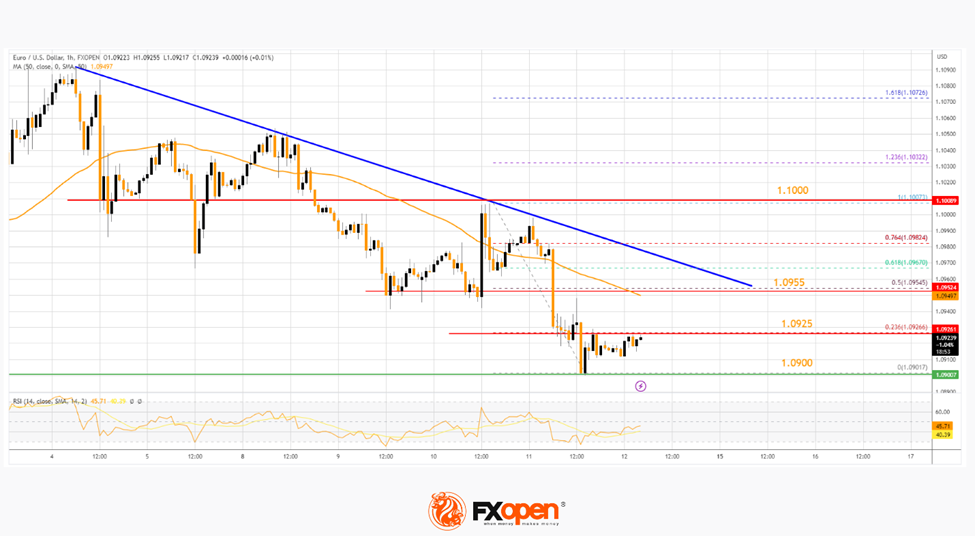
On the hourly chart of EUR/USD at FXOpen, the pair started a fresh decline below the 1.1000 support. The Euro declined below the 1.0955 support against the US Dollar.
The pair retested the 1.0900 support and is currently consolidating losses. On the upside, immediate resistance is near the 23.6% Fib retracement level of the recent decline from the 1.1007 swing high to the 1.0901 low at 1.0925.
The next major resistance is near the 50-hour simple moving average at 1.0955. A break above the 1.0955 resistance zone could start a decent increase toward the 1.1000 zone. A close above the 1.1000 level might start a strong increase toward the 1.1050 resistance.
Conversely, the pair might resume its decline from the 1.0900 level. Initial support is near the 1.0880 zone. The next major support is near 1.0850, below which EUR/USD could test the 1.0810 support.
USD/CAD Daily Outlook
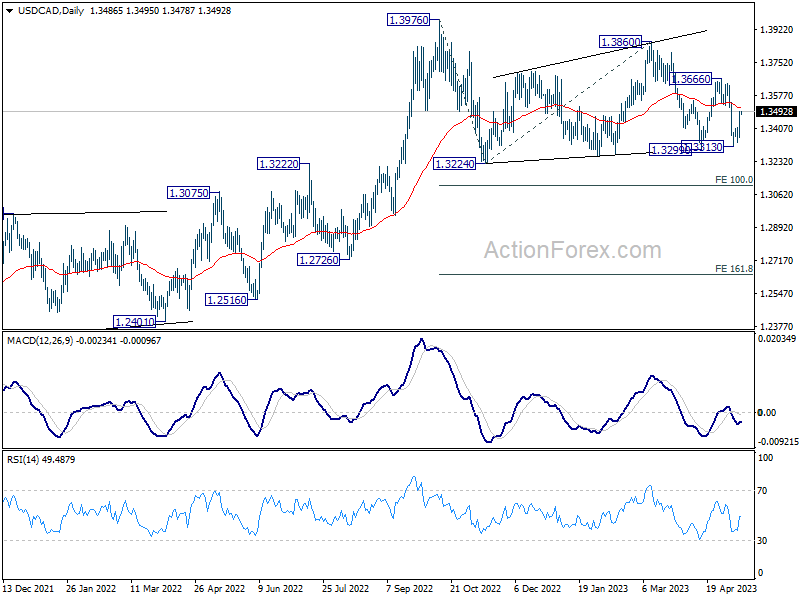
Daily Pivots: (S1) 1.3403; (P) 1.3450; (R1) 1.3536; More....
Intraday bias in USD/CAD is back on the upside with strong break of 55 4H EMA. Further rise would be seen back towards 1.3666 resistance. On the downside, firm break of 1.3299 will extend the corrective pattern from 1.3976 lower to 100% projection of 1.3976 to 1.3224 from 1.3860 at 1.3395 next.
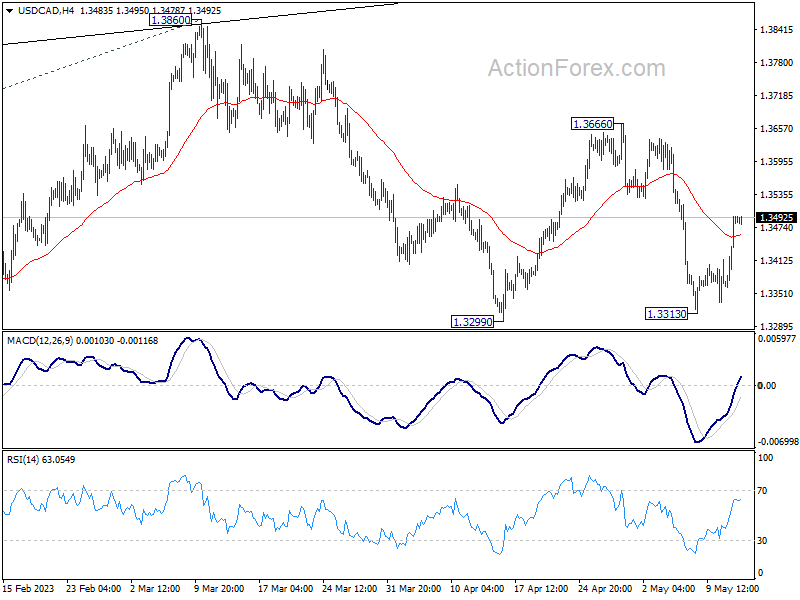
In the bigger picture, as long as 55 W EMA (now at 1.3315) holds, up trend from 1.2005 (2021 low) is still in favor to resume through 1.3976 at a later stage. However, sustained trading below the EMA and 38.2% retracement of 1.2005 to 1.3976 at 1.3233 will raise the chance of bearish reversal. Deeper should then be seen to 61.8% retracement at 1.2758 next.
AUD/USD Daily Report
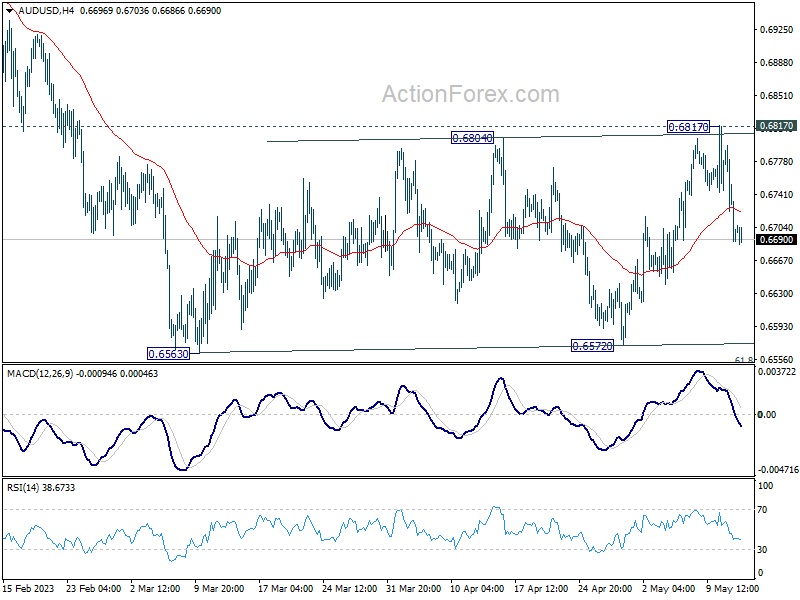
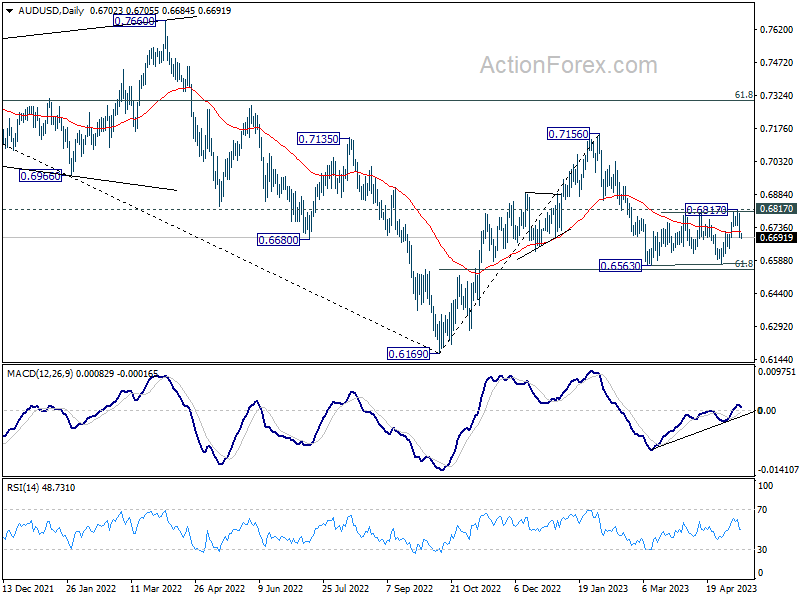
Daily Pivots: (S1) 0.6662; (P) 0.6729; (R1) 0.6769; More...
Intraday bias in AUD/USD remains mildly on the downside for retesting 0.6563 low. Consolidation pattern from there might have completed with three waves to 0.6817 already. Firm break of 0.6563 will resume larger fall from 0.7156. For now, risk will stay mildly on the downside as long as 0.6817 resistance holds, in case of recovery.
In the bigger picture, as long as 61.8% retracement of 0.6169 to 0.7156 at 0.6546 holds, the decline from 0.7156 is seen as a correction to rally from 0.6169 (2022 low) only. Another rise should still be seen through 0.7156 at a later stage. However, sustained break of 0.6546 will raise the chance of long term down trend resumption through 0.6169 low.
USD/JPY Daily Outlook
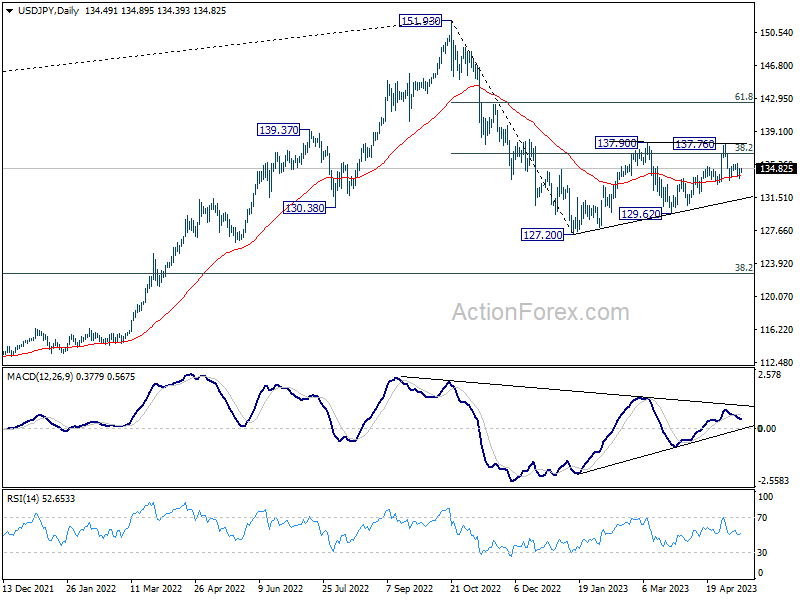
Daily Pivots: (S1) 133.93; (P) 134.39; (R1) 135.02; More...
Intraday bias in USD/JPY stays neutral as consolidation from 133.48 is in progress. Further decline is in favor with 135.68 resistance intact. Fall from 137.76 is seen as the third leg of the pattern from 137.90. Below 133.48 will target 133.00 first, break will target 129.62 support. Still, as long as 129.62 holds, larger rebound from 127.20 is still in favor to resume at a later stage. On the upside, above 135.68 minor resistance will turn bias back to the upside for 137.76/90 instead.
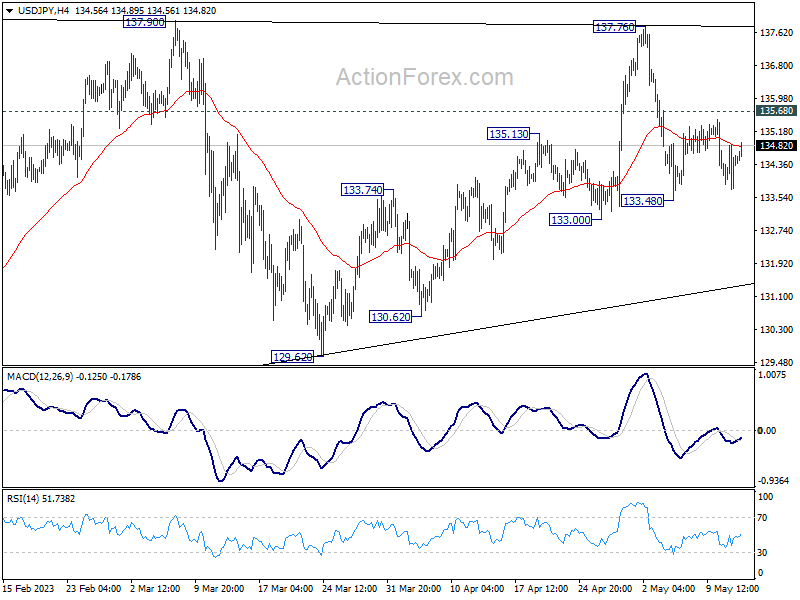
In the bigger picture, price actions from 151.93 high are currently seen as a corrective pattern to the long term up trend. The first leg should have completed at 127.20. Rebound from there is seen as the second leg. Sustained break of 38.2% retracement of 151.93 to 127.20 at 136.34 will bring stronger rebound to 61.8% retracement at 142.48. Meanwhile, break of 129.62 will argue that the third leg is starting through 127.20 low.
USD/CHF Daily Outlook
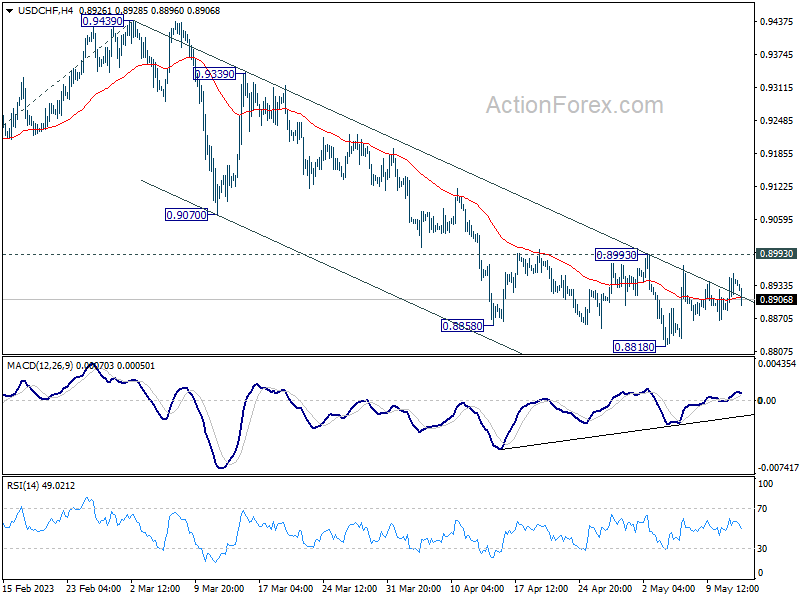
Daily Pivots: (S1) 0.8900; (P) 0.8929; (R1) 0.8972; More...
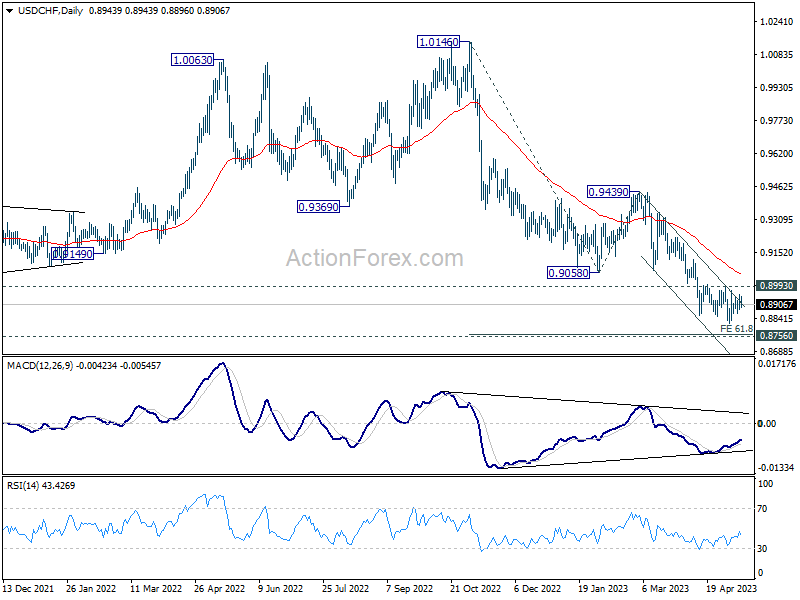
Range trading continues in USD/CHF and intraday bias remains neutral. While down trend from 1.0146 could still extend lower, strong support should be seen from 61.8% projection of 1.0146 to 0.9058 from 0.9439 at 0.8767, which is close to 0.8756 long term support, to bring rebound, at least on first attempt. On the upside, break of 0.8993 resistance will indicate short term bottoming, on bullish convergence condition in 4H MACD, and turn bias back to the upside for stronger rebound to 55 D EMA (now at 0.9054) and possibly above.
In the bigger picture, fall from 1.1046 (2022 high) is seen as a leg in the long term range pattern from 1.0342 (2016 high). So, downside should be contained by 0.8756 to bring reversal. Sustained break of 0.9058 support turned resistance will be the first sign of medium term bottoming. However, decisive break of 0.8756 will carry larger bearish implications.
GBP/USD Daily Outlook
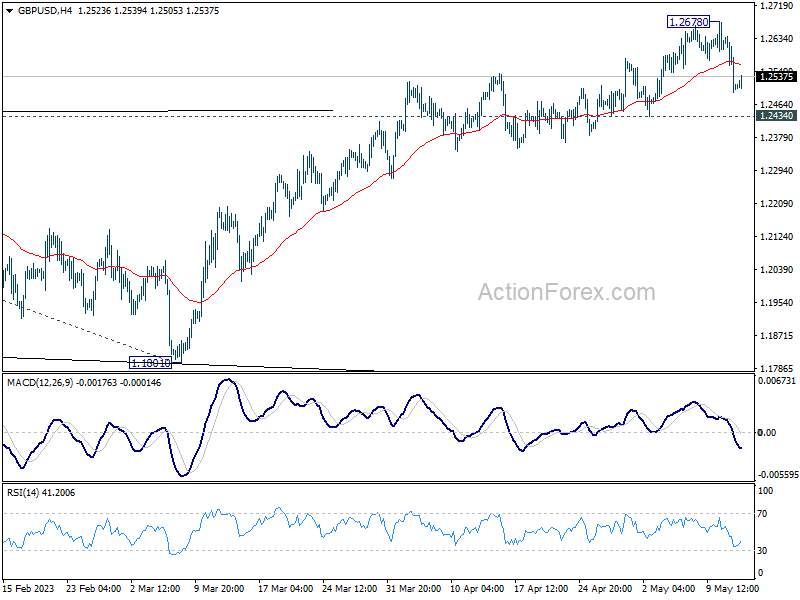
Daily Pivots: (S1) 1.2459; (P) 1.2550; (R1) 1.2603; More...
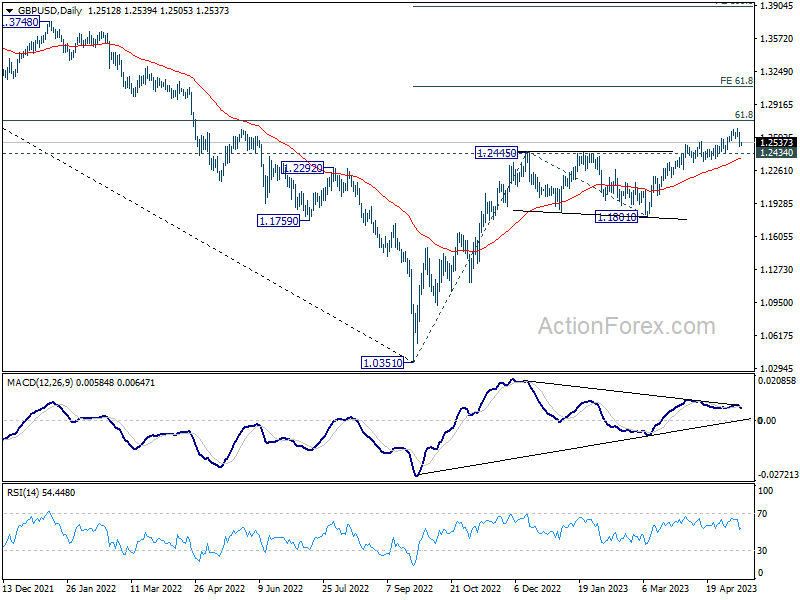
Intraday bias in GBP/USD remains neutral and further rally is expected as long as 1.2434 support holds. Break of 1.2678 will resume larger up trend to 1.2759 fibonacci level first. Firm break there will target 61.8% projection of 1.0351 to 1.2445 from 1.1801 at 1.3095. However, decisive break of 1.2434 will confirm short term topping, and turn bias back to the downside for deeper fall.
In the bigger picture, the rise from 1.0351 medium term term bottom (2022 low) is in progress for 61.8% retracement of 1.4248 (2021 high) to 1.0351 at 1.2759. Sustained break there will add to the case of long term bullish trend reversal. Further break of 61.8% projection of 1.0351 to 1.2445 from 1.1801 at 1.3095 could prompt upside acceleration to 100% projection at 1.3895. For now, this will remain the favored case as long as 1.1801 support holds, even in case of deep pull back.
EUR/USD Daily Outlook
Daily Pivots: (S1) 1.0878; (P) 1.0938; (R1) 1.0976; More...
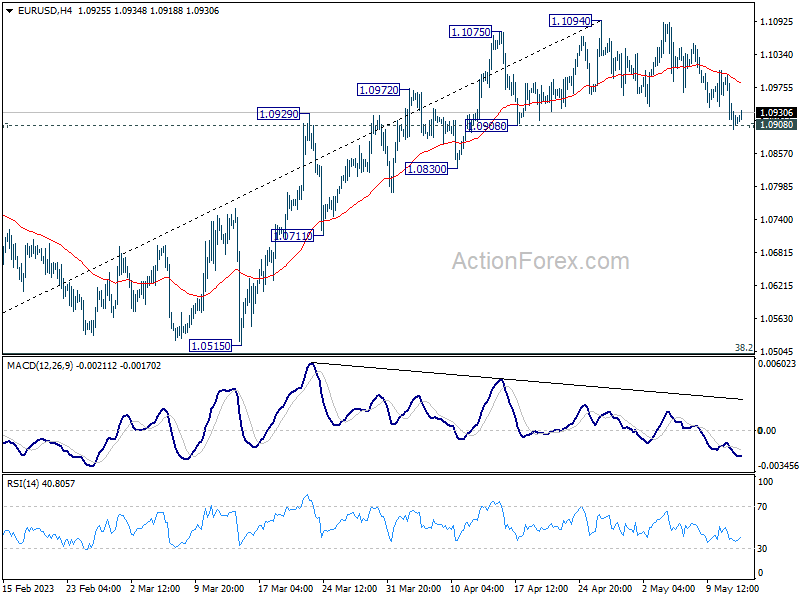
EUR/USD recovered after trying to draw support from 1.0908 and intraday bias stays neutral first. On the upside, firm break of 1.1094 will resume larger up trend to 1.1273 fibonacci level. However, considering bearish divergence condition in 4H MACD, sustained break of 1.0908 support will indicate short term topping and turn bias back to the downside. Further break of 1.0830 will target 1.0515 key support level.
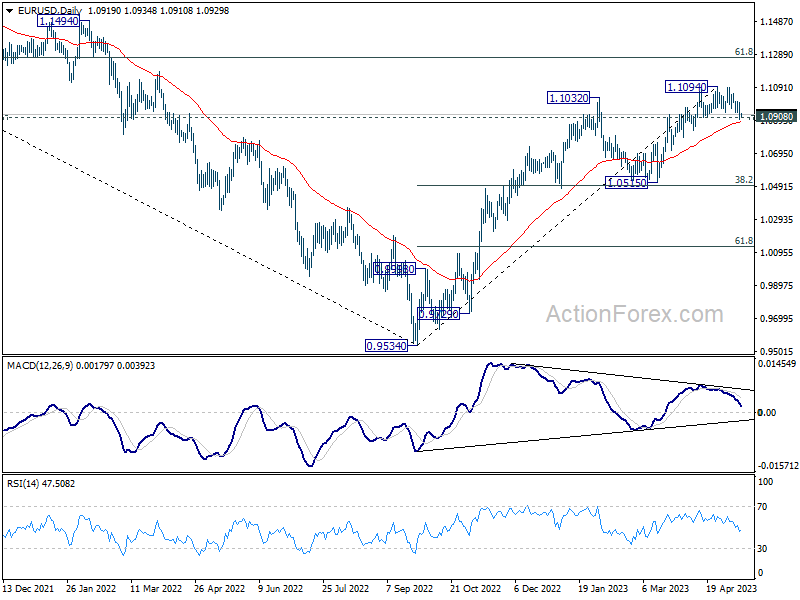
In the bigger picture, rise from 0.9534 (2022 low) is in progress for 61.8% retracement of 1.2348 (2021 high) to 0.9534 at 1.1273. Sustained break there will solidify the case of bullish trend reversal and target 1.2348 resistance next (2021 high). This will now remain the favored case as long as 1.0515 support holds, even in case of deeper pull back.
Fed Bowman suggests potential for further monetary tightening
Fed Governor Michelle Bowman highlighted concerns over persistently high inflation and a tight labor market. In a speech, she suggested the need for additional monetary policy tightening should these conditions persist.
She stated, "The most recent CPI and employment reports have not provided consistent evidence that inflation is on a downward path, and I will continue to closely monitor the incoming data as I consider the appropriate stance of monetary policy going into our June meeting."
She emphasized the necessity of a "sufficiently restrictive" policy stance to curtail inflation over time, especially if inflation remains elevated and the labor market continues to be tight.
She further added, "I also expect that our policy rate will need to remain sufficiently restrictive for some time to bring inflation down and create conditions that will support a sustainably strong labor market."
Despite her clear inclination towards policy tightening, Governor Bowman was careful to stress the uncertainty of economic outlook and the adaptability of Fed's policy actions.
"Of course, the economic outlook is uncertain and our policy actions are not on a preset course," she concluded, indicating Fed's readiness to adjust its approach as necessary in response to evolving economic conditions.