

Sample Category Title
Fed Bowman suggests potential for further monetary tightening
Fed Governor Michelle Bowman highlighted concerns over persistently high inflation and a tight labor market. In a speech, she suggested the need for additional monetary policy tightening should these conditions persist.
She stated, "The most recent CPI and employment reports have not provided consistent evidence that inflation is on a downward path, and I will continue to closely monitor the incoming data as I consider the appropriate stance of monetary policy going into our June meeting."
She emphasized the necessity of a "sufficiently restrictive" policy stance to curtail inflation over time, especially if inflation remains elevated and the labor market continues to be tight.
She further added, "I also expect that our policy rate will need to remain sufficiently restrictive for some time to bring inflation down and create conditions that will support a sustainably strong labor market."
Despite her clear inclination towards policy tightening, Governor Bowman was careful to stress the uncertainty of economic outlook and the adaptability of Fed's policy actions.
"Of course, the economic outlook is uncertain and our policy actions are not on a preset course," she concluded, indicating Fed's readiness to adjust its approach as necessary in response to evolving economic conditions.
EUR/CHF Daily Outlook
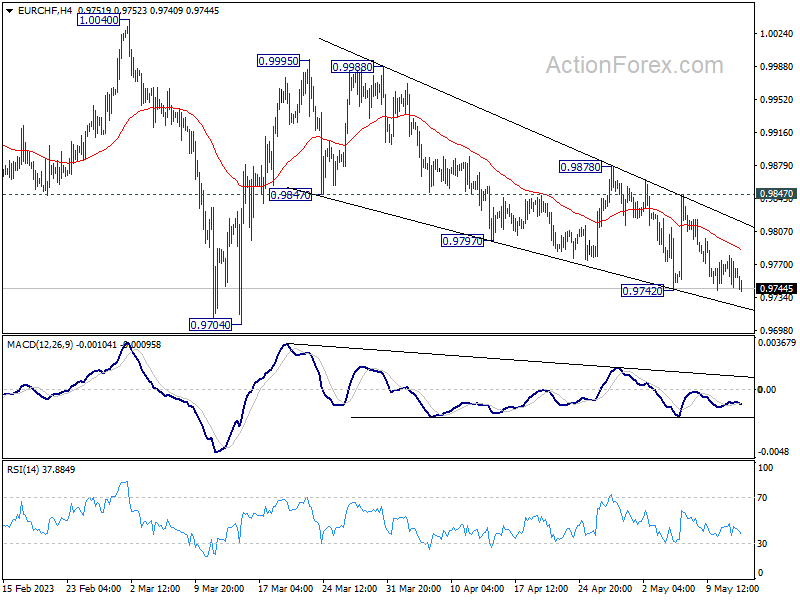
Daily Pivots: (S1) 0.9751; (P) 0.9764; (R1) 0.9785; More...
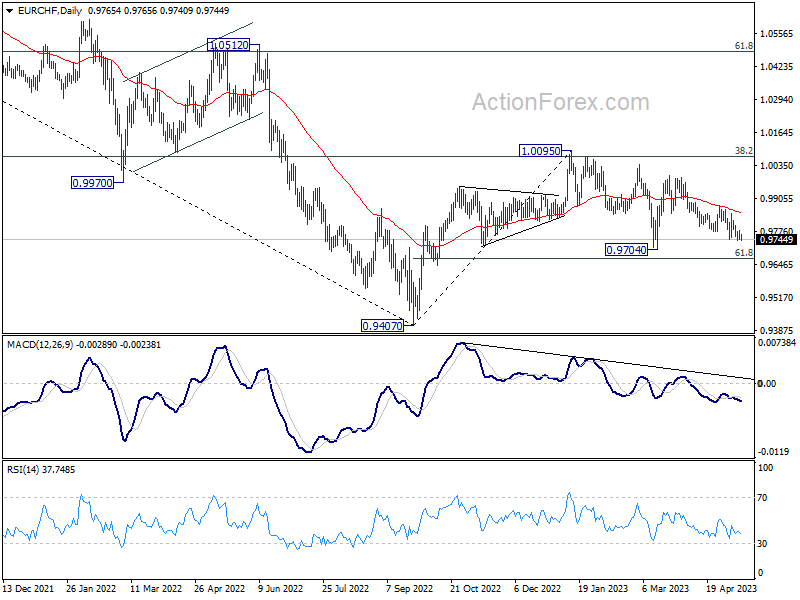
EUR/CHF's correction from 0.9995 might extend lower. But downside should be contained above 0.9704 to bring rebound. Whole corrective decline from 1.0095 should have completed at 0.9704. On the upside, break of 0.9847 resistances will turn bias back to the upside for stronger rally back to 0.9995.
In the bigger picture, prior rejection by 55 W EMA (now at 0.9971) and 38.2% retracement of 1.1149 to 0.9407 at 1.0072 suggests that medium term outlook is staying bearish. That is, down trend from 1.2004 is not completed yet and is in favor to resume through 0.9407 at a later stage. However, decisive break of 1.0095 resistance will raise the chance of bullish trend reversal. Rise from 0.9407 should then target 1.0505 cluster resistance (2020 low at 1.0505, 61.8% retracement of 1.1149 to 0.9407 at 1.1484).
EUR/GBP Daily Outlook
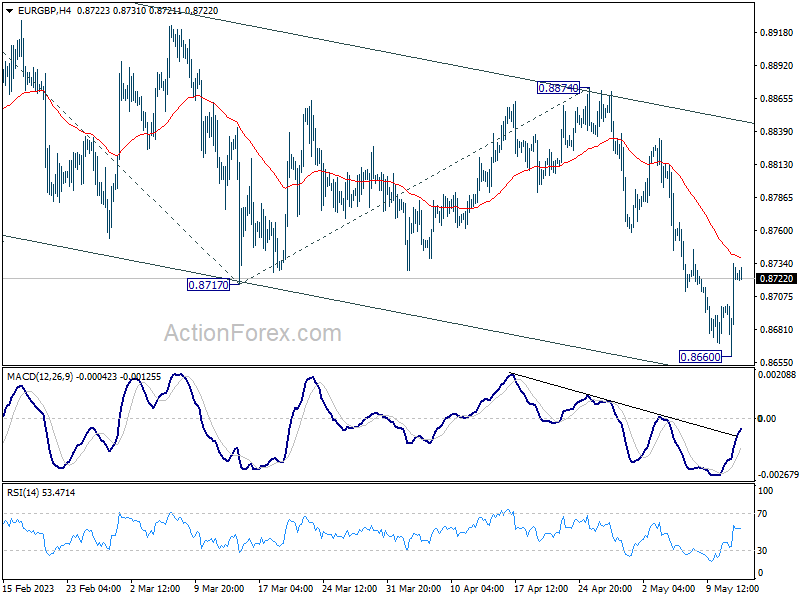
Daily Pivots: (S1) 0.8679; (P) 0.8707; (R1) 0.8752; More...
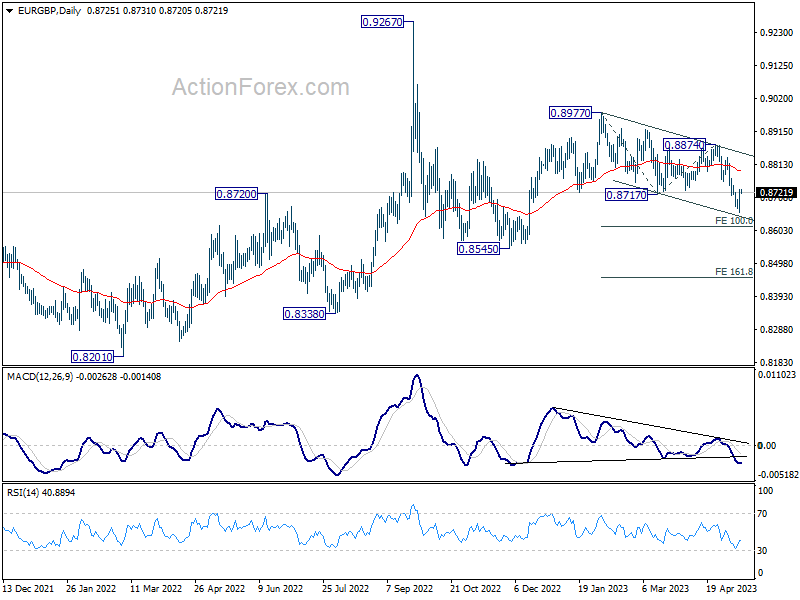
Intraday bias in EUR/GBP is neutral for consolidation above 0.8660. Still, current decline from 0.8977 is in favor to continue as the consolidation completes. Break of 0.8660 will target 100% projection of 0.8977 to 0.8717 from 0.8874 at 0.8614. Firm break there will pave the way to 161.8% projection at 0.8453.
In the bigger picture, current development argues that whole decline from 0.9267 (2022 high) is still in progress. This is part of the long term range pattern from 0.9499 (2020 high). Deeper fall would be seen to 0.8338 support, or further to 0.8201. This will now remain the favored case as long as 0.8874 resistance holds.
EUR/AUD Daily Outlook
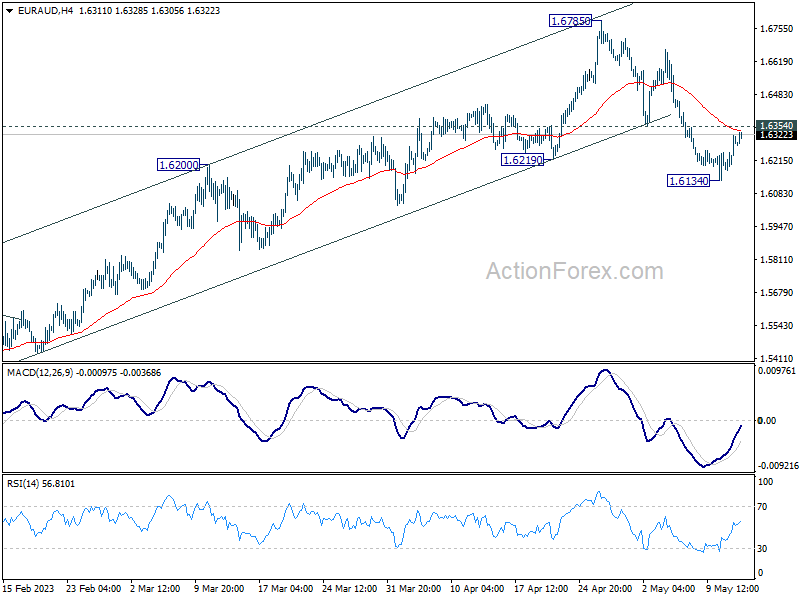
Daily Pivots: (S1) 1.6204; (P) 1.6261; (R1) 1.6344; More...
Intraday bias in EUR/AUD remains neutral for the moment. With 1.6354 support turned resistance intact, decline from 1.6785 short term top would extend lower. Below 1.6134 will target 1.5254/5976 support zone. Nevertheless, break of 1.6354 will revive near term bullishness and turn bias back to the upside for rebound.
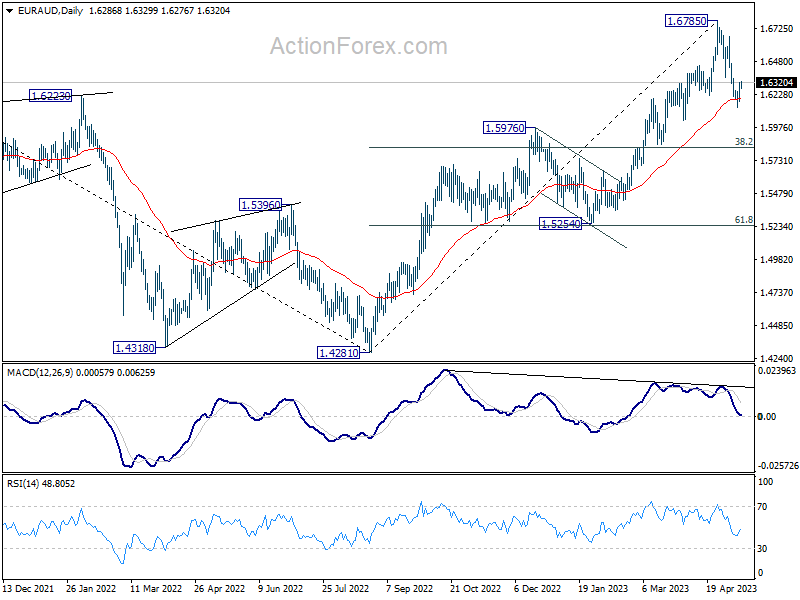
In the bigger picture, the solid break of 1.6434 resistance argues that whole down trend from 1.9799 (2020 high) has completed at 1.4281 (2022 low). Further rise should be seen to 61.8% retracement of 1.9799 to 1.4281 at 1.7691 next. For now, outlook will stay bullish as long as 1.5976 resistance turned support holds, even in case of deep pull back.
EUR/JPY Daily Outlook
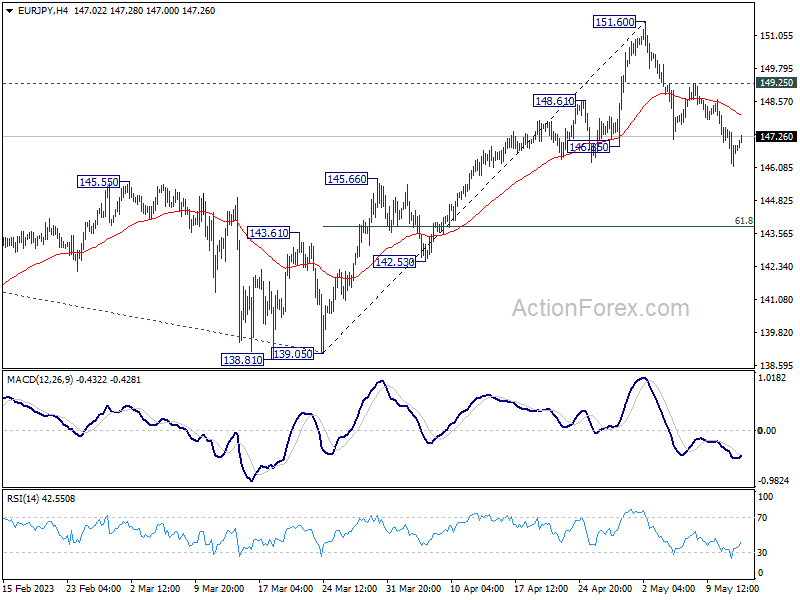
Daily Pivots: (S1) 146.15; (P) 146.88; (R1) 147.61; More....
Intraday bias in EUR/JPY remains on the downside at this point. Fall from 151.60 short term top would target 61.8% retracement of 139.05 to 151.60 at 143.84. But strong support should emerge above 139.05 to complete the correction and bring rebound. On the upside, break of 149.25 minor resistance will turn bias back to the upside for retesting 151.60 high.
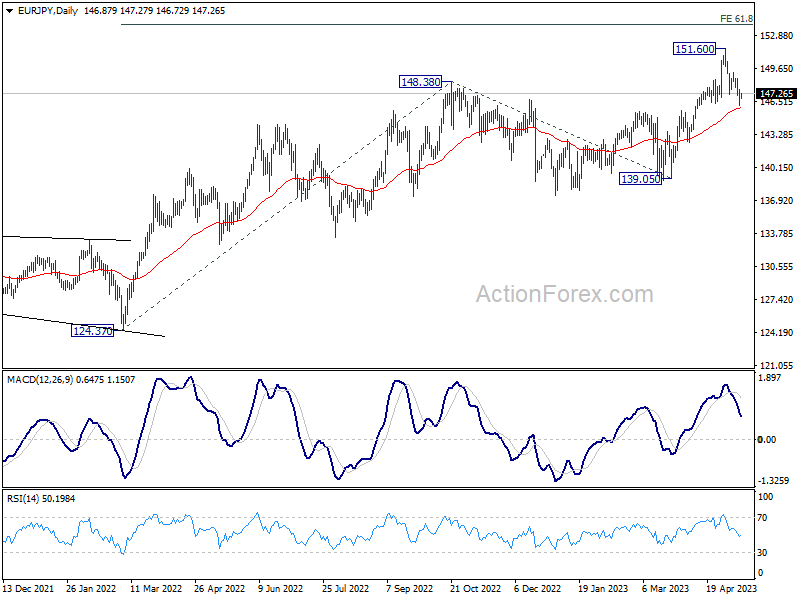
In the bigger picture, current development indicates that rise from 114.42 (2020 low) is in progress. Next target is 61.8% projection of 124.37 to 148.38 from 139.05 at 154.14. Sustained break there will pave the way to 100% projection at 162.82. For now, medium term outlook will remain bullish as long as 139.05 support holds, even in case of deep pull back.
China Equities Bulls in Need of Fresh Liquidity
- China’s benchmark stock indices have underperformed against the rest of the world.
- Weak macro data and geopolitical risk have reinforced the recent bout of weakness.
- China’s central bank, PBoC may be forced to undertake more proactive accommodative policies.
In the past week, the performances of the benchmark China stock indices and its proxies have underperformed the rest of the world. In terms of week-to-date returns at this time of the writing, the CSI 300 and China A50 have recorded losses of -1.10% and -0.90% respectively that versus the MSCI All-Country Word Index ETF at -0.40%.
In addition, the Hong Kong benchmark stock indices have also lagged this week with losses seen in the Hang Seng Index (-2.00%) and Hang Seng China Enterprise Index (-1.70%). The exception so far is from the Hang Seng TECH Index which is heavily concentrated in China’s Big Tech stocks trimmed its earlier week-to-date loss of -3.5% to -0.15% assisted by better-than-expected Q1 earnings results of e-commerce giant, JD.com.
Weak macro data put downside pressure on the 5% GDP growth target of China for 2023
The recent key economic data out from China has indicated that the growth spurt from the “post-Covid zero reopening” policies has dissipated.
Manufacturing activities slipped back to contraction mode in April after three consecutive months of growth and the services sector is also signs of expansion fatigue as the Caixin Services PMI for April has slipped to 56.4 from a 28-month high of 57.8 printed in March.
Inflationary pressures have been surprisingly lacklustre in China despite the recent growth-oriented policies implemented by key policymaking state agencies. The latest consumer price index data for April has decelerated to 0.1% year-on-year, its 3rd consecutive month of slowdown below 2%, and factory gate prices measured by the producer price index plunged to -3.6% year-on-year, its seventh straight month of contraction.
These data are pointing to a weak external environment and the lack of inertia from domestic demand to cover the shortfall has increased the risk of the deflationary spiral in China, a toxic concoction that may persist if left unaddressed. Also, inflationary pressures in China are way below the average gauge of inflation rate among emerging and developed countries.
Heightened geopolitical risk may push away foreign investors
Foreign direct investments and portfolio flows into China may slow down due to the latest government-led policies that tighten foreign access to sensitive information on Chinese corporations and key management personnel amid growing tensions with the US.
In addition, an earlier initiative urged state-owned enterprises to phase out the internationally recognized “Big Four” accounting firms for audits in China due to data security concerns.
All these measures will create a shade of “opaqueness” in China’s financial markets that may deter foreign capital inflows despite the Chinese stock market that has a cheaper valuation than the US; the MSCI China trades at a forward price-to-earnings ratio of 10.2 versus a ratio of 18.0 on the US S&P 500 based on data from Refinitiv as of 10 May 2023.
China central bank, PBoC may be forced to open its liquidity tap
Credit growth in China has moderated significantly in April where aggregate financing reached 1.22 trillion yuan, below the consensus forecast of 2 trillion yuan. In addition, M2 growth, the broadest measure of money supply dipped down to 12.4% year-on-year, its slowest pace seen so far this year.
PBoC’s current stance in promoting growth is following the script of a targeted approach rather than an all-out quantitative easing style to prevent unproductive resources to be deployed into speculative activities.
Given the prior Politburo’s April meeting that emphasized proactive fiscal policy should be stepped up and work alongside monetary policy to boost the current insufficient levels of demand, PBoC may implement a policy interest rate cut on its one-year medium-term lending facility (MLF) rate soon, either next Monday, 15 May or in June to address the recent weak macro data as mentioned earlier; the last cut on the one-year MLF rate was implemented in August 2022.
China AH share premium has reached a key support area
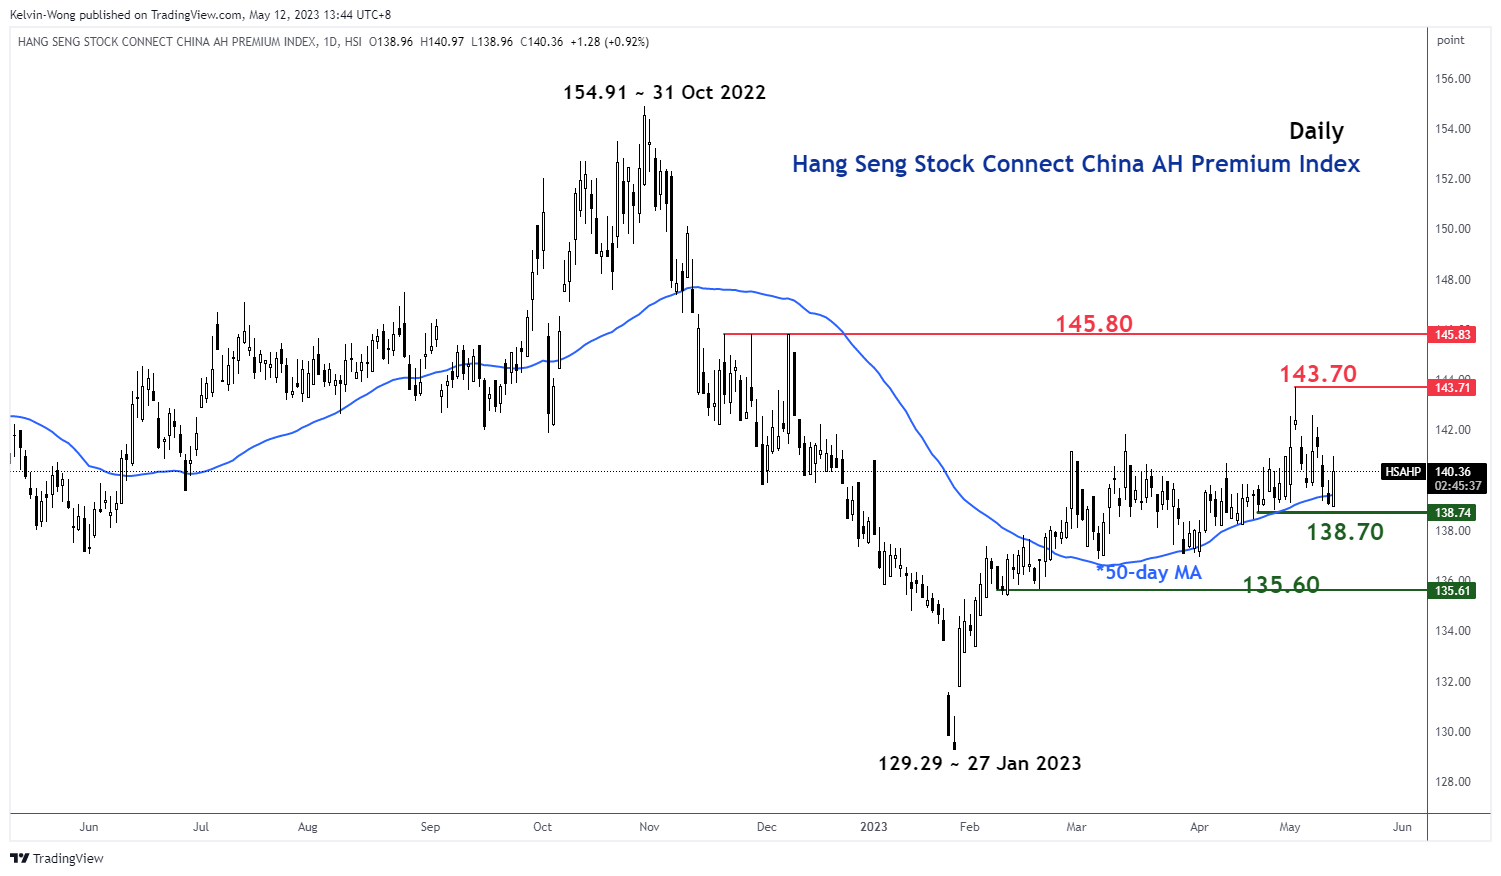
Fig 1: Hang Seng Stock Connect China AH Premium Index trend as of 12 May 2023 (Source: TradingView, click to enlarge chart)
The Hang Seng Stock Connect China AH Premium Index measures the absolute price premium or discount of China A shares over their dual-listed H shares in Hong Kong. A level above 100 indicates that A shares are more expensive than H shares and vice versa when the Index goes below 100.
The recent 3.3% contraction of the AH Premium Index from its 3 May 2023 high of 143.71 high has reached a key medium-term support at the 138.70 level which is defined by an upward-sloping 50-day moving average that the Index has traded above it since 22 February 2023.
Looking at the lens from a technical analysis perspective, the AH Premium Index may start to stage a rebound at this juncture and such a move is likely to be reinforced by more proactive accommodative monetary policies from PBoC. A potential up move in the AH Premium Index may reverse the recent softness seen in the China benchmark stock indices.
China A50 Technical Analysis – 12,300 remains the key support to watch
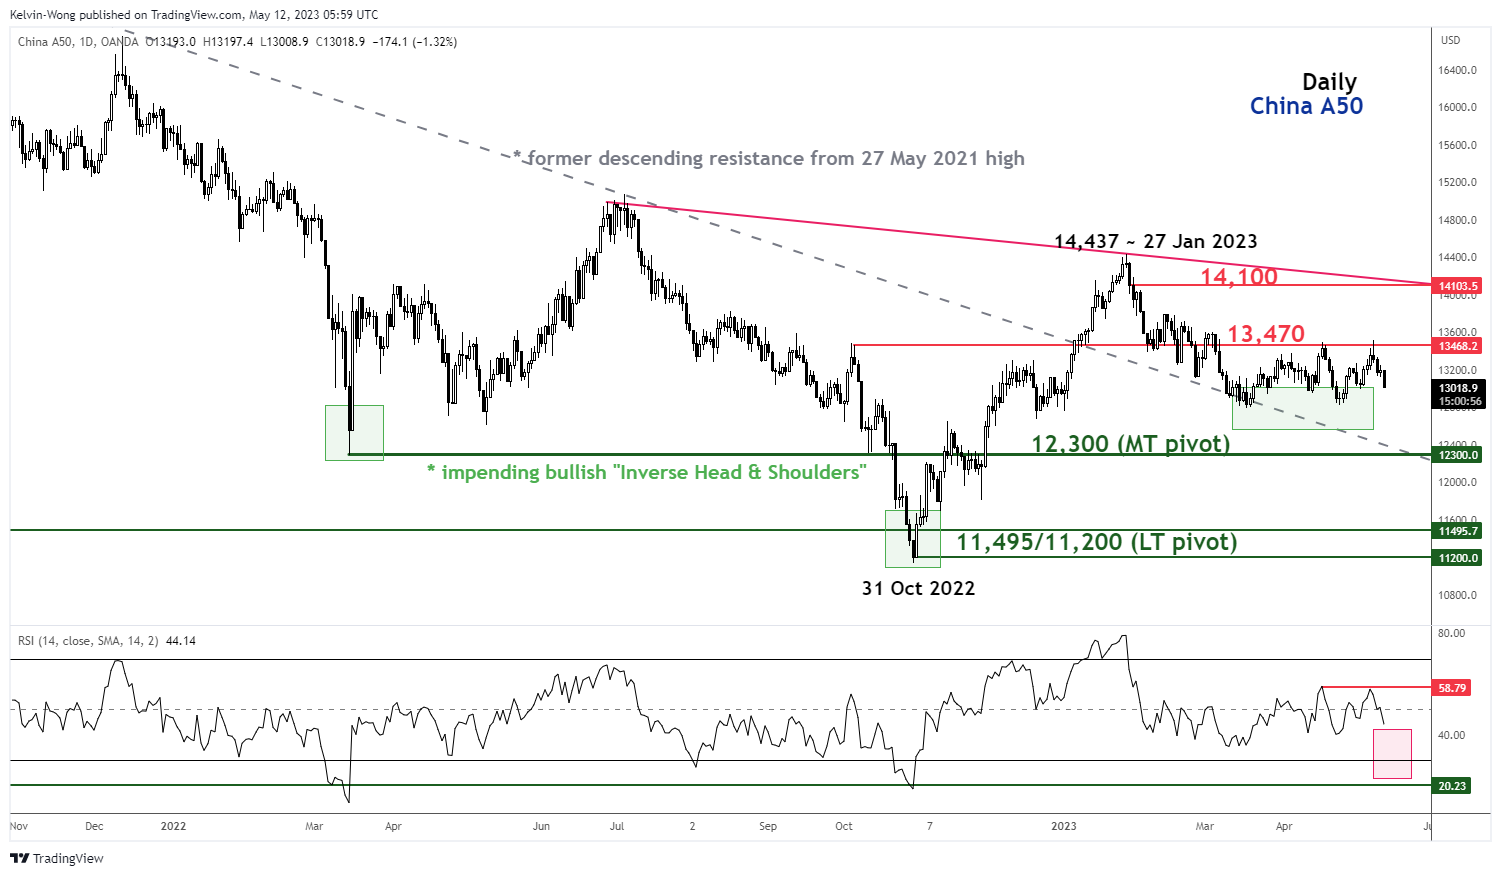
Fig 2: China A50 trend as of 12 May 2023 (Source: TradingView, click to enlarge chart)
The China A50 Index (a proxy for the FTSE China A50 futures) failed again to stage a bullish breakout above its 13,470 intermediate range resistance on Tuesday, 9 May; its second attempt and it staged a decline of -3.7% thereafter.
Short-term upside momentum is still non-existent as indicated by the 4-hour RSI oscillator which is still below a corresponding resistance at the 58% level and has room for a potential further slide before it reaches an oversold region (below 30%).
A point to note is that the Index is still evolving in a potential long-term bullish impending “Inverse Head & Shoulders” configuration since the 15 March 2022 low with the key medium-term pivotal support at 12,300.
A clearance above 13,470 sees the next resistance coming in at 14,100.
GBP Pulls Lower
GBP/USD goes into correction
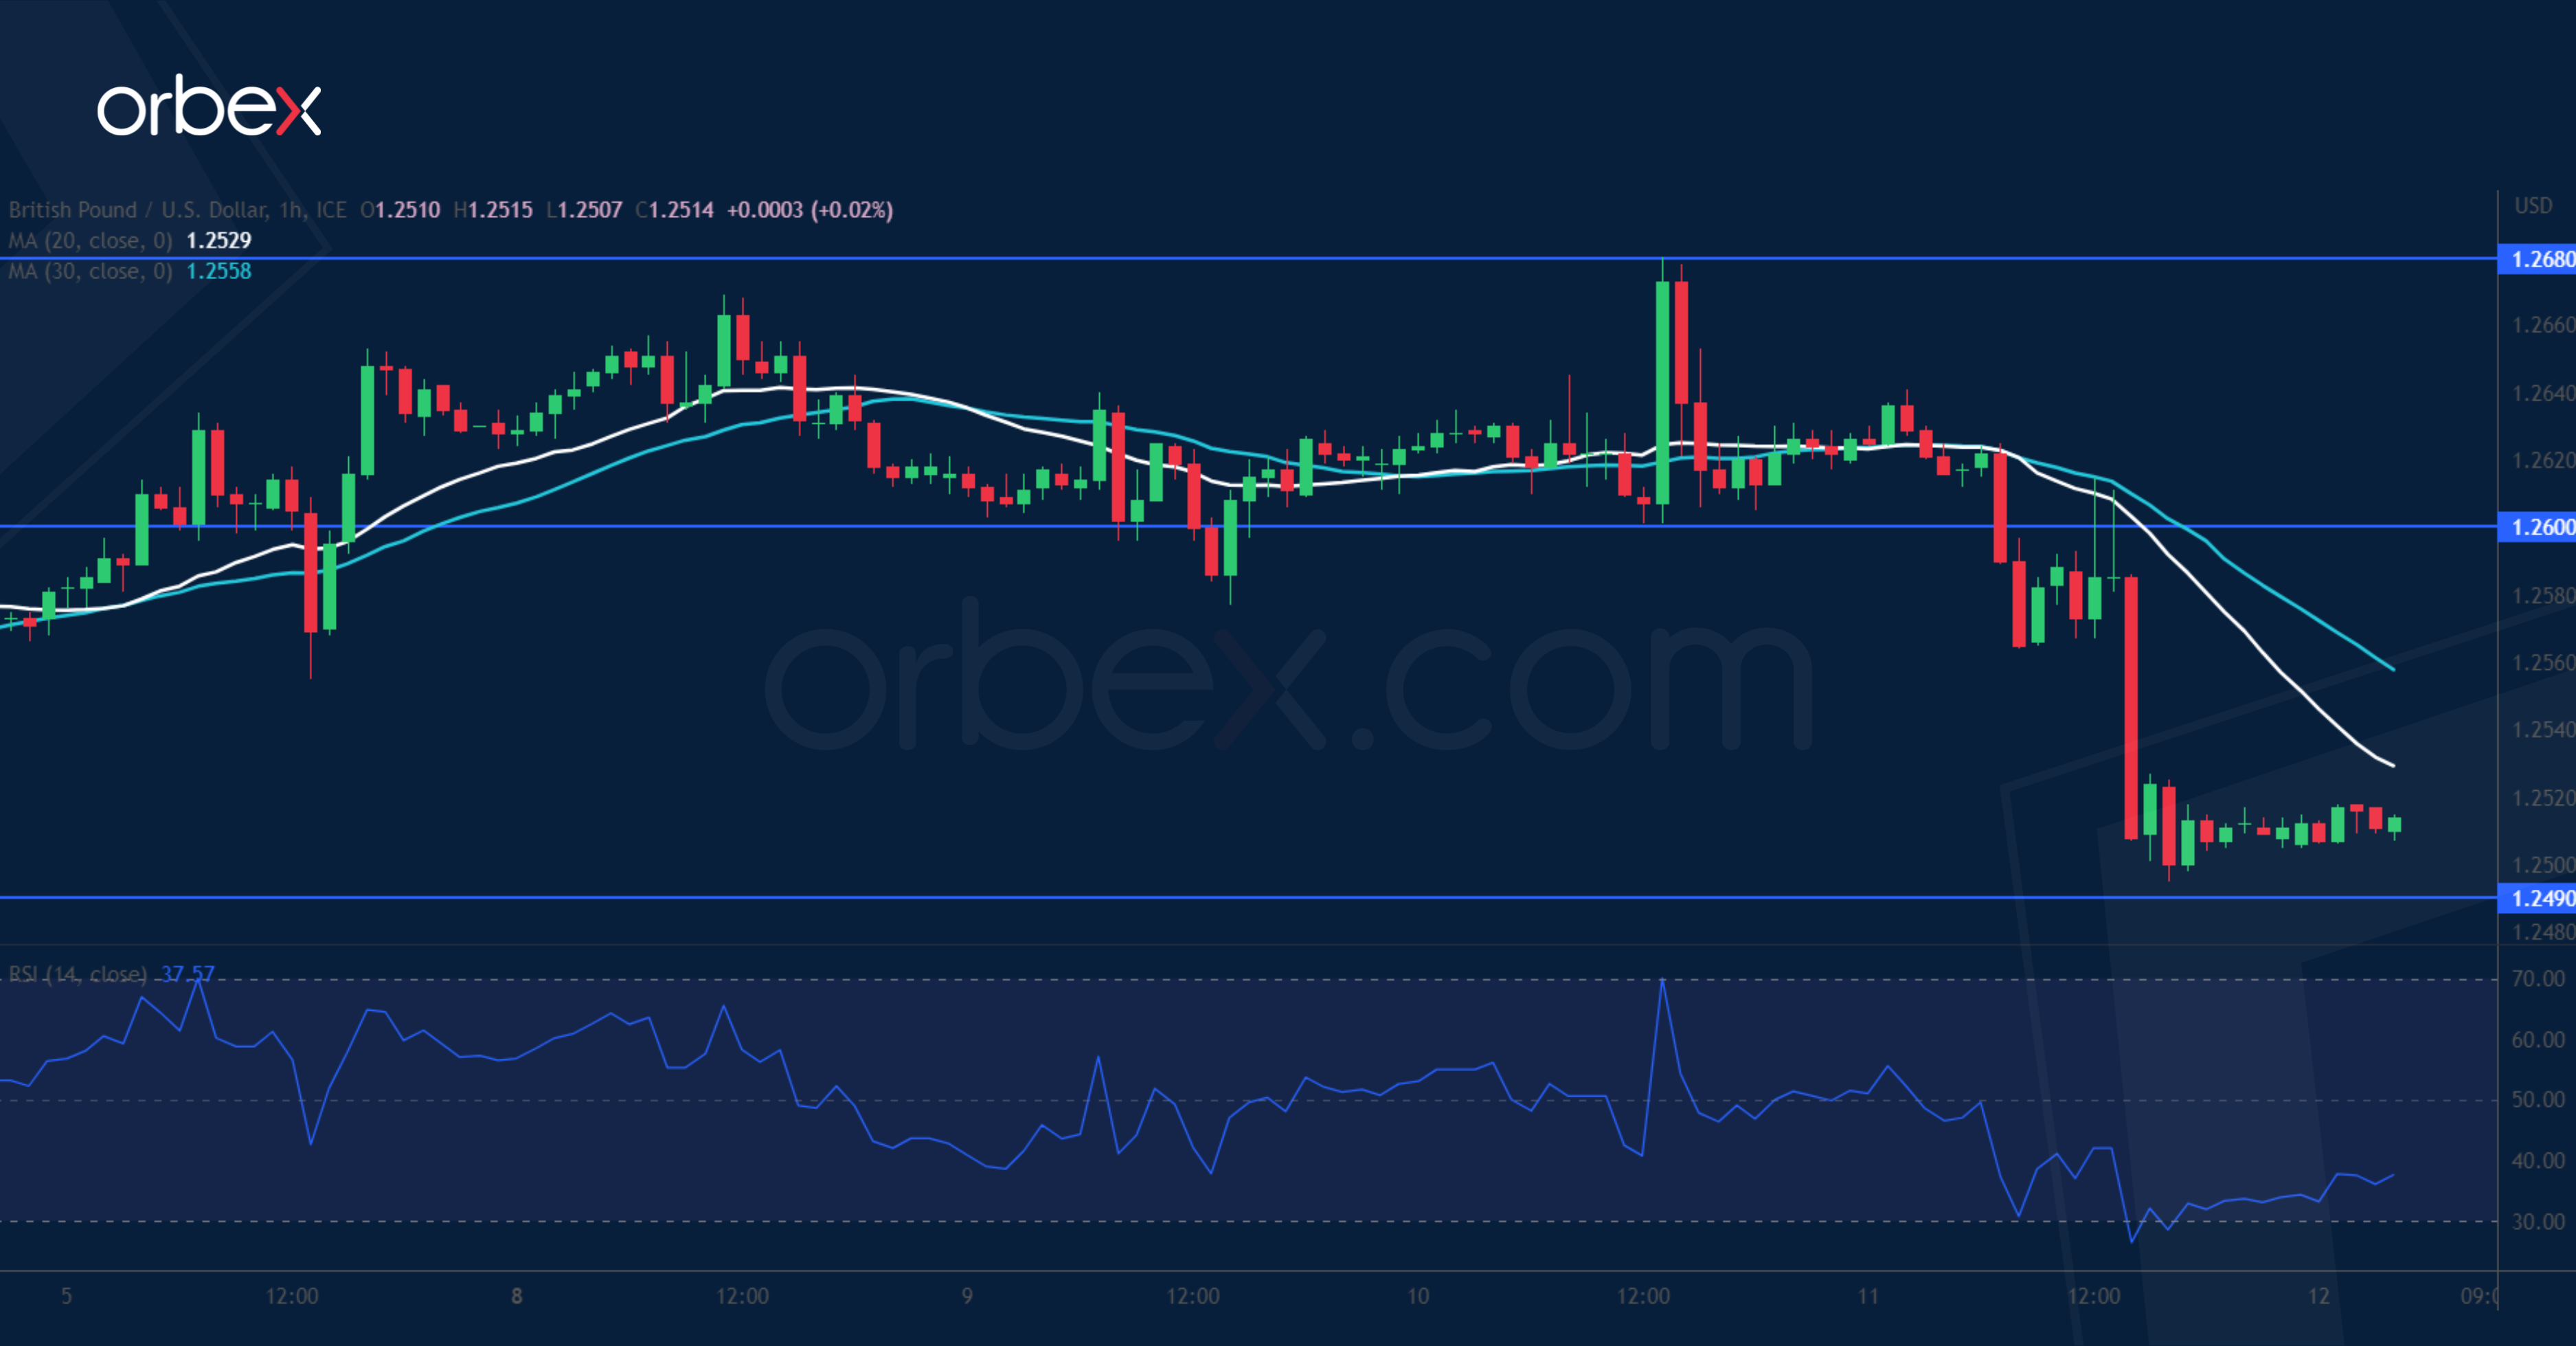
The pound retreated after the BoE warned that the impact of rate hikes will be felt in coming quarters. From the daily chart’s perspective, the bias remains bullish as the pair reaches a 12-month high. A drop below 1.2600 has led intraday buyers to take some chips off the table but a limited retreat could be an opportunity for the trend followers to step in at a discount. 1.2490 along the 20-day SMA is a major floor to keep the current momentum intact. 1.2600 is a fresh resistance and a close above 1.2680 would resume the rally.
NZD/USD seeks support
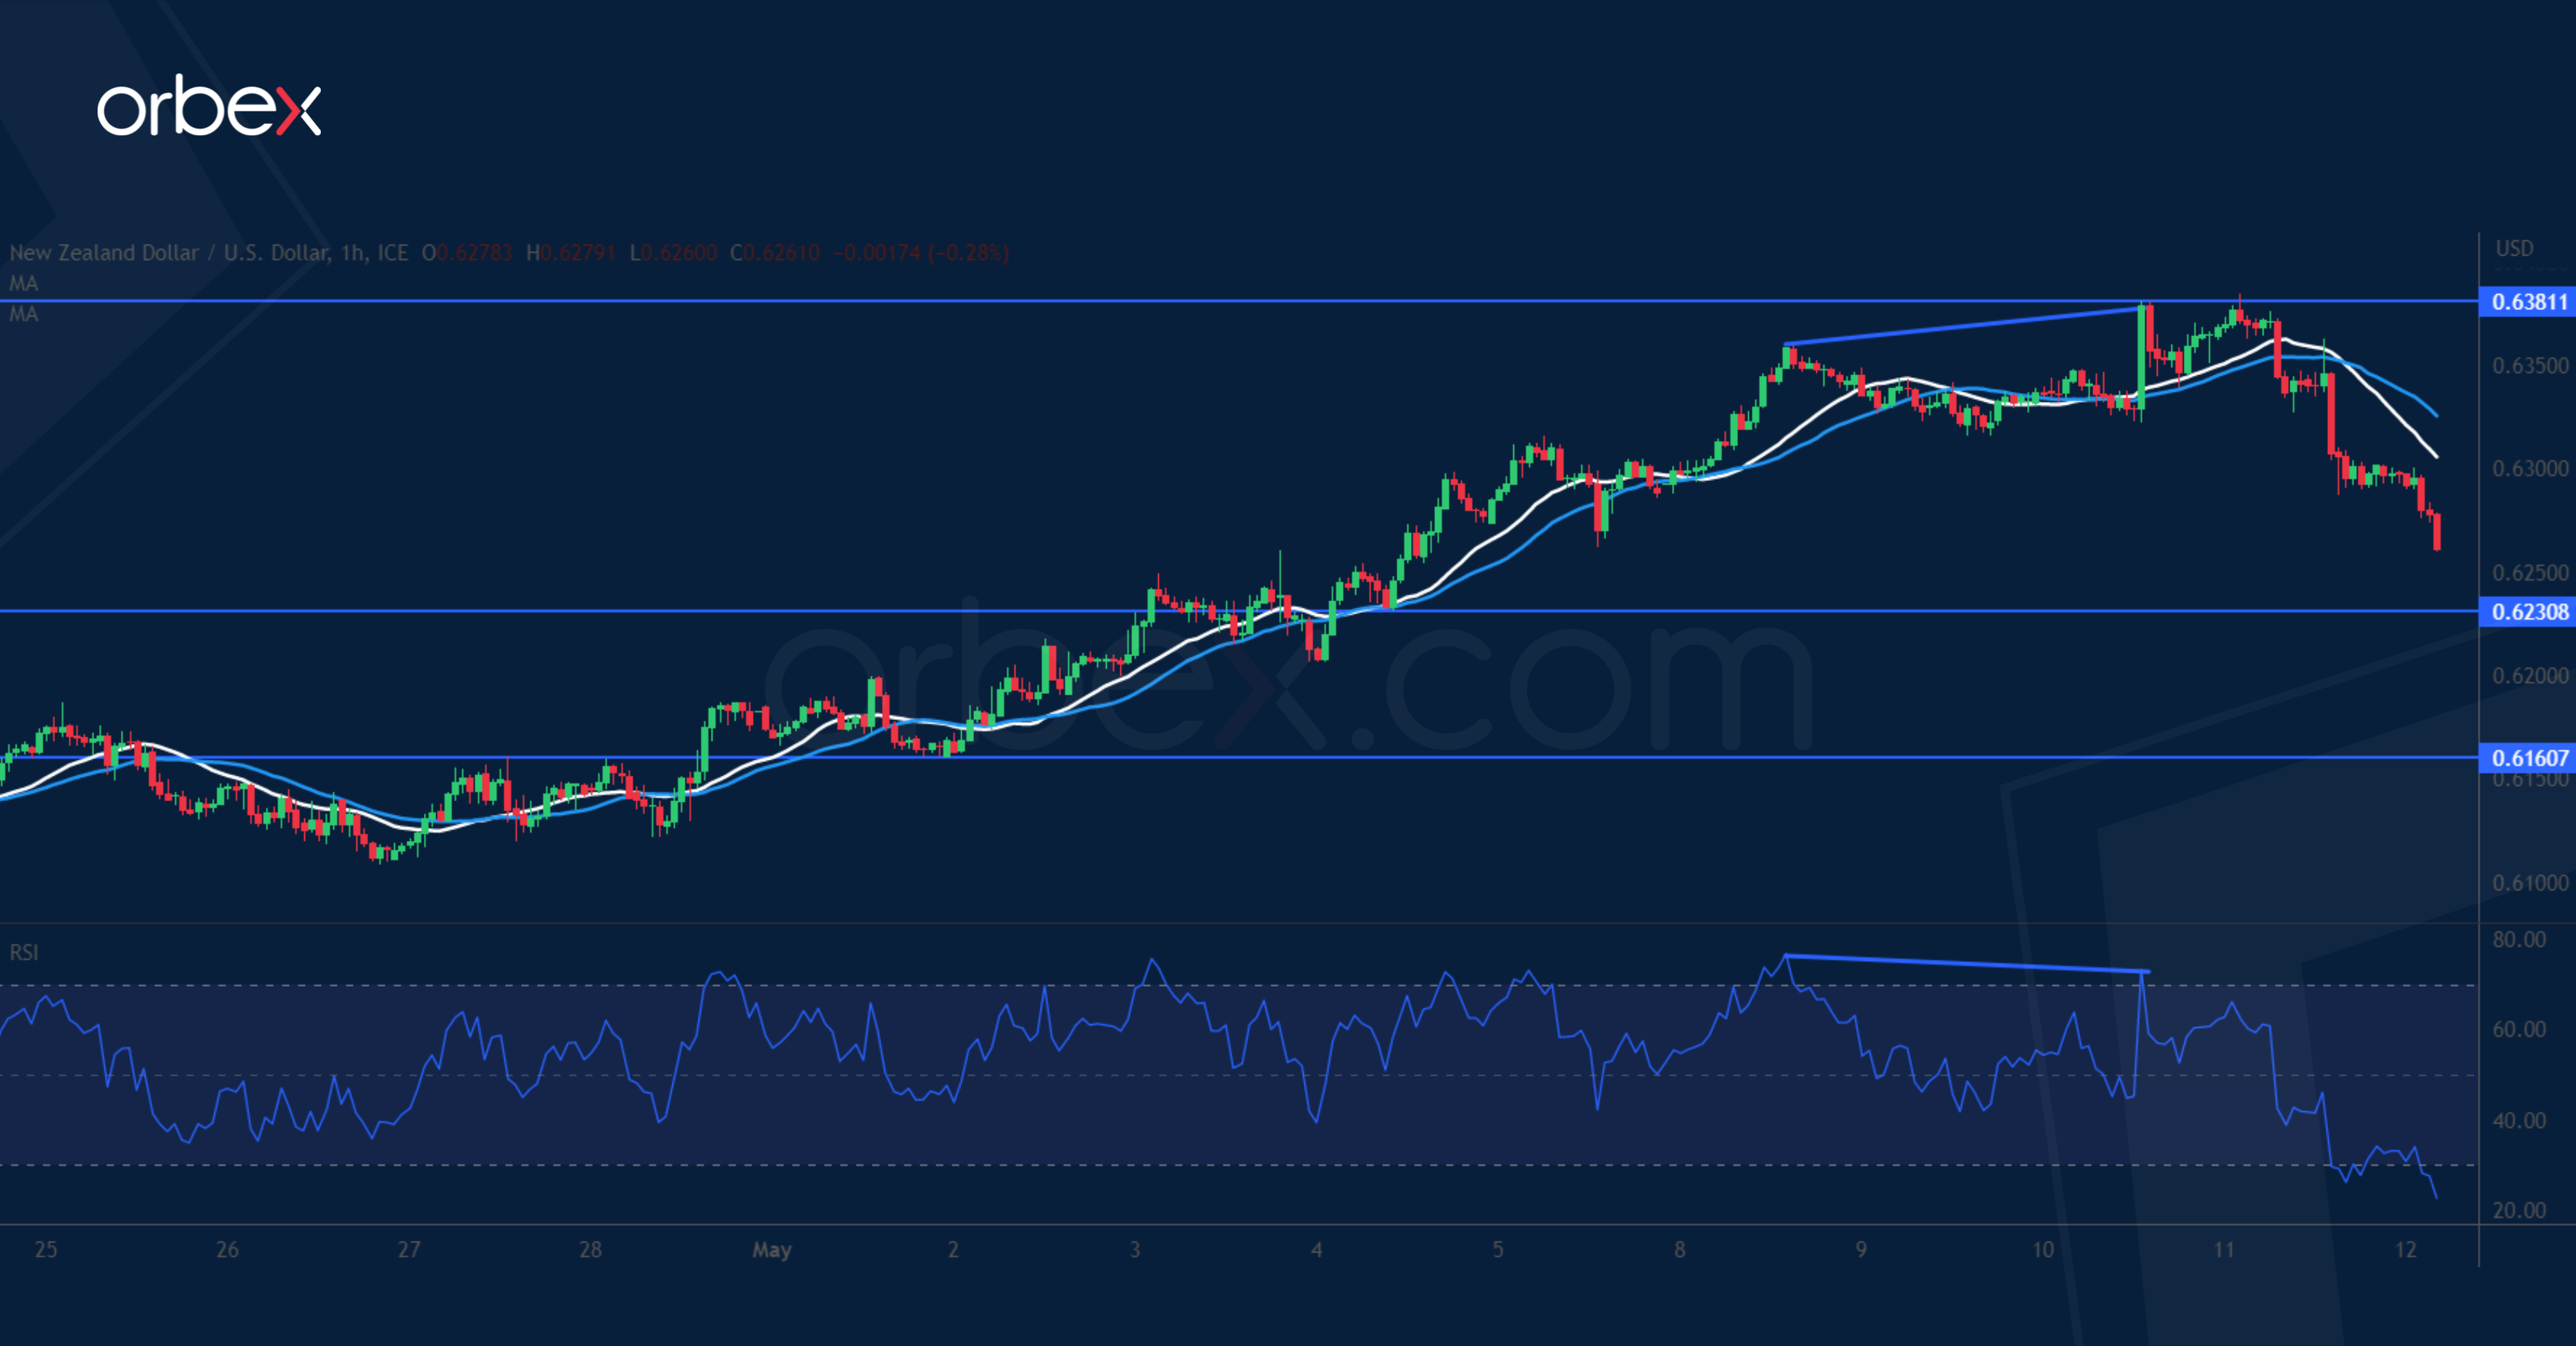
The New Zealand dollar fell as weak US economic data weighed on risk appetite. The pair is looking to hold on to its gains after a tentative break above the April spike of 0.6380. While sentiment might have turned bullish, the rally could be running out of steam in the short-term with a bearish RSI divergence indicating a loss of momentum. A break below the immediate support of 0.6320 would force leveraged buyers to bail out and trigger a correction. 0.6230 on the 20-day SMA is the next level to gauge buying interest.
NAS 100 grinds higher
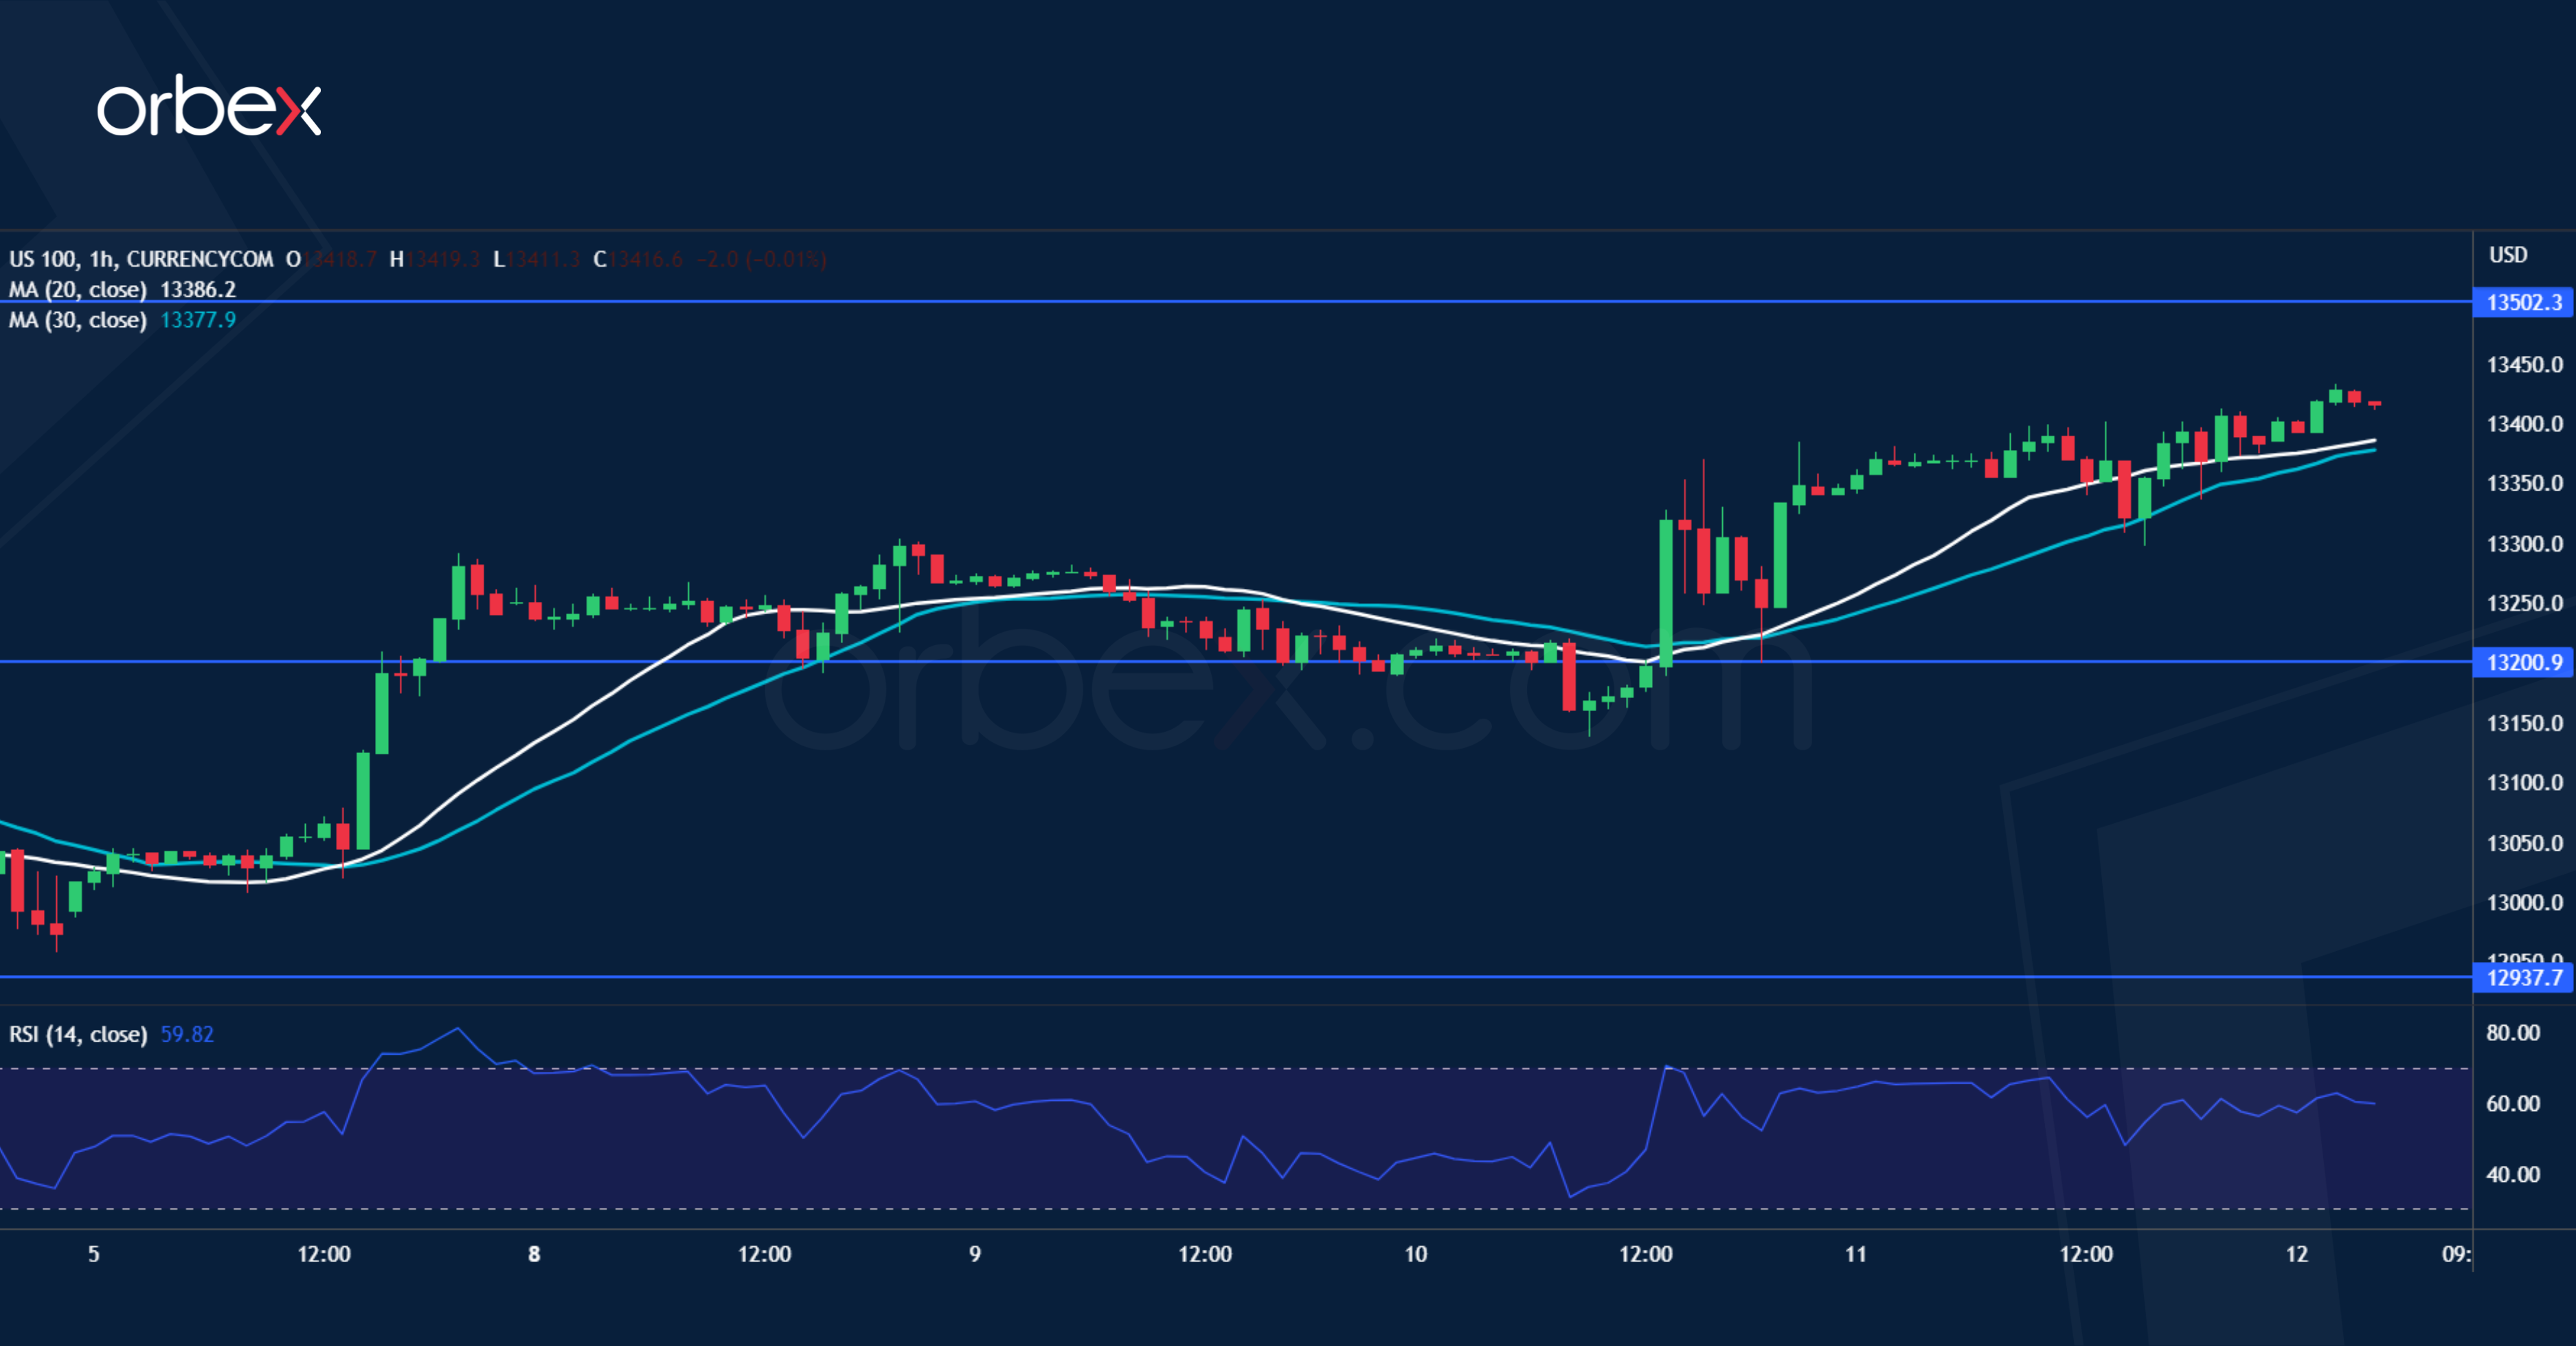
The Nasdaq 100 rallies as rising unemployment benefit claims raise hopes to halt further rate hikes. On the daily chart, the index continues to grind its way up along the 30-day SMA, a sign that the bullish bias is still intact despite some choppiness in the shorter time frames. Buyers have been eager to step in at pullbacks, resulting in fresh highs. After a break above the supply zone around 13300, 13200 has become a support level. A close above the intermediate level of 13500 would open the door to the August 2022 high of 13700.
Elliott Wave Forecast: Dollar Index ($DXY) Rally Should Fail
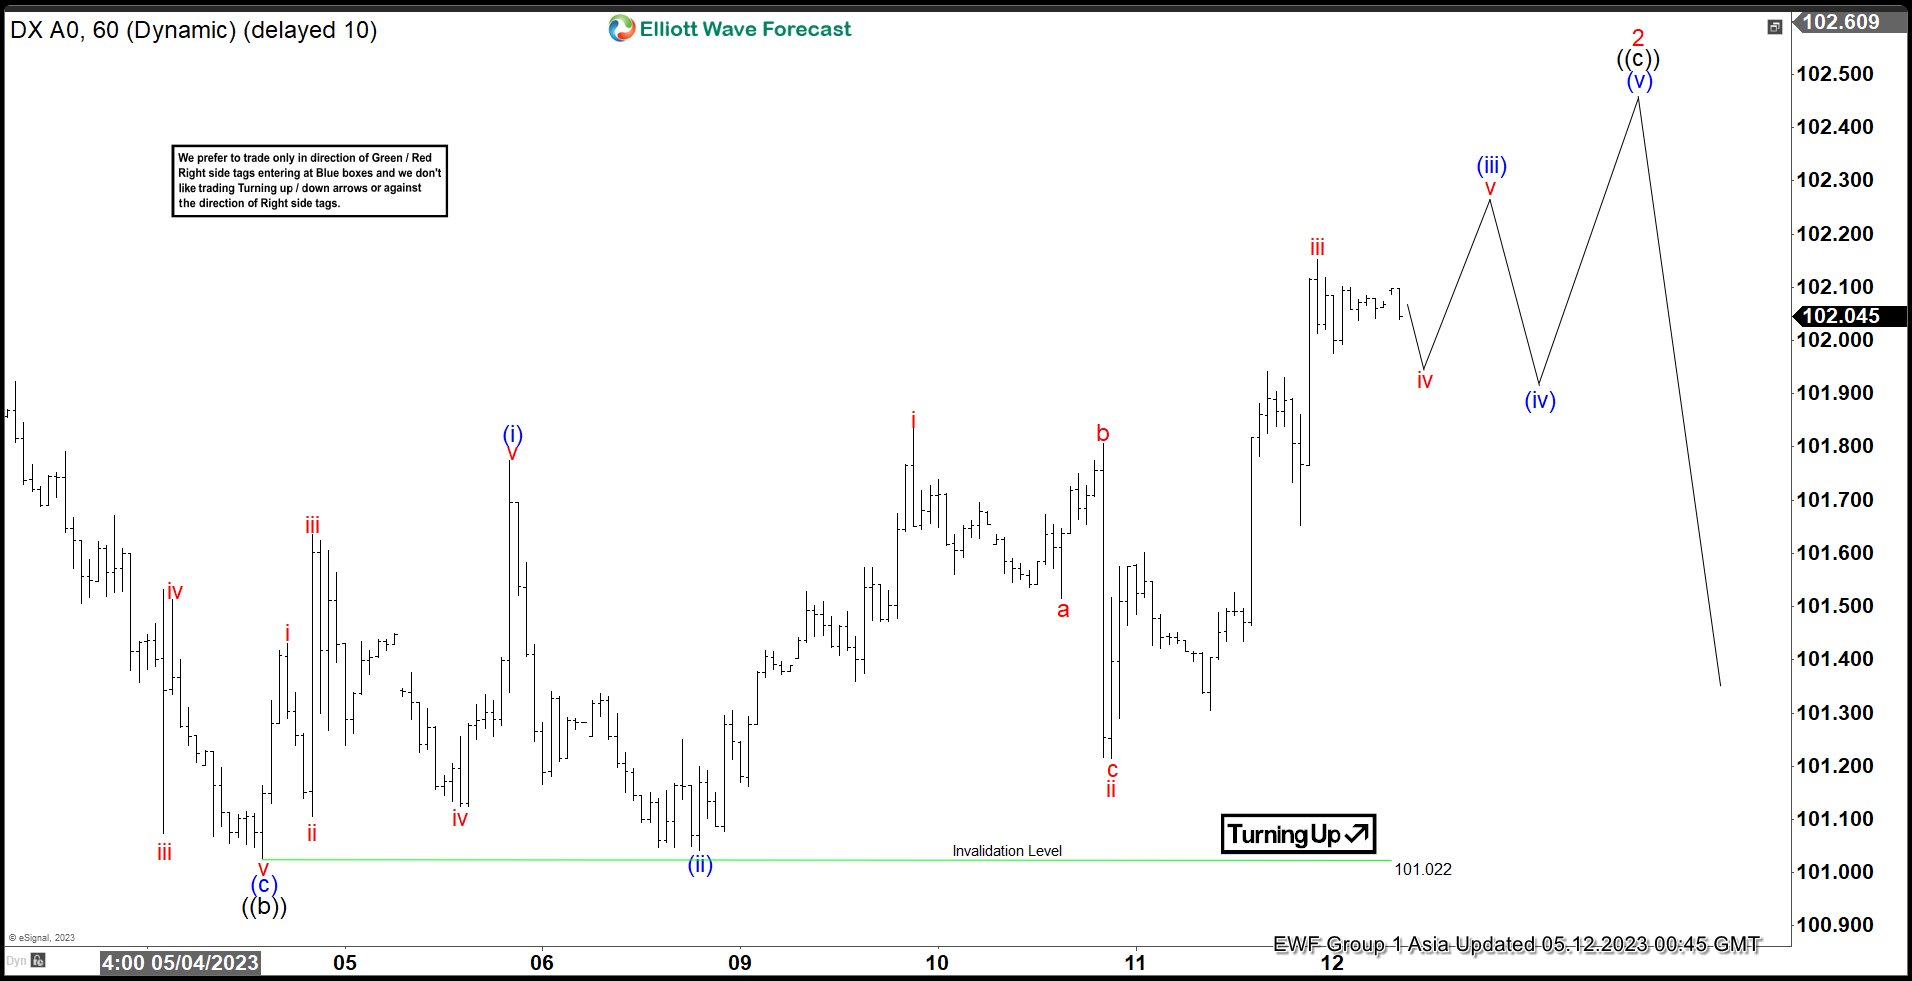
Short Term Elliott Wave View on Dollar Index ($DXY) suggests that the rally from 4.14.2023 low is in progress as a zigzag structure. Up from 4.14.2023 low, wave ((a)) ended at 102.23 and pullback in wave ((b)) ended at 101.02. The 1 hour chart below shows the starting point of wave ((b)). Index is now extending higher in wave ((c)) with internal subdivision as a 5 waves impulse. Up from wave ((b)), wave i ended at 101.43 and wave ii pullback ended at 101.1. Wave iii ended at 101.63, wave iv ended at 101.124, and wave v higher ended at 101.77. This completed wave (i) in higher degree.
From there the Index pullback in wave (ii) which ended at 101.04. The Index then extends higher in wave (iii) as an impulse. Up from wave (ii), wave i ended at 101.83 and pullback in wave ii ended at 101.21. Wave iii ended at 102.15, dips in wave iv ended at 101.97, and now the Index is looking to end wave v which should also complete wave (iii) in higher degree. Afterwards, Index should pullback in wave (iv) to correct cycle from 5.8.2023 low before it resumes higher again. Near term, as far as pivot at 101.02 low stays intact, expect dips to find support in 3, 7, or 11 swing for further upside.
Dollar Index ($DXY) 60 Minutes Elliott Wave Chart
$DXY Elliott Wave Video
https://www.youtube.com/watch?v=pBVxHwIe4xk
Cliff Notes: Budget Relief Delivered as Weakness in Consumption Crystalises
Key insights from the week that was.
This week, Australian Federal Budget 2023/24 gave the market a lot to consider regarding Australia’s outlook. Offshore, policy expectations remained the focus.
Beginning with Budget 2023/24, our bulletin and conversation with Chief Economist Bill Evans provides a full view of the Government’s fiscal position and economic expectations for the next four years. Most notable is the markedly improved starting point for Budget 2023/24, the strength of the economy delivering a $121.5bn windfall through to 2025/26. As a result, the profile for net debt has improved notably, the peak now forecast at 24% of GDP in 2025/26 compared to 28.5% of GDP in October’s Budget 2022/23. The Budget’s spending measures were focussed on cost-of-living relief – including an increase in rental subsidies and a reduction in energy bills for vulnerable households – alongside additional spending on welfare programs and essential services, particularly health and aged care.
Regarding monetary policy, we believe the budget will have little influence on the RBA’s assessment of the economy, at least for the remainder of the year. While cognisant of the medium-term risks around the expansionary nature of the budget, the Board will be focussed on near-term developments for underlying inflation and the labour market. Our central view is a clear downtrend in inflation and gradual easing in labour market tightness as a consumer-led slowdown in growth materialises, warranting policy to remain on hold though 2023 before rate cuts commence in 2024. However, if inflation risks were to assert, the timing of 2024’s rate cuts may need to be pushed out.
The latest NAB business survey was consistent with our baseline view, highlighting a further easing in business conditions – particularly across consumer sectors – as inflation and interest rate pressures impact. Also, following a 0.3% fall in Q4, real retail sales posted a larger 0.6% decline in Q1, thereby marking the largest six-month contraction in retail sales volumes since 1986 (excluding COVID and the GST’s introduction). Our Westpac Card Tracker has also shown that wider consumer spending activity is stalling, emphasising the broad-based nature of these headwinds. Additionally, the underlying weakening in dwelling approvals indicates that the recent stabilisation in house prices will take time to cycle through to new construction activity.
Of greatest importance offshore this week was the April CPI report for the US. Both the headline and core readings were in line with expectations (0.4% for the month and 4.9%yr/5.5%yr respectively over the year). Critical though was the detail. The all-important shelter component continued to slowly slip away from its peak level. Meanwhile, food prices were unchanged for a second month, suggesting the secondary impacts of commodity inflation have passed and also that wages are not driving another wave of abnormal price increases by business. Overall, goods inflation is now a benign force, with goods ex food & energy up just 2.0%yr in April. Ex shelter, a similar judgement can be made for services. We therefore regard US inflation as on track to return to a 2.0% annualised pace towards the end of this year, providing the FOMC with scope to ease policy, beginning with a 25bp cut in December.
This will just be the start however, with need for 200bps of further easing through 2024 – in our view. By 2024, the pullback in bank lending and tightening of standards we are beginning to see in the credit data and senior loan officer survey respectively will be having its full effect on the economy. Most notably, the just released April Senior Loan Officer Survey reported a tightening in lending standards and increase in spreads over banks’ cost of funds similar in breadth to that seen during the pandemic, GFC and 2000-01 tech wreck.
It is important to emphasise though that this survey reports on the percentage of respondents taking action (e.g. tightening standards) not the scale of the change; ergo, the effect of this tightening on the supply of credit is unlikely to be as significant as that seen during the GFC.
A caveat applies however, as the Senior Loan Officer Survey only captures a subset of banks, with 65 domestic banks reporting in this instance. The qualitative guidance by bank size makes clear that the complete market is likely experiencing tighter conditions and weaker lending than the survey implies, with the results for mid-sized and small banks notably worse than for large banks.
Following last week’s FOMC and ECB decisions, this week the Bank of England (BoE) followed suit, delivering a 25bp hike to 4.50% at their May meeting. As anticipated, their guidance was somewhere between the FOMC and ECB, but still best characterised as a conditional pause. Conditioned on the market path for rates, which includes a brief lift in Bank Rate to 4.75% from August 2023 to March 2024, the BoE continue to expect elevated inflation to give way this year and next, with a year-end forecast of 5.0% for 2023 and 2024 average of 2.25% followed by below-target inflation in 2025. This steady return to target is despite recent upside surprises for goods inflation (including highly-elevated food inflation) and a material upward revision to growth expectations, with recession no longer anticipated in 2023. Given available data and in light of the BoE’s revised projections, while there may be need for another hike mid-year, the BoE seems highly likely to be in a position to cut interest rates by mid-2024, following a similar path to both the FOMC and ECB.
Finally to China. While the trade balance surprised to the upside in April, the market took the report negatively given it included a sharp annual drop in imports, -7.9%yr, and as the upside surprise to annual export growth, 8.5%yr, was viewed as masking short-term weakness. Seemingly missed by participants was that the trade breakdown by country continued to show the strength of Asian demand, with the surplus from the region materially higher than a year ago. For our growth view, this is critical as we hold that accelerating growth in Asia will largely offset the negative effect of weak developed-world demand. Also critical is that Chinese manufactured goods demand is increasingly satiated by Chinese supply. Both factors will allow the trade position to hold up for the remainder of the year.
We were also unconcerned by the weak price detail announced this week. However, we are carefully watching the credit data. New loans and aggregate finance were both weak in April after a strong March. For investment growth to hold up, the private sector have to be willing to expand capacity. We believe they will, but there are risks around the timing and scale of growth.
BoE Not Done Fighting Inflation
Market movers today
The US releases consumer confidence from University of Michigan for May, where the most interesting part is the inflation expectations. They rebounded in April and are still at a quite high level for the Fed's comfort. If they resume the downward trend from the earlier this year it will likely be supportive for bonds and equities.
Focus is also on US debt talks, where there seems to be some progress, as well as the news on the US banking sector.
In the Nordics, Norway releases Q1 GDP and monthly GDP for March.
The 60 second overview
Bank of England. In line with our expectation, the Bank of England (BoE) hiked policy rates by 25bp, bringing the Bank Rate to 4.50%. The majority of the Monetary Policy Committee (MPC) voted for an increase of 25bp as they deemed it "important to continue to address the risk of more persistent strength in domestic price and wage setting". The updated inflation projections showed that the BoE has revised its inflation projections higher across the forecast period, now expecting inflation to reach its 2% target in 2025, a year later than previously expected. EUR/GBP initially moved slightly lower but fully retraced the move during the press conference ending the day above 0.87. With both growth and domestic inflation having surprised to the topside and given BoE's message today, we pencil in an additional 25bp hike in June 2023, bringing the terminal rate up to 4.75%, Bank of England Review - A data dependent approach, 11 May.
Markets: Markets were generally in a risk-off mode, which drove demand for safe-havens. European and US equity markets generally closed lower. In the US, there were renewed concerns about the health of the regional banking sector as PacWest shares dropped 23%. The USD broadly appreciated in the G10 space, while oil and gold fell. This morning Asian equity markets are trading mixed.
Norway. We expect that Norwegian mainland GDP was slightly negative in March, suggesting zero growth for Q1 overall. Consumer spending is kept aloft by the consumption of services, while mainland investments have likely started to fall. If our take on this is correct, the situation will be marginally better than what Norges Bank assumed in its monetary policy report in March (minus 0.1% q/q), meaning that it will have a negligible effect on the rate decisions going forward.
Equities: Equities were little changed to lower on Thursday. At least for everything but growth and quality. Big tech was higher with communications and consumer discretionary among the winners. Hence, Nasdaq closed up 0.3% vs S&P 500 -0.2%. Somewhat worrisome is that regional banks have continued to sell off this week, with S&P 1500 regional bank index down another -3% yesterday. This takes regional banks to a new year-low. Futures are a tad higher this morning.
FI: Global bond yields declined on the back of softer US economic data as well as continued uncertainty regarding US regional banking sector and the US debt ceiling. Hence, the risk of recession in the US economy is rising. The bond market rallied from the long end and we saw a bullish flattening of the US Treasury curve and the German Bund curve. 10Y US Treasuries dropped some 5bp, while Bunds dropped 7bp.
FX: EUR/USD declined towards the 1.09 mark on the back of a broad USD appreciation yesterday. In line with our expectation, the Bank of England (BoE) yesterday hiked policy rates by 25bp. EUR/GBP initially moved slightly lower but fully retraced the move during the press conference ending the day above 0.87. Scandies saw renewed headwinds with EUR/NOK breaking above 11.60 and EUR/SEK close to the 11.30 mark.