

Sample Category Title
USD/CAD Holds Support But Can It Recover?
Key Highlights
- USD/CAD declined heavily and tested the 1.3330 support.
- A key rising channel is forming with support near 1.3350 on the 4-hour chart.
- EUR/USD is trading above the 1.0950 support and might climb higher.
- The BoE interest rate decision is scheduled today (forecast 4.5%, versus 4.25% previous).
USD/CAD Technical Analysis
The US Dollar started a strong decline from the 1.3640 zone against the Canadian Dollar. USD/CAD traded below the 1.3480 level to move into a bearish zone.
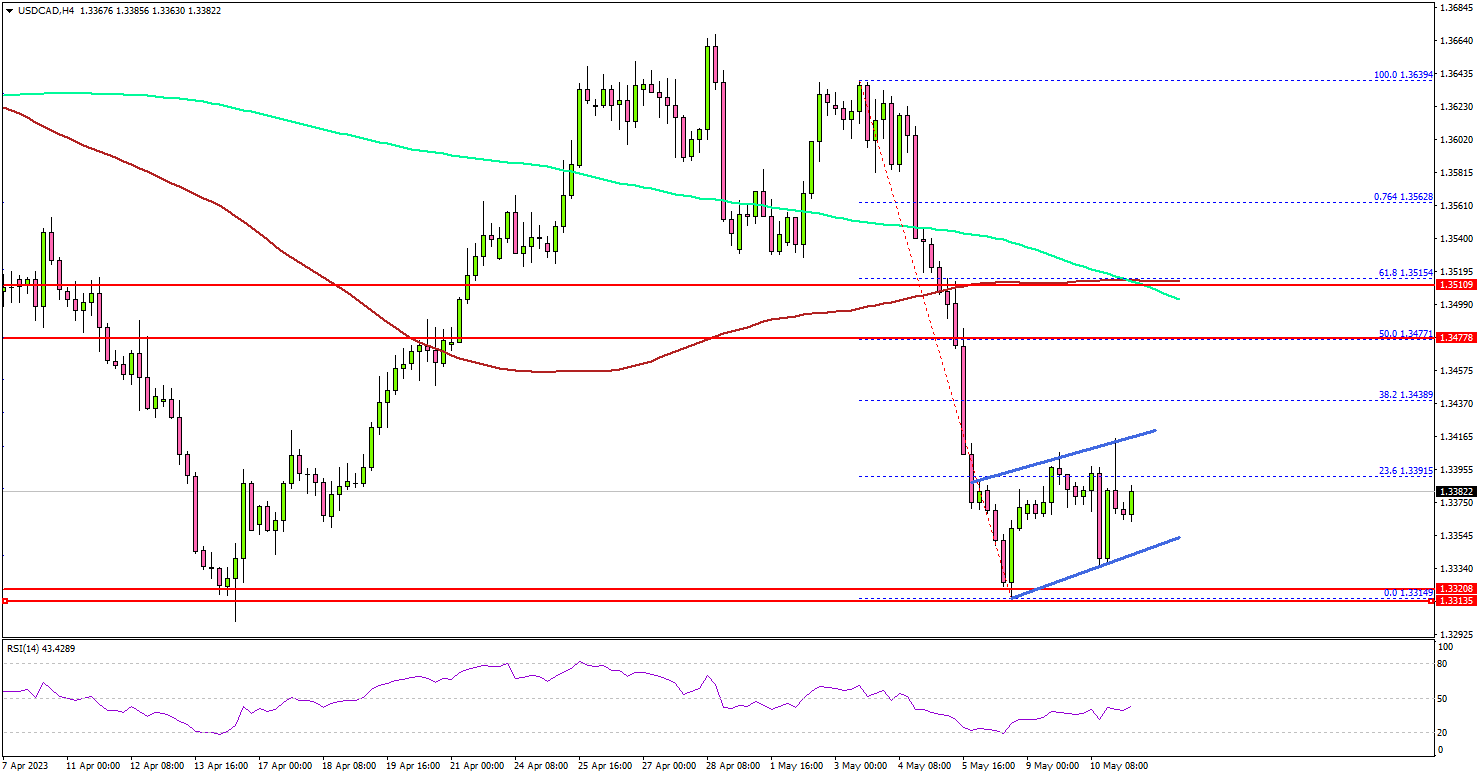
Looking at the 4-hour chart, the pair settled below the 1.3400 level, the 100 simple moving average (red, 4 hours), and the 200 simple moving average (green, 4 hours).
Finally, the bulls took a stand near the 1.3330 support. A low is formed near 1.3314 and the pair is now consolidating losses. There is also a key rising channel forming with support near 1.3350 on the same chart.
Immediate resistance on the upside is near the 1.3420 level. The next key resistance is near the 1.3450 level. The main resistance sits near 1.3480 and the 100 simple moving average (red, 4 hours).
A clear upside break and close above the 1.3480 resistance might start another steady increase. The next key resistance is near the 1.3550 zone. Any more gains might send the pair toward 1.3640.
On the downside, the pair might find bids near 1.3340. The next major support is near the 1.3320 level. If there is a downside break below the 1.3420, the pair could test the 1.3250 level.
Looking at EUR/USD, the pair is still trading in a positive zone above 1.0950 and might attempt a fresh increase in the near term.
Economic Releases
- BoE Interest Rate Decision - Forecast 4.5%, versus 4.25% previous.
- US Initial Jobless Claims - Forecast 245K, versus 242K previous.
CADJPY Wave Analysis
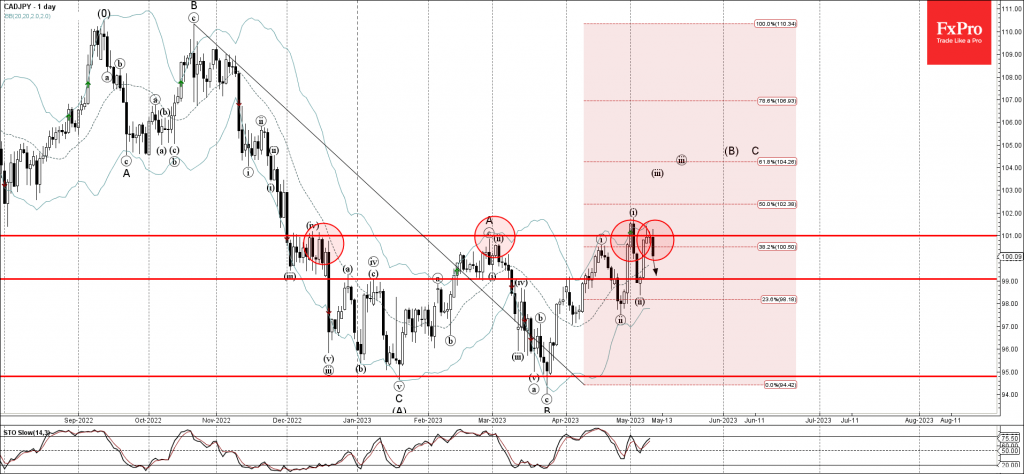
- CADJPY reversed from pivotal resistance level 101.00
- Likely to fall to support level 99,00
CADJPY earlier reversed down once again from the pivotal resistance level 101.00 (which has reversed the pair multiple times from December), strengthened by the upper daily Bollinger Band.
The downward reversal from the resistance level 101.00 stopped the previous impulse wave C.
Given the bearish divergence on the daily Stochastic, CADJPY can be expected to fall further toward the next support level 99,00.
USDCAD Wave Analysis
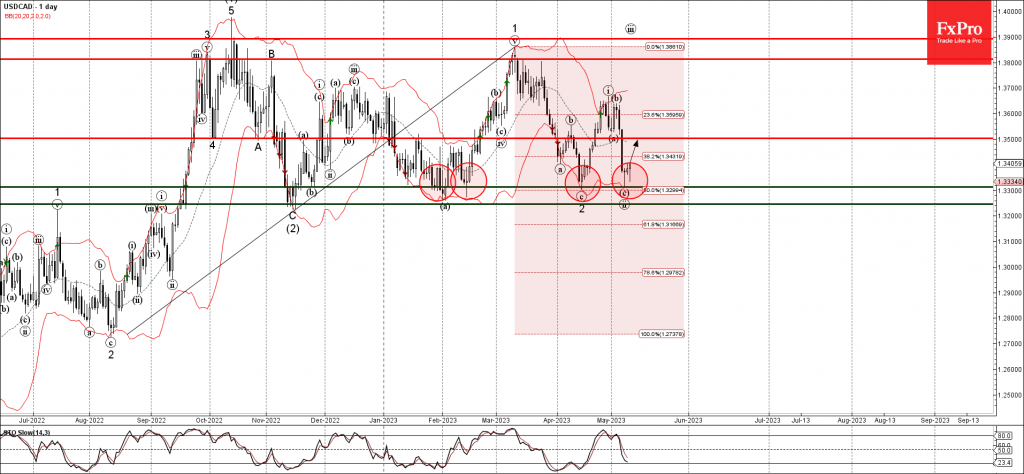
- USDCAD reversed from support level 1.3310
- Likely to rise to resistance level 1.3500
USDCAD recently reversed up from the key support level 1.3310 (which has been steadily reversing the price from November).
The support level 1.3310 was further strengthened by the lower daily Bollinger Band and by the 50% Fibonacci correction of the upward impulse from August.
Given the bullish divergence on the daily Stochastic, USDCAD can be expected to rise further toward the next resistance level 1.3500.
Pound Swings After US Inflation Ticks Lower
- US inflation ticks lower to 4.9%
- BoE expected to raise rates by 25 bp on Thursday
US inflation dips lower
The US inflation report for April showed a very small decline. Headline CPI ticked lower to 4.9%, down from 5.0% in March and the consensus estimate of 5.0%. The core rate eased to 5.5%, matching the consensus estimate and a drop below the March reading of 5.6%. On a monthly basis, headline CPI rose from 0.1% to 0.4%, matching the consensus estimate. The core rate was unchanged and also matched the consensus estimate.
The inflation report indicated that inflation remains stubbornly high and the disinflation process is moving at a snail’s pace. The Fed has managed to curb inflation significantly, but it seems that bringing inflation down to the 2% target will be tricky and one or two more rate hikes will not achieve that target.
BoE expected to raise rates
The Bank of England holds its meeting on Thursday and is expected to raise rates by 25 basis points to 4.50%. The BoE’s fight against inflation hasn’t gone according to plan, as inflation is hovering above 10%. Still, the BoE remains optimistic and has projected that inflation will fall rapidly in the second half of the year. The BoE’s tightening has exacerbated the cost-of-living crisis and policymakers are looking to provide some relief by winding up the current rate-tightening cycle with a final rate hike either on Thursday or at the June meeting.
GBP/USD Technical
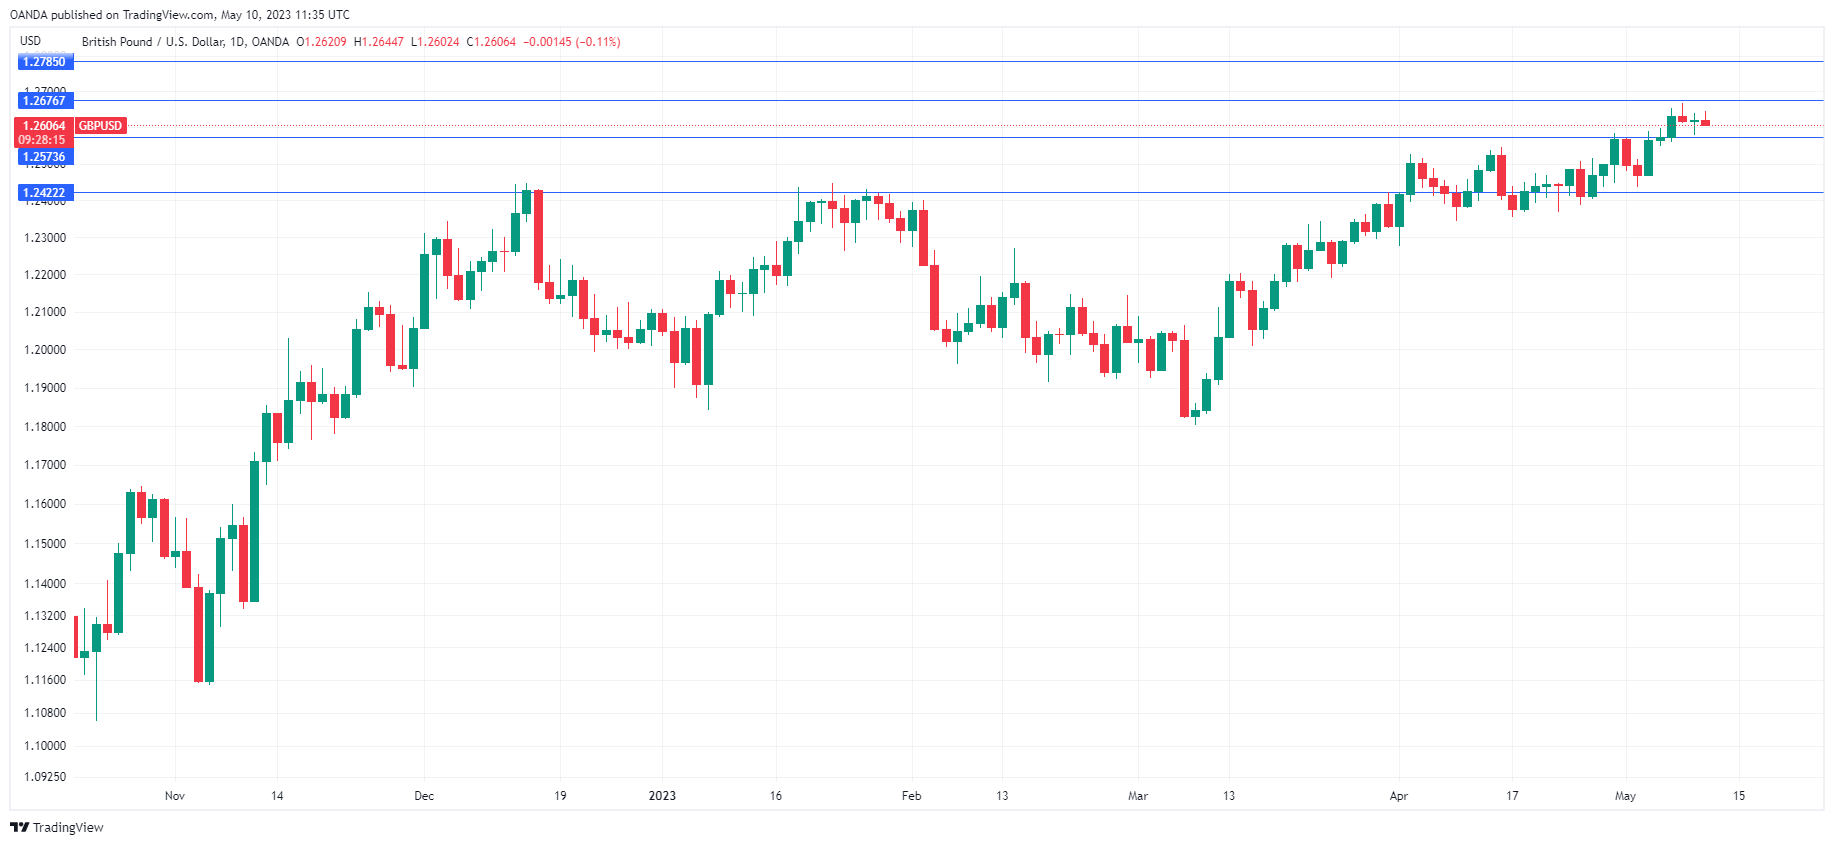
- There is resistance at 1.2676 and 1.2785
- 1.2573 and 1.2495 are providing support
Will Gold Continue Conquering Uncharted Territories?
With investors remaining convinced that the Fed will start cutting interest rates at some point later this year, US Treasury yields and the dollar have stayed subdued, which combined with concerns surrounding the banking sector and the US debt ceiling, allowed gold to hit a new record high on Thursday, before strongly pulling back on Friday. Will the precious metal rebound and extend its uptrend into new uncharted territories or is Friday’s retreat a sign that the uptrend is running out of fuel?
Gold hits record high after Fed pause hints
At last week’s FOMC decision, policymakers delivered the broadly anticipated 25bps hike, but they watered down their forward guidance. They removed the part saying that some additional policy firming may be appropriate and instead said that in determining whether more hikes may be needed, they will consider the cumulative tightening of monetary policy, the lags with which policy affects the economy and inflation, and incoming economic and financial developments.
The softening of forward guidance pushed the US dollar lower initially, but the currency found some footing during Powell’s press conference, perhaps as he refused to close the door to a June hike. Having said that though, it was all south for the greenback thereafter as market participants were convinced that a pause is the most likely outcome for June. Just the next day, gold managed to hit a new all-time high at $2,072.19, surpassing its previous record hit in August 2020.
The best safe haven in town
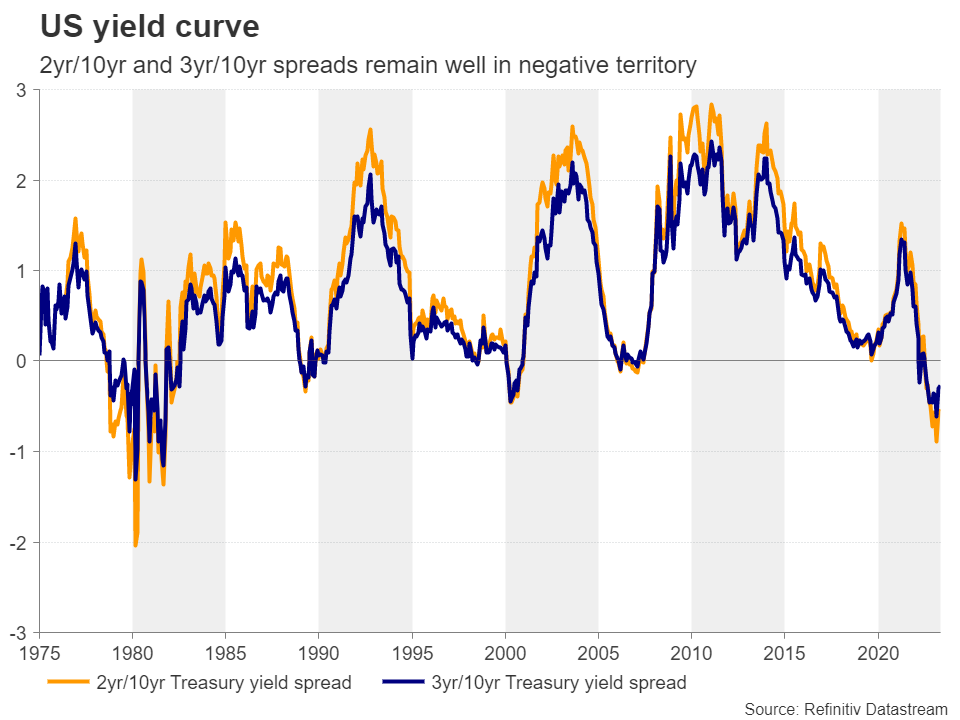
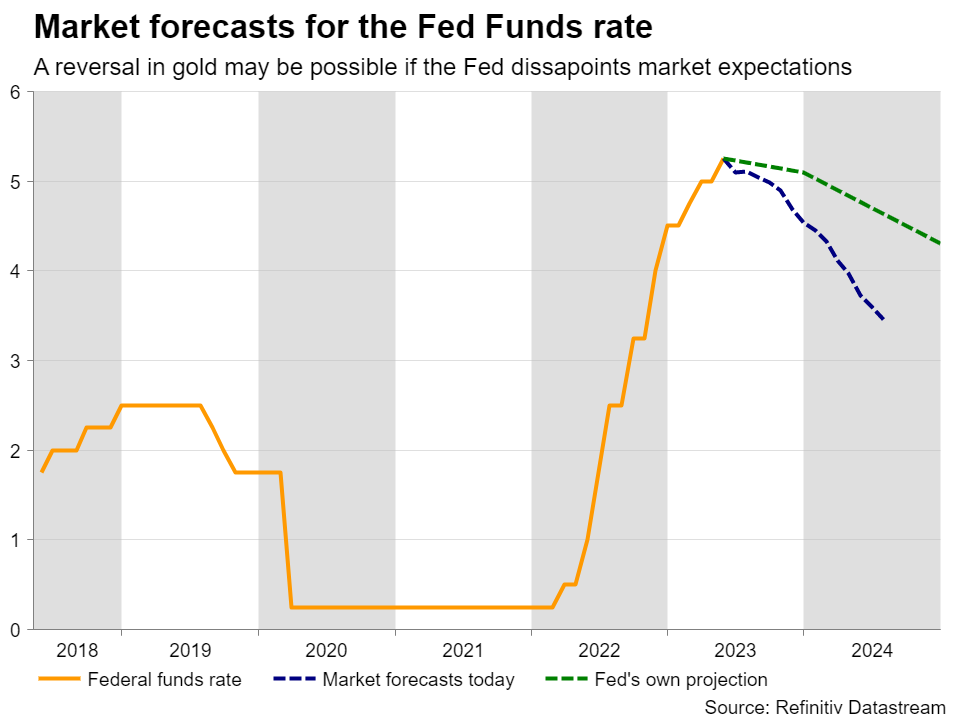
Now investors are pricing in nearly 65bps worth of rate reductions by the end of the year, with the first quarter-point cut almost fully baked in the cake for September. This suggests that investors remain fearful that the Fed’s aggressive tightening could still throw the US economy into recession, and this is also evident by the inverted yield curve, where both the 2yr/10yr and 3yr/10yr spreads remain well in negative territory after hitting their lowest levels since 1981.
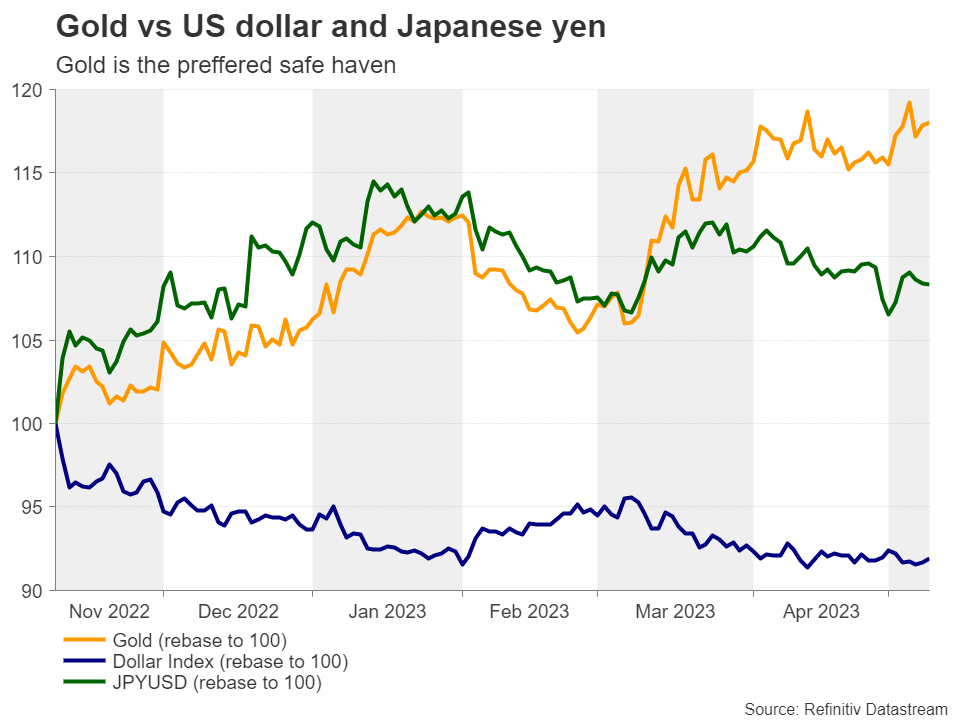
Yes, equities have remained relatively supported, but this may have been due to expectations of lower interest rates resulting in higher present values for high-growth firms. Gold is reflecting investors anxiety much better, as the steep rally to a new record high points to more bullish forces than just a weak US dollar. With Treasury yields coming off their October highs due to Fed cut bets, and the BoJ still not deciding on another step towards normalization, the US dollar and the Japanese yen seem to have forgotten their safe-haven suits in the closet. Currently, the precious metal may be the only choice for those looking for safety.
For how much longer will it keep shining?
However, the big question nowadays may be: For how much longer can the precious metal continue to shine? In its simplest form, the answer is: Until the dynamics that paint the bright picture begin to change. For example, even if the market continues to ignore the Fed’s warnings that no cuts are warranted this year, that cannot last forever. A June hike and/or keeping interest rates untouched beyond September – when the first cut is expected – could very well upset current expectations and trigger a rally in Treasury yields and the US dollar, which is a negative blend for gold. And if this is accompanied by better-than-expected US data that dismiss recession worries, the precious metal could lose more allure.
Friday’s employment report for April came in strong and the Fed’s loan survey on Monday eased fears of a credit crunch, but the yield curve inversion is far from suggesting that the concerns about the future of the US economy have totally vanished. The ongoing stalemate in the US Congress over raising the debt ceiling is also a viable reason for staying cautious, while traders may be worried regarding other economies as well, like China, where last week’s disappointing PMIs suggested that after the post-reopening boost, the engines of the world’s second largest economy are now struggling to gather momentum. Thus, for now the outlook of the precious metal likely remains positive, at least for another month or two.
Technical picture still points to uptrend
From a technical standpoint, despite pulling back after hitting a new record high, gold remains above both its 50- and 200-day exponential moving averages (EMAs), as well as above the tentative uptrend line drawn from the low of November 3. This keeps the prevailing uptrend intact.
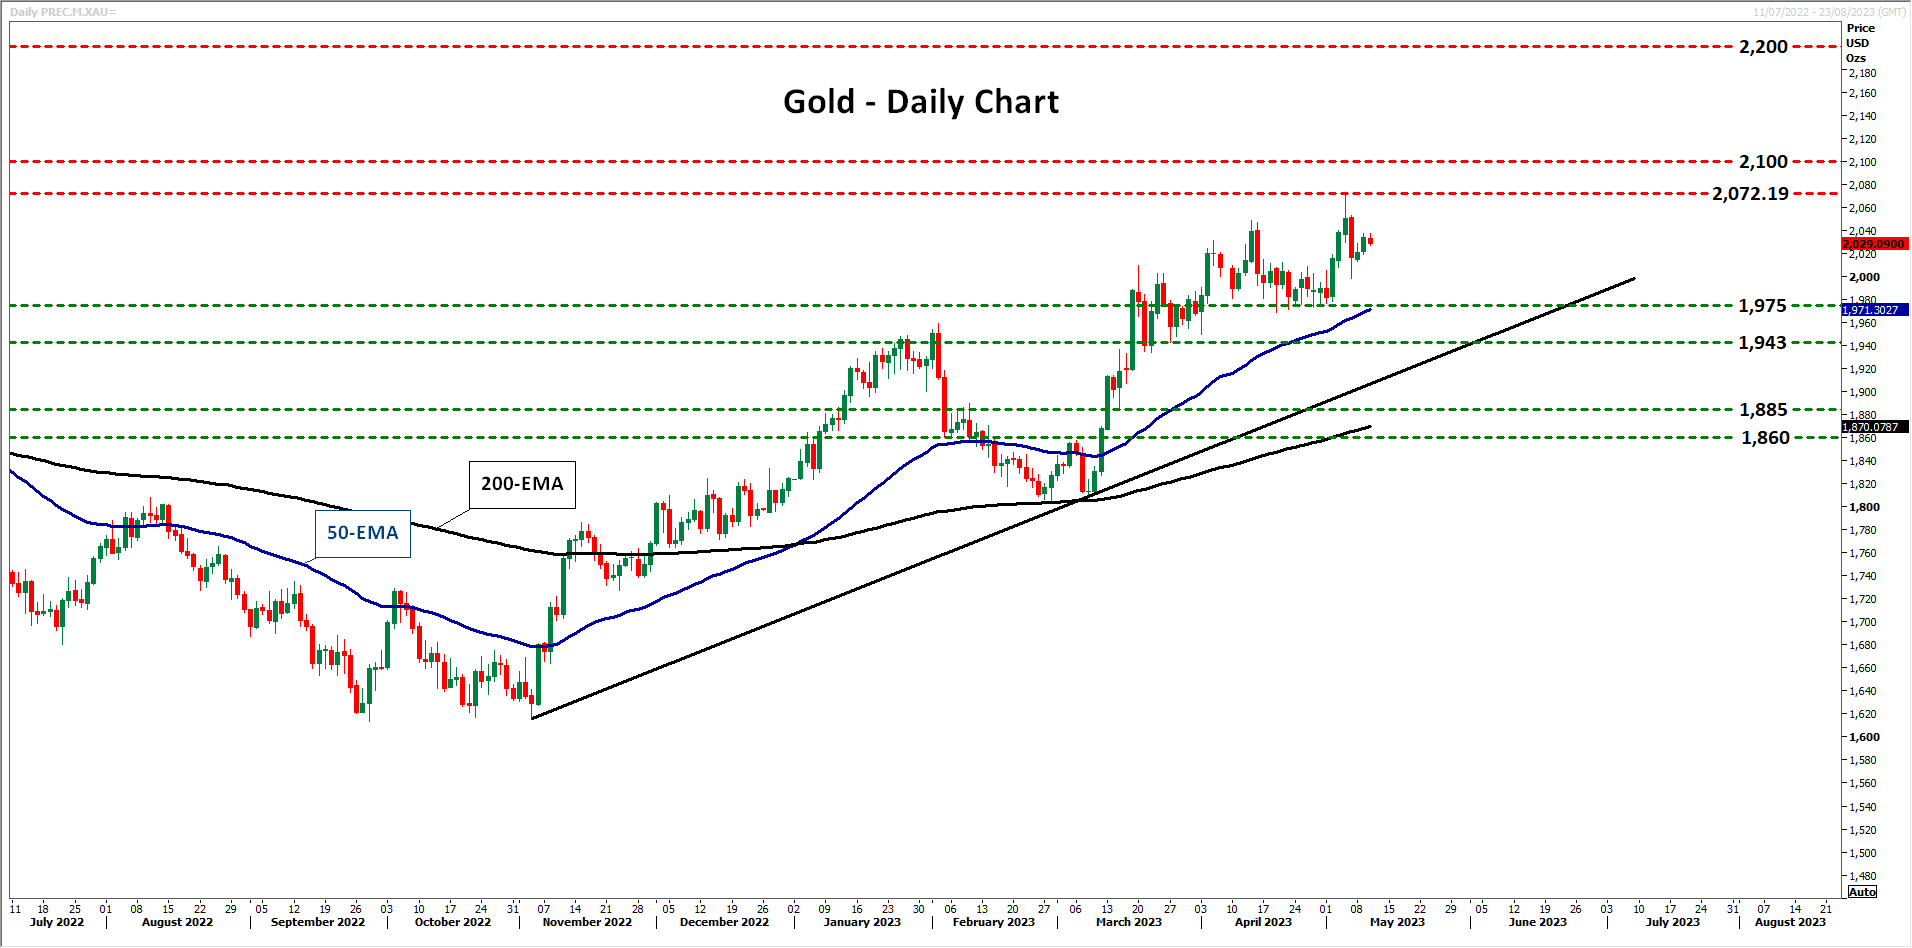
If the bulls are strong enough to regain control from above the strong support zone of $1,975, they may be able to reach and breach the record of $2,072.19, entering uncharted territory. With no prior highs or inside swing lows to mark new resistances, a wise choice may be to mark round numbers like $2,100 and $2,200.
On the downside, the move signaling that the bears may have stolen all the bulls’ swords may be a decisive dip below the $1,943 barrier, marked by the low of March 27. Such a slide may also signal the break below the aforementioned uptrend line and perhaps pave the way towards the low of March 15 at $1,885.
BoE Expected to Hike, Then What?
The BOE is the last of the major banks hiking this cycle, and the expectation is that it will follow its peers - with a twist. Last week, the ECB and the Fed both hiked by a quarter of a point, but then implied that further rate hikes would be data dependent. The ECB bias was for another hike, the Fed for a pause; but both left the door wide open for this being the top of the rate hiking cycle.
The BOE, on the other hand, is facing persistently high inflation and likely doesn't have the luxury to imply it's at the terminal rate. The latest report showed inflation in the double digits, while the BOE had forecast that inflation would come down precipitously during the last quarter.
Patience is running out
The BOE might have been the first to start hiking, but its plodding pace of hikes have apparently let inflation keep rising. Unlike the ECB and Fed, where rate decisions votes have been unanimous, the vote from the BOE to keep up the pressure on inflation has been divided. The current theory among central bankers is that it's the expectation for lower inflation that drives down prices.
The theory argues that central banks need to have the "credibility" to fight inflation, which means that market makers have confidence that the necessary rate hikes will happen. A disunited front, and vacillating vote counts, can be seen as hurting that sense of commitment to bring prices down. At least some analysts and traders are likely to be looking at the split vote as a sign that the BOE won't raise rates high enough, or will bring them down too soon, to keep prices in check.
What to expect
With a unanimous expectation that the BOE will hike by 25bps, the focus is likely to be on the vote split. MPC members Tenreyo and Dhingra have consistently voted against raising rates, arguing that dealing with the economy should be the first priority. If other members were to join in, with a 3-6 split, then investors might take it as a sign that the BOE is about to give up on its slow rate hiking path. That could substantially weaken the pound.
Barring this occurrence, the BOE is expected to reiterate its stance that more policy action might be necessary to calm inflation. The forecast for price growth outlook is likely to be updated, but for many traders, that might be just the BOE catching up with reality, and unlikely to change market expectations.
Breaking stagflation
With high inflation and near-zero growth, the UK is in a particularly difficult position for policymakers: Stagflation. Traditionally, the only way to break out of that is through some kind of recession, either induced by monetary policy to bring down inflation, or a credit crisis driven by high inflation.
The BOE's refusal to pick either of those options can be seen as trying to kick the can down the road to where it will be an even bigger problem. For traders, however, it means cable is likely to remain under pressure, unless Bailey surprises with some extra degree of hawkishness.
Gold Needs Correction Before Another Leg Up
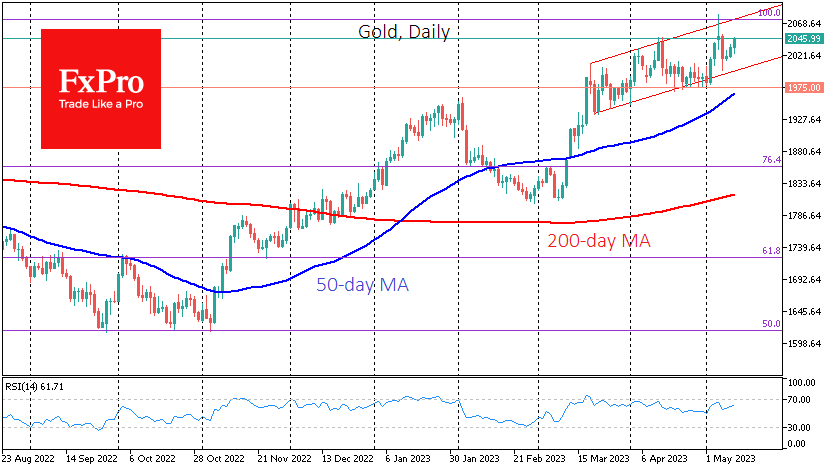
Gold showed very high volatility on Thursday and Friday, rising to $2081 and falling below $2000 in less than 48 hours. However, the price remained within the uptrend that has been in place since the second half of March.
The sharp rise and fall in gold at the end of last week had a close inverse correlation with US regional banks. Their problems triggered a short squeeze after the close of the regular session on Wednesday. However, the rapid recovery of the banks on Friday caused a sharp pullback.
Banks, by their very nature, are vulnerable to public sentiment. And from that point of view, the outflow of deposits from regional banks will likely stop with outside intervention, so the list of bankruptcies is still being determined.
The much more difficult question is whether gold will continue to be in demand of bad news about banks. The gold rallies on the convulsions of regional credit institutions were more about a liquidity crisis, and gradually capital may flow back into dollar-denominated debt assets, which are currently offering impressive yields.
However, it is worth taking a step back to realise that the banks’ problems are not the only driver for gold. Investors should also bear in mind the trend towards increasing purchases of gold as a reserve by emerging market central banks, which are also exposed to the risk of being hit by US or EU sanctions that block settlement in dollars and euros.
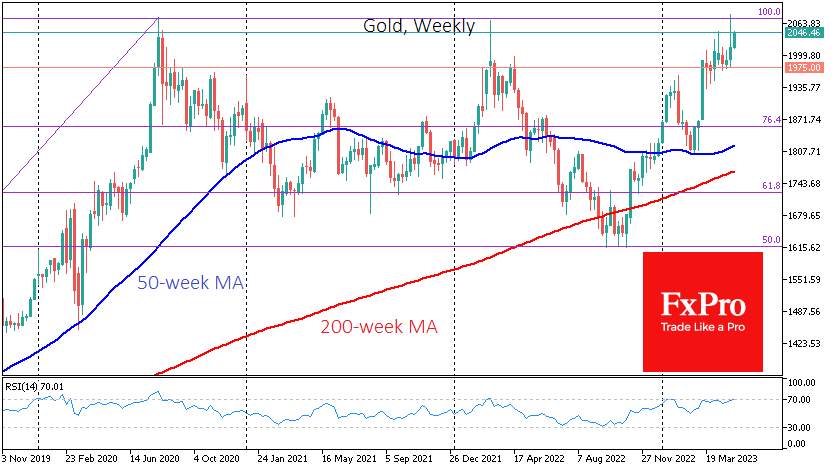
We also noted earlier a strong technical disposition in gold, whose price is approaching historical highs much more smoothly than in 2020 or 2022, leaving more strength for a breakout.
An important bullish signal for gold could be a weekly close above $2035, the highest close in history. However, a much smoother ride with a touch of the lower end of the uptrend range around $2000 is seen as a more likely scenario before the uptrend resumes.
Sunset Market Commentary
Markets
Markets traded with a cautious bias going into the US CPI release, with European equities and the euro incurring modest losses. European yields lost a few bps even as ECB’s Lagarde reiterated that the ECB has further ground to cover. US yields traded mixed going into the release. US inflation in April printed very close to expectations at 0.4% M/M and 4.9% Y/Y for the headline (from 5%) and 0.4% M/M and 5.5% for the core measure (from 5.6%). A 0.4% monthly rise still suggests sticky prices. However, a core measure for services calculated by Bloomberg, stripping out energy and housing, eased to 0.1% M/M and 5.1% Y/Y. At least at this stage, markets apparently saw this mix as soft enough to justify at least a prolonged Fed pause ‘potentially’ to be followed by a first interest rate cut post summer (25 bps discounted for the end September meeting). US yields currently eased between 7 bps (5-y) and 3.0 bps (30-y). The setback in German yields stays more modest at about 4bps across the curve. The easing of core inflation, annex decline in core yields this time supports equities. European indices reversed initial losses (EuroStoxx 50 little changed, S&P opened 0.8% higher). Brent oil tries to regain the $77.5 p/b short term resistance.
Contrary to what was often the case of late, the reaction in FX was al least as significant as what happened in bond and equity markets. EUR/USD just before the release almost touched yesterday’s correction low near 1.094, but revisited the 1.10 barrier (currently 1.0985). DXY still failed to build on a tentative bottoming pattern again trading in the 101.35 area (to be compared with a short term bottom near 100.8). Even the yen gains with USD/JPY immediately after the CPI release tumbling a full big figure (currently 134.65). EUR/JPY also dropped below the 148 handle despite equities rebounding intra-day. Sterling initially remained well bid as UK yields ahead of tomorrow’s BoE meeting. However, EUR/GBP tested the 0.8675 area before trying to build an intra-day bottoming pattern. The National bank of Poland as expected left its policy rate unchanged at 6,75%. No communication has been delivered currently. The zloty already was in excellent shape before the NBP decision and accelerated post the US CPI release. At EUR/PLN 4.52, the zloty trades at the strongest level against the euro since February 2022.
News & Views
Norwegian inflation proves extremely sticky. The headline April number barely eased from 6.5% to 6.4% on a rapid 1.1% monthly pace. Underlying inflation (adjusted for tax changes and excluding energy prices) even accelerated with a monthly 1% jump lifting the yearly figure from 6.2% to 6.3%. Categories registering some of the sharpest price increases were recreation & culture (1.8%), furnishings, household equipment & routine maintenance (1.5% m/m) and housing and utilities (0.8%). Food and non-alcoholic beverages jumped 2.5% m/m. The April outcome not only topped analyst estimates, it was also (way) more than the Norges Bank projected in March (5.6% headline, 6.1% core). It raises serious questions to the Scandinavian central bank’s projected terminal rate of just 3.5% in June. Norwegian swap yields surge between 4.6 and 7.8 bps with the front underperforming. Money markets assume a peak policy rate of 4% at the very least. The Norwegian krone appreciates a tad to EUR/NOK 11.48, testing resistance at 11.50.
Hungarian inflation eased more or less as expected from 25.2% to 24% in April though the monthly dynamics stayed at a strong 0.7%. Core inflation eased as well, from 25.7% to 24.8%. Food prices stabilized in April (0% m/m) and prices of fuels (-0.7%) and electricity, gas and other fuels (-0.8%) even declined month over month. The more sticky services inflation, however, rose by 1.7%. And despite the Hungarian forint’s recent appreciation, tradeable goods prices are still up by about 1% m/m for the fourth month straight. KBC Economics expects inflation to ease sub 20% by July and to moderate to around 13% by September before returning to single digits in December. The Hungarian central bank last month cut the top-end of the interest rate corridor, a move that kicked off the cutting cycle. Barring renewed selling pressure on the forint, the MNB is expected to lower the 18% de facto policy rate (O/N tender rate) already this month (May 23). The currency is testing important resistance around the EUR/HUF 370 recent highs today but that’s at least partially due to a weaker euro (and declining core bond yields).
US: Inflation Remains Stubbornly Elevated, But April Data Shows Encouraging Signs
The Consumer Price Index (CPI) increased 0.4% month-on-month (m/m) in April, meeting the consensus forecast. The 12-month change slipped to 4.9% – down from 5.0% in March.
Energy prices rose 0.6% m/m as higher gasoline prices (+3.0 m/m) more than offset the pullback in energy service costs (-1.7% m/m). Food prices were again flat on the month, pushing the year-ago measure down to 7.7%.
Core inflation (excludes food & energy) was up 0.4% m/m – meeting the consensus forecast. Compared to last April, core inflation remains elevated at 5.5% – only a tenth of percentage point below it's March reading.
Price growth across services (+0.4% m/m) held steady in April. Shelter inflation cooled for the second straight month, rising by 0.4% m/m, with gains spread across rent of primary residence (+0.6% m/m) and owners' equivalent rent (+0.5% m/m). Lodging away from home (-3.0% m/m) was lower on the month, ending what had been five consecutive months of gains.
- Non-housing services were up 0.1% m/m, a meaningful deceleration from the 0.3%-0.4% month-on-month gains seen in each of the five prior months.
Core goods prices rose by 0.6% m/m – an acceleration from March's 0.2% m/m gain. Most goods categories were higher on the month, with used vehicle prices rising by a noticeable 4.4% m/m – snapping what had been nine consecutive months of declines.
Key Implications
There were definitely some encouraging signs in this morning's CPI numbers. The continued deceleration in shelter costs suggests that we are starting to see some passthrough from last year's pullback in rental rates, which should continue for the next several months. Meanwhile, price growth across non-housing services decelerated to its slowest month-on-month pace of growth in nearly two years.
That said, we need to balance this morning's good news with the fact that goods prices have accelerated for a second consecutive month and have (again) become a source of inflationary pressure. And while the slowing in shelter costs is encouraging, more recent market-based measures of rent have shown that average rental costs have again turned higher and are already back to last year's highs. This suggests the disinflationary pressure from shelter could be fleeting.
At the May interest rate announcement, the Fed signaled that they were nearing the end of its tightening cycle, but left the door open to further rate increases should the economic data continue to surprise to the upside. At this point, it's still too early to say if another hike is in the cards, particularly given the uncertainties surrounding the recent tightening in lending standards and the potential knock-on effects it may have on the real economy. But one thing is for certain. Current market pricing, which shows rate cuts beginning as early as September, appear out of step with the recent flow of economic data. Any outward push on rate cut pricing should help to pressure yields higher, effectively doing some of the heavy lifting for the Fed.