

Sample Category Title
AUD/USD Daily Report
Daily Pivots: (S1) 0.6682; (P) 0.6701; (R1) 0.6720; More...
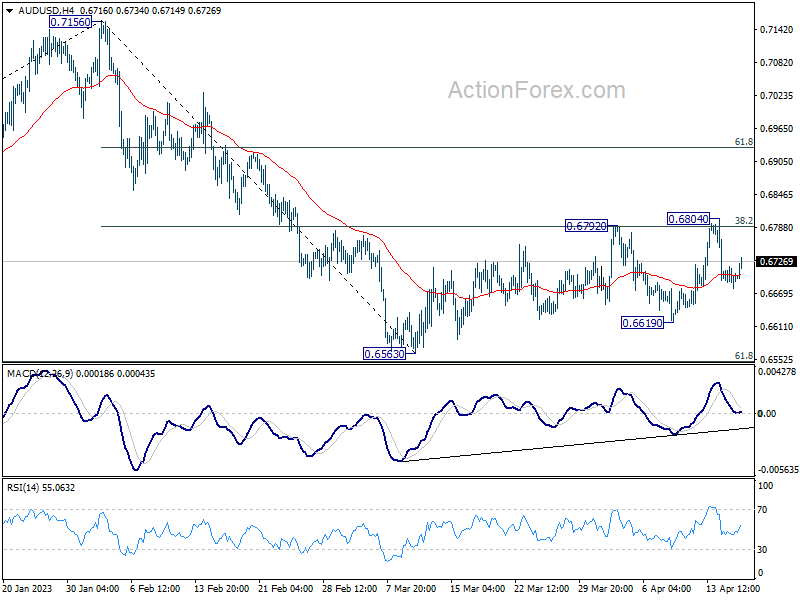
AUD/USD recovers mildly today but stays inside range of 0.6619/6804. Intraday bias remains neutral for the moment. On the downside, break of 0.6619 will indicate that decline from 0.7156 is resuming through 0.6563 low. Nevertheless, sustained break of 0.6804 will bring stronger rally back to 61.8% retracement of 0.7156 to 0.6563 at 0.6929.
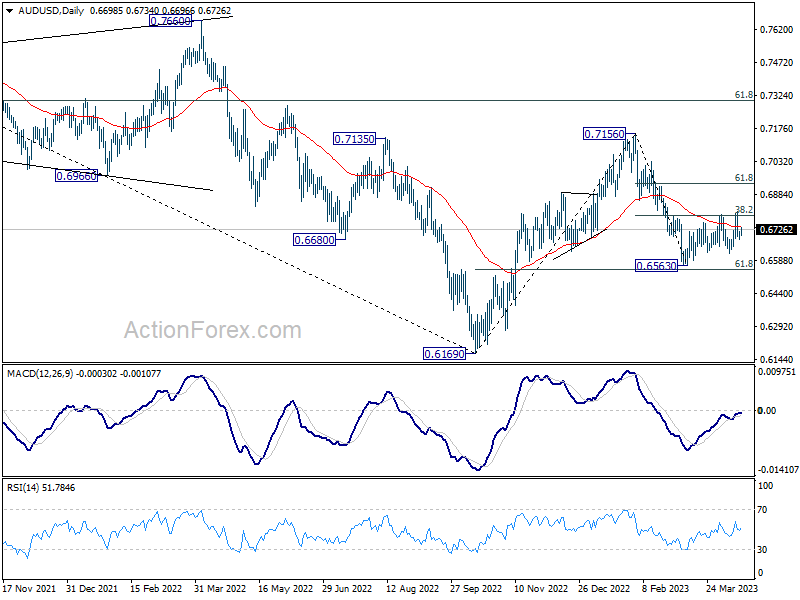
In the bigger picture, as long as 61.8% retracement of 0.6169 to 0.7156 at 0.6546 holds, the decline from 0.7156 is seen as a correction to rally from 0.6169 (2022 low) only. Another rise should still be seen through 0.7156 at a later stage. However, sustained break of 0.6546 will raise the chance of long term down trend resumption through 0.6169 low.
Australian Dollar Rises on RBA Minutes and Strong Chinese GDP Data
Australian Dollar is gaining ground today, supported by RBA minutes that revealed a rate hike was discussed during the April meeting. Encouragingly, stronger than expected Chinese GDP data is also contributing to the Aussie's rise. Meanwhile, Dollar's momentum has waned after yesterday's rally, and Yen remains under broad pressure. Sterling and Canadian Dollar are currently mixed, as traders await the release of key UK employment and Canadian CPI data.
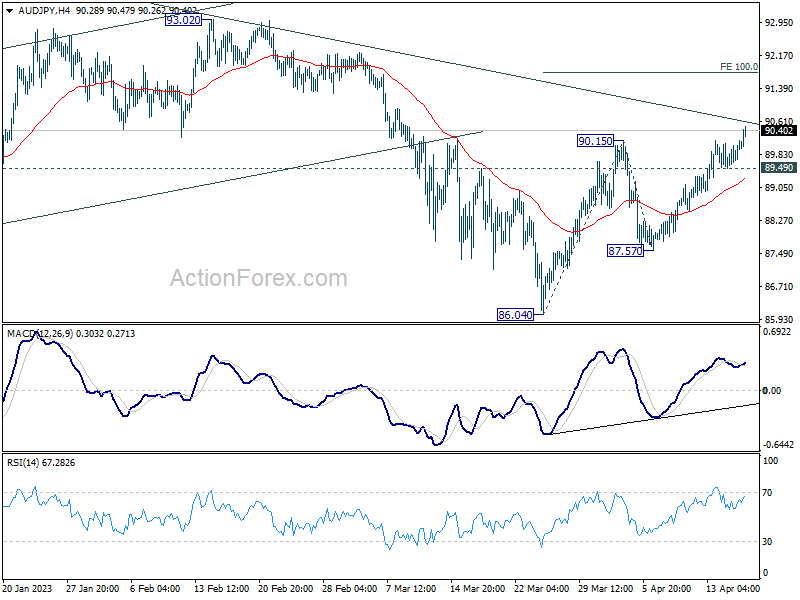
Technically, the break of 90.15 resistance in AUD/JPY confirms resumption of the overall rebound from 86.40. As long as the 89.49 minor support holds, further gains are expected. The immediate focus is on the trendline resistance at 90.61, and a firm break there could lead to a more substantial rally towards the 100% projection of 86.04 to 90.15 from 87.57 at 91.68.
In Asia, at the time of writing, Nikkei is up 0.46%. Hong Kong HSI is down -0.73%. China Shanghai SSE is up 0.11%. Singapore Strait Times is down-0.48%. Japan 10-year JGB yield is down -0.0052 at 0.477. Overnight, DOW rose 0.30%. SD&P 500 rose 0.33%. NASDAQ rose 0.28%. 10-yaer yield rose 0.069 to 3.591.
RBA minutes reveal considerations of rate hike and pause
The minutes from the RBA April 4 monetary policy meeting revealed that the Board weighed the options of a 25bps rate hike and a pause. On balance, there was a "a stronger case to pause at this meeting and reassess the need for further tightening at future meetings", after having "additional data and an updated set of forecasts". But members emphasized the to communicate clearly that "monetary policy may need to be tightened at subsequent meetings". RBA kept cash rate target unchanged at 3.6% at that meeting.
The case for a 25bps hike was primarily driven by concerns over high inflation and a tight labor market. The potential persistence of high inflation and two additional factors—upgraded near-term population growth projections and the risk of larger wage increases in parts of the economy—also supported further tightening.
On the other hand, the case for a pause stemmed from the already restrictive monetary policy following significant tightening in a short period, with the full effects on the economy yet to be observed. Tighter monetary policy had contributed to a housing market slowdown, decelerated consumption growth, and financial pressure on some households with housing loans. The value of pausing lay in the opportunity to gather additional data on various economic indicators and to receive updated forecasts from the staff, which would be invaluable in reassessing the economic outlook and determining the extent of further tightening needed.
China's Q1 GDP growth surpasses expectations, retail sales bounce
China's Q4 GDP growth outperformed expectations at 4.5% yoy, up from 2.9% in Q4, and beat expectation of 4.0% yoy. Retail sales in March saw a 10.6% yoy increase, the largest since June 2021. Despite the positive figures, industrial production rose by only 3.9% yoy in March, missing the anticipated 4.7%. Additionally, fixed asset investment saw a 5.1% ytd yoy growth in March, falling short of the expected 5.8%.
The National Bureau of Statistics (NBS) report on Tuesday cited challenges faced by China in the first quarter, including a "grave and complex international environment" and domestic tasks for reform, development, and stability.
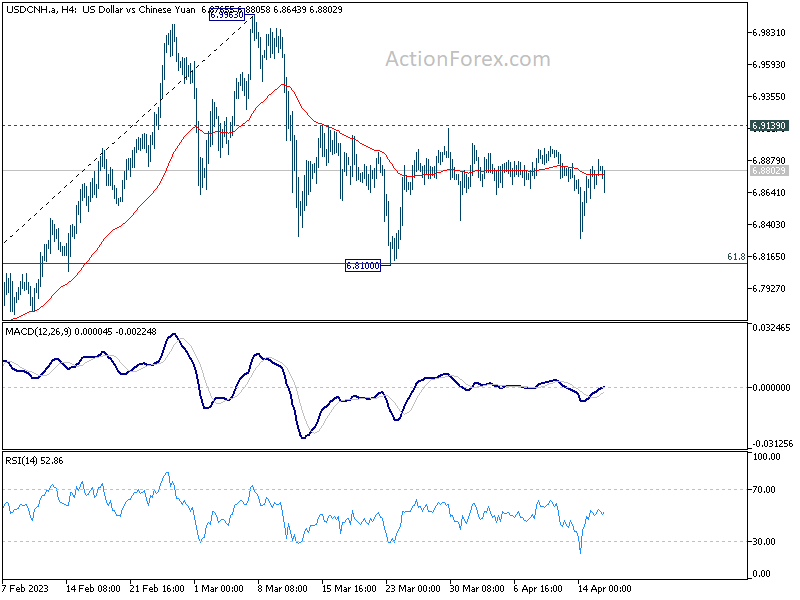
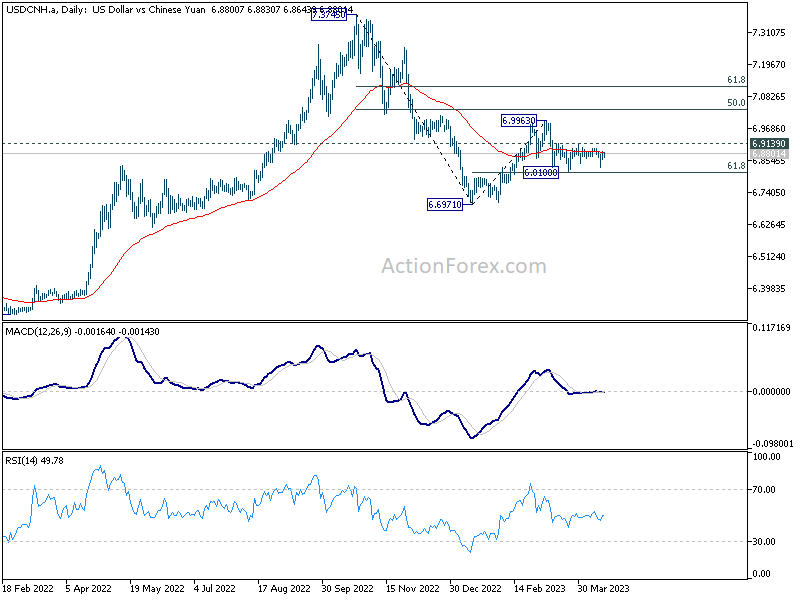
USD/CNH has remained in a sideways pattern since dropping to 6.8100 in late March. 61.8% retracement of 6.6971 to 6.9963 at 6.8114 offered some support, halting the decline from 6.9963. However, a break of 6.9139 resistance is needed to confirm completion of the pullback. Without this confirmation, another fall is in favor, and a break of 6.8100 could lead to retesting 6.6971 low from January.
UK job data and Canada CPI in focus, GBP/CAD pressing 55 D EMA
UK employment and Canada CPI data are the major focuses for today. BoE is clearly looking into economic data to assess how persistent inflation pressure remains. Another 25bps hike in May is still likely but that would depend on today's job data, in particular on wages growth, as well as tomorrow's CPI report.
Meanwhile, BoC is clear that an accumulation of evidence is needed before consideration of resumption of tightening. Today's CPI data might not be a determining factor on any near term move in BoC's policy. Yet, they still crucial for BoC to decide whether another hike is needed later in the year.
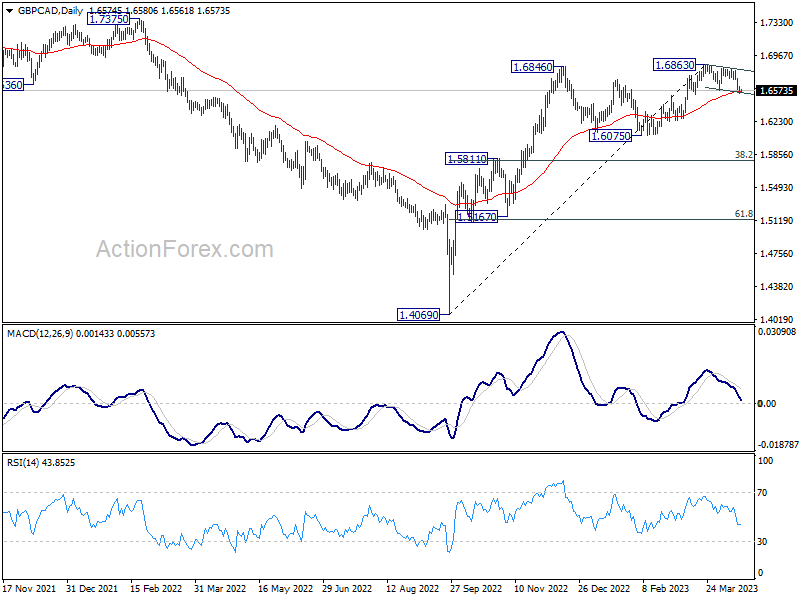
Technically, GBP/CAD's pull back from 1.6863 short term top extended lower this week. It's now pressure 55 D EMA (now at 1.6659). Strong rebound from current level will retain the case that it's merely in a near term correction. That is, another rise through 1.6863 should be seen sooner rather than later.
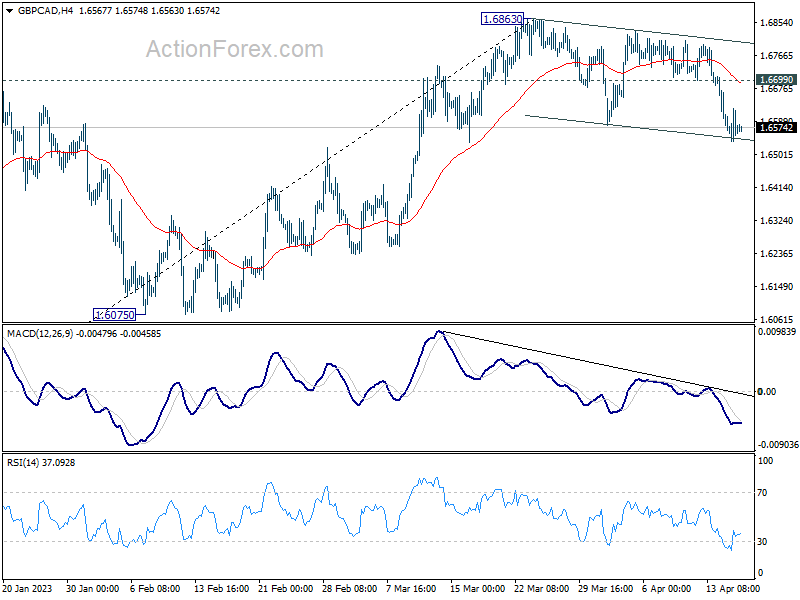
However, sustained break of the EMA will argue that GBP/CAD is already in correction to whole up trend from 1.4069. That would open up deeper fall through 1.6075 support, possibly to 1.5811 cluster support (38.2% retracement of 1.5069 to 1.6863 at 1.5796) before forming a base.
Looking ahead
UK employment, Germany ZEW economic sentiment are the main focus in European session. Canada CPI will take center stage later in the day, and US building permits and housing starts will be featured too.
AUD/USD Daily Report
Daily Pivots: (S1) 0.6682; (P) 0.6701; (R1) 0.6720; More...
AUD/USD recovers mildly today but stays inside range of 0.6619/6804. Intraday bias remains neutral for the moment. On the downside, break of 0.6619 will indicate that decline from 0.7156 is resuming through 0.6563 low. Nevertheless, sustained break of 0.6804 will bring stronger rally back to 61.8% retracement of 0.7156 to 0.6563 at 0.6929.
In the bigger picture, as long as 61.8% retracement of 0.6169 to 0.7156 at 0.6546 holds, the decline from 0.7156 is seen as a correction to rally from 0.6169 (2022 low) only. Another rise should still be seen through 0.7156 at a later stage. However, sustained break of 0.6546 will raise the chance of long term down trend resumption through 0.6169 low.
Economic Indicators Update
| GMT | Ccy | Events | Actual | Forecast | Previous | Revised |
|---|---|---|---|---|---|---|
| 01:30 | AUD | RBA Meeting Minutes | ||||
| 02:00 | CNY | GDP Y/Y Q1 | 4.50% | 4.00% | 2.90% | |
| 02:00 | CNY | Fixed Asset Investment YTD Y/Y Mar | 5.10% | 5.80% | 5.50% | |
| 02:00 | CNY | Industrial Production Y/Y Mar | 3.90% | 4.70% | 2.40% | |
| 02:00 | CNY | Retail Sales Y/Y Mar | 10.60% | 8.00% | 3.50% | |
| 06:00 | GBP | Claimant Count Change Mar | 28.2K | 10.2K | -11.2K | |
| 06:00 | GBP | ILO Unemployment Rate (3M) Feb | 3.80% | 3.70% | 3.70% | |
| 06:00 | GBP | Average Earnings Excluding Bonus 3M/Y Feb | 6.60% | 6.20% | 6.50% | 6.60% |
| 06:00 | GBP | Average Earnings Including Bonus 3M/Y Feb | 5.90% | 5.10% | 5.70% | 5.90% |
| 08:00 | EUR | Italy Trade Balance (EUR) Feb | -3.23B | -4.19B | ||
| 09:00 | EUR | Germany ZEW Economic Sentiment Apr | 15.1 | 13 | ||
| 09:00 | EUR | Germany ZEW Current Situation Apr | -40 | -46.5 | ||
| 09:00 | EUR | Eurozone ZEW Economic Sentiment Apr | 11.2 | 10 | ||
| 12:30 | USD | Building Permits Mar | 1.46M | 1.52M | ||
| 12:30 | USD | Housing Starts Mar | 1.41M | 1.45M | ||
| 12:30 | CAD | CPI M/M Mar | 0.60% | 0.40% | ||
| 12:30 | CAD | CPI Y/Y Mar | 4.30% | 5.20% | ||
| 12:30 | CAD | CPI Median Y/Y Mar | 4.50% | 4.90% | ||
| 12:30 | CAD | CPI Trimmed Y/Y Mar | 4.40% | 4.80% | ||
| 12:30 | CAD | CPI Common Y/Y Mar | 6.00% | 6.40% |
Technical Outlook and Review
DXY:
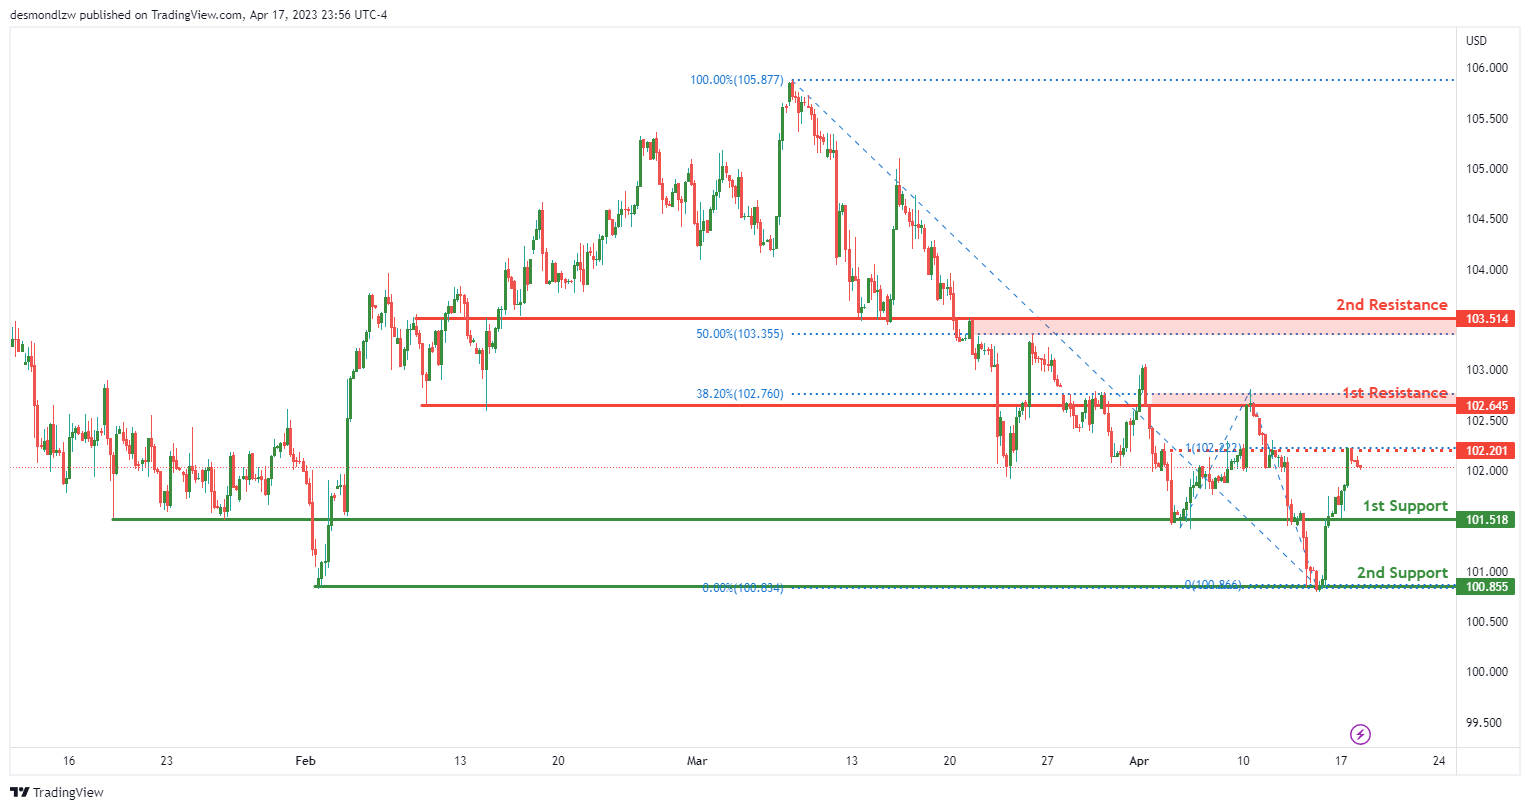
The DXY chart has a bearish momentum overall, with a potential short-term rise towards the 1st resistance before reversing and dropping towards the 1st support.
The 1st support level is at 101.51, which is an overlap support. This level has been tested multiple times in the past and has shown to provide strong support. The 2nd support level is at 100.85, which is a swing low support. This level has also been tested multiple times in the past and has shown to provide a strong support zone for price.
The 1st resistance level is at 102.64, which is an overlap resistance and coincides with a 38.20% Fibonacci retracement. This resistance level has also been tested multiple times in the past and has shown to provide strong resistance to price. There are also two intermediate resistance levels to watch out for. The first intermediate resistance level is at 103.51, which is an overlap resistance and coincides with a 50% Fibonacci retracement. The second intermediate resistance level is at 102.20, which is an overlap resistance.
It’s important to keep an eye on the support and resistance levels as they have been tested multiple times in the past and have shown to provide strong support and resistance zones for price.
EUR/USD:
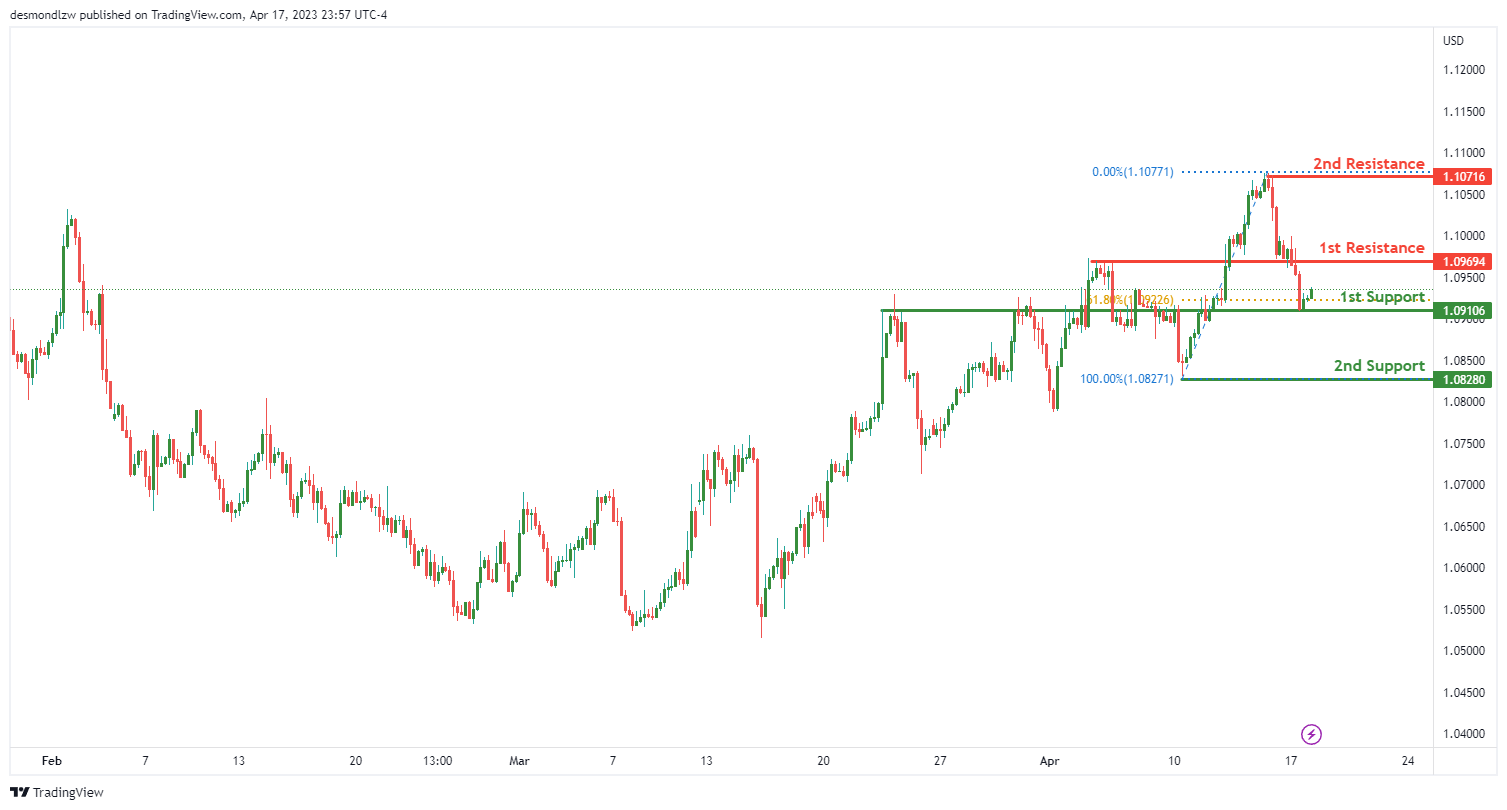
The EUR/USD chart has an overall bullish momentum. There is a potential for a bullish continuation towards the 1st resistance.
The 1st support level is at 1.0910, which is a swing low support and coincides with a 61.80% Fibonacci retracement. This level has shown to provide strong support for price in the past.
The 2nd support level is at 1.0828, which is also a swing low support. This level has also been tested multiple times in the past and has shown to provide a strong support zone for price.
The 1st resistance level is at 1.0969, which is a pullback resistance. This level has shown to provide strong resistance to price in the past.
There is also the 2nd resistance level at 1.1071, which is a multi-swing high resistance. This level has been tested multiple times in the past and has shown to provide a strong resistance zone for price.
GBP/USD:
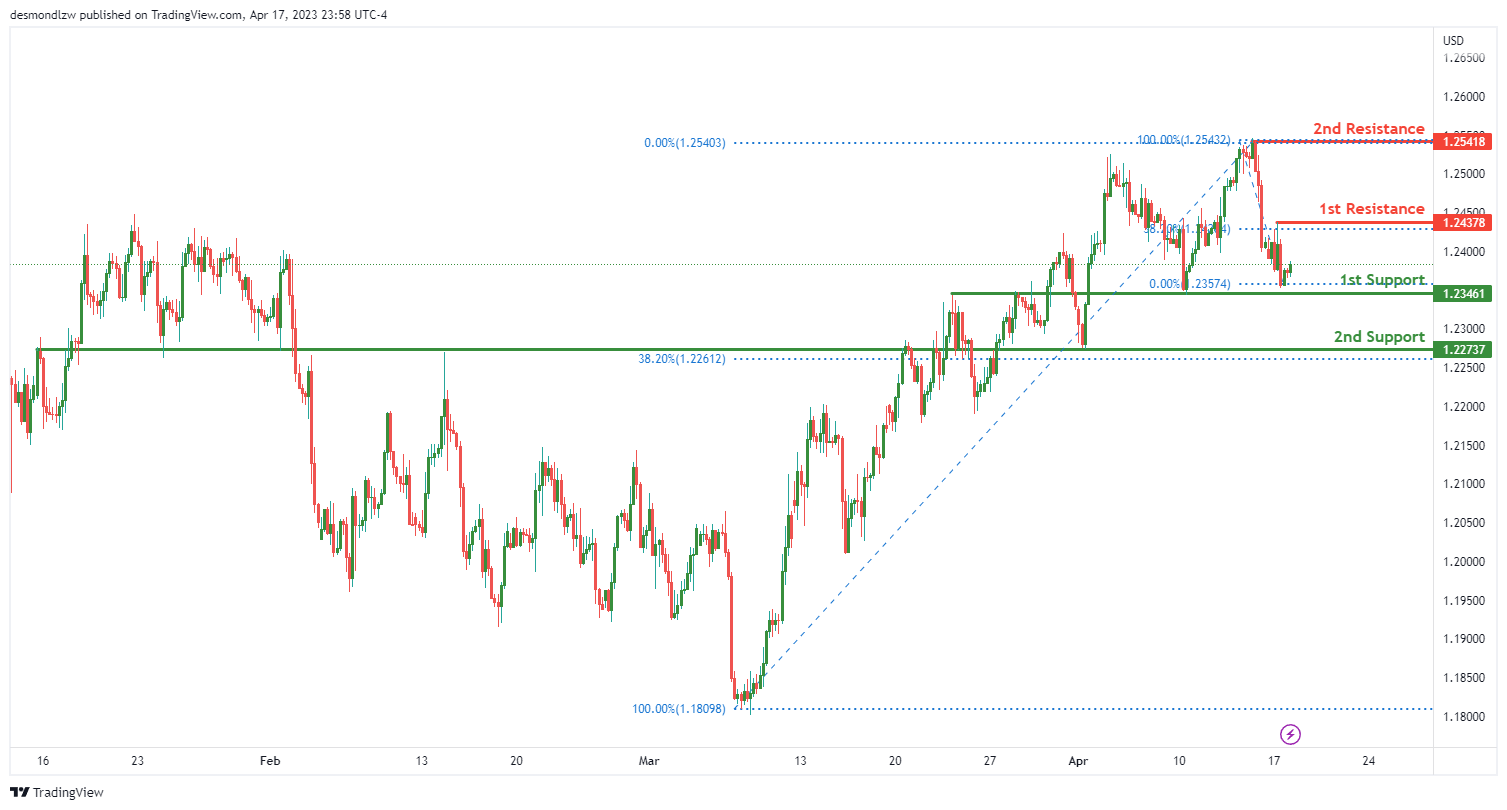
The GBP/USD chart has an overall bullish momentum, with a potential for a bullish continuation towards the 1st resistance.
The 1st support level is at 1.2346, which is an overlap support. This level has been tested multiple times in the past and has shown to provide strong support for price.
The 2nd support level is at 1.2273, which is also an overlap support and coincides with a 38.20% Fibonacci retracement. This level has also been tested multiple times in the past and has shown to provide a strong support zone for price.
The 1st resistance level is at 1.2437, which is a swing high resistance. This level has shown to provide strong resistance to price in the past.
There is also a 2nd resistance level at 1.2541, which is a multi-swing high resistance. This level has been tested multiple times in the past and has shown to provide a strong resistance zone for price.
USD/CHF:
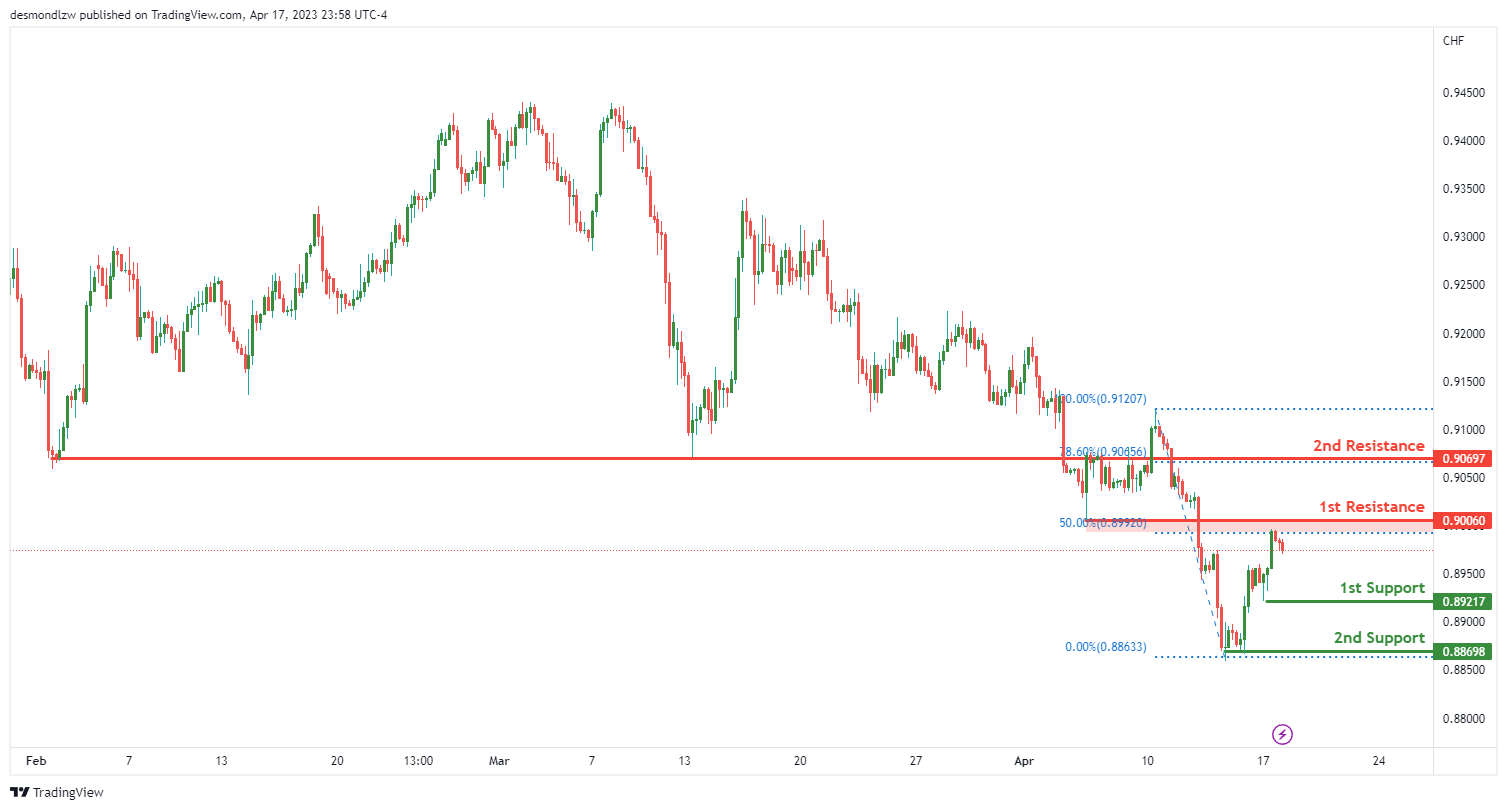
The USD/CHF chart has an overall bearish momentum, with a potential for a bearish continuation towards the 1st support.
The 1st support level is at 0.8921, which is a swing low support. This level has been tested multiple times in the past and has shown to provide strong support for price.
The 2nd support level is at 0.8869, which is a multi-swing low support. This level has also been tested multiple times in the past and has shown to provide a strong support zone for price.
The 1st resistance level is at 0.9006, which is a pullback resistance and coincides with a 50% Fibonacci retracement. This level has shown to provide strong resistance to price in the past.
There is also a 2nd resistance level at 0.9069, which is a pullback resistance and coincides with a 38.20% Fibonacci retracement. This level has also shown to provide strong resistance to price in the past.
USD/JPY:
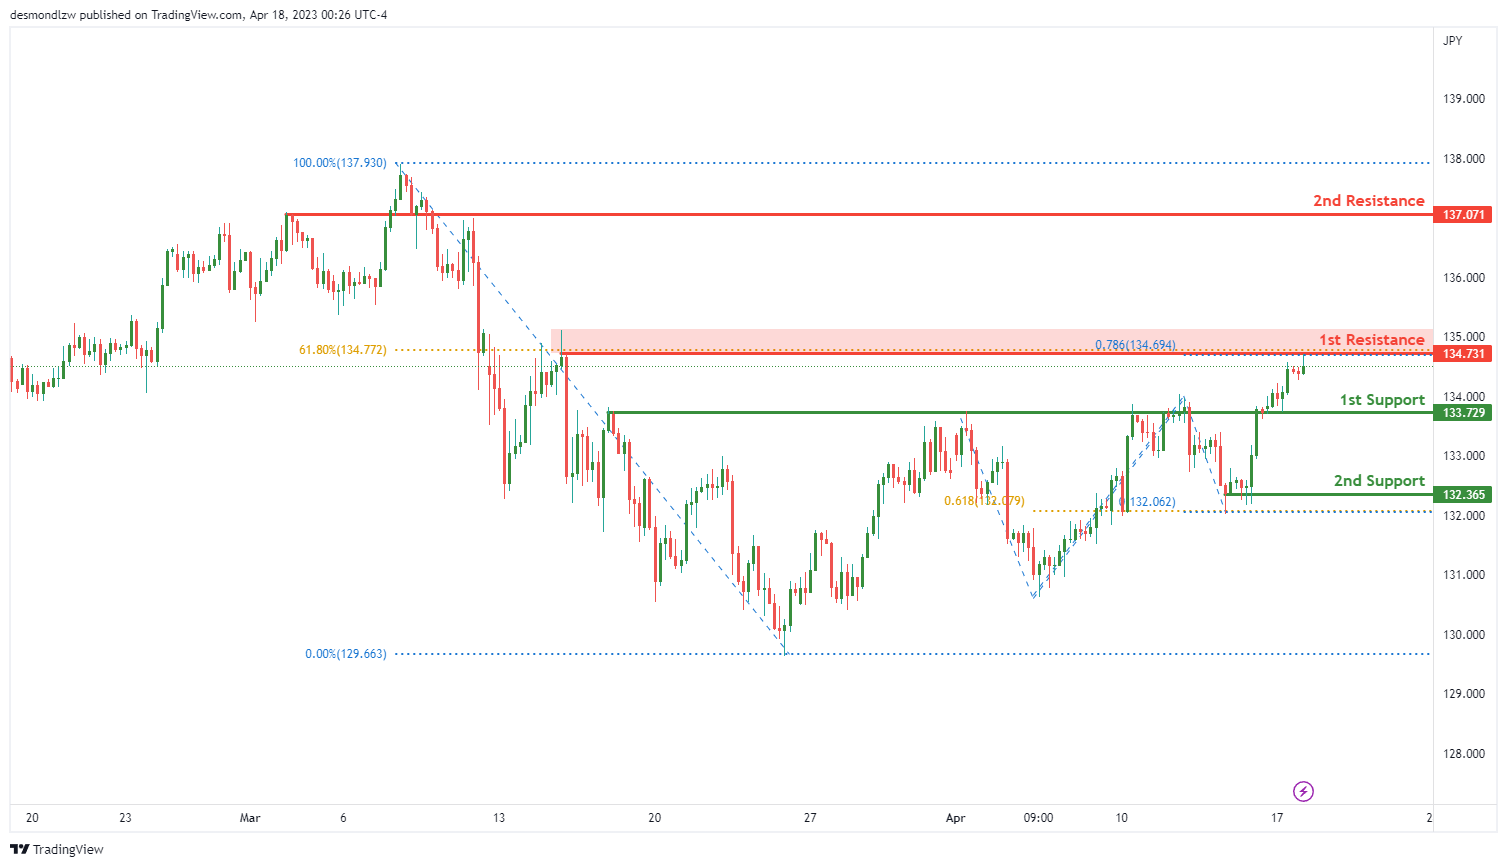
The USD/JPY chart has an overall bearish momentum, with a potential for a bearish reaction off the 1st resistance and drop to the 1st support.
The 1st support level is at 133.720, which is an overlap support and coincides with a 78.60% Fibonacci projection. This level has shown to provide strong support to price in the past.
The 2nd support level is at 132.360, which is a multi-swing low support and coincides with a 61.80% Fibonacci projection. This level has also shown to provide a strong support zone for price in the past.
The 1st resistance level is at 134.730, which is a swing high resistance and coincides with a 61.80% Fibonacci retracement. This level has shown to provide strong resistance to price in the past.
There is also a 2nd resistance level at 137.070, which is an overlap resistance. This level has been tested multiple times in the past and has shown to provide a strong resistance zone for price.
AUD/USD:
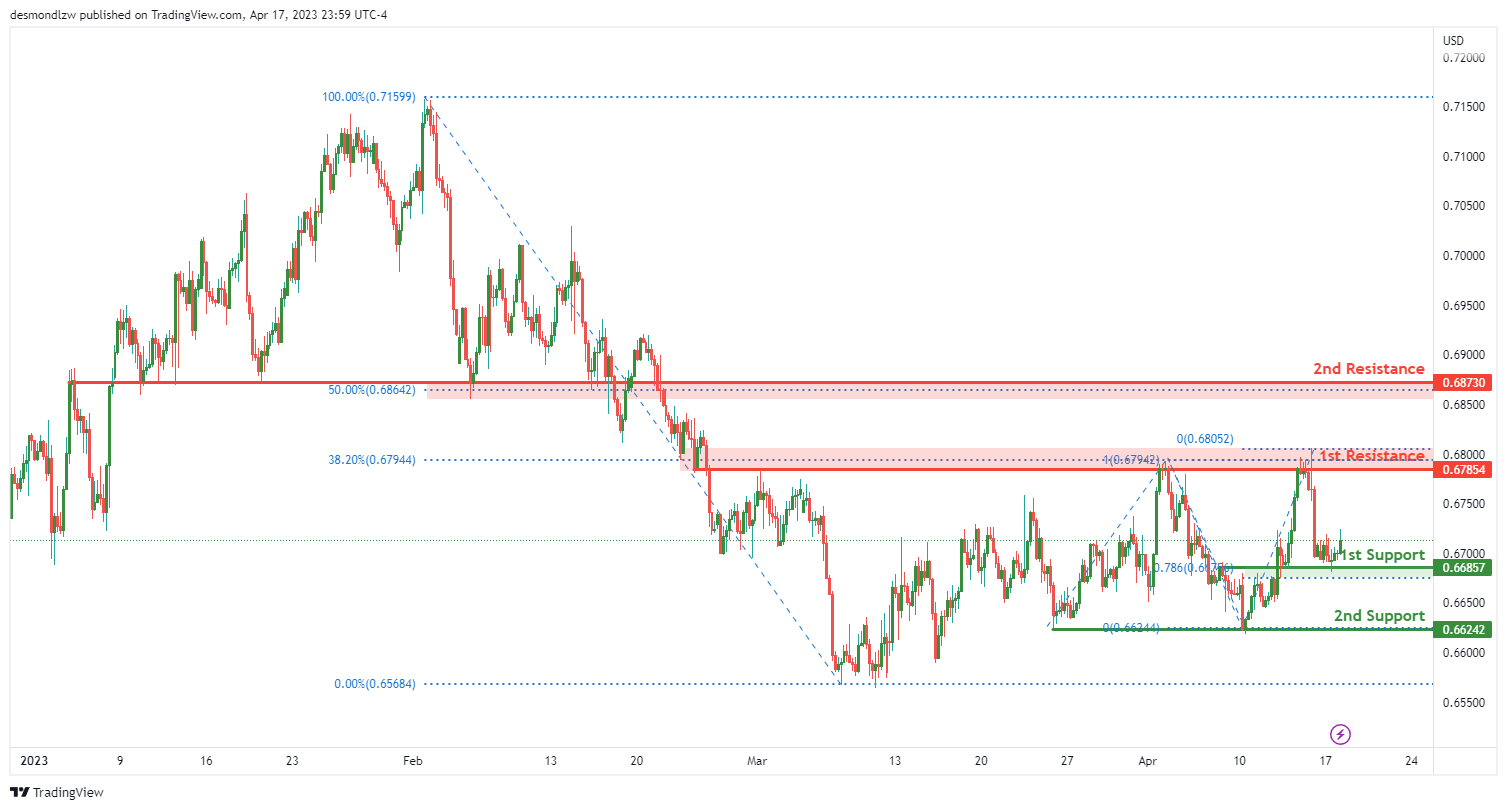
The AUD/USD chart has an overall bullish momentum, with potential for a bullish continuation towards the 1st resistance level at 0.6785. The price is currently trading above the Ichimoku cloud, which is a positive sign indicating bullish momentum.
The first support level is at 0.6685, which is an overlap support level and coincides with a 78.60% Fibonacci projection. This level has held as support in the past and could potentially provide a bounce for the price.
If the price were to bounce from the first support level, it could rise towards the first resistance level at 0.6785. This level is a pullback resistance level and coincides with a 38.20% Fibonacci retracement, adding to its strength as a resistance level.
Further up, there is a second resistance level at 0.6873, which coincides with a 50% Fibonacci retracement and is also a pullback resistance level. If the price were to break through the first resistance level, it could potentially rise towards this level.
However, if the price were to break below the first support level at 0.6685, the next level it could drop to is the second support level at 0.6624. This level is a multi-swing low support level and could potentially provide a bounce for the price.
NZD/USD:
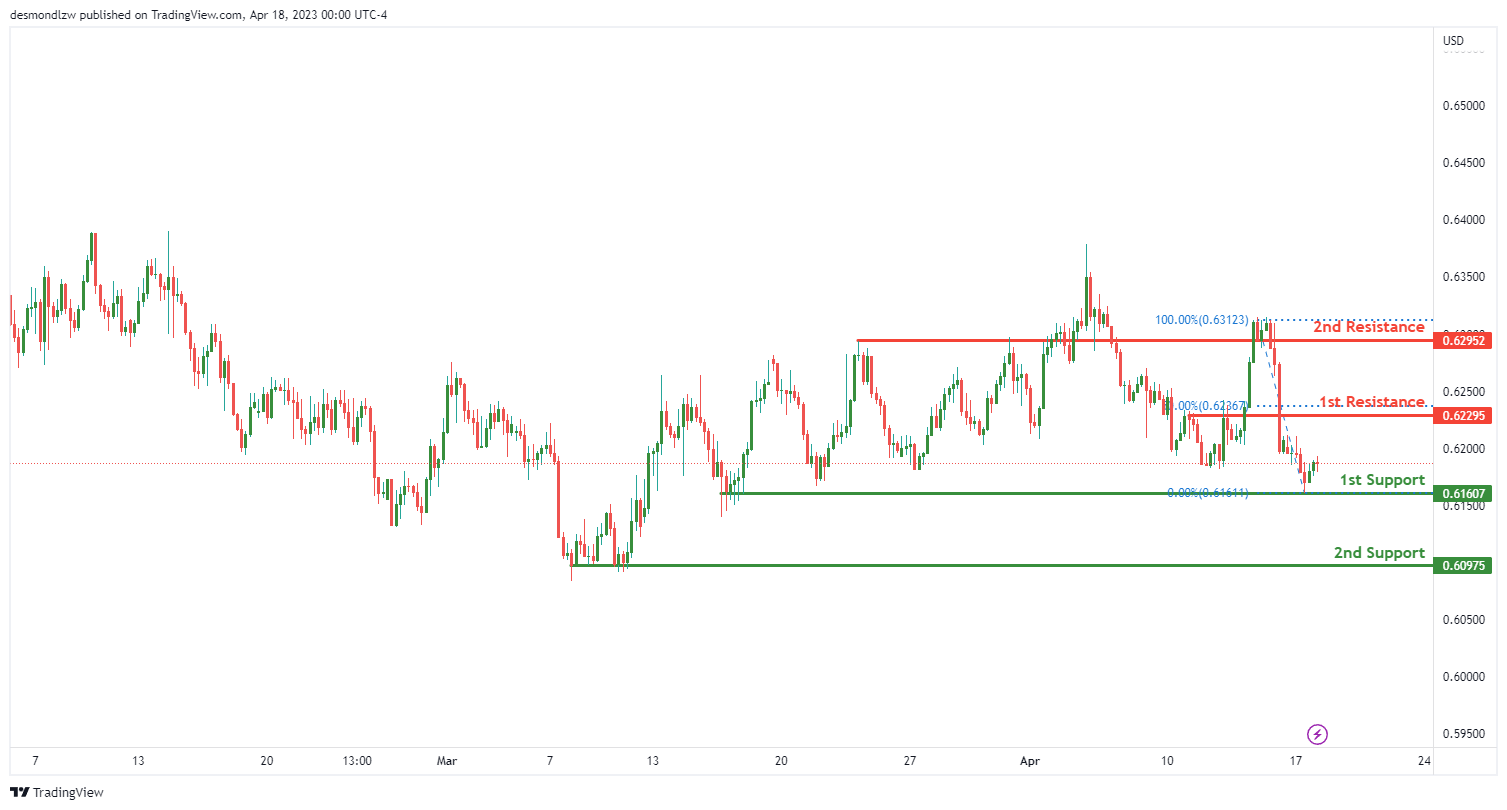
The NZD/USD chart is showing strong bullish momentum with potential for a continuation towards the 1st resistance. Price is currently trading above both the Ichimoku cloud and an ascending support line, indicating a bullish bias.
The 1st support level is at 0.6160 and is a multi-swing low support level. The 2nd support level is at 0.6097 and is also a multi-swing low support level. These levels could provide a buying opportunity for traders looking to take advantage of the bullish momentum.
On the resistance side, the 1st resistance is at 0.6229 which coincides with a 50% Fibonacci retracement level and a pullback resistance. A break above this level could potentially trigger a strong bullish acceleration towards our 2nd resistance at 0.6295, which is an overlap resistance level.
USD/CAD:
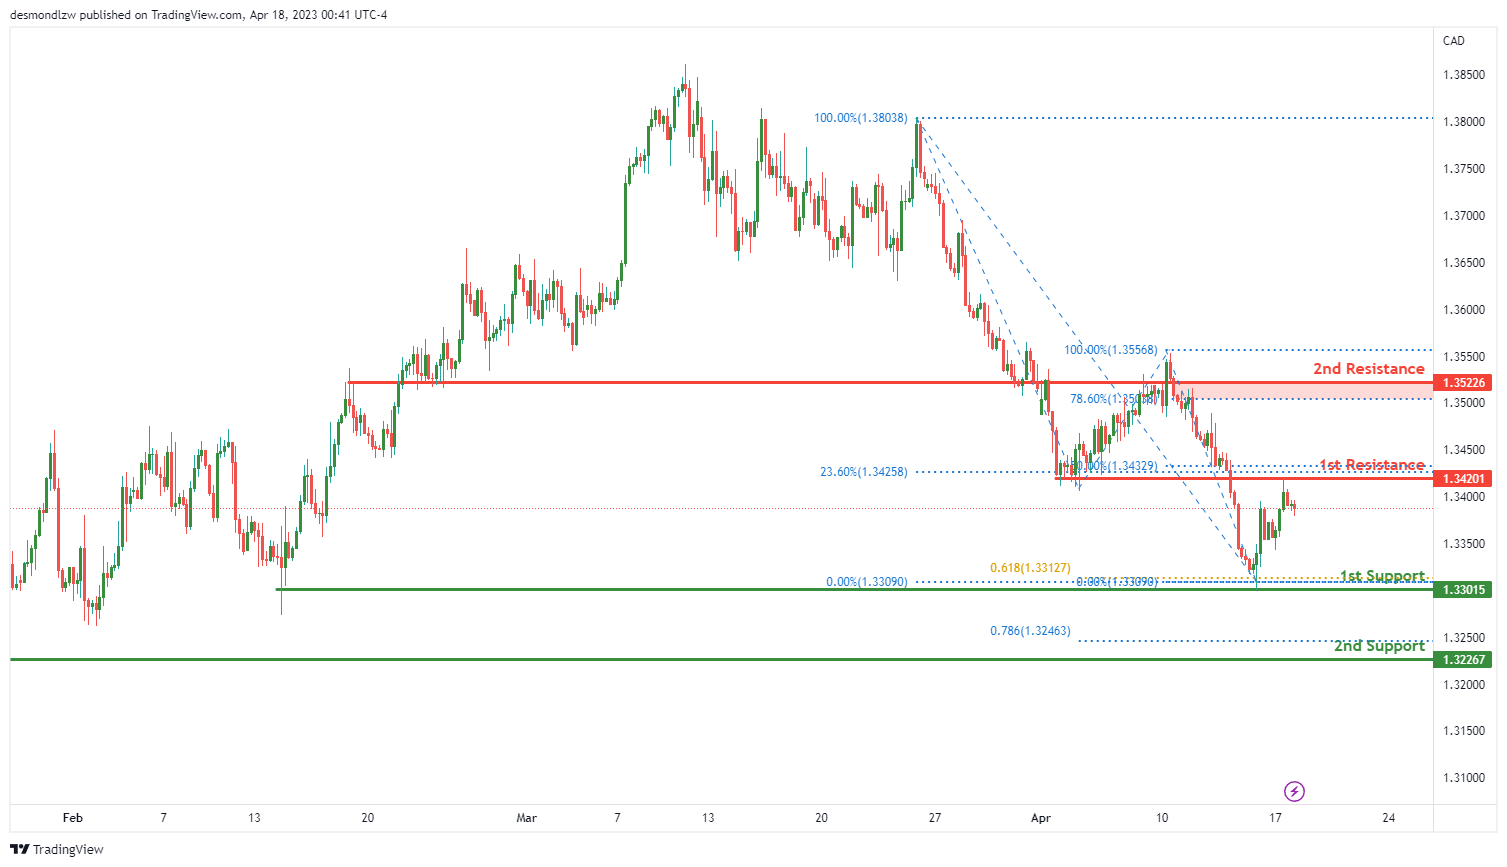
The USD/CAD pair has been seeing a bearish momentum overall, with price potentially making a bearish continuation towards the 1st support level.
Currently, the pair is trading below the Ichimoku cloud, which suggests bearish momentum. In addition, there is a descending trendline in play, which also suggests possible further bearish momentum.
Looking at the support and resistance levels, we can see that the 1st support level is at 1.3301, which is a multi-swing low support level and coincides with a 61.80% Fibonacci projection. If price were to break below this support level, the next level it could drop to is the 2nd support level at 1.3226, which is a swing low support.
On the other hand, the 1st resistance level is at 1.3420, which is an overlap resistance and coincides with a 23.60% Fibonacci retracement. If price were to rise towards this resistance level, it could potentially reverse off it and drop towards the 1st support level. The 2nd resistance level is at 1.3522, which is also an overlap resistance and coincides with a 78.60% Fibonacci retracement.
DJ30:
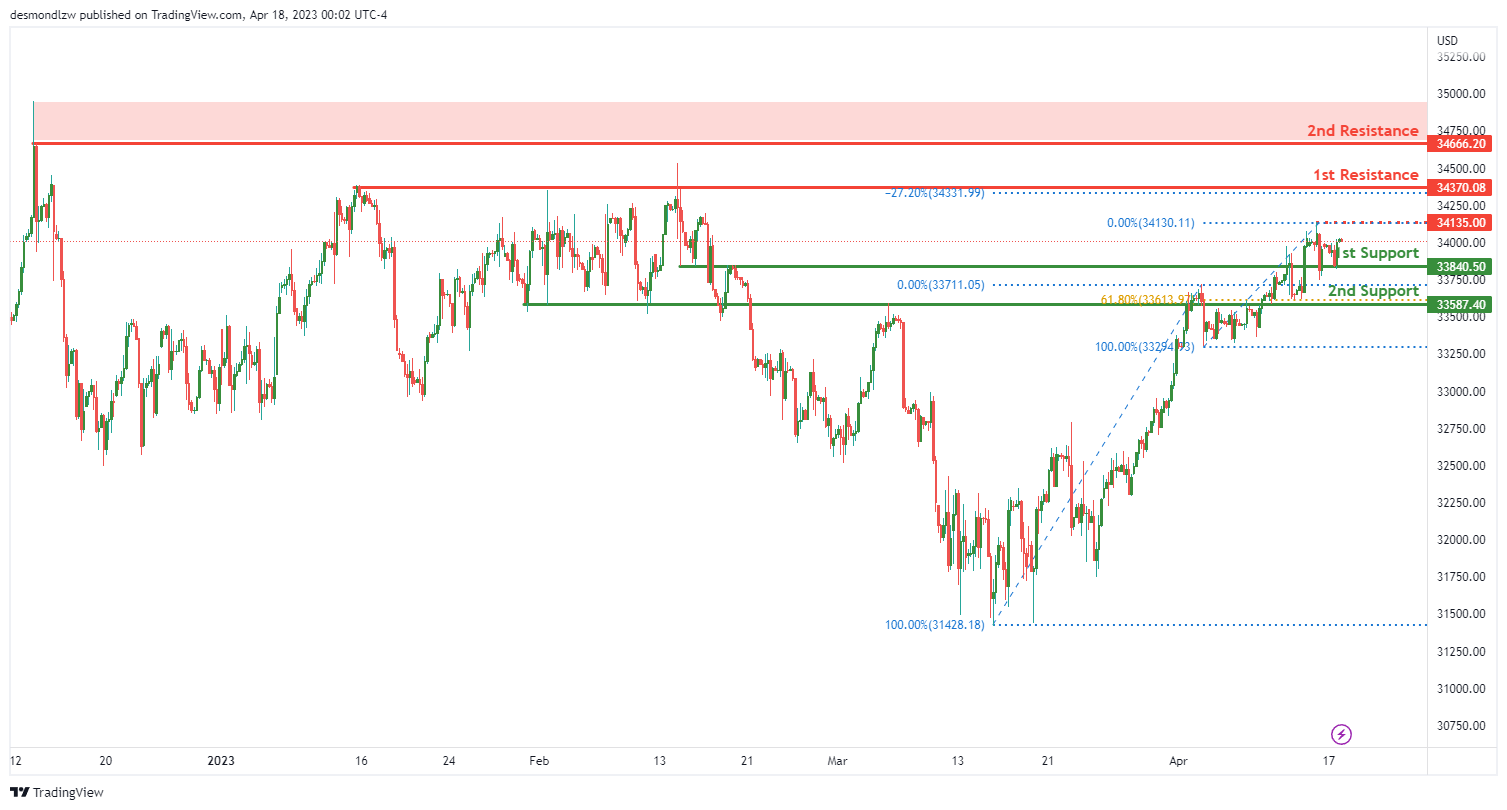
The DJ30 index appears to be showing strong bullish momentum, with potential for a continuation towards the first resistance level at 34370.08. Currently, price is sitting above both the first support level at 33840.50 and the second support level at 33587.40, both of which are overlap supports. The second support level also coincides with a 61.80% Fibonacci retracement, providing additional strength.
The first resistance level at 34370.08 is a multi-swing high resistance and is further strengthened by a -27% Fibonacci expansion. If price were to continue upwards, it could potentially encounter an intermediate resistance level at 34135.00, which is also a swing high resistance.
Should price break through the first resistance level, the next resistance level to watch out for is at 34666.20, a significant swing high resistance. However, if price were to drop below the first support level, it could potentially move towards the second support level at 33587.40.
GER30:
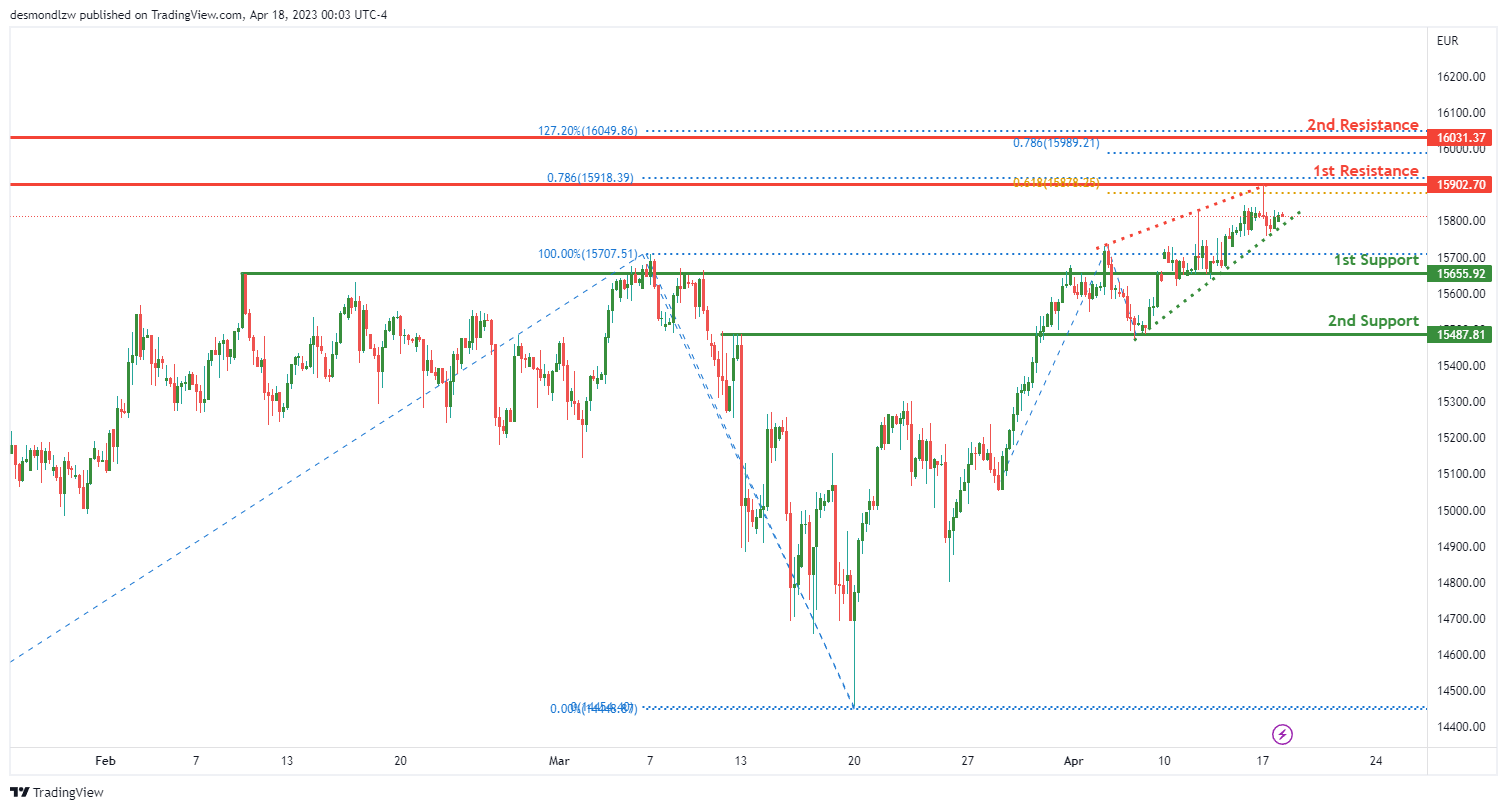
The GER30 chart is currently showing bearish momentum due to the rising wedge pattern which is a bearish chart pattern that signals an imminent breakout to the downside. However, in the short term, price could potentially rise towards the 1st resistance before reversing off it and dropping towards the 1st support.
The 1st support is located at 15655.92, which is an overlap support level. This support is considered strong and could potentially hold price up. If price were to break below this level, it could drop towards the 2nd support at 15487.81, which is another overlap support level.
On the other hand, the 1st resistance is located at 15902.70, which is a swing high resistance level. This level lines up with the 61.80% Fibonacci projection and is considered strong. If price were to rise towards this level, it could reverse off it and drop towards the 1st support. The 2nd resistance is located at 16031.37, which is a swing high resistance level that lines up with the 78.60% Fibonacci projection.
BTC/USD:
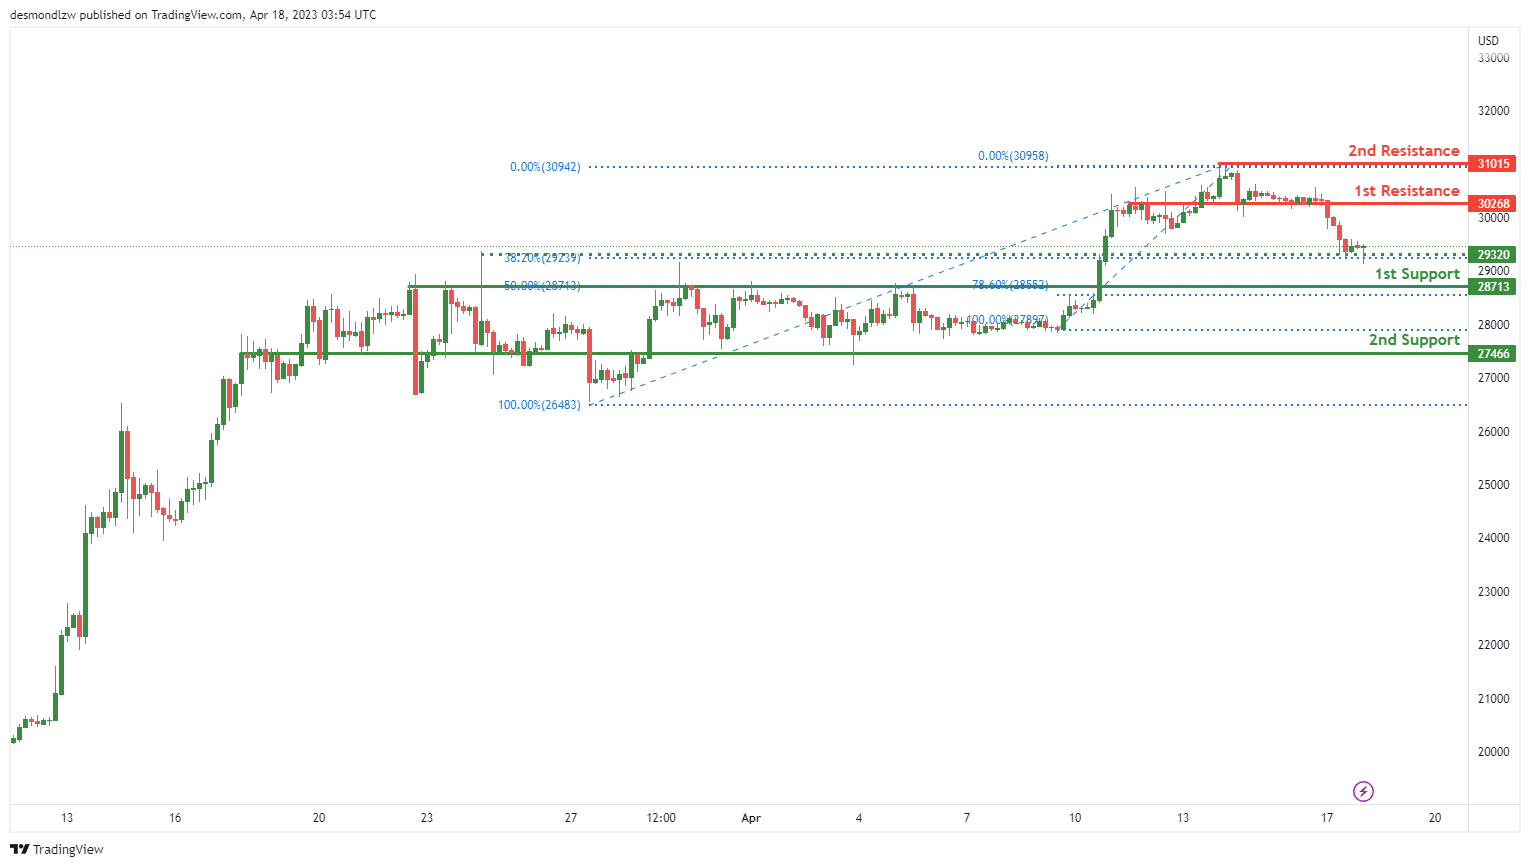
The overall momentum of the BTC/USD chart is currently bearish. Price has the potential to continue its bearish momentum towards the first support level at 28713, which is a pullback support level and coincides with the 78.60% Fibonacci retracement. If price were to break below this level, the next support level it could drop to is the second support level at 27466, which is also an overlap support level.
On the other hand, if price were to bounce from the first support level, it could potentially rise towards the first resistance level at 30268. This level is a pullback resistance level, and if price breaks above it, it could potentially rise towards the second resistance level at 31015, which is a swing high resistance level.
US500
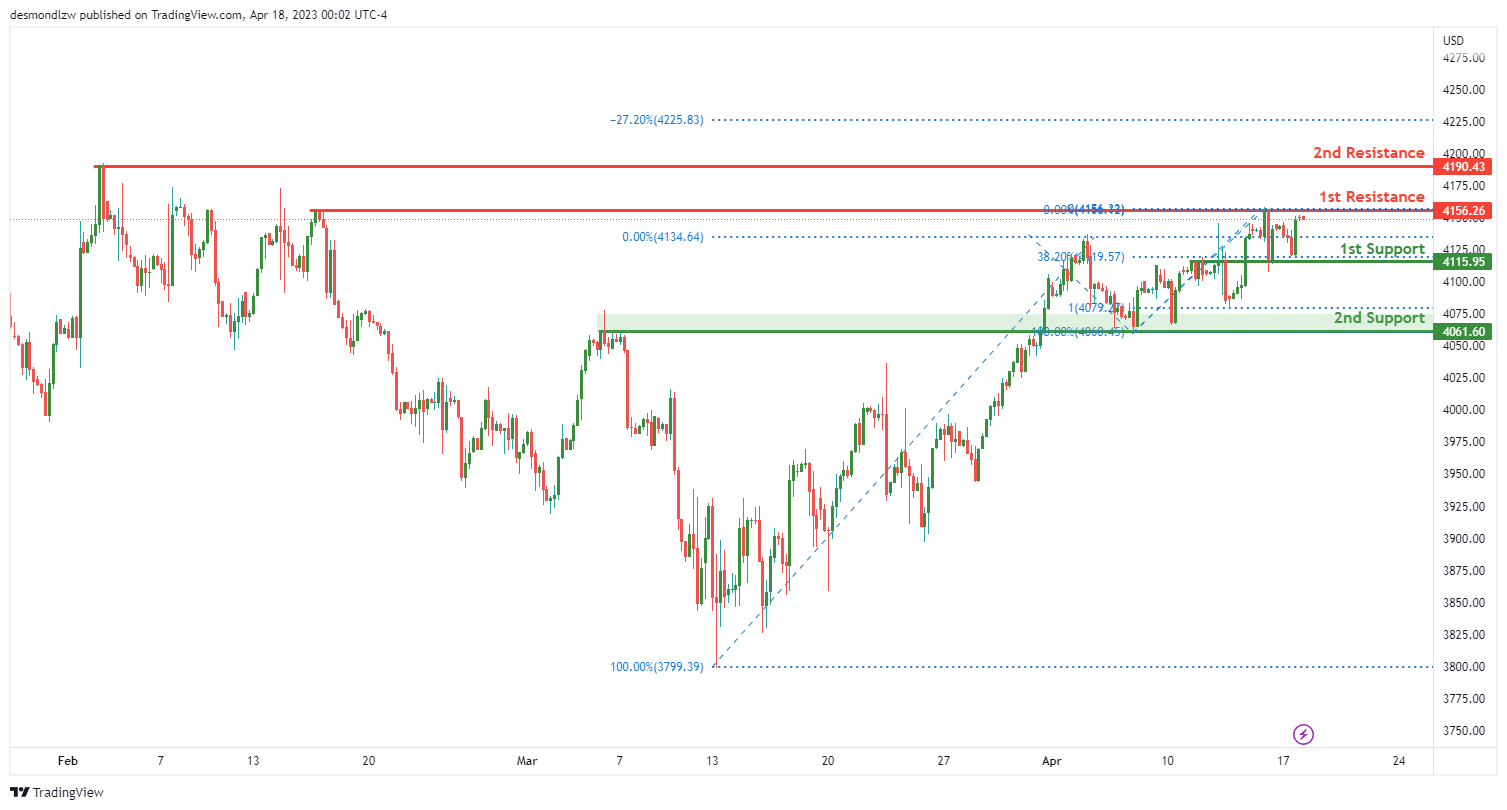
The overall momentum of the US500 chart is bearish. The price could potentially make a bearish reaction off the 1st resistance and drop to the 1st support. The 1st support at 4155.95 is a good level as it is an overlap support and a 38.20% Fibonacci retracement level. If the price breaks below this support level, the 2nd support at 4061.60 could provide another good buying opportunity, as it is also an overlap support and a 100% Fibonacci projection level.
On the other hand, if the price manages to break above the 1st resistance at 4156.95, it could signal a shift in momentum and indicate a potential bullish move. However, the 2nd resistance at 4190.43 is also a strong level of swing high resistance, which may provide a challenge for the price to break through.
ETH/USD:
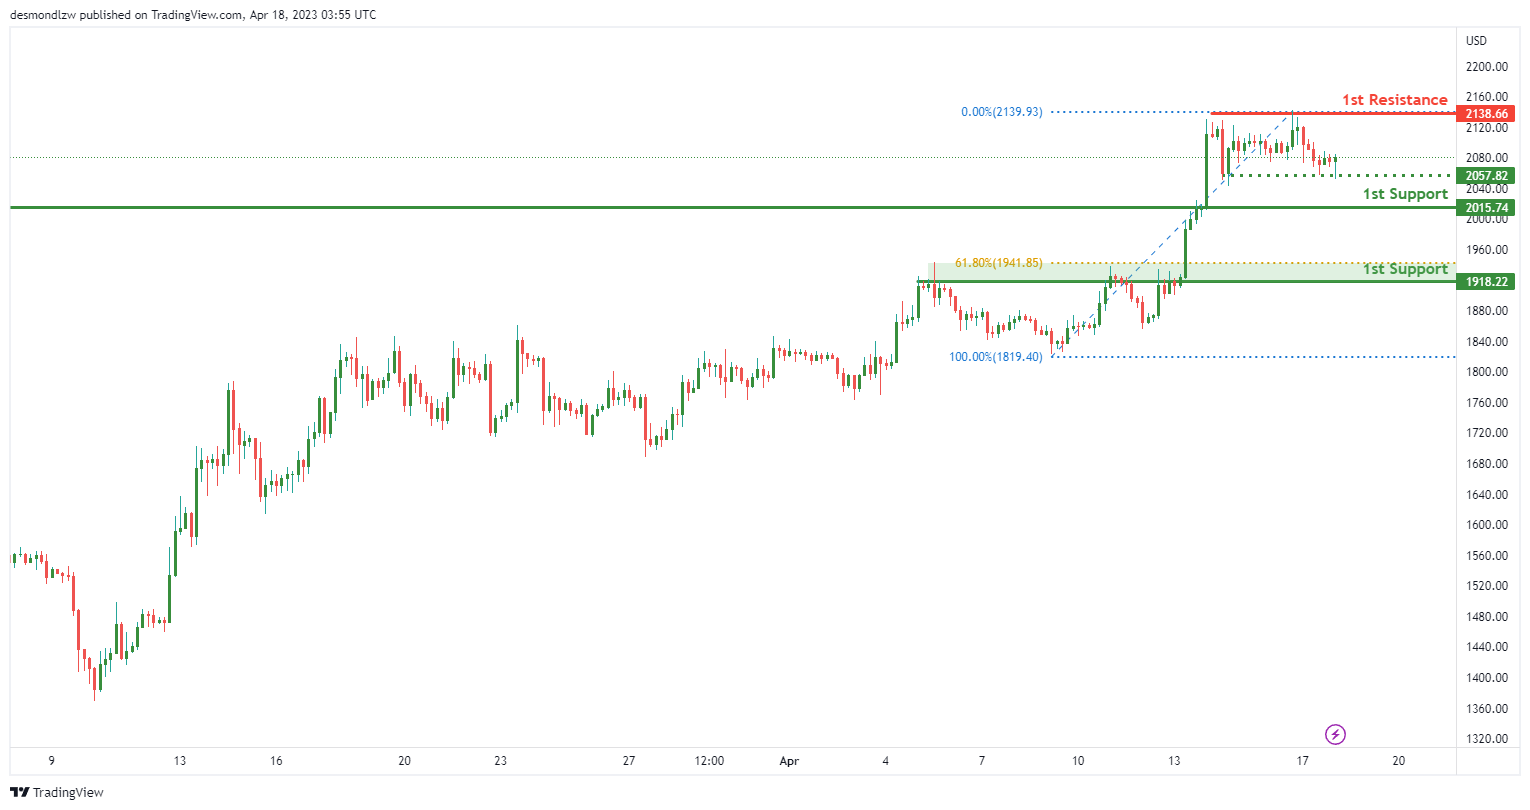
The overall momentum of the ETH/USD chart is bearish. The price could potentially continue to move bearishly towards the 1st support at 2015.74, which is a good level as it has acted as a pullback support in the past.
If the price continues to decline, the 2nd support at 1918.22 could provide another good buying opportunity. This support level is also a 61.80% Fibonacci retracement level, which further adds to its significance as a potential support level.
On the other hand, if the price manages to move upwards, the 1st resistance at 2138.66 could provide a challenge for the price to break through. This level is a multi-swing high resistance, which indicates that it has previously acted as a significant resistance level in the past.
In addition, there is an intermediate support at 2057.82, which is a good level as it has acted as a swing low support. If the price breaks below the 1st support at 2015.74, the intermediate support at 2057.82 could provide a potential buying opportunity.
WTI/USD:
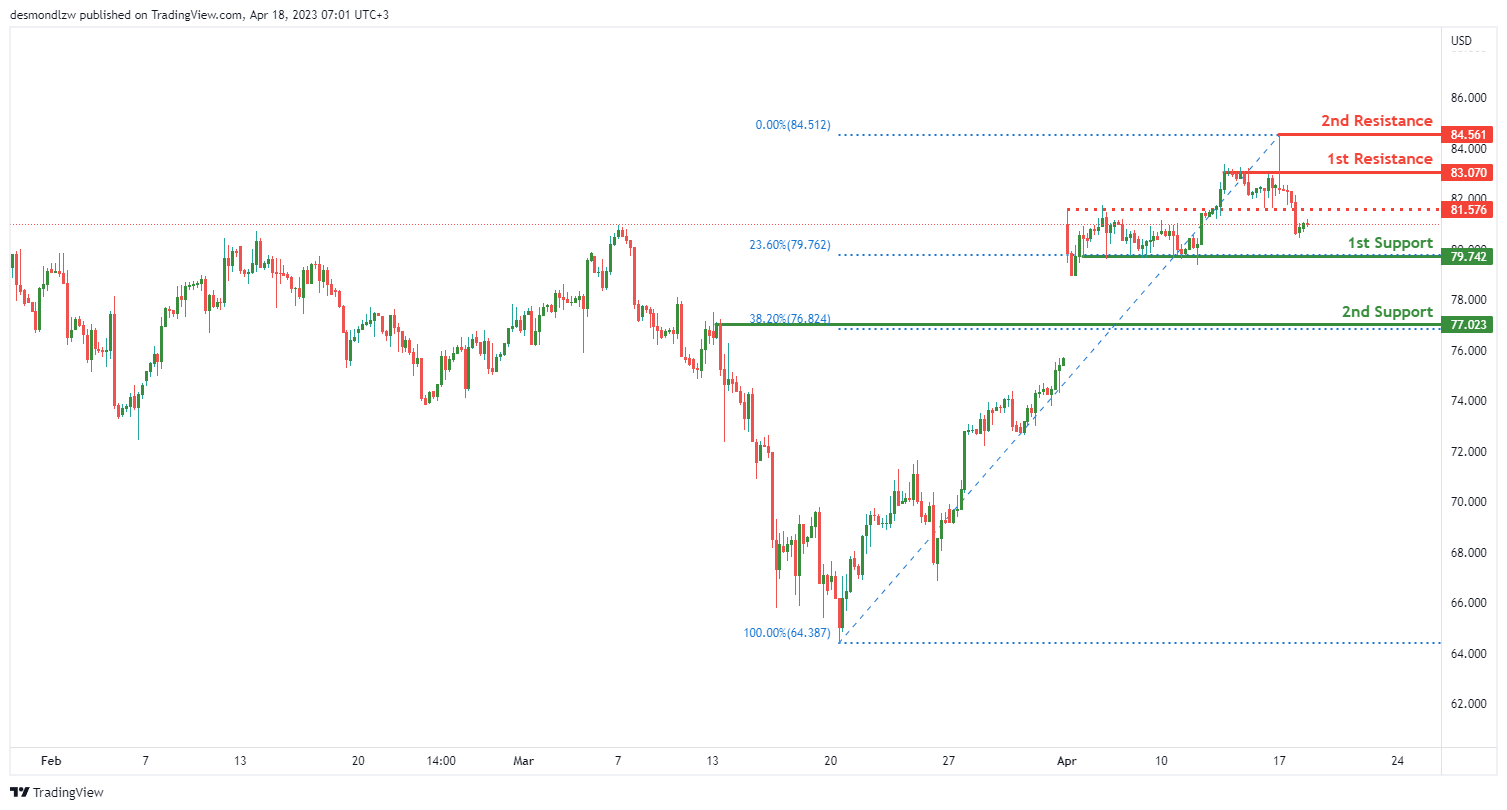
The WTI chart is bearish. The price could potentially continue to move bearishly towards the 1st support at 79.74, which is a good level as it is a pullback support and a 23.60% Fibonacci retracement level. If the price breaks below this support level, the 2nd support at 77.02 could provide another potential buying opportunity, as it is also a swing low support and a 38.20% Fibonacci retracement level.
On the other hand, if the price manages to move upwards, the 1st resistance at 83.07 could provide a challenge for the price to break through. This level is a pullback resistance and may act as a barrier for the price to continue moving higher. Additionally, there is a 2nd resistance at 84.56, which is a swing high resistance level and may provide further resistance if the price attempts to move higher.
There is also an intermediate resistance level at 81.57, which is a pullback resistance level. If the price manages to break above the 1st resistance, the intermediate resistance at 81.57 could provide another challenge for the price to continue moving higher.
XAU/USD (GOLD):
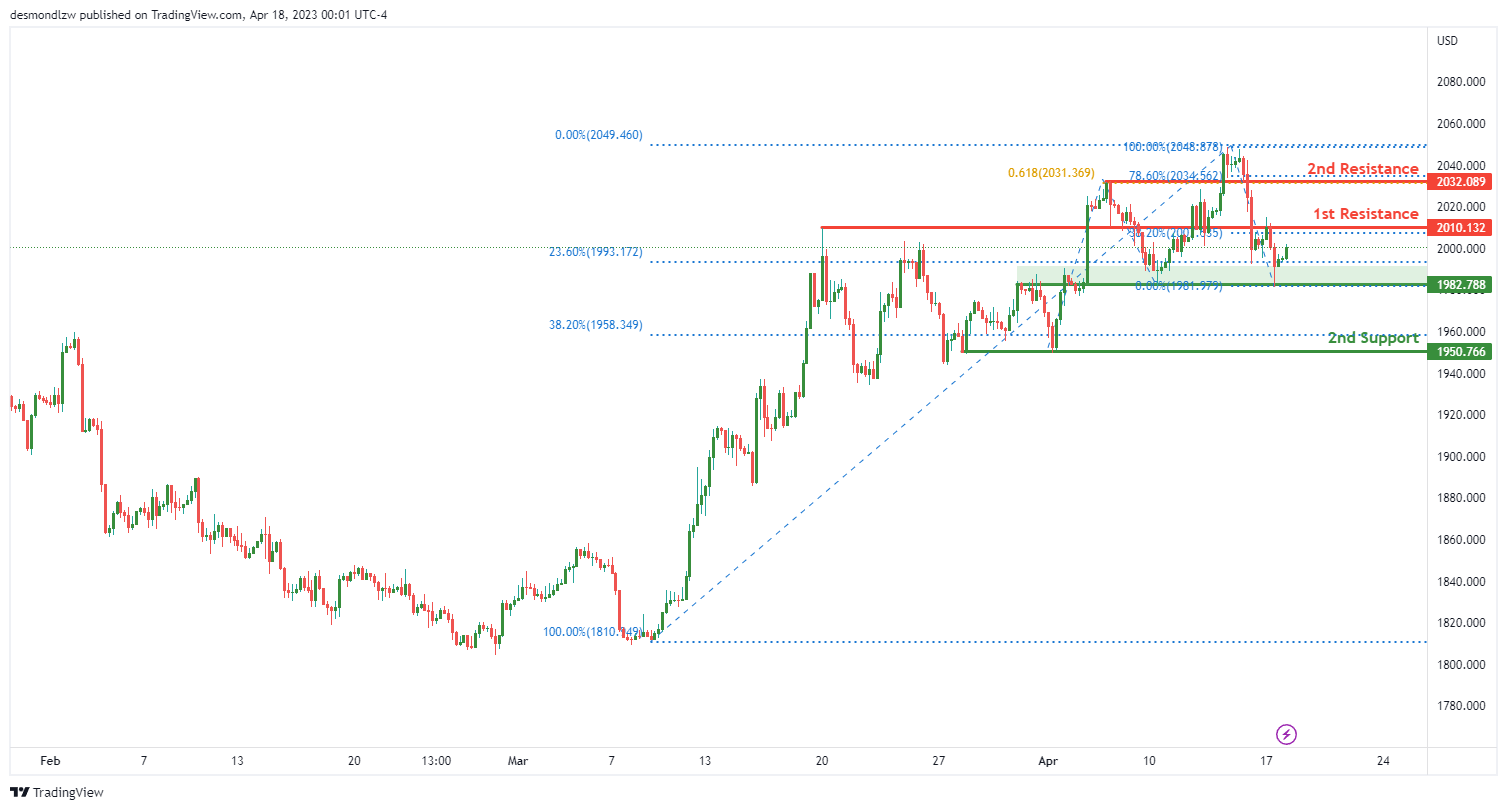
The XAU/USD chart is bullish. The price could potentially continue to move bullishly towards the 1st resistance at 2010.13, which is a good level as it is an overlap resistance and a 38.20% Fibonacci retracement level. If the price manages to break above this resistance level, the 2nd resistance at 2032.08 could provide another potential buying opportunity, as it is a pullback resistance and a 61.80% Fibonacci projection level.
On the other hand, if the price declines, the 1st support at 1982.78 could provide a potential buying opportunity. This support level is an overlap support and a 23.60% Fibonacci retracement level. If the price breaks below this support level, the 2nd support at 1950.76 could provide another potential buying opportunity, as it is a multi-swing low support and a 38.20% Fibonacci retracement level.
Elliott Wave Suggests USDJPY May See Sellers Soon
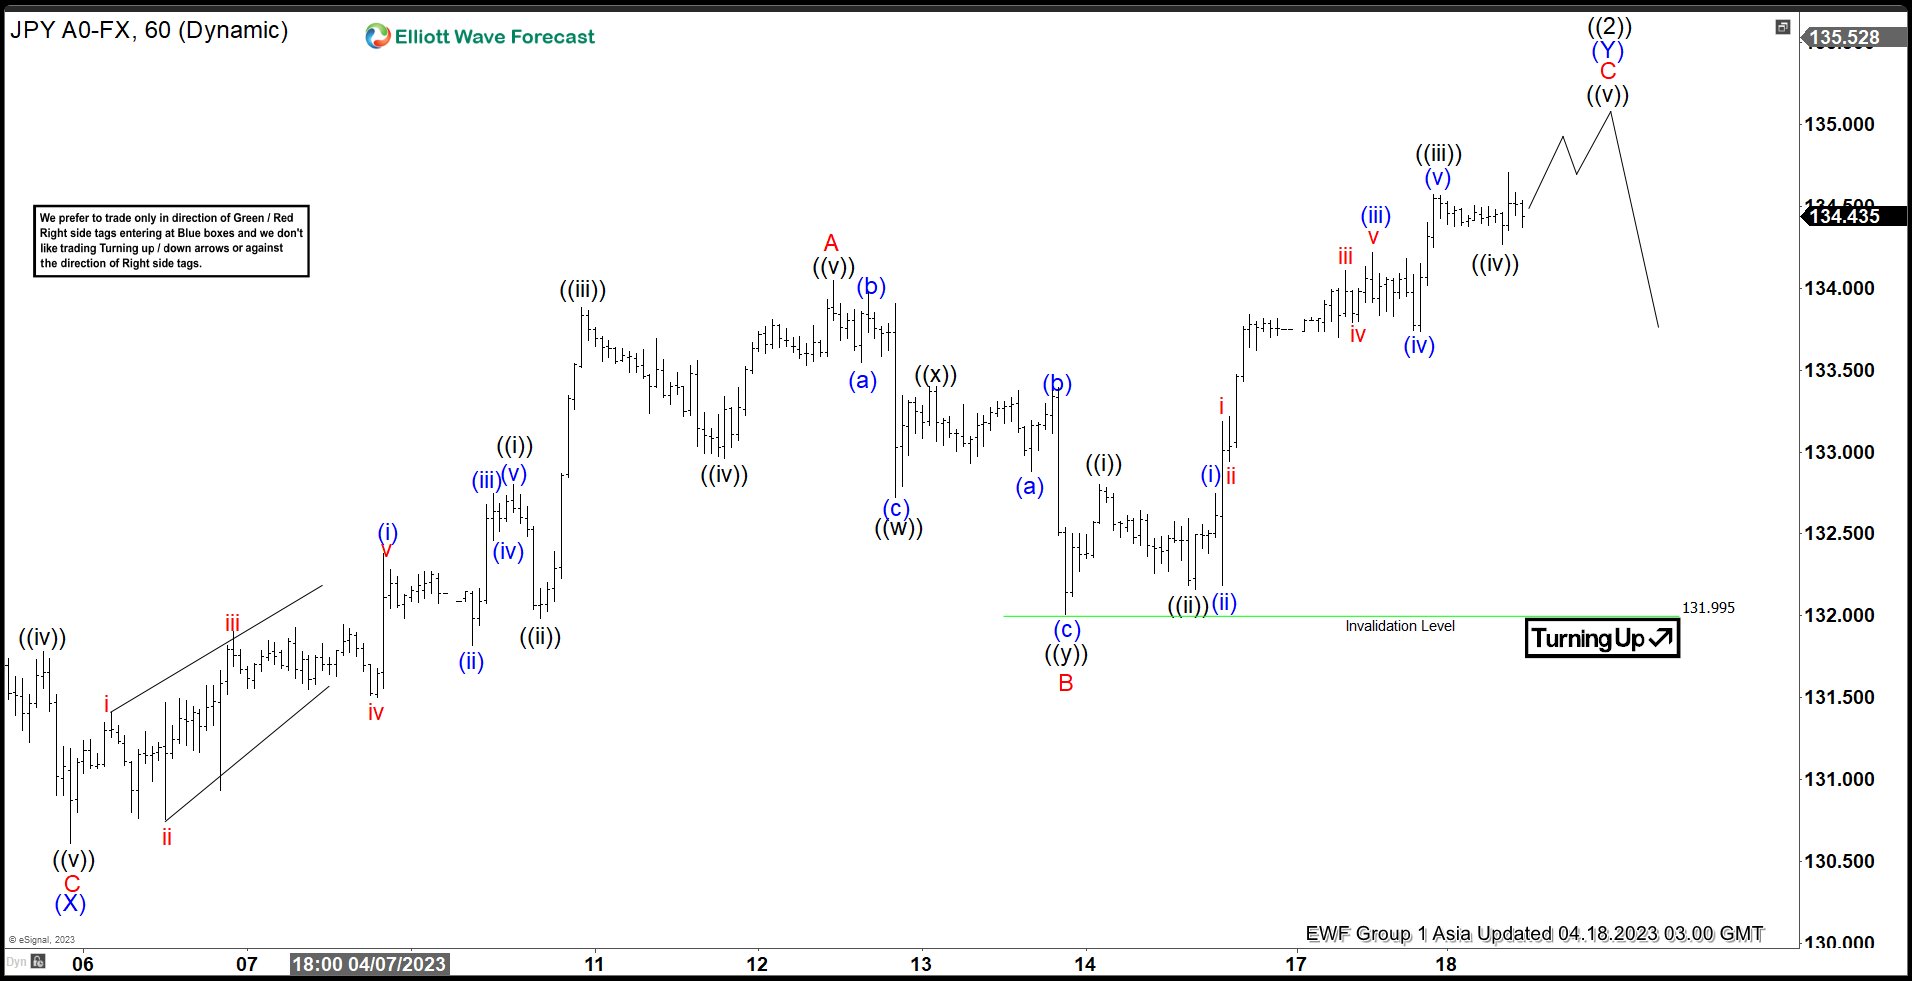
Cycle from 3.24.2023 low in USDJPY is unfolding as a double three Elliott Wave structure. Up from 3.24.2023 low, wave (W) ended at 133.75 and pullback in wave (X) ended at 130.61. Wave (Y) higher is in progress with subdivision as a zigzag structure as the 1 hour chart below shows. Up from wave (X), wave ((i)) ended at 132.8 and wave ((ii)) ended at 131.99. Wave ((iii)) ended at 133.88, wave ((iv)) ended at 132.96, and final leg wave ((v)) ended at 134.04 which completed wave A.
Pullback in wave B ended at 132 with internal subdivision as a double three. Down from wave A, wave ((w)) ended at 132.72, wave ((x)) ended at 133.4, and wave ((y)) lower ended at 131.99 which completed wave B. Up from wave B, wave ((i)) ended at 132.8 and pullback in wave ((ii)) ended at 132.16. Wave ((iii)) ended at 134.57, and pullback in wave ((iv)) ended at 134.26. Pair may extend higher a bit more in wave ((v)) to complete larger degree wave C of (Y) of ((2)), but regardless, expect pair to turn lower soon. Potential target for wave (Y) of ((2)) is 100% – 161.8% Fibonacci extension of wave (W) which comes at 134.8 – 137.4.
USDJPY 60 Minute Elliott Wave Chart
USDJPY Elliott Wave Video
https://www.youtube.com/watch?v=cmdpJ7_xiaY
UK job data and Canada CPI in focus, GBP/CAD pressing 55 D EMA
UK employment and Canada CPI data are the major focuses for today. BoE is clearly looking into economic data to assess how persistent inflation pressure remains. Another 25bps hike in May is still likely but that would depend on today's job data, in particular on wages growth, as well as tomorrow's CPI report.
Meanwhile, BoC is clear that an accumulation of evidence is needed before consideration of resumption of tightening. Today's CPI data might not be a determining factor on any near term move in BoC's policy. Yet, they still crucial for BoC to decide whether another hike is needed later in the year.
Technically, GBP/CAD's pull back from 1.6863 short term top extended lower this week. It's now pressure 55 D EMA (now at 1.6659). Strong rebound from current level will retain the case that it's merely in a near term correction. That is, another rise through 1.6863 should be seen sooner rather than later.
However, sustained break of the EMA will argue that GBP/CAD is already in correction to whole up trend from 1.4069. That would open up deeper fall through 1.6075 support, possibly to 1.5811 cluster support (38.2% retracement of 1.5069 to 1.6863 at 1.5796) before forming a base.
China’s Q1 GDP growth surpasses expectations, retail sales bounce
China's Q4 GDP growth outperformed expectations at 4.5% yoy, up from 2.9% in Q4, and beat expectation of 4.0% yoy. Retail sales in March saw a 10.6% yoy increase, the largest since June 2021. Despite the positive figures, industrial production rose by only 3.9% yoy in March, missing the anticipated 4.7%. Additionally, fixed asset investment saw a 5.1% ytd yoy growth in March, falling short of the expected 5.8%.
The National Bureau of Statistics (NBS) report on Tuesday cited challenges faced by China in the first quarter, including a "grave and complex international environment" and domestic tasks for reform, development, and stability.
USD/CNH has remained in a sideways pattern since dropping to 6.8100 in late March. 61.8% retracement of 6.6971 to 6.9963 at 6.8114 offered some support, halting the decline from 6.9963. However, a break of 6.9139 resistance is needed to confirm completion of the pullback. Without this confirmation, another fall is in favor, and a break of 6.8100 could lead to retesting 6.6971 low from January.
RBA minutes reveal considerations of rate hike and pause
The minutes from the RBA April 4 monetary policy meeting revealed that the Board weighed the options of a 25bps rate hike and a pause. On balance, there was a "a stronger case to pause at this meeting and reassess the need for further tightening at future meetings", after having "additional data and an updated set of forecasts". But members emphasized the to communicate clearly that "monetary policy may need to be tightened at subsequent meetings". RBA kept cash rate target unchanged at 3.6% at that meeting.
The case for a 25bps hike was primarily driven by concerns over high inflation and a tight labor market. The potential persistence of high inflation and two additional factors—upgraded near-term population growth projections and the risk of larger wage increases in parts of the economy—also supported further tightening.
On the other hand, the case for a pause stemmed from the already restrictive monetary policy following significant tightening in a short period, with the full effects on the economy yet to be observed. Tighter monetary policy had contributed to a housing market slowdown, decelerated consumption growth, and financial pressure on some households with housing loans. The value of pausing lay in the opportunity to gather additional data on various economic indicators and to receive updated forecasts from the staff, which would be invaluable in reassessing the economic outlook and determining the extent of further tightening needed.
(RBA) Minutes of the Monetary Policy Meeting of the Reserve Bank Board
Sydney – 4 April 2023
Members present
Philip Lowe (Governor and Chair), Michele Bullock (Deputy Governor), Mark Barnaba AM, Wendy Craik AM, Ian Harper AO, Carolyn Hewson AO, Steven Kennedy PSM, Carol Schwartz AO, Alison Watkins AM
Others present
Luci Ellis (Assistant Governor, Economic), Bradley Jones (Assistant Governor, Financial System), Christopher Kent (Assistant Governor, Financial Markets)
Anthony Dickman (Secretary), David Norman (Acting Deputy Secretary)
Andrea Brischetto (Head, Financial Stability Department), David Jacobs (Head, Domestic Markets Department), Marion Kohler (Head, Economic Analysis Department), Penelope Smith (Head, International Department)
International economic developments
Members commenced their discussion of the global economy by noting that inflation remained high and well above central banks' targets. Inflation in many economies had declined from earlier peaks but progress in returning inflation to target had slowed. Recent monthly core inflation data had been higher than expected in a range of advanced economies. Nevertheless, inflation in advanced economies was still expected to decline over coming quarters as economic activity slowed and input price pressures continued to dissipate.
Indicators of domestic demand across advanced economies had been mixed. Retail sales had increased in early 2023 in a few economies, although volumes generally remained below their peaks. The housing sector remained subdued in many economies, reflecting the tightening of monetary policy over the prior year. Most of these indicators pre-dated the financial stability concerns and financial market volatility prompted by bank failures in the United States and Switzerland. However, members observed that very timely measures of activity in the services sector had been resilient; survey measures of services output had remained solid in March in many countries and household sentiment in the United States had been little affected. At the same time, some commodity prices had declined.
Members noted that labour markets had remained tight, but less so than a few months earlier. Employment growth had moderated in a number of advanced economies over the preceding six months. Although job vacancy rates had declined, they remained unusually high. Central banks and Consensus Economics' panel were forecasting that unemployment rates would increase gradually from their multi-decade lows in many advanced economies. Wages growth had slowed in the United States and United Kingdom but remained above rates consistent with their central banks' inflation targets.
Domestic economic activity in China had begun to recover rapidly in the early part of the year from earlier COVID-19-related disruptions. Services sector activity, retail sales and industrial production had all recovered strongly in the first two months of 2023. Leading indicators suggested an improvement in property-related activity was under way following an extended period of weakness; new housing sales had increased sharply in preceding months and new property prices had increased in most cities. Chinese authorities had announced a target for output growth in 2023 of 'around 5 per cent'.
Members observed that commodity prices had mostly declined over the prior month, alongside heightened volatility in financial markets and the associated increase in uncertainty about the economic outlook. Oil prices had initially declined but had reversed following an announcement by the Organization of the Petroleum Exporting Countries in early April of forthcoming production cuts; oil prices remained around 30 per cent below their peak level following Russia's invasion of Ukraine in February 2022. Coal and gas prices had also declined, but they remained well above levels that had prevailed in the years prior to the invasion. The iron ore price had declined a little and base metals prices had been broadly stable.
Domestic economic developments
Turning to the domestic economy, members noted that while inflation in Australia remained too high, the tighter monetary policy stance was gradually flowing through to the real economy. The labour market remained tight, but less so than a few months earlier. Recent data releases on employment, retail trade and business surveys had been broadly in line with expectations. However, estimates of population growth had been revised up, owing to stronger net overseas migration. This would have implications for the outlook for economic activity and the housing market, and possibly the labour market. Members also considered the impact this would have on inflation.
Recent prices data had remained consistent with the assessment that headline inflation peaked at the end of 2022. According to the monthly CPI indicator, which can be volatile, inflation had been 6.8 per cent over the year to February, compared with a peak of more than 8 per cent over the year to December 2022. Members noted that goods price disinflation had been an important driver of the moderation in outcomes in the monthly CPI indicator, consistent with the experience overseas. Other partial indicators of inflation from surveys, liaison and company earnings calls also showed that pricing pressures had eased somewhat since mid-2022. Nonetheless, inflation remained high and broadly based and services inflation had continued to increase. Long-term inflation expectations remained consistent with the inflation target.
Members noted that electricity prices would increase sharply in the September quarter. Regulators had released their draft determination of the default offers for retail electricity prices, with default offers expected to rise by 20–30 per cent in most states. If these increases flowed through to the market offers as expected, energy prices (for both electricity and gas) were expected to add ¼ percentage point to headline inflation over the 2023/24 financial year (after accounting for the estimated impact of the bill relief measures in the Australian Government's Energy Price Relief Plan).
Members observed that the labour market remained tight, although the balance between labour demand and supply had improved. A strong increase in employment and hours worked and a decline in the unemployment rate to 3.5 per cent in February confirmed that the soft outcomes in January were the result of changes in seasonal patterns rather than underlying weakness. Indicators of future labour demand had moderated since mid-2022 but remained high. While some measures of job advertisements had risen modestly in early 2023, the ABS measure of vacancies had continued to decline. Firms in the Bank's liaison program continued to report moderately positive hiring intentions and that finding suitable labour had become less of a challenge.
Members observed that timely indicators suggested wages growth remained solid. Wages measures derived from banking data and advertised salaries for newly listed jobs pointed to a further pick-up in wages growth in the March quarter. Firms in the Bank's liaison program expected annual wages growth in the private sector to level out at a little below 4 per cent. Wages growth in the public sector was likely to increase in coming quarters as recently announced state government wages policies take effect. Of note, the Fair Work Commission had awarded wage increases to NSW rail workers above the state wage cap and had commented that significant declines in real wages would occur under the existing NSW Government wages policy. The Australian Government had indicated that it supported increases in the minimum wage in line with inflation.
Measures of business conditions and capacity utilisation generally remained high. Even so, survey measures of business confidence and of forward-looking metrics, such as orders, painted a softer picture. The staff's assessment of information from the Bank's liaison program also suggested that private final domestic demand had moderated.
Growth in household consumption had remained sluggish in early 2023. Members acknowledged that higher interest rates, lower housing prices and declining real household incomes – reflecting the rising cost of living – were all dampening household consumption. Looking through recent volatility, the monthly value of retail sales had been little changed over the preceding six months or so. Card spending data and information from retailers pointed to subdued spending outcomes in March. Consumer sentiment remained at very low levels, particularly for the one-third of households with a home loan. The softness in consumer spending implied even weaker underlying demand in per capita terms, given the sharp increase in population growth.
Members noted that demand for new dwellings had fallen noticeably and that this would weigh on dwelling investment once the backlog of residential construction had been worked through. Construction firms faced a challenging combination of a weaker outlook for demand, longer construction timelines for existing projects due to staff shortages, and significant increases in input costs. Against this backdrop, information from the Bank's liaison program indicated that cash flow had become difficult to manage for some construction firms and more insolvencies in the industry were expected.
National established housing prices had steadied in March, following an 8 per cent decline from their peak around a year earlier. Members observed that it was possible that housing prices would stabilise earlier than previously expected and at a level above the previously forecast trough. Stronger fundamentals, including growth in population and nominal incomes, were likely providing an offset to the higher cost of credit. Housing prices in Sydney had increased modestly while the rate of decline had eased in most other capital cities. Rental markets remained very tight and this was continuing to flow through to growth in CPI rents. Residential vacancy rates in Sydney and Melbourne had seen the largest declines to be below their long-run average levels. The average household size had increased slightly in capital cities in preceding months and had been increasing for some time in regional areas.
International financial markets
Members noted that the recent banking system problems in the United States and Switzerland had created stress and volatility in financial markets, especially bond markets. The US Federal Reserve (the Fed) and the Swiss National Bank (SNB) had acted to restore confidence in banks by providing extraordinary liquidity support to banks.
Members observed that many central banks, including the Fed and the SNB, had nevertheless increased policy rates further to slow the pace of inflation in their countries. At the same time, financial stability concerns had caused market-implied expectations of the path of policy rates to decline sharply. Market pricing was consistent with participants ascribing some probability to a wide range of scenarios. These included the possibility of a sharp slowdown in economic activity related to further strains in the banking system and other scenarios where problems in the banking system are contained and central banks need to tighten policy further to address high inflation.
Government bond yields had declined and their volatility had increased significantly, particularly for shorter term maturities, as market participants adjusted their expectations for the path of policy rates and demand for liquidity increased. Lower sovereign yields had partly offset a broader tightening in global financial conditions associated with higher spreads on corporate debt, particularly for lower-rated issuers, and a decline in equity prices. Members noted that there had been very little issuance of corporate bonds rated below investment grade in the United States and Europe in the wake of the problems in the banking system. While equity prices had since largely recovered for the broader market, equity prices of banks were still noticeably lower amid concerns about their future earnings. Banks may have reduced capacity to expand their lending to households and businesses as investors had become more cautious about providing funding to banks and via markets more generally. Members noted that, although financial stability concerns had eased somewhat over the week preceding the meeting, the overall tightening of financial conditions would be an additional headwind for the global economy.
Members noted that conditions in foreign exchange markets had remained relatively stable. The Australian dollar had depreciated a little following the monetary policy decision at the previous meeting and again as global financial stability concerns had emerged. However, over the preceding year or so the Australian dollar had been steady on a trade-weighted basis. The cost of funding US dollars through foreign exchange swap markets had increased for some currencies following the failure of Silicon Valley Bank, especially for the yen and the euro, but the increase had subsequently been largely reversed following coordinated action by several central banks to improve the provision of liquidity. This included offering liquidity via standing US dollar swap line arrangements. The price of Australian dollar swaps had been little changed over the prior month.
Domestic financial markets
Developments abroad had led to volatility in Australian financial markets. Members noted that these markets had continued to function and that conditions had subsequently improved. Banks had been well advanced with their funding plans prior to the episode, so they had been able to pause their issuance of securities during the period of strain in global markets around mid-March. They had since resumed issuance both domestically and offshore, and overall volumes were ultimately above average in March. Similar trends were also evident in the domestic mortgage- and asset-based securities markets, which are an important source of funding for non-banks.
Members observed that there had been only a small effect on banks' funding costs from higher risk premiums in global markets. Spreads on banks' bonds had risen slightly, and by much less than had been seen during the pandemic or the global financial crisis, suggesting a high level of confidence in markets about the creditworthiness of Australian banks. Similarly, equity prices had declined a little for Australian banks but by much less than for other major banking systems.
Accordingly, banks and other Australian deposit-taking institutions (ADIs) remained well placed to repay loans from the Term Funding Facility (TFF) as these began to mature from early April. The TFF had lowered funding costs during the pandemic and the repayments would add a little to banks' overall funding costs. However, the TFF accounted for only a small portion of ADIs' overall funding. Some of the effect of the rise in the cash rate so far on the cost of this funding had also already occurred because ADIs had hedged at least part of their TFF funding back to short-term interest rates.
Members considered the effect of the monetary policy tightening to date and noted that the earlier increases in the cash rate had continued to flow through to household mortgage payments. This was one of a number of channels through which tighter monetary policy was affecting the economy. Required mortgage payments, which encompass interest and scheduled principal payments, had reached around 9 per cent of household disposable income. Members noted that, based on the current cash rate and as a share of household disposable income, these required payments were projected to be around an historic high later this year and reach around 10 per cent late in 2024. The further increase reflected variable-rate mortgages taking a little time to adjust to earlier cash rate movements and the further expiration of fixed-rate loans. Banks had announced further increases to advertised deposit rates in February and March, although the cumulative increase in overall deposit rates remained less than the increase in the cash rate.
In aggregate, the rate at which households were making extra mortgage payments in addition to their scheduled payments had slowed, suggesting less free cash flow. However, members noted that these payments tended to be lower in the second half of the financial year compared with the first half and that mortgage holders still had a large stock of additional savings buffers.
The Board's decision to increase the cash rate in March had been widely anticipated and the accompanying communication had moderated expectations for future increases. Market-implied expectations for the cash rate subsequently fell further, in tandem with moves in other advanced economies, following developments abroad. Members noted that current market pricing suggested that the cash rate was expected to be unchanged in coming months before being lowered later in the year. However, as was the case abroad, market pricing reflected an average of both upside and downside scenarios. Market economists had expected, in roughly equal number, either a pause in the cash rate at the current meeting or a further increase of 25 basis points, although most had expected one or two further increases in the cash rate at some point over the months ahead.
Financial stability
Members discussed the Bank's regular half-yearly assessment of financial stability risks.
Members noted that financial stability risks had increased globally despite loan arrears remaining very low. The failure of some regional banks in the United States in March had occurred because of weaknesses in their business models and risk-management practices. The vulnerabilities that had left these banks susceptible to a run on their deposits were not systemic across larger US banks and other banking systems (including in Australia). Nonetheless, the heightened risk aversion, increased volatility in some financial markets and deterioration in liquidity conditions had caused liquidity stress to be transmitted to other parts of the international banking system. This had contributed to the regulator-facilitated takeover of Credit Suisse by UBS, following a lengthy period where concerns had been raised about Credit Suisse's underlying profitability, risk controls and governance practices.
Members observed that the broader global banking system had remained resilient in the face of these stresses. While financial conditions had subsequently stabilised, supported by the actions of authorities and earlier reforms to ensure that large banks maintain high levels of capital and liquidity, banking regulators and policymakers more generally were considering the lessons to be drawn from recent events. This included how best to ensure banks remain resilient to shocks in the digital era, including because deposit withdrawals can occur more rapidly than in the past.
Members noted that if further banking stresses were to materialise, a more marked tightening in global financial conditions would ensue. This would increase borrowing costs further and reduce the supply of credit to households and businesses, which could accelerate a downturn in the broader credit cycle. Members noted that the combination of tighter monetary policy, high inflation and slowing economic growth was already putting financial pressure on some households and businesses in many countries. There also remained a risk that any disruptions in the functioning of financial systems could be amplified by liquidity mismatches at leveraged non-bank financial institutions, as had occurred on a number of occasions in preceding years.
While volatility in Australian financial markets had also increased in response to the recent global events, members observed that Australian banks were strongly positioned to weather this and continue lending to households and businesses. This reflected that fact that Australian banks are well regulated, strongly capitalised, profitable and highly liquid. Nonetheless, the Australian Prudential Regulation Authority had intensified its oversight of domestic financial institutions following recent events and, together with the Bank and other agencies of the Council of Financial Regulators, had been closely monitoring developments for any adverse effects on the financial system as a whole.
Turning to the financial position of Australian households and businesses, members noted that most were well placed to manage the impact of higher interest rates and inflation, supported by continued strength in the labour market and high savings buffers. However, this resilience was unevenly distributed. Some households and businesses were already experiencing financial stress, and the pressure on household budgets was likely to continue. Members noted that those households on lower incomes, including renters and relatively recent borrowers with larger debts relative to their income, were among those most affected. Smaller businesses, which tend to have more variable-rate debt and volatile income compared with larger firms, were more exposed to rising interest rates. Some building construction firms had faced ongoing margin pressures as a result of fixed-price contracts written before the sharp increase in input and labour costs. These firms had accounted for a large proportion of the recent pick-up in insolvencies to their pre-pandemic level. Banks' non-performing business loans had remained low as a share of total business lending.
Lenders were expecting an increase in the share of households and firms falling into arrears on their loans in the period ahead, but from a very low level. Further, the share of banks' housing loans in or close to negative equity was very low, reflecting the generally sound lending standards and large run-up in housing prices prior to the more recent declines. This would limit the losses for borrowers and banks in the event of default. Members noted that if unemployment were to rise more sharply than expected, the share of households and businesses falling into loan arrears would increase further. However, stress-testing exercises had suggested that banks would be well placed to continue lending to households and businesses even in the face of a substantial deterioration in economic conditions.
Members noted that commercial real estate valuations had recently declined from high levels in Australia and abroad, and that further declines were in prospect. The potential for a deterioration in underlying tenant demand, in response to slowing economic activity, was a source of downside risk to valuations for offices. However, Australian banks' exposures to commercial property were small and generally characterised by conservative lending standards. Non-bank institutional investors and foreign bank branches were more exposed to commercial real estate in Australia. While non-bank lenders also had some exposure to commercial real estate, and on slightly different terms from banks, their small size helped to limit potential risks to the financial system.
Finally, members noted the ongoing focus of regulators and financial institutions on a range of threats to financial stability arising from outside the financial system. These included the increasing intensity of cyber-attacks on financial institutions, the potential for an escalation in geopolitical tensions, which could result in disruptions to trade and international capital flows, and potential climate-related disruptions to parts of the financial system.
Considerations for monetary policy
In turning to the policy decision, members noted that inflation remained too high, the unemployment rate was very low and surveyed business conditions were still strong. At the same time, there had been a material slowing in the growth of consumer spending. Members noted that Australia's banking system was unquestionably strong and that the underlying issues that had sparked bank failures abroad were not present domestically because of the different structure of Australian banks and adherence to more stringent regulatory arrangements. They also noted that most households were well placed to navigate the financial challenges associated with higher prices and interest rates, especially if employment remained resilient. However, there were parts of the household sector that are under financial stress and, as a result, would have to scale back their spending to minimise the need to draw upon savings. Members also observed that financial market pricing implied an expectation that the cash rate would be unchanged for some time, but that this reflected the weighted average of a range of different scenarios.
Members began their discussion of what these factors meant for the policy decision by noting that it was still possible to navigate the narrow path of bringing inflation down in a timely way while keeping the economy on an even keel. They agreed that this remained the Board's aim but acknowledged that the path was a narrow one.
Members first discussed the case for a further 25 basis point increase in the cash rate target at this meeting. This case was again founded on the observation that inflation remained too high and the labour market was very tight. Members noted that the forecasts produced by the staff in February had inflation returning to the target range only by mid-2025 and that it would be inconsistent with the Board's mandate for it to tolerate a slower return to target. These forecasts were conditioned on monetary policy being tightened a little further. Overseas experience in preceding months also raised a concern that high inflation could be more persistent than had been expected. In addition, members noted that imbalances between demand and supply in the housing and energy markets may limit how quickly inflation declines. Members considered the argument that, in these circumstances, it was better to continue to raise interest rates to ensure inflation is brought back to target faster, noting that monetary policy could be eased quickly if an adverse shock caused inflation and economic activity to slow by more, or more rapidly, than forecast.
Members also noted that most households were in a strong financial position and would be able to absorb higher prices and interest rates without needing to materially draw down on their savings, although some households were already having to do so. Only a few households with mortgages were at risk of having negative equity in their homes, even if prices were to fall somewhat further.
Two other pieces of information accumulated since the previous meeting were relevant to the case for tightening monetary policy further.
One was the upgrade to near-term projections for population growth. Members noted that this could put significant pressure on Australia's existing capital stock, especially housing, which would in turn manifest in higher consumer prices. They observed that there were already signs that the recent fall in housing prices might be smaller and more short-lived than expected. Although higher immigration might reduce wage pressures in industries that had been experiencing significant labour shortages, members noted that the net effect of a sudden surge in population growth could be somewhat inflationary for a period. Members acknowledged that the rise in population growth was to some extent temporary and follows a period of very weak population growth.
The second piece of information was the increased risk of larger wage increases in parts of the economy, including in the public sector, later in the year. Members observed that the flowthrough to inflation from wages in social and public sector industries is somewhat diffuse, given the prevalence of administered prices, but judged that it was nonetheless likely to have some impact. Overall, wages growth remained consistent with the inflation target, provided there was some pick-up in productivity growth.
Members then discussed the case for not changing monetary policy at this meeting. This case rested on the observation that monetary policy had already been tightened significantly in a short period. The full effects of this on the economy were yet to be observed, given the lags in the transmission of monetary policy. Members judged that monetary policy was already restrictive. For example, given the current cash rate, required repayments on home loans, as a share of disposable income, were anticipated to rise to around their highest level on record. Members discussed the uncertainties surrounding the impact that this historically rapid increase in interest rates would have on the economy. They noted that there were already signs that tighter monetary policy had contributed to a slowdown in the housing market, a material slowing in consumption growth, and financial pressure for a segment of households with housing loans.
Members assessed the value of pausing at this meeting to gather more information on the economic outlook. Over the coming month, members observed that they would receive another quarterly reading on inflation, additional monthly readings on the labour market, household spending and business conditions, and further information on developments in the global economy and financial markets. The staff were also due to present a full set of updated forecasts at the following meeting. This suite of additional information would be valuable in reassessing the economic outlook and the extent to which monetary policy would need to be tightened further, especially given the range of uncertainties surrounding the outlook. Members also noted that pausing after a run of monetary policy changes would be consistent with the typical pattern of policymaking before the pandemic.
Members recognised the strength of both sets of arguments, but, on balance, agreed that there was a stronger case to pause at this meeting and reassess the need for further tightening at future meetings. Members agreed that it would be helpful to have additional data and an updated set of forecasts before again considering when and how much more monetary policy would need to be tightened to bring inflation back to target within a reasonable timeframe.
In considering communication of the Board's decision, members observed that it was important to be clear that monetary policy may need to be tightened at subsequent meetings and that the purpose of pausing at this meeting was to allow time to gather more information. Members also agreed that the strength of the Australian banking sector meant that financial system resilience was not a consideration in the decision to pause at this meeting. They thought that the Board's future cash rate decisions would depend on developments in the global economy, trends in household spending and the outlook for inflation and the labour market. The Governor noted that his speech to the National Press Club the following day would provide an opportunity to explain these issues in more detail. He would also affirm that the Board remains resolute in its determination to return inflation to target and will do what is necessary to achieve that outcome.
The decision
The Board decided to leave the cash rate target unchanged at 3.6 per cent. It also decided to leave the interest rate on Exchange Settlement balances unchanged at 3.5 per cent.
GBP/USD Corrects Gains As Dollar Starts Recovery
Key Highlights
- GBP/USD started a downside correction from the 1.2550 zone.
- It traded below a major bullish trend line with support near 1.2410 on the 4-hour chart.
- EUR/USD also dipped and might test the 1.0880 support.
- The UK Claimant count could change -11.8K in March 2023.
GBP/USD Technical Analysis
The British Pound gained pace above the 1.2420 resistance against the US Dollar. GBP/USD climbed above the 1.2500 level before the bears appeared.
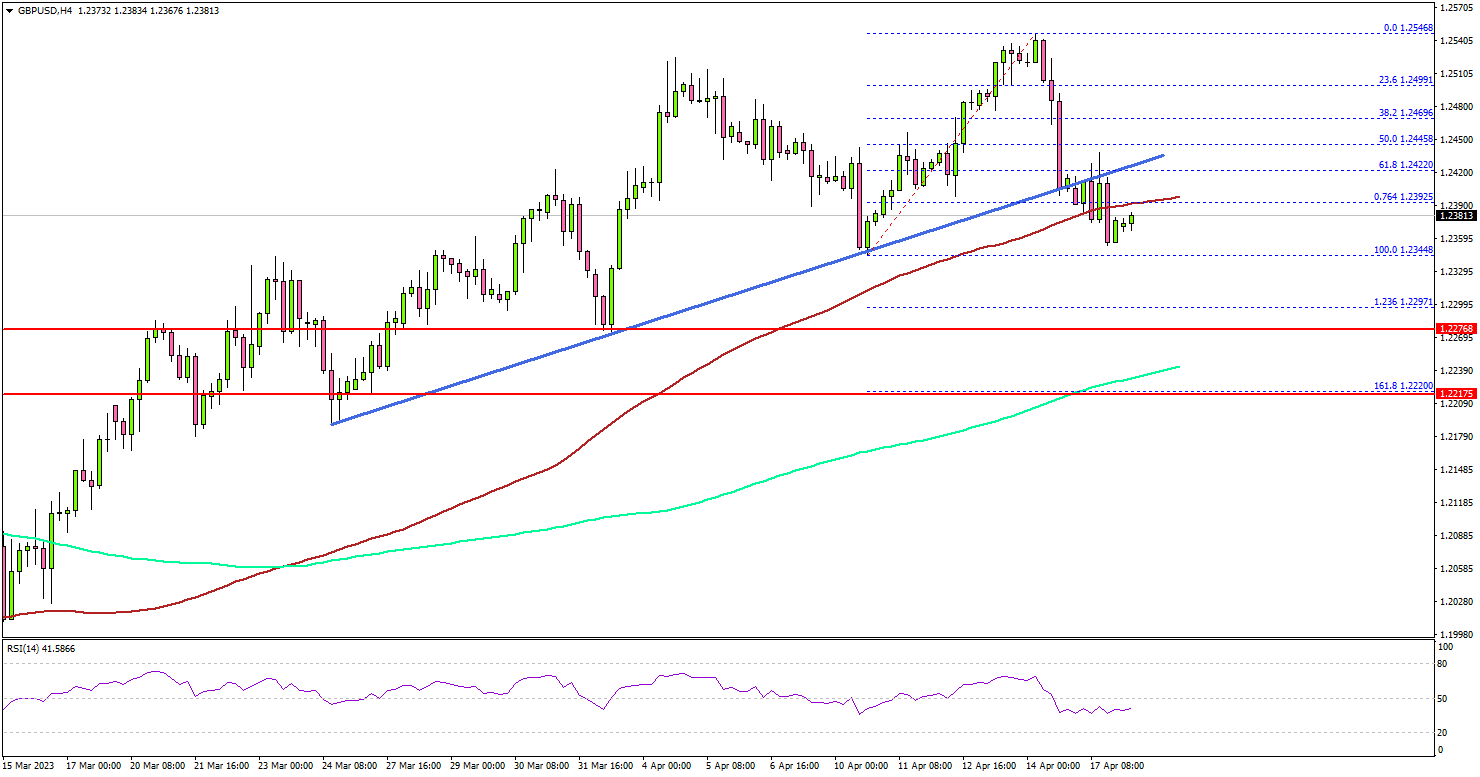
Looking at the 4-hour chart, the pair traded as high as 1.2546. Recently, it started a downside correction below the 1.2500 level. There was a move below a major bullish trend line with support near 1.2410.
The pair declined below the 61.8% Fib retracement level of the upward move from the 1.2344 swing low to the 1.2546 high. Finally, it tested the 1.2380 support and the 100 simple moving average (red, 4 hours).
The next support could be at 1.2300 or the 1.236 Fib extension level of the upward move from the 1.2344 swing low to the 1.2546 high. Any more losses might send GBP/USD toward the 1.2220 support or the 200 simple moving average (green, 4 hours)/
On the upside, the pair is facing resistance near the 1.2420 level. The next key resistance is near the 1.2450 zone. A clear move above the 1.2450 resistance might send the pair toward the 1.2500 zone. Any more gains might send the pair toward 1.2550.
Looking at EUR/USD, the pair corrected lower below 1.0950 and there is a risk of a move toward the 1.0880 support.
Economic Releases
- UK Claimant Count Change for March 2023 – Forecast -11.8K, versus -11.2K previous.
- UK ILO Unemployment Rate for Feb 2023 (3M) – Forecast 3.7%, versus 3.7% previous.
- Canadian Consumer Price Index for March 2023 (MoM) – Forecast +0.5%, versus +0.4% previous.
- Canadian Consumer Price Index for March 2023 (YoY) – Forecast +4.3%, versus +5.2% previous.