Sample Category Title
BoJ Governor Ueda: No immediate need to revise joint statement with government
In an appearance at the lower house financial committee of parliament today, BoJ Governor Kazuo Ueda stated that there is no immediate need to review a joint statement issued with the government about a decade ago. This statement, which is not legally binding, outlines the roles that the government and the BOJ should each assume in order to lift Japan out of deflation.
"We are going to approach meeting the 2% inflation target by keeping to monetary easing, although it may take time." He added that "the joint statement is appropriate and I don't see any immediate need to revise the target." Ueda's remarks point to a commitment to maintaining monetary easing in pursuit of the inflation target, while also urging companies to drive economic growth through higher wages and sustained inflation.
In an earlier session, Ueda clarified that the BoJ's Japanese Government Bond (JGB) purchases are managed in the context of achieving the 2% price stability target, and not to assist the government in acquiring financial resources.
EUR/CHF Daily Outlook
Daily Pivots: (S1) 0.9803; (P) 0.9821; (R1) 0.9838; More...
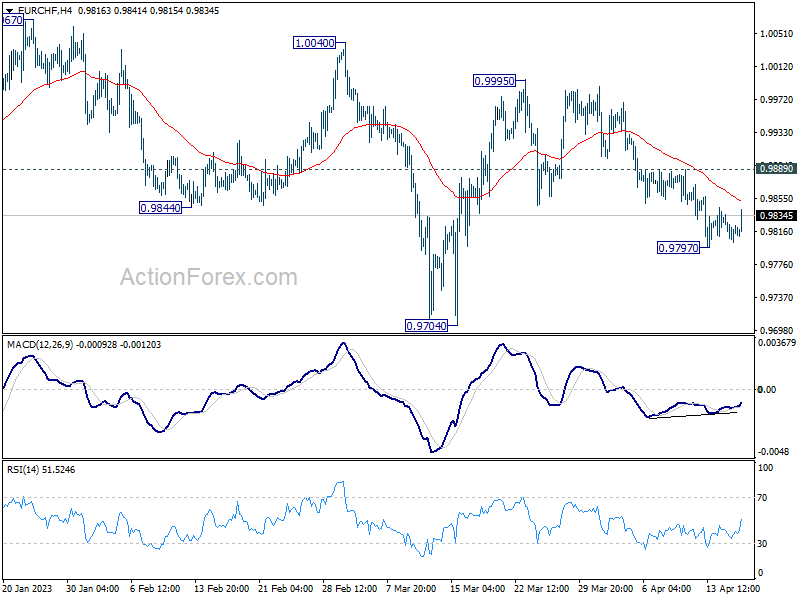
Intraday bias in EUR/CHF is turned neutral with a temporary low formed at 0.9797. Some consolidations could be seen first, but deeper decline is in favor with 0.9889 minor resistance intact. Break of 0.9797 will target 0.9704 support and possibly below, as whole corrective pattern from 1.0095 extends. On the upside, though, break of 0.9889 minor resistance will turn intraday bias back to the upside for stronger rebound.
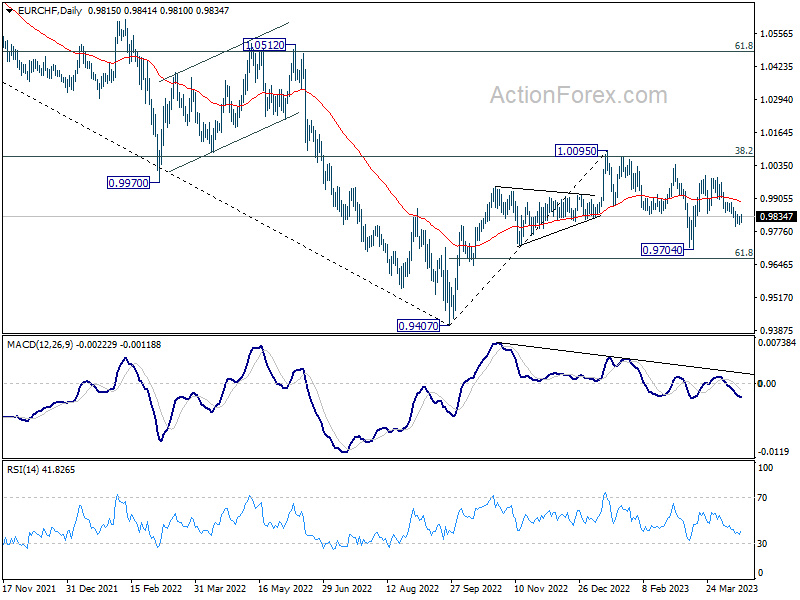
In the bigger picture, prior rejection by 55 W EMA (now at 0.9989) and 38.2% retracement of 1.1149 to 0.9407 at 1.0072 suggests that medium term outlook is staying bearish. That is, down trend from 1.2004 is not completed yet and is in favor to resume through 0.9407 at a later stage. However, decisive break of 1.0095 resistance will raise the chance of bullish trend reversal. Rise from 0.9407 should then target 1.0505 cluster resistance (2020 low at 1.0505, 61.8% retracement of 1.1149 to 0.9407 at 1.1484).
EUR/GBP Daily Outlook
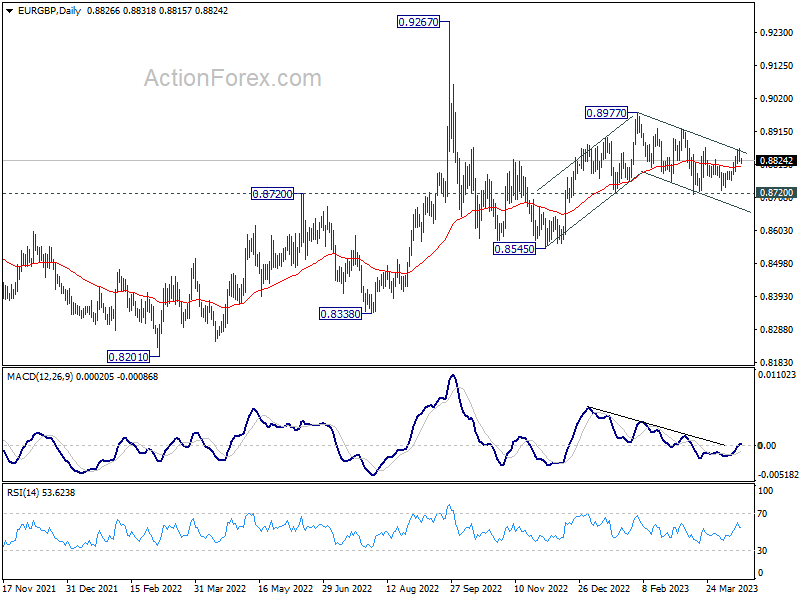
Daily Pivots: (S1) 0.8812; (P) 0.8838; (R1) 0.8855; More...
Intraday bias in EUR/GBP remains neutral for the moment. On the upside, firm break of 0.8864 will extend the rebound from 0.8717 to 0.8924 resistance. Further break there should confirm completion of the choppy decline from 0.8977, and should resume larger rise from 0.8545 through 0.8977 high. However, decisive break of 0.8717 support will resume the decline from 0.8977 instead.
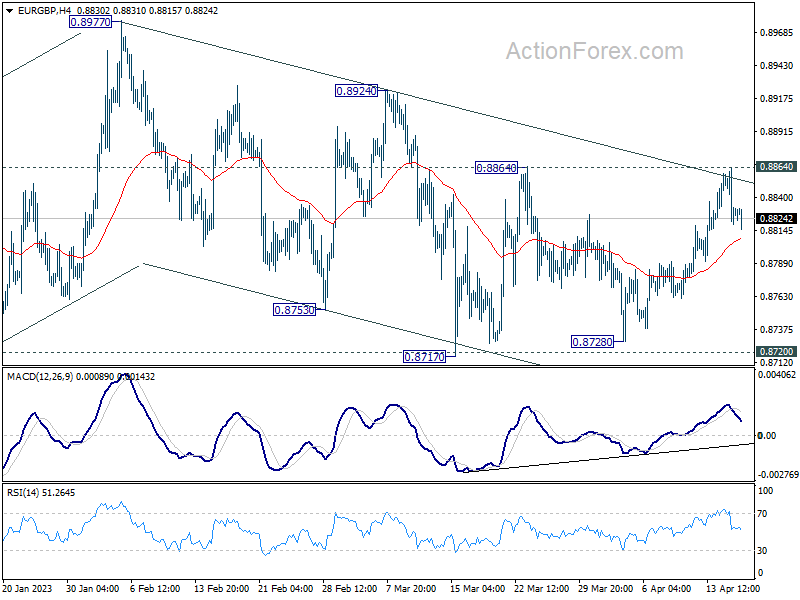
In the bigger picture, outlook remains rather mixed for now, except that price actions from 0.9267 (2022 high) are part of the long term range pattern from 0.9499 (2020 high). With 0.8720 support intact, rise from 0.8545 is in favor to continue through 0.8977. However, firm break of 0.8720 will argue that such rebound has completed, and open up deeper fall through this support level.
EUR/AUD Daily Outlook
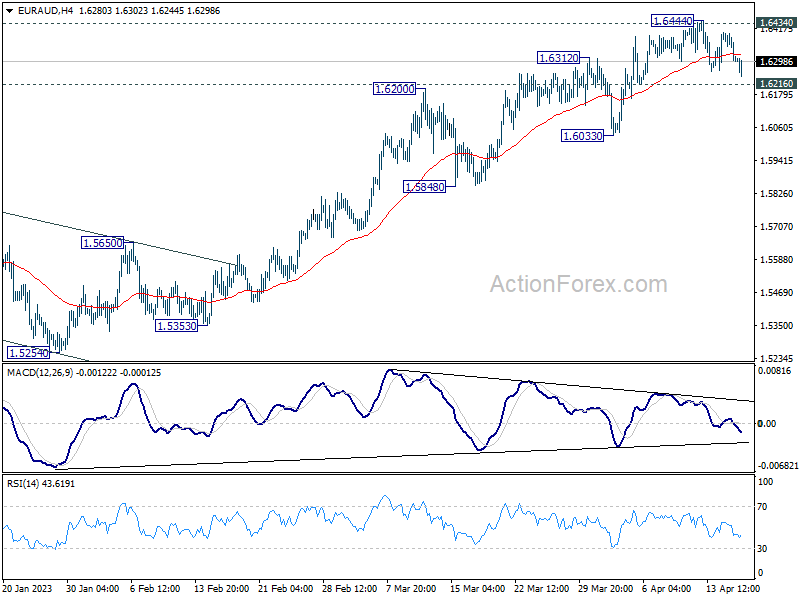
Daily Pivots: (S1) 1.6269; (P) 1.6337; (R1) 1.6375; More...
EUR/AUD is still bounded in range below 1.6444 and intraday bias stays neutral. On the upside, decisive break of 1.6434 resistance will carry larger bullish implications. However, considering bearish divergence condition in 4H MACD, firm break of 1.6216 should confirm short term topping, after rejection by 1.6389/6434 cluster resistance zone. Intraday bias will be back on the downside in this case, to 1.6033 support and possibly below.
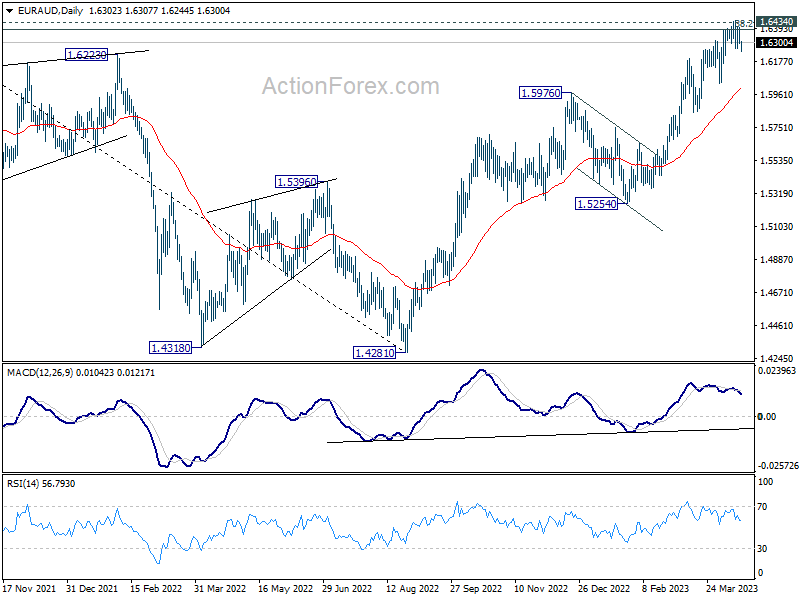
In the bigger picture, focus stays on 1.6389/6434 cluster resistance (38.2% retracement of 1.9799 to 1.4281 at 1.6389). Sustained break there should confirm that whole down trend from 1.9799 (2020 high) has completed. Further rally should then be seen to 61.8% retracement at 1.7691. However, rejection by this cluster resistance will make medium term outlook neutral at best.
EUR/JPY Daily Outlook
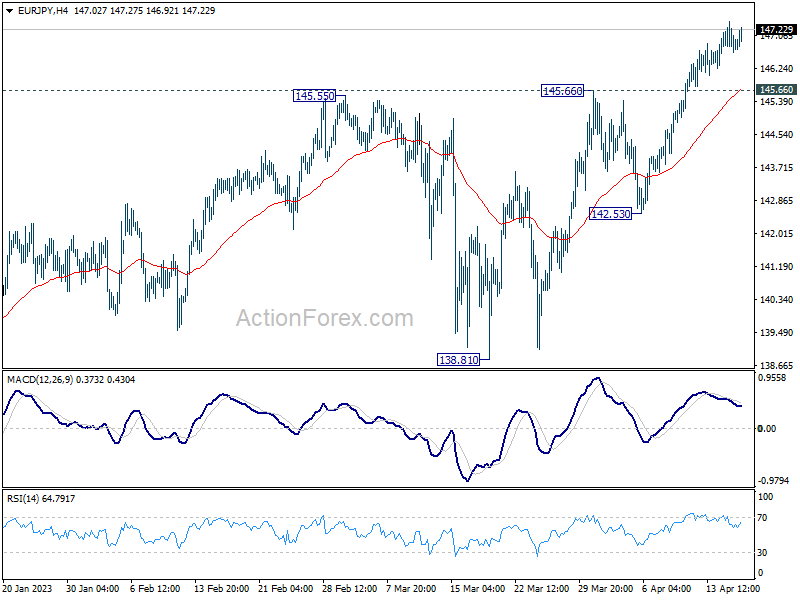
Daily Pivots: (S1) 146.59; (P) 147.03; (R1) 147.38; More....
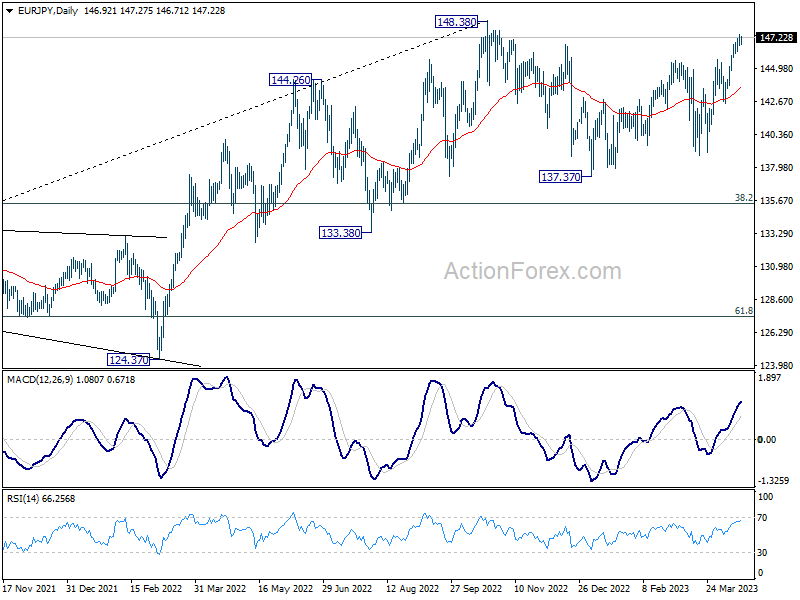
EUR/JPY is losing some upside momentum as seen in 4H MACD. But further rally is expected as long as 145.66 resistance turned support holds. Rise from 137.37 should target 148.38 high. Firm break there will resume larger up trend to 149.75 long term resistance. However, break of 145.66 will turn bias back to the downside for 142.53 support instead.
In the bigger picture, as long as 55 W EMA (now at 140.44) holds, larger up trend from 114.42 (2020 low) is still in progress for 149.76 long term resistance. Decisive break there will resume long term up trend. However, sustained break of 55 W EMA will bring deeper fall to 38.2% retracement of 114.42 to 148.38 at 135.40.
GBP/JPY Daily Outlook
Daily Pivots: (S1) 165.88; (P) 166.26; (R1) 166.81; More...
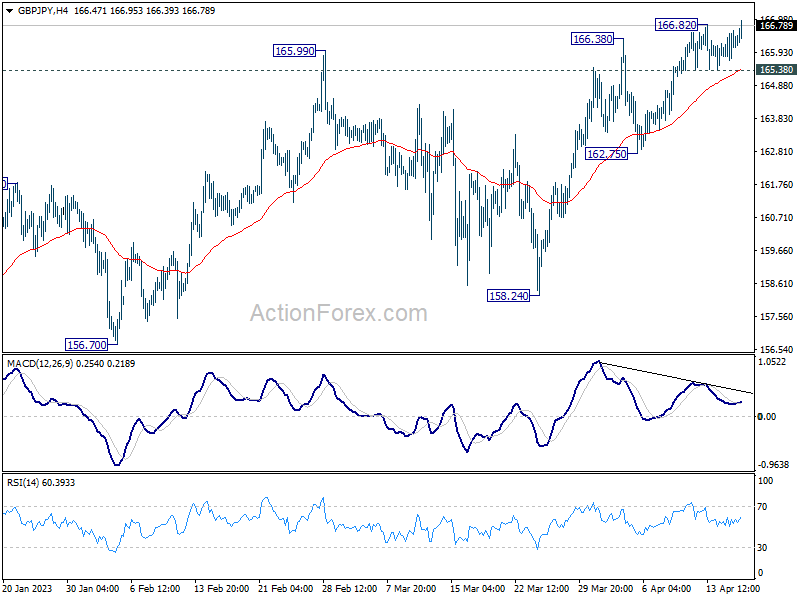
Breach of 166.82 temporary top suggests that rise from 155.33 is resuming. Intraday bias is back on the upside, and further rally would be seen to 169.26 resistance. On the downside, below 165.38 minor support will turn intraday bias neutral again. But still, outlook will stay cautiously bullish as long as 162.75 support holds.
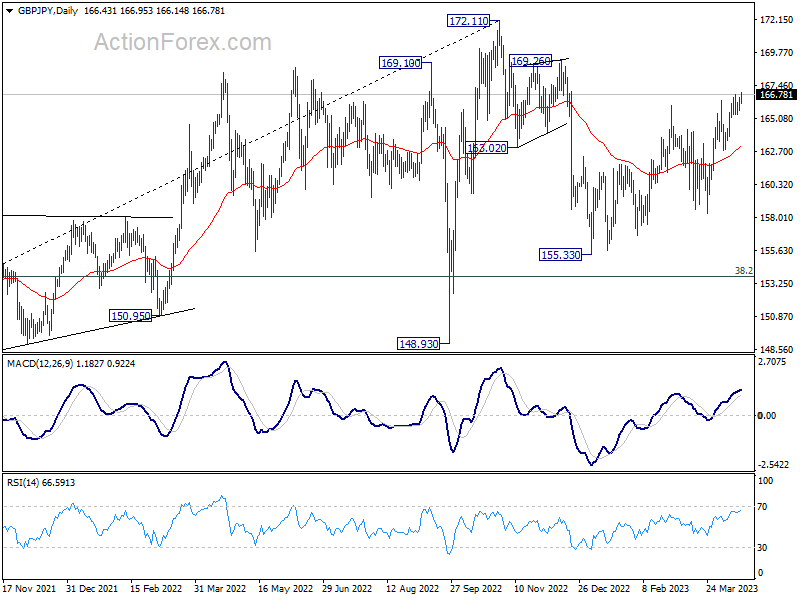
In the bigger picture, as long as 38.2% retracement of 123.94 (2020 low) to 172.11 (2022 high) at 153.70 holds, medium term bullishness is retained. That is, larger up trend from 123.94 (2020 low) is still in progress. Break of 172.11 high to resume such up trend is expected at a later stage.
GBPUSD Returns Back Inside Recent Rectangle
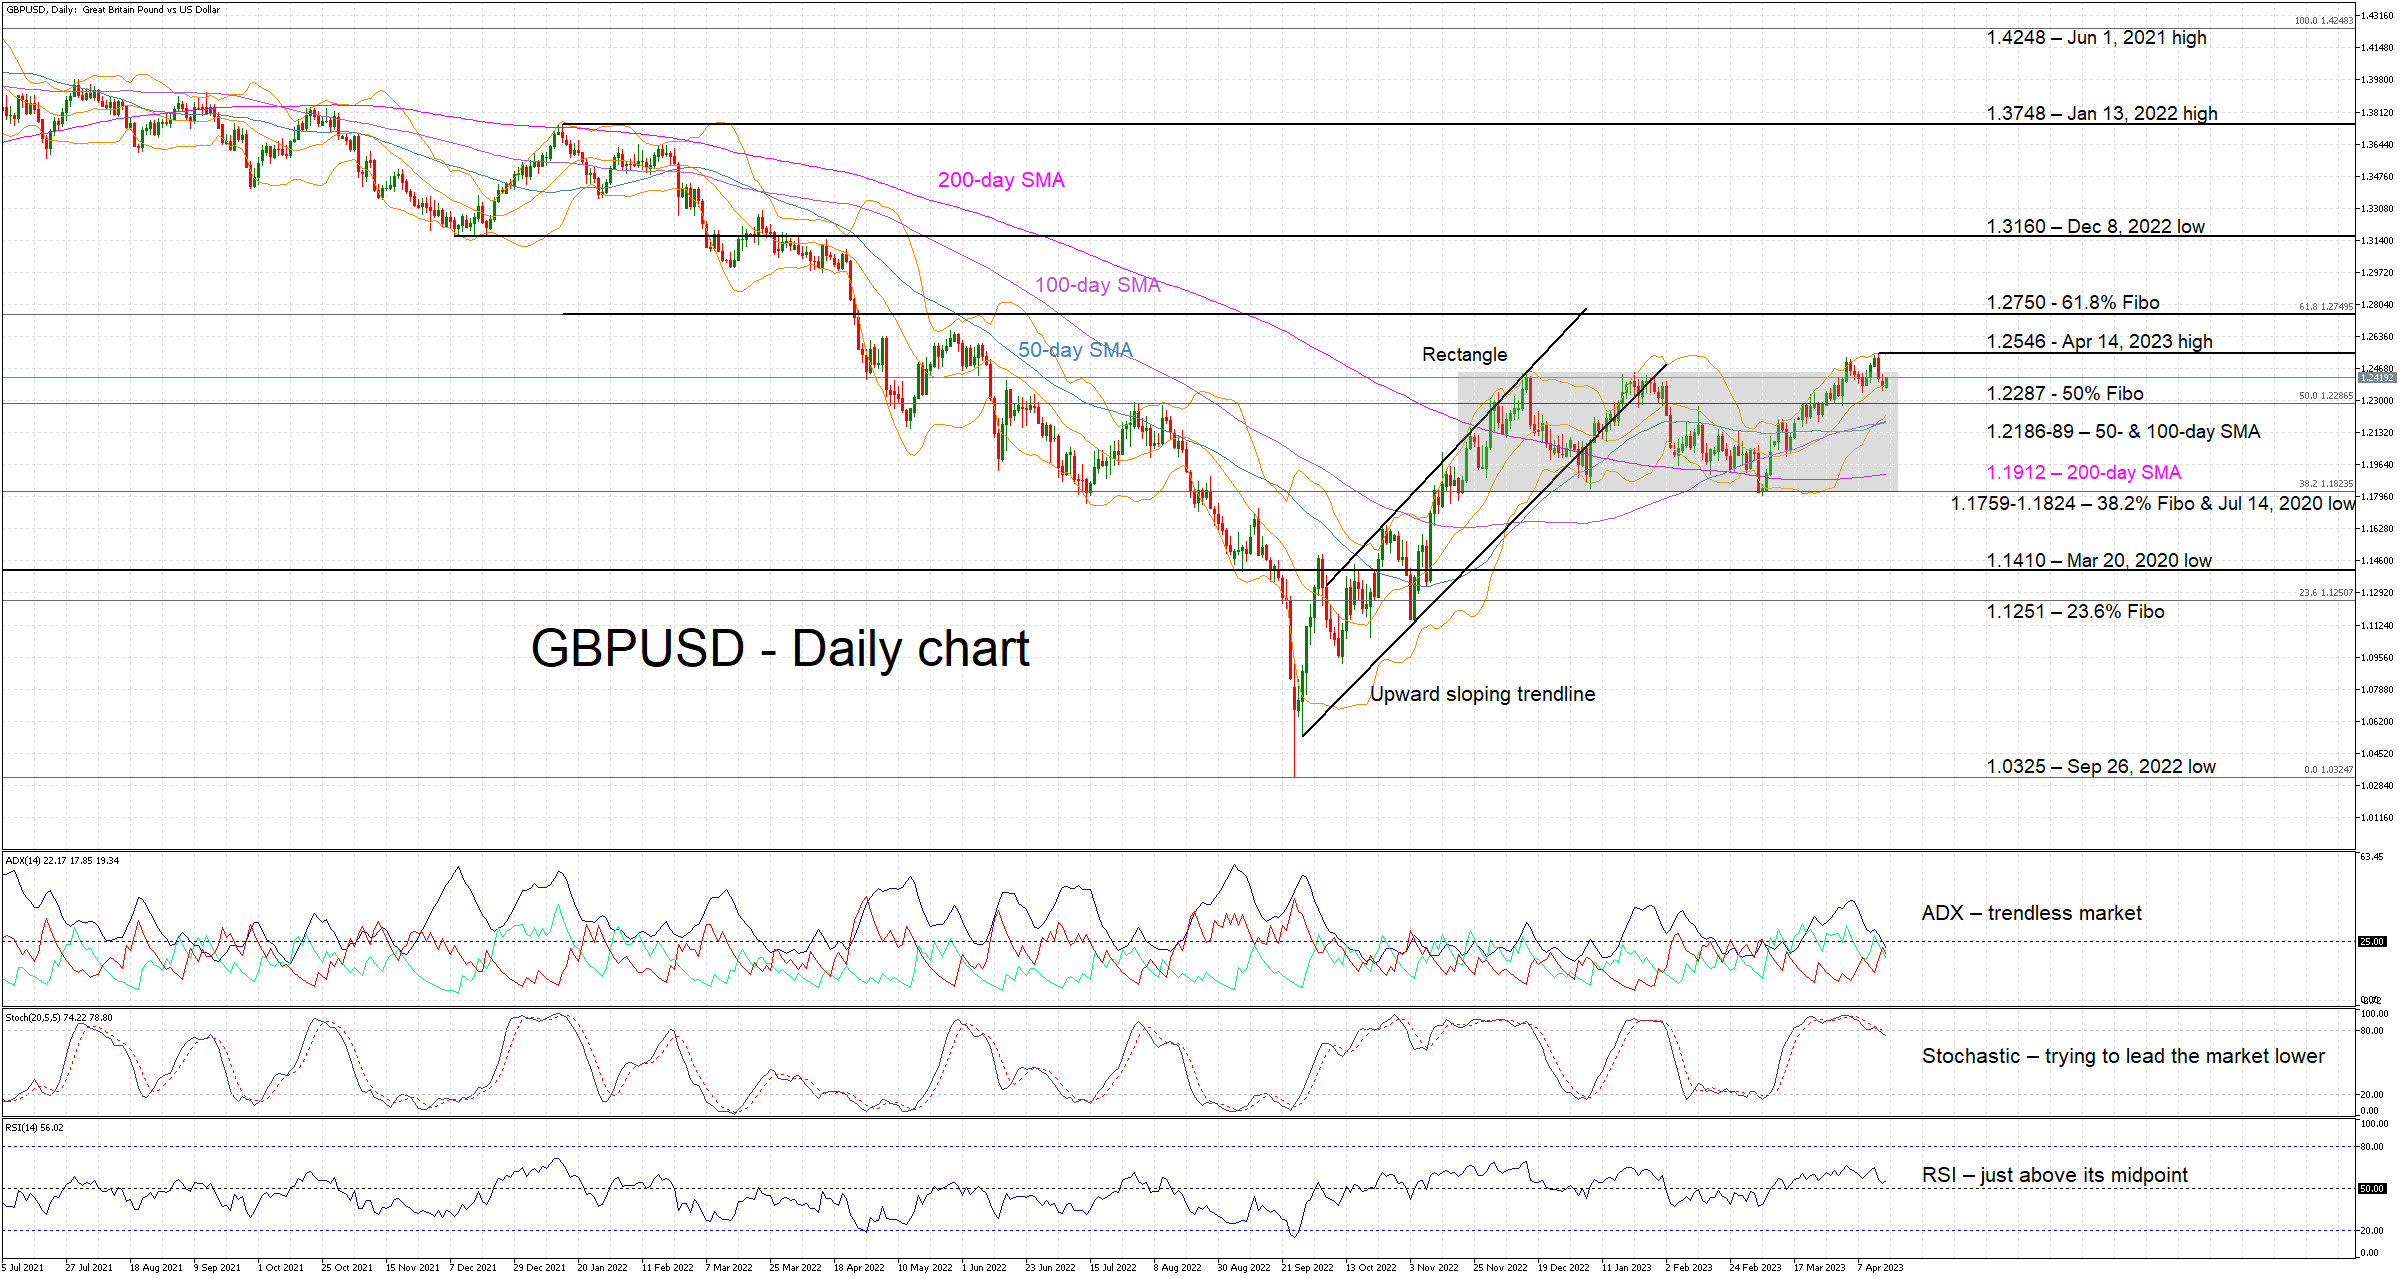
GBPUSD bulls’ upside breakout proved short-lived. They managed to record a higher high of 1.2546 on April 14, 2023, but the pair has returned back inside the rectangle that has formed since Nov 21, 2022. This range-trading activity has resulted in a tightening of the Bollinger Bands and a convergence of the 50- and 100-day simple moving averages (SMAs) respectively. Both are usually signals that a sizeable move is on the cards.
The momentum indicators could provide some clues on the direction of the next move. With the Average Directional Movement Index (ADX) confirming the trendless nature of GBPUSD, the focus turns to the RSI and the stochastic oscillator. The former is just above its midpoint, a sign of a balanced market. However, the stochastic has a more interesting story to tell. It has broken below both its moving average and the overbought territory. An even more aggressive drop could be the signal that GBPUSD bears have been waiting for.
Should this be the case, GBPUSD bears would potentially face support at the 50% Fibonacci retracement of the June 1, 2021 – September 26, 2022 downtrend of 1.2287. Even lower, the 50- and 100-day SMAs await them at the 1.2186-1.2189 range, just ahead of the 200-day SMA heavyweight at 1.1912.
On the other hand, GBPUSD bulls would enjoy staging another upside breakout and retest the April 14, 2023 high of 1.2546. If successful in breaking this level, they would potentially aim for the 61.8% Fibonacci retracement at 1.2750. The path then appears to be clear until the December 8, 2022 low of 1.3160.
To conclude, the failed upside breakout has increased the importance of the current rectangle. Bulls would prefer another retest of the recent highs, but the overall technical picture is not supportive of their intentions.
DXY: Waiting for the Final Wave of Bearish Double Zigzag
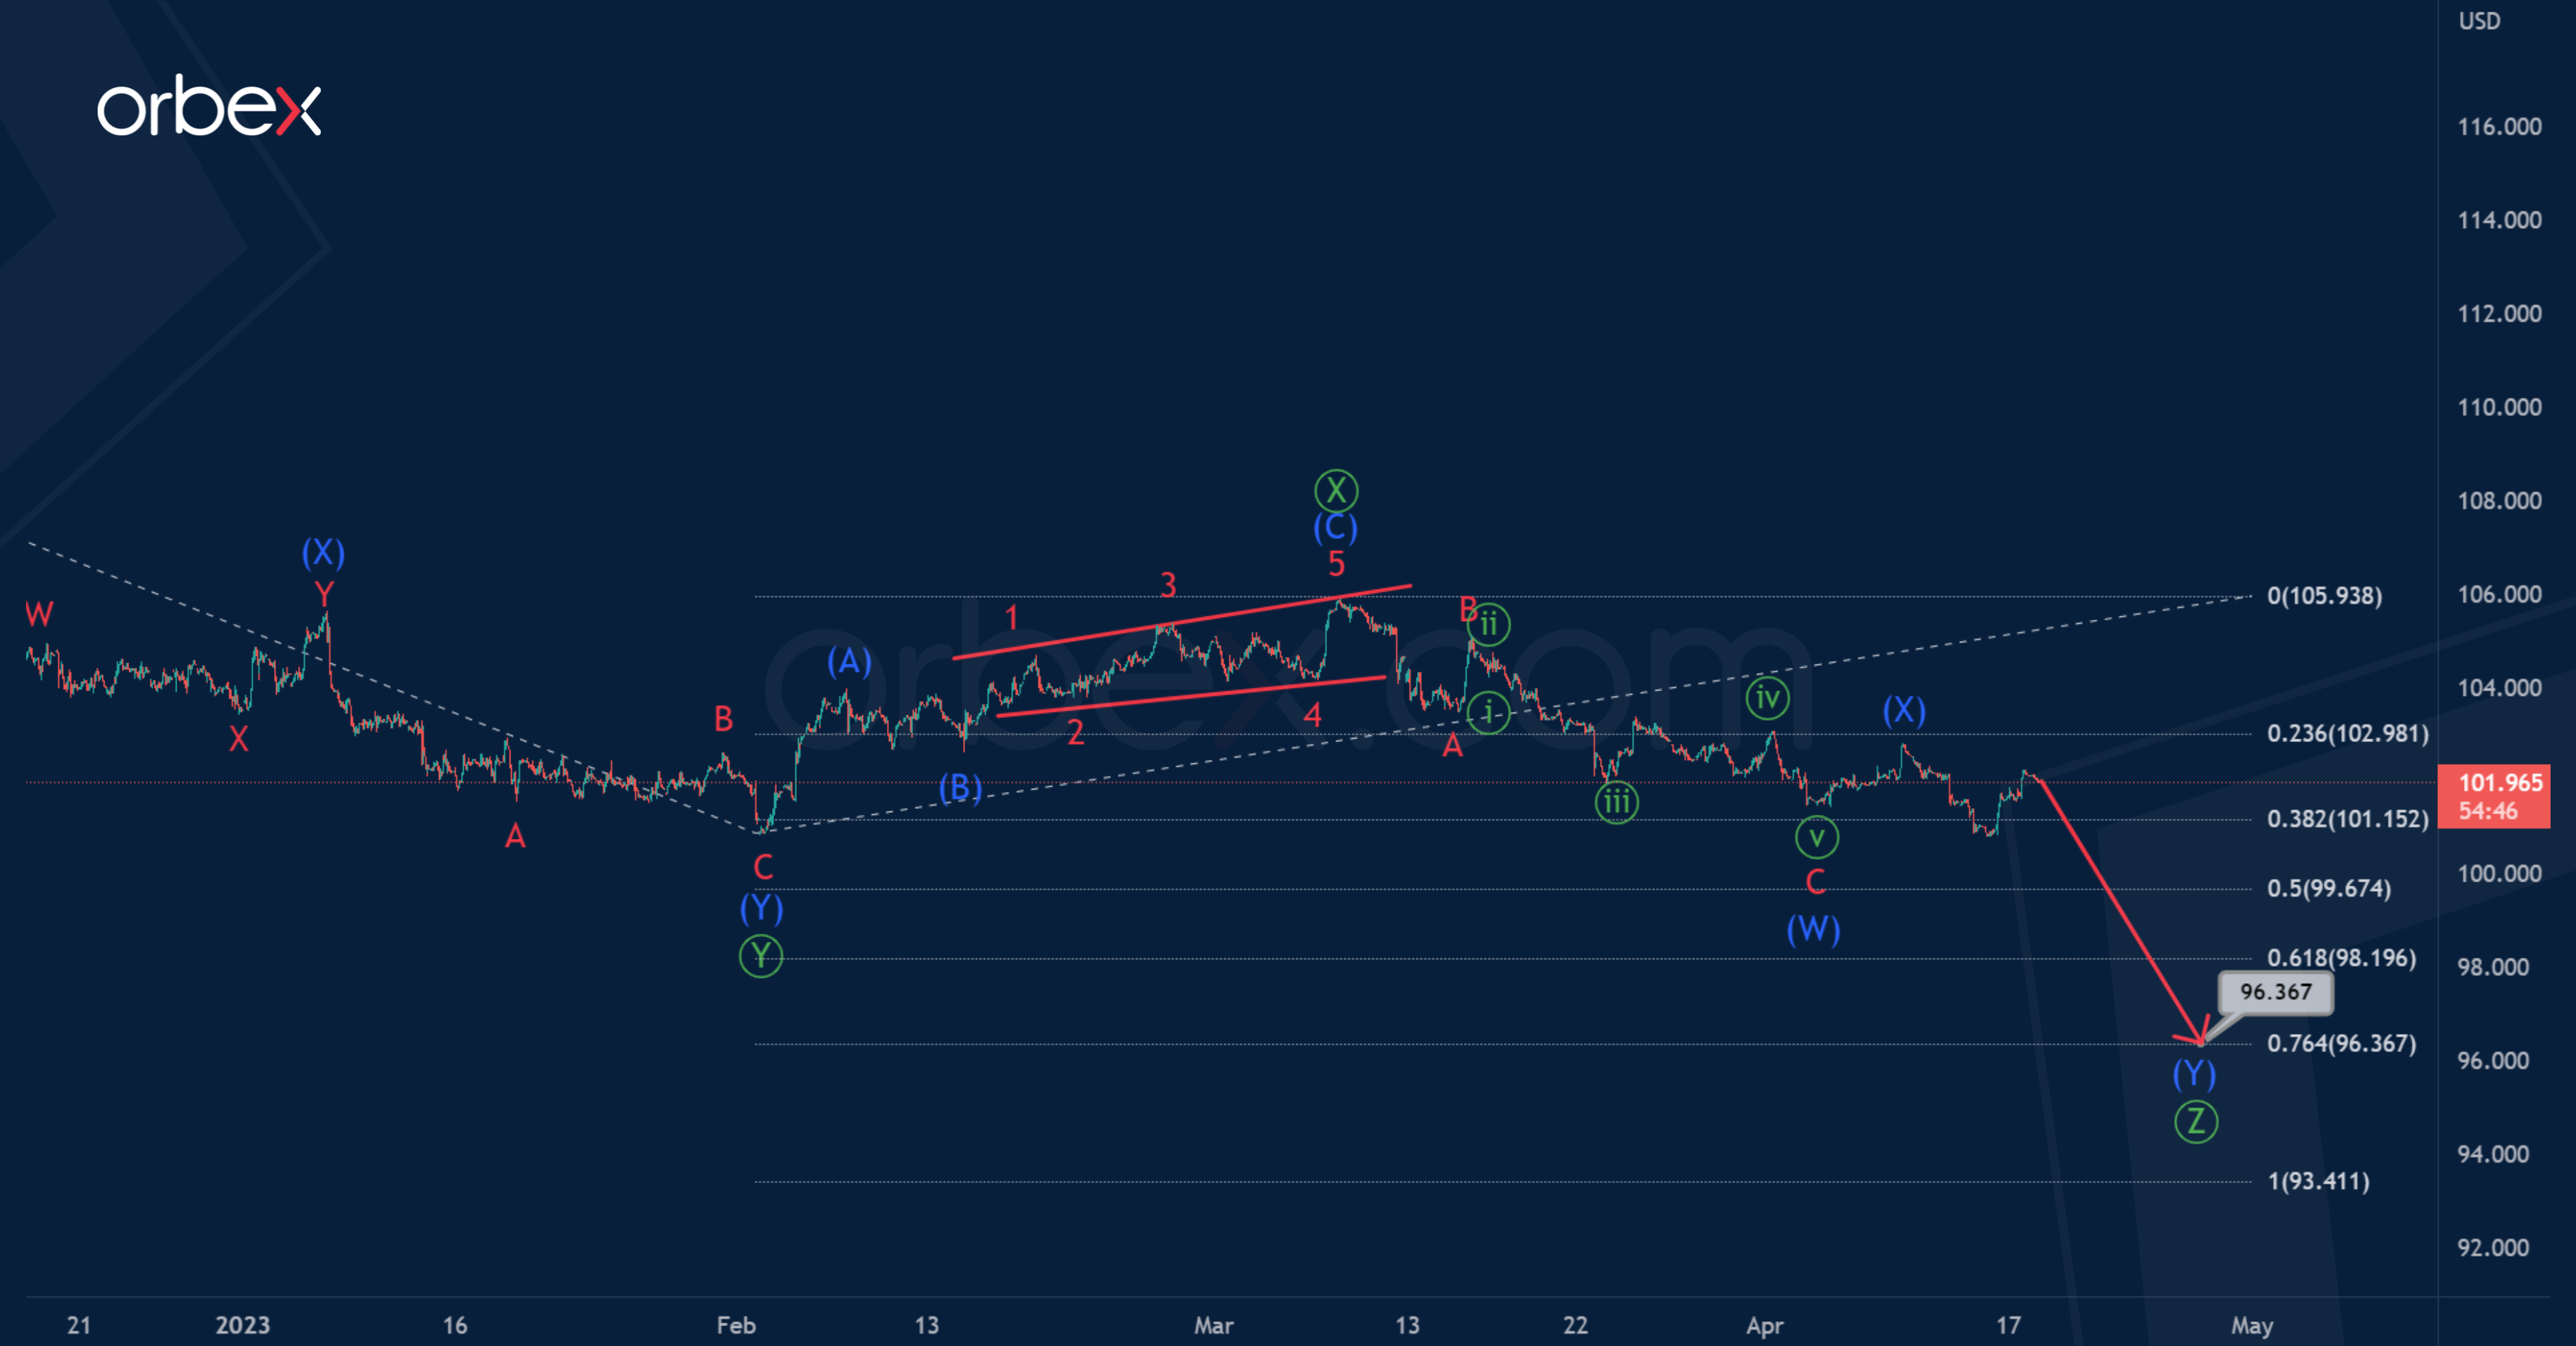
It seems that DXY is building a triple zigzag pattern, which consists of primary sub-waves. The sub-waves have been completed. The actionary wave is a double zigzag, the second intervening wave is a standard zigzag.
Most likely, the depreciation of the price in the primary wave will continue. Judging by the internal structure, this wave may take the form of an intermediate double zigzag.
The final of the bearish trend is expected closer to the 96.367 mark. At that level, primary wave will be at 76.4% of wave.
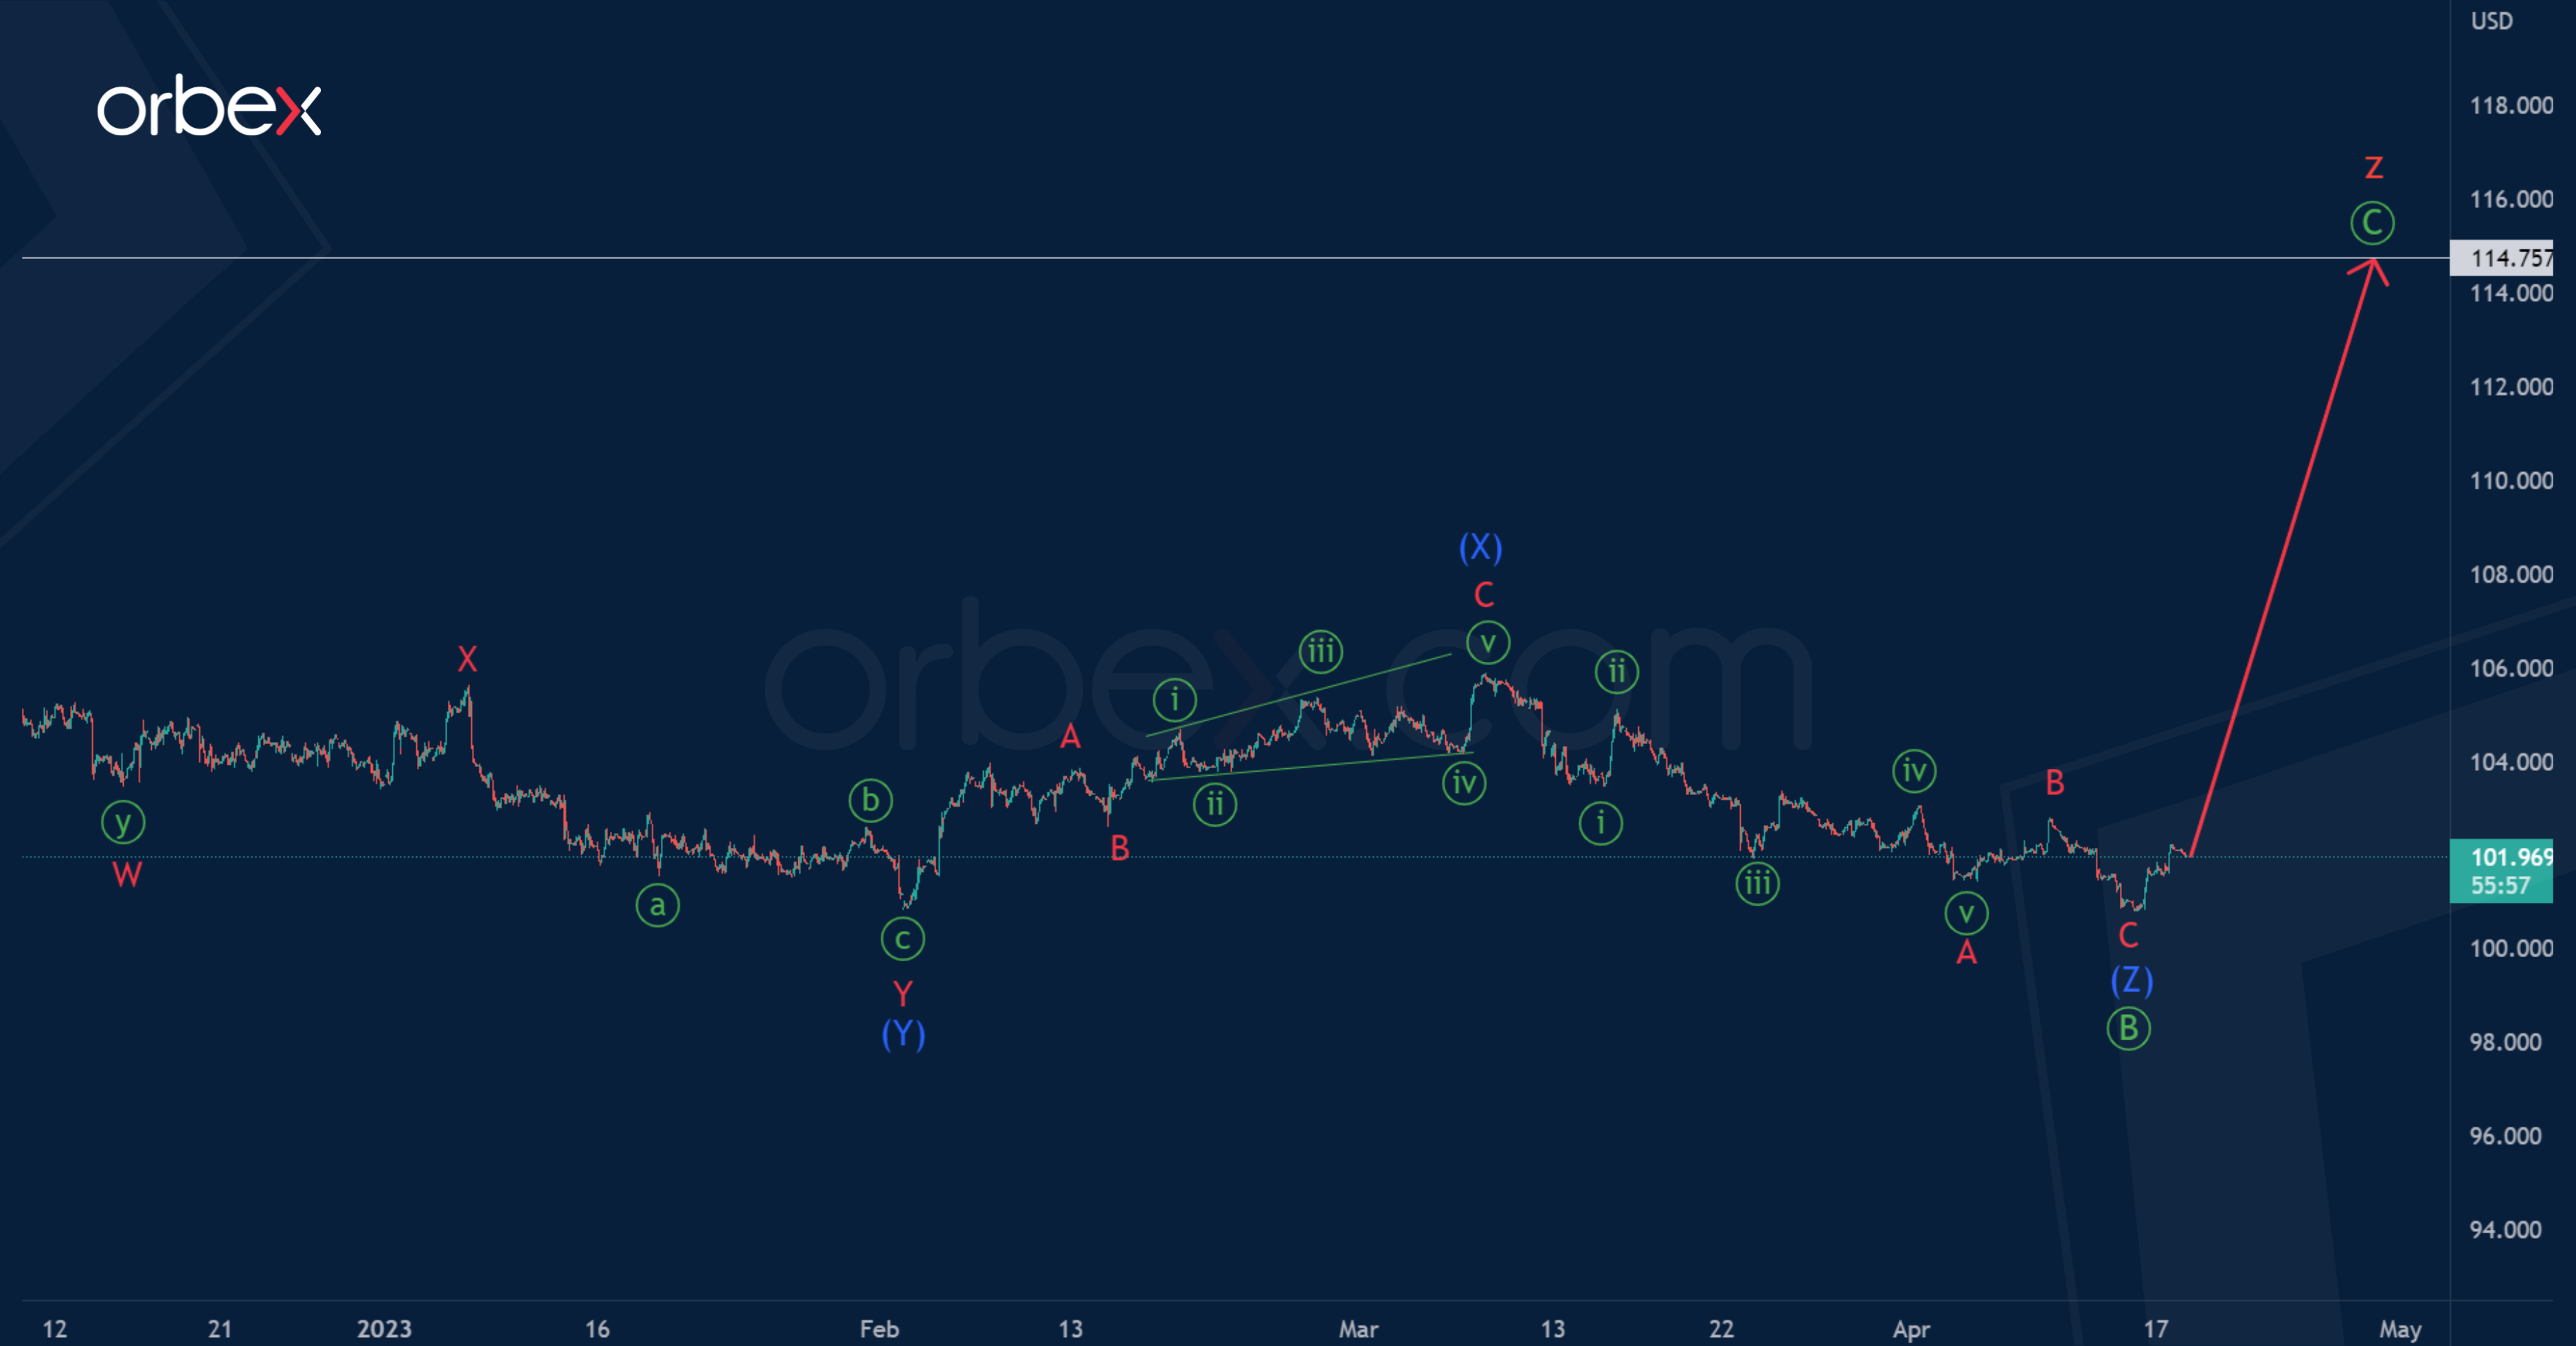
And what if the last part of the bullish correction trend is being built? That is, a wave z is formed in a triple zigzag w-x-y-x-z.
The cycle wave z is similar to the zigzag. In its composition, the first impulse and the correction in the form of an intermediate double zigzag have already been completed. The entire wave z may end near 114.75.
The indicated level was marked by the primary impulse wave, which is not visible on the chart.
Mixed Data for China and UK Sees Markets Tread Water in Europe
We're seeing relatively flat trade again on Tuesday amid mixed economic data from China overnight.
The world's second-largest economy grew by 4.5% in the first quarter as it emerged from zero-Covid restrictions to join the rest of the world in living with the disease. The transition was never likely to be perfectly smooth but much of the data we've seen in recent months suggests it's been relatively successful.
But the data on Tuesday also highlights how uneven the recovery has been. The consumer has been doing a lot of the heavy lifting and it was this outperformance in March - retail sales rose by 10.6%, smashing expectations - that enabled the large beat in the GDP data.
The fixed asset investment and industrial production figures were less inspiring, both comfortably falling short of expectations and highlighting the challenges facing the economy this year. It's not just the pandemic that the country is bouncing back from, confidence in the property market has been severely undermined and it will take time to recover.
A mixed bag for the BoE but wages remain a concern
The UK jobs report was also a mixed bag, with wage growth remaining stubbornly high - and with upward revisions - but unemployment unexpectedly ticking higher to 3.8%. The BoE will no doubt be frustrated at the lack of progress on wages - particularly excluding bonuses - but if the move higher in unemployment is sustained, the additional slack in the labour market may give them confidence that they will come down.
Of course, with inflation still above 10%, the case for pausing rate hikes is already extremely challenging and markets strongly expect another 25 basis points next month and maybe one more before the end of the year.
Can Oil break above five-month range after OPEC+ cut
Oil is continuing to tread water around the five-month highs, an area it has failed to surpass in the aftermath of the latest OPEC+ output cut. Rather than propel the price towards $100 as some feared (it could still happen, of course), the decision appears to have just moved the price back to previous ranges that the cartel was seemingly comfortable with.
The next step may depend on global growth and whether the economy can weather the recent storm, particularly in the US where tighter credit could significantly weigh on growth for the rest of the year. For now, $88 still looks like an interesting level of resistance in Brent, with $83.50 potentially one to watch below after the gap open a couple of weeks ago.
Gold fails to hit new highs for now
Gold is trading around $2,000 this morning after giving back some gains in recent sessions. The yellow metal came close to record highs late last week but didn't quite have the legs to properly test it. That may still come but it seems we're now seeing some profit-taking, which is coinciding with yields creeping higher and interest rate expectations doing similar. Markets still haven't fully recovered from the banking turmoil, especially in the US, and that could continue to support gold if investors remain of the view that the scarring from the crisis will lead to tighter credit conditions.
EUR/USD Daily Outlook
Daily Pivots: (S1) 1.0892; (P) 1.0946; (R1) 1.0982; More...
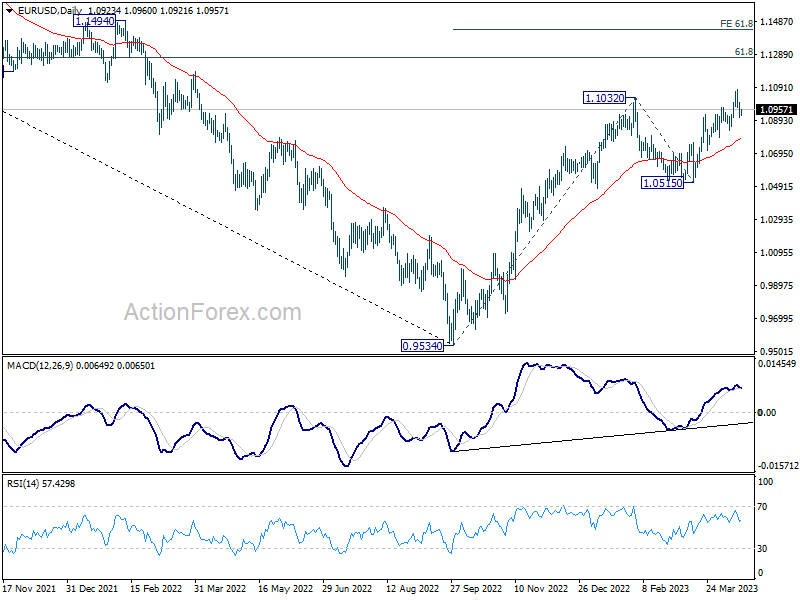
Intraday bias in EUR/USD remains neutral and outlook stays bullish with 1.0830 support intact. On the upside, break of 1.1075 will will resume larger up trend to 1.1273 fibonacci level. Break there will target 61.8% projection of 0.9534 to 1.1032 from 1.0515 at 1.1441. However, firm break of 1.0830 will confirm short term topping and bring deeper decline to 1.0711 support instead.
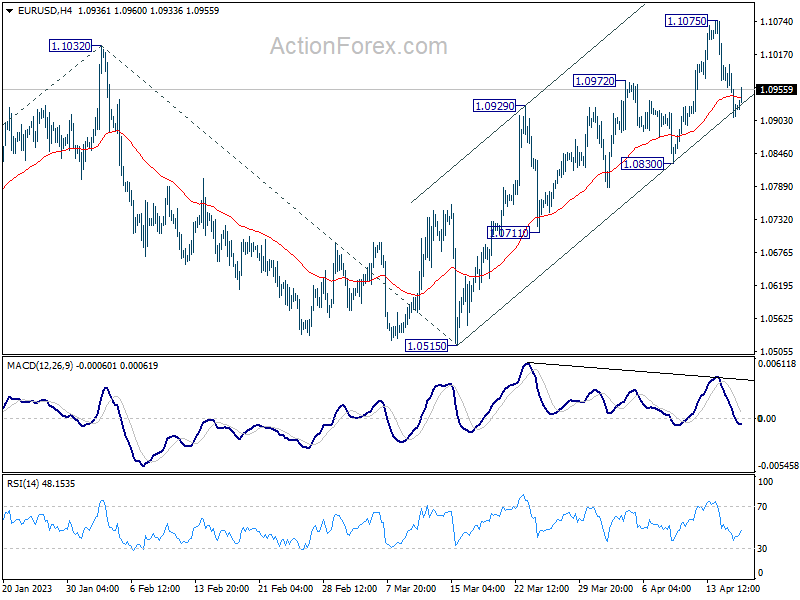
In the bigger picture, rise from 0.9534 (2022 low) is in progress for 61.8% retracement of 1.2348 (2021 high) to 0.9534 at 1.1273. Sustained break there will solidify the case of bullish trend reversal and target 1.2348 resistance next (2021 high). This will now remain the favored case as long as 1.0515 support holds, even in case of deeper pull back.