

Sample Category Title
Technical Outlook and Review
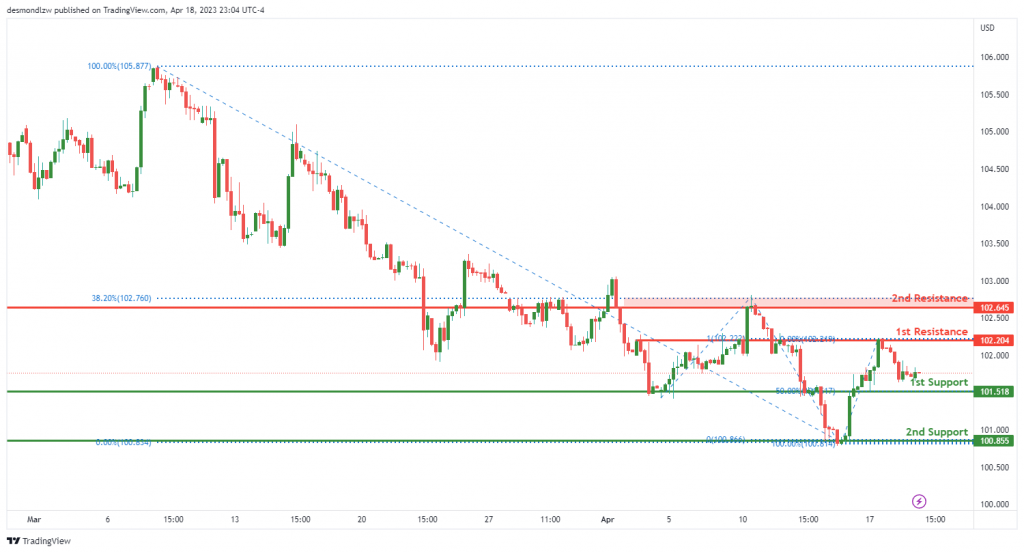
DXY:
The US Dollar Index (DXY) is currently experiencing a bearish momentum with a potential for further downward movement. The first support level is at 101.51, which is an overlap support and coincides with the 50% Fibonacci retracement level. The second support level is at 100.86, which is a multi-swing low support level.
On the other hand, the first resistance level is at 102.20, which is an overlap resistance and coincides with the 100% Fibonacci projection level. The second resistance level is at 102.64, which is an overlap resistance and coincides with the 38.20% Fibonacci retracement level.
Given the bearish momentum, the price may continue to drop towards the first support level. If the price bounces off this level, it may rise towards the first resistance level. However, if the first support level is broken, the price may drop towards the second support level. Conversely, if the first resistance level is broken, the price may rise towards the second resistance level.
EUR/USD:
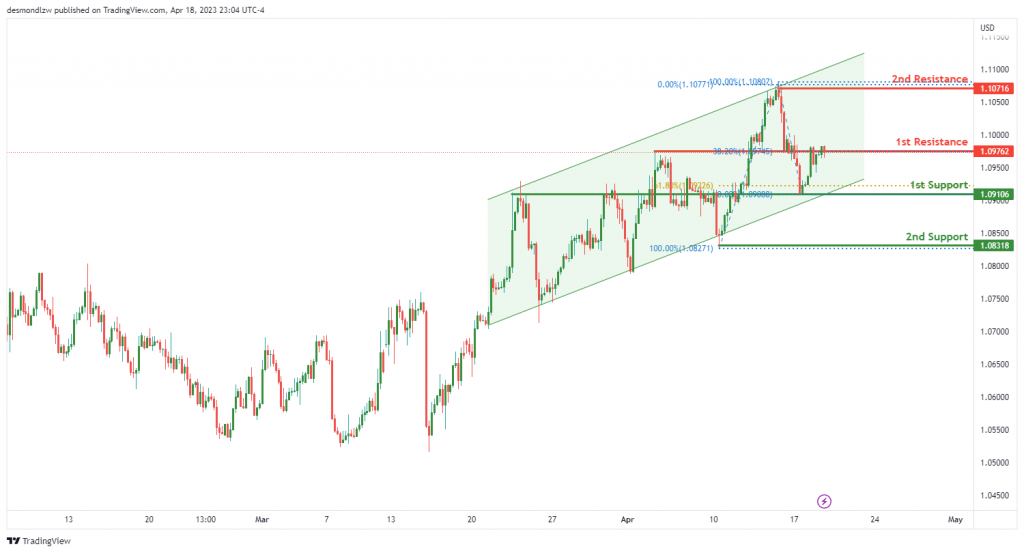
The EUR/USD chart is currently experiencing bullish momentum as it is in a bullish ascending channel. If the momentum continues, there is a possibility that the price could potentially make a bullish break through the 1st resistance and rise to the 2nd resistance level.
The 1st support level is at 1.0910, which is a good support level as it is an overlap support and is also at the 61.80% Fibonacci retracement level. Another support level is the 2nd support level at 1.0831, which is a swing low support.
On the other hand, the 1st resistance level is at 1.0976, which is a good resistance level as it is an overlap resistance and is at the 38.20% Fibonacci retracement level. The 2nd resistance level is at 1.1071, which is a swing high resistance.
been tested multiple times in the past and has shown to provide a strong resistance zone for price.
GBP/USD:
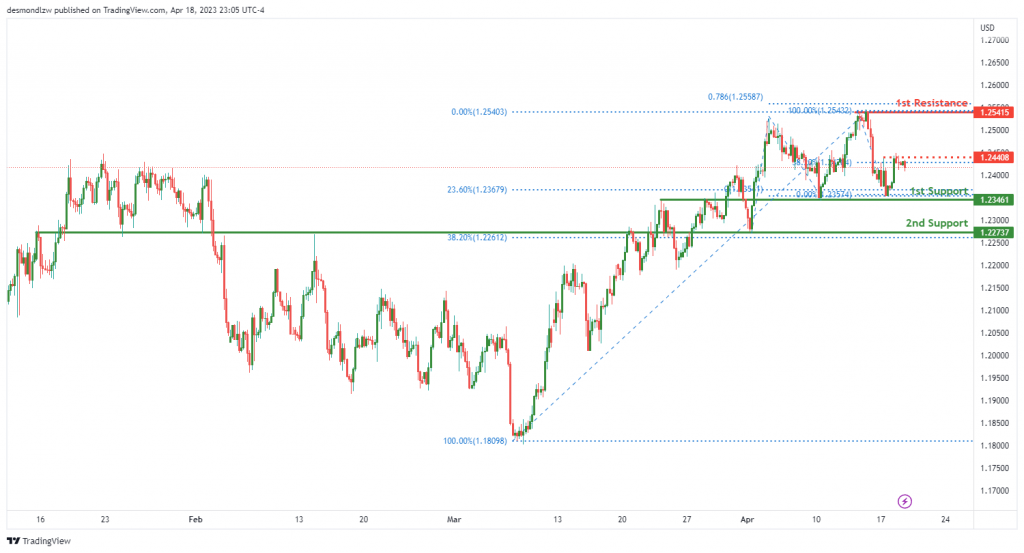
The GBP/USD chart is bullish, indicating a potential continuation towards the first resistance level. Price is currently trading above an ascending support line, which is in line with the bullish momentum of the chart.
The first support level is at 1.2346, which is a strong overlap support, coinciding with the 23.60% Fibonacci retracement. The second support level is at 1.2273, which is another overlap support, coinciding with the 38.20% Fibonacci retracement.
The first resistance level is at 1.2541, which is a swing high resistance, coinciding with the 78.60% Fibonacci projection. If price were to break through this level, it could potentially trigger a strong bullish acceleration towards the intermediate resistance level at 1.2440, which is also a swing high resistance.
USD/CHF:
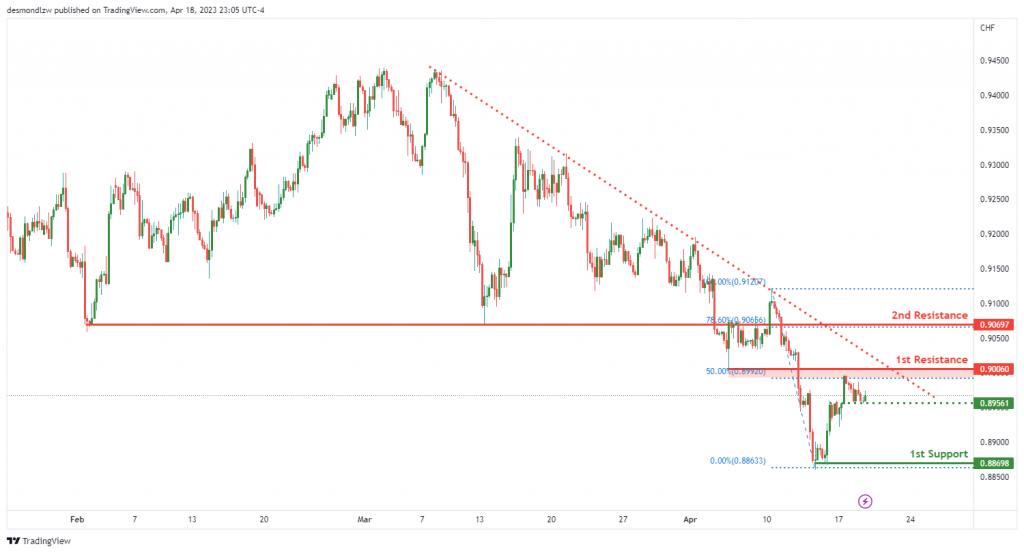
The USD/CHF chart is currently showing bearish momentum as price is below a major descending trend line, which suggests further downward movement. The 1st resistance is at 0.9006, and it is a good level for potential pullbacks as it is an overlap resistance, and a 50% Fibonacci retracement also lines up with this level. If price fails to break this level, it could potentially make a bearish continuation towards the 1st support at 0.8869. This level is a multi-swing low support, and could provide a strong bounce for the pair.
However, if price were to break the 1st support, the intermediate support at 0.8956 could provide a short-term pause to the bearish momentum. If the intermediate support fails to hold, the next level that price could potentially drop to is the 2nd support at 0.8749, which is also a multi-swing low support.
USD/JPY:
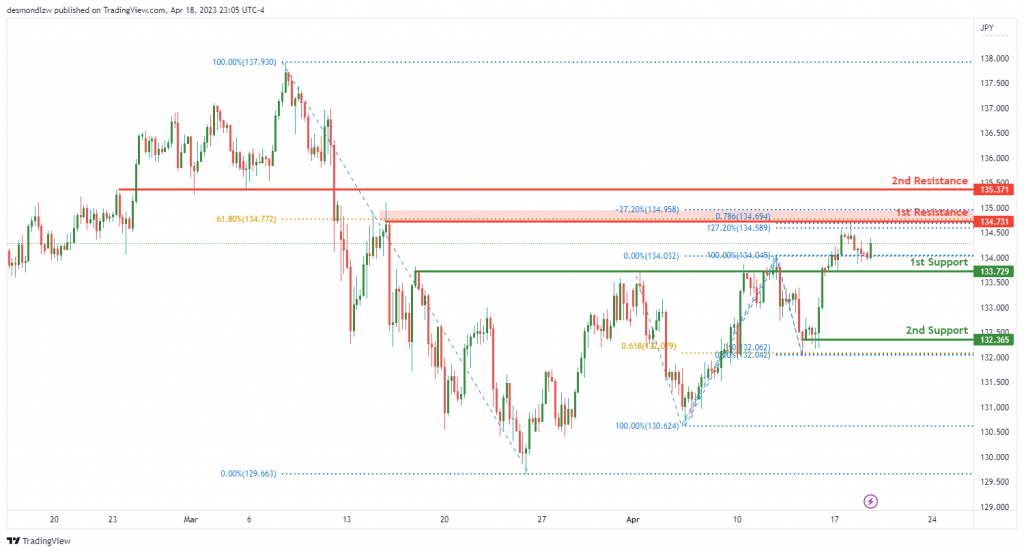
The overall momentum of the USD/JPY chart appears to be bearish, but there is a potential for a short-term bullish rise towards the first resistance level before reversing and dropping towards the first support.
Currently, the USD/JPY price is approaching the first resistance at 134.73, which is a strong overlap resistance and coincides with a 61.80% Fibonacci retracement. A rise towards this resistance level in the short term could be possible before a reversal occurs.
However, the overall momentum of the chart is bearish, and the price could potentially drop towards the first support at 133.72. This support level is also a strong overlap support, which adds to its significance. If the price were to break below the first support level, it could drop towards the second support level at 132.36. This level is a multi-swing low support and also lines up with a 61.80% Fibonacci projection, making it a strong potential support level.
On the upside, the USD/JPY price may encounter intermediate resistance at 135.37, which is a pullback resistance level. If the price were to break through this resistance, it could rise towards the second resistance level at 136.09.
AUD/USD:
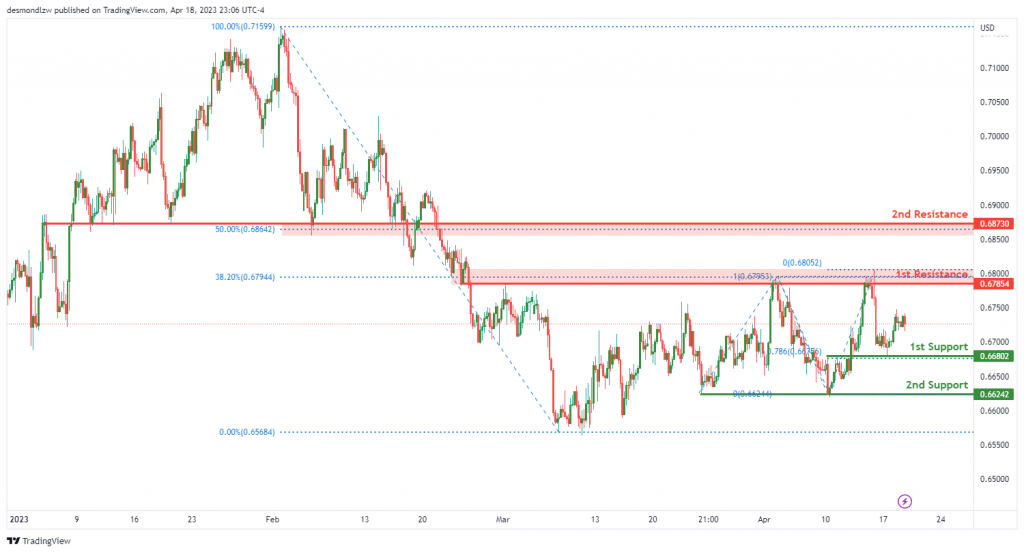
The AUDUSD chart appears to be in a neutral momentum phase. It’s possible that prices could move within the range of the 1st resistance and 1st support levels.
The 1st support level at 0.6680 is a strong overlap support with a 78.60% Fibonacci Projection lining up with it, suggesting that it could hold as a support level. The 2nd support level at 0.6624 is a multi-swing low support.
On the resistance side, the 1st resistance level at 0.6785 is an overlap resistance with a 38.20% Fibonacci Retracement lining up with it. The 2nd resistance level at 0.6873 is a pullback resistance with a 50% Fibonacci Retracement lining up with it.
NZD/USD:
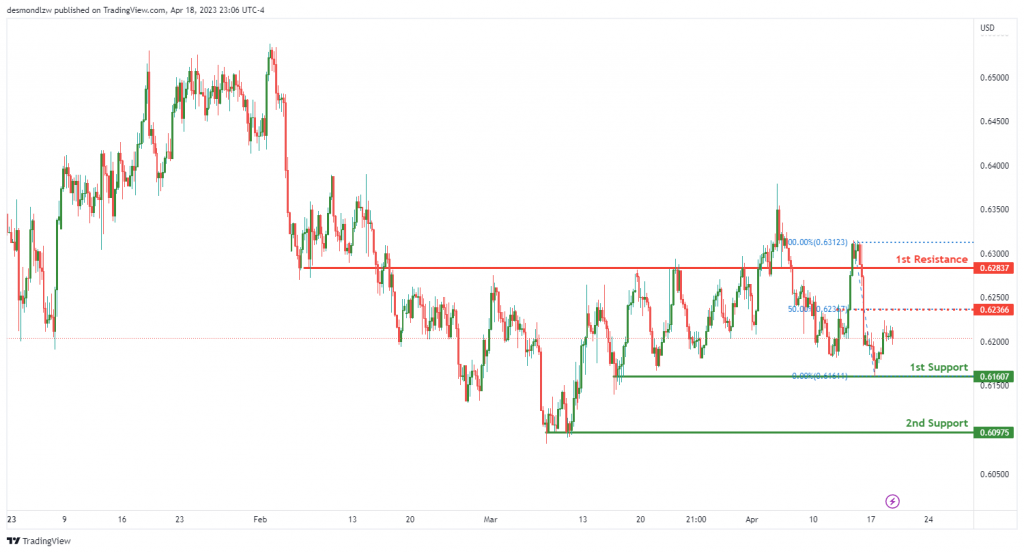
The overall momentum of the NZD/USD chart is bullish, suggesting that there may be a potential for a bullish continuation towards the 1st resistance level.
Currently, the 1st support level for NZD/USD is at 0.6160, which is a multi-swing low support level. In addition, there is also a 2nd support level at 0.6097, which is also a multi-swing low support level.
On the other hand, the 1st resistance level for NZD/USD is at 0.6283, which is a pullback resistance level. There is also an intermediate resistance level at 0.6236, which is a pullback resistance level and is at the 50% Fibonacci retracement level.
If the bullish momentum continues, NZD/USD could potentially break through the 1st resistance level and rise towards the intermediate resistance level. However, if the bearish momentum takes over, NZD/USD could potentially drop towards the 2nd support level.
USD/CAD:
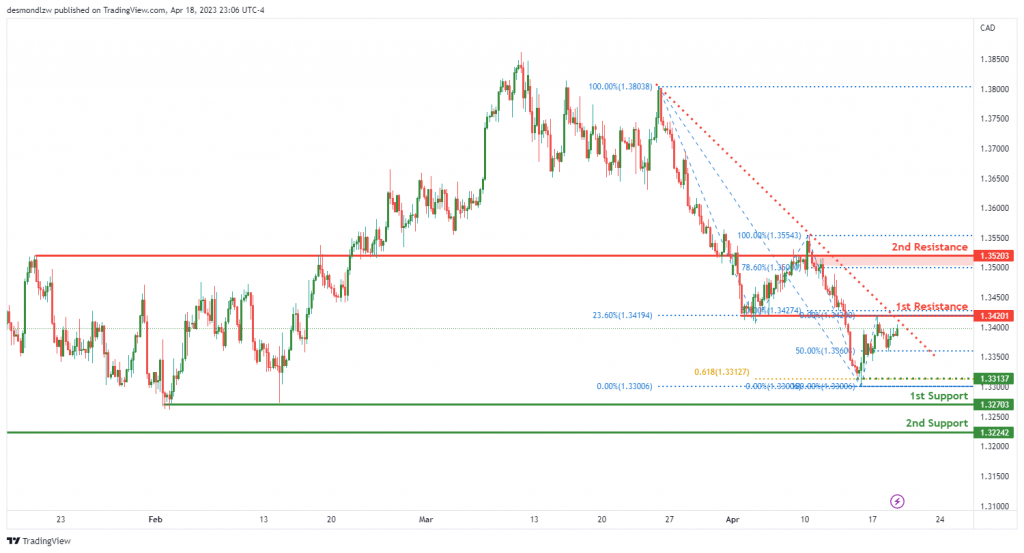
The USD/CAD chart is showing bearish momentum, with price potentially rising towards the 1st resistance level in the short term before reversing off it and dropping towards the 1st support level.
Looking at the chart, the overall momentum is bearish, with two strong support levels below the current price. The first support is at 1.3270, which is a multi-swing low support. The second support is at 1.3224, which is a swing low support. These two support levels suggest that there is strong bearish momentum on the chart.
On the other hand, there are two strong resistance levels above the current price. The first resistance is at 1.3420, which is an overlap resistance and has a 23.60% Fibonacci retracement lining up with it. The second resistance is at 1.3520, which is also an overlap resistance and has a 78.60% Fibonacci retracement lining up with it. These two resistance levels suggest that price may rise towards them in the short term before reversing off.
There is also an intermediate support level at 1.3313, which is a swing low support. This support level is important as it suggests that if price were to break below the first support level, it could potentially drop to this intermediate support before reaching the second support level.
DJ30:
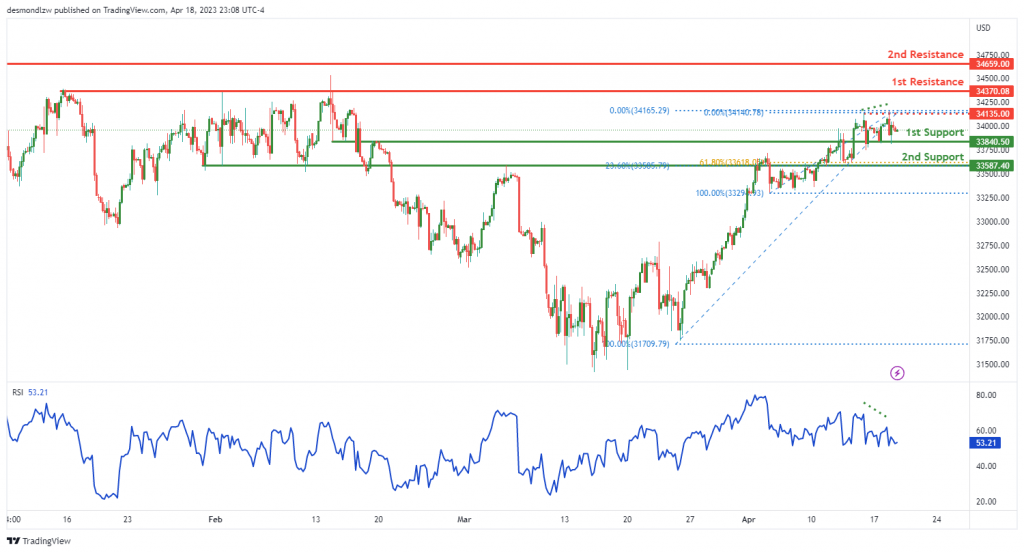
The DJ30 index is currently exhibiting a bearish overall momentum. The price could potentially break below the 1st support at 33840.50, suggesting a drop towards the 2nd support at 33587.40. The 1st support level is an overlap support, which gives us confidence that it will hold. The 2nd support is a swing low support and is backed up by a 23.60% Fibonacci retracement, making it an even stronger level of support.
On the resistance side, the 1st resistance is at 34370.08, which is a multi-swing high resistance. This level could potentially act as a strong barrier for any bullish movement. The 2nd resistance is at 34659.00, which is a swing high resistance. It is always a strong level of resistance that the price has failed to breach in the past.
In between the 1st resistance and 1st support, we have an intermediate resistance level at 34135.00, which is a swing high resistance. It could provide some minor resistance on the way down.
The RSI is displaying bearish divergence versus price, suggesting that a reversal might occur soon. This supports our bearish outlook on the DJ30 index.
GER30:
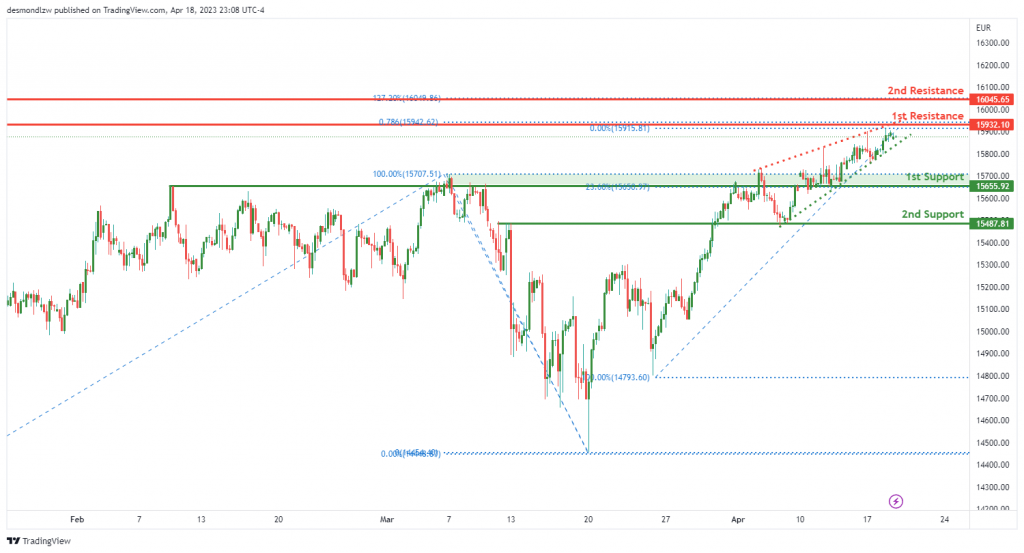
The GER30 chart suggests a bearish momentum, with the rising wedge pattern signaling an imminent breakout to the downside. Prices could potentially make a bearish reaction off the first resistance and drop to the first support.
The first support level at 15655.92 is a strong overlap support, with a 23.60% Fibonacci retracement lining up with it. A break below this level could potentially push prices towards the second support at 15487.81, which is also an overlap support level.
On the other hand, the first resistance at 15932.10 is a swing high resistance, with a 78.60% Fibonacci projection lining up with it. If prices manage to break above this level, it could trigger a bullish acceleration towards the second resistance at 16045.65, which is another swing high resistance level with the 127.20% Fibonacci extension lining up with it.
BTC/USD:
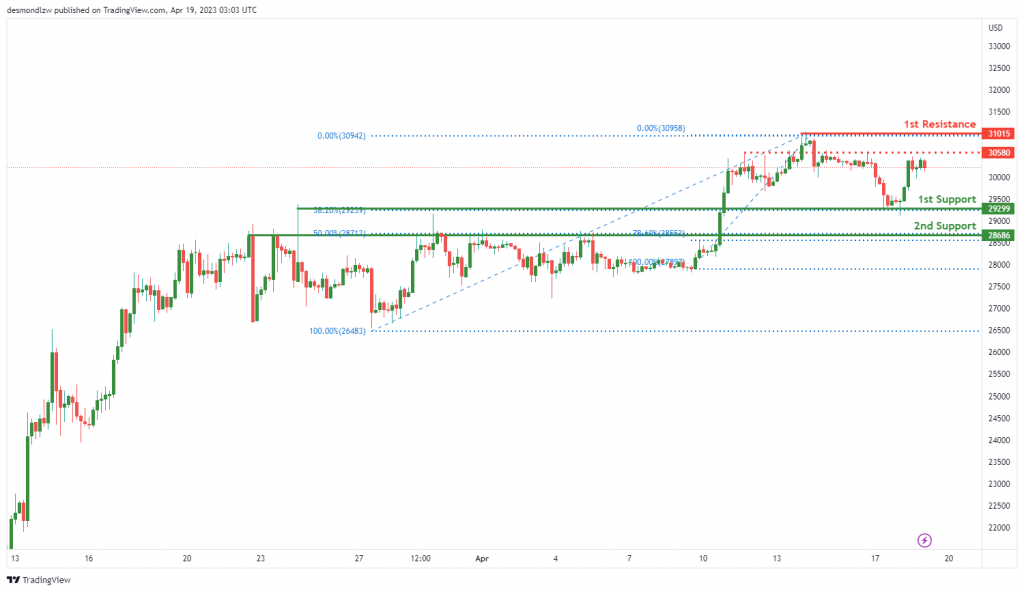
he overall momentum of the BTC/USD chart is bullish, and price could potentially make a bullish continuation towards the 1st resistance level. The 1st support level is at 29299.00, which is an overlap support and coincides with a 23.60% Fibonacci retracement. The 2nd support level is at 28686.00, which is another overlap support and coincides with a 50% Fibonacci retracement. On the other hand, the 1st resistance level is at 31015.00, which is a swing high resistance. In between the current price and the 1st resistance level, there is an intermediate resistance level at 30580.00, which is also an overlap resistance
US500
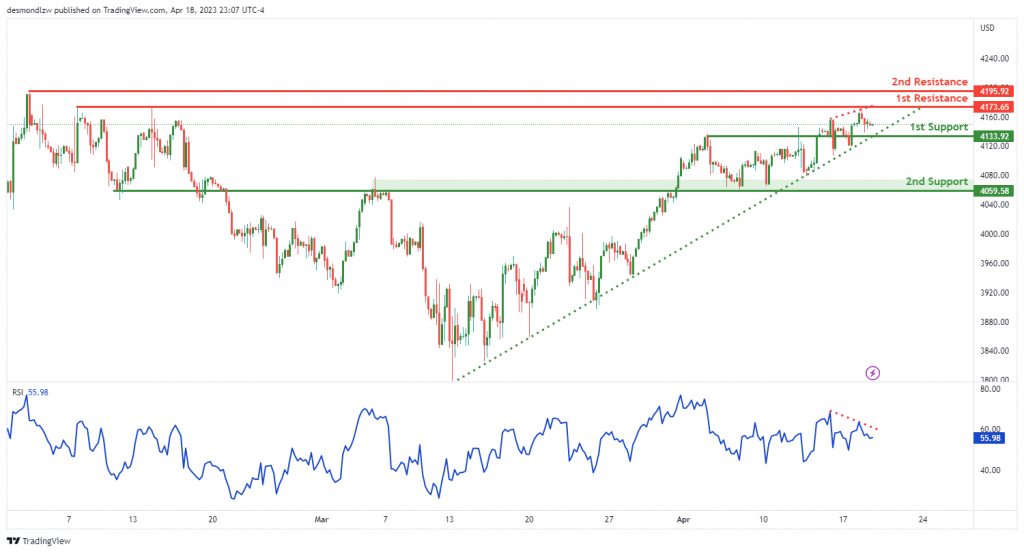
The US500 chart indicates a bearish momentum, with price potentially heading towards the first support level at 4133.92. The overall bias is bearish, with factors such as a bearish continuation and a major ascending trend line adding to the current downward trend.
Price is currently above a major ascending trend line, which suggests further bullish momentum is on the cards. Additionally, the price is on an ascending trend line that acts as support, but a break below this trend line could trigger a drop towards the first support level.
The first support level is located at 4133.92, which is an overlap support and could provide some buying interest. However, if the price were to break below this support level, the next support level could be seen at 4059.58, which is also an overlap support.
On the other hand, the first resistance level is located at 4173.65, which is a swing high resistance. If the price were to break above this resistance level, it could potentially rise towards the second resistance level at 4195.92, which is also a swing high resistance.
It’s worth noting that RSI is displaying bearish divergence versus price, which suggests that a reversal might occur soon.
ETH/USD:
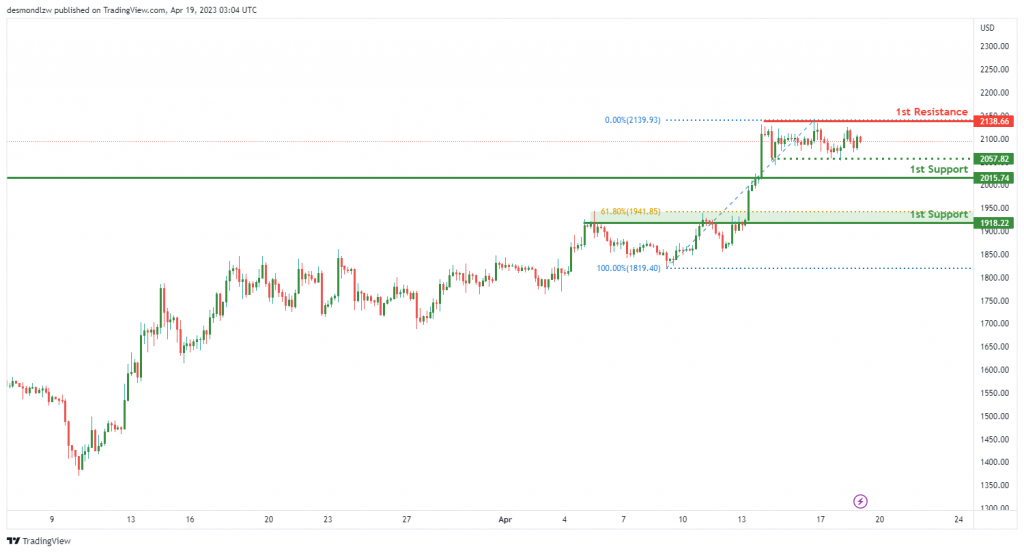
The Ethereum/USD pair is showing a neutral momentum overall. The price could potentially fluctuate between the first resistance and first support levels. The first support level is located at 2015.74 and is a pullback support, while the second support level is located at 1918.22 and is also a pullback support. On the other hand, the first resistance level is located at 2138.66 and is a multi-swing high resistance, while the intermediate support level is located at 2057.82 and is a multi-swing low support.
WTI/USD:
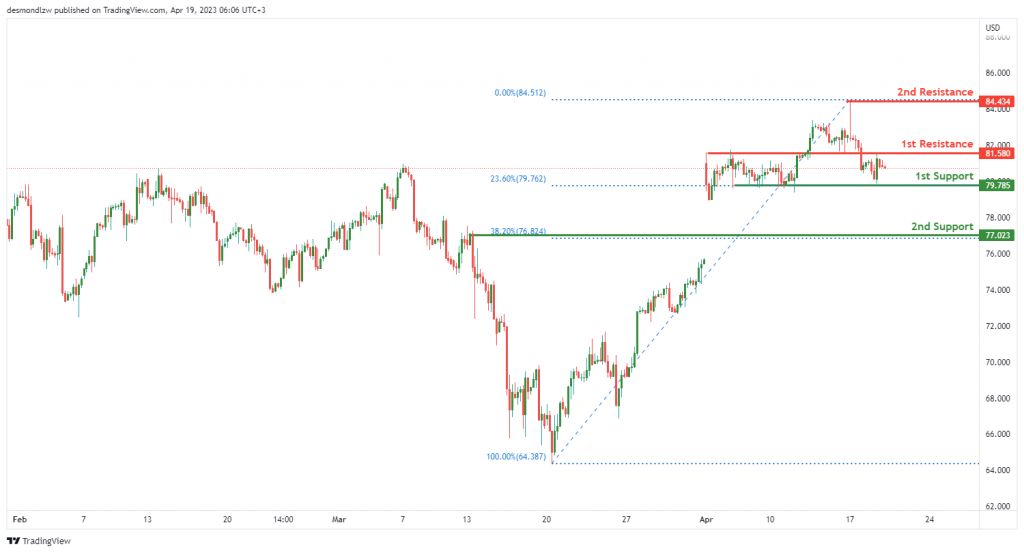
WTI crude oil has been displaying bearish momentum in recent times, with prices continuing to move lower. As of the latest analysis, the overall momentum of the chart is bearish, with the price potentially making a bearish continuation towards the first support level.
The first support level is at 79.78, which is an overlap support and the 23.60% Fibonacci retracement level. If the price breaks below this level, it could drop towards the second support at 77.02, which is a pullback support and the 38.20% Fibonacci retracement level.
On the other hand, the first resistance level is at 81.58, which is an overlap resistance level. If the price manages to break above this level, it could rise towards the second resistance level at 84.43, which is a swing high resistance level.
XAU/USD (GOLD):
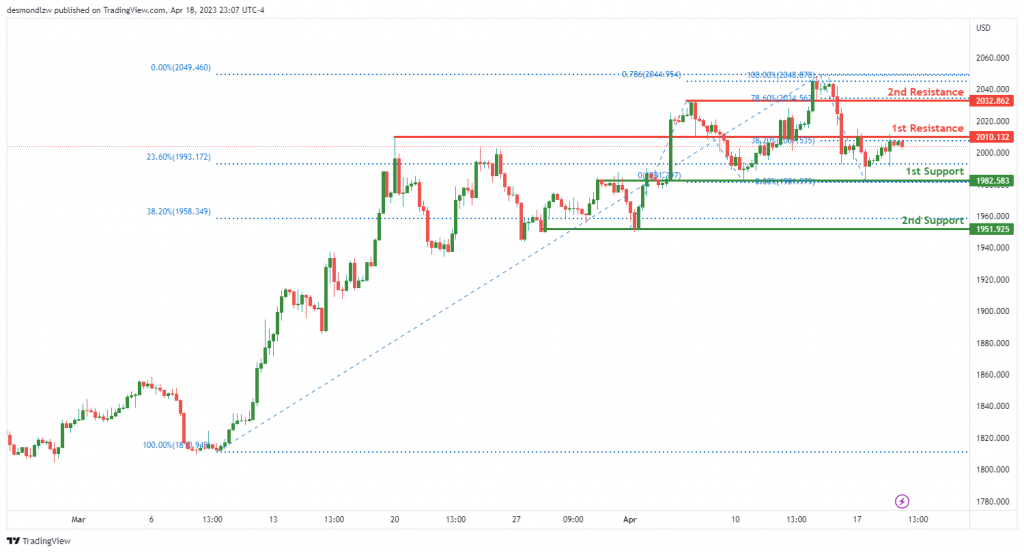
Gold prices have been showing bearish momentum recently, with prices potentially continuing downwards towards the 1st support level of 1982.58. This support level is an overlap support and is also at the 23.60% Fibonacci retracement level, which adds to its significance. If prices break below this level, the next potential support level is at 1951.92, which is a multi-swing low support and is at the 38.20% Fibonacci retracement level.
On the upside, the first resistance level is at 2010.12, which is an overlap resistance and is at the 38.20% Fibonacci retracement level. If prices manage to break above this resistance level, the next potential resistance level is at 2032.86, which is a pullback resistance and is at the 78.60% Fibonacci retracement level.
Overall, the momentum of the chart is bearish for XAU/USD. If prices continue to drop, traders should keep an eye on the support levels mentioned above. However, if prices manage to break above the resistance levels, this could suggest a shift in momentum to bullish.
UK CPI Gives BoE Little Choice But to Continue Hike Cycle
Markets
With only second tier data on the agenda, yesterday brought a session of order-driven, technical trade. ECB and Fed speakers mainly held to recent narratives. In the end, the US yield curve inverted slightly further with the 2-y gaining marginally while the 10 and 30-y ceded slightly less than 2.5 bps. US housing data printed mixed with housing starts marginally better than expected (1420k) but permits declining more than hoped for (1413k). Fed’s Bostic defended the March dots advocating one additional rate hike in May and holding the policy rate above 5% for some time. Fed’s Bullard in an interview with Reuters kept a more hawkish tone, as he favours a scenario of the policy rate being raised to 5.5%/5.75%. He also pushed back against the idea that the US economy is heading for a recession, with the labour market holding strong and pandemic savings still being used to support spending. The German curve showed a similar, modest move with the 2y yield adding 2.7 bps. The 30-y ceded 1.8 bps. ECB’s chief economist Lane indicated that a further rate hike in May is appropriate, with data to decide on the size of the move. He doesn’t exclude a 50 bps step. On equity markets, Europe (Eurostoxx 50 + 0.60%) still outperforms the US (major indices hardly changed). The dollar didn’t profit from the Bullard comments. On the contrary, DXY eased from 102.10 to 101.75. EUR/USD rebounded to close at 1.0972. Sterling initially tried to capitalize on strong labour market data, but the momentum gradually faded. EUR/GBP closed the day little changed at 0.883.
There is again no really high profile (eco) news to guide trading this morning. Asian equities mostly trade with modest losses. US yields are trending higher (1-3 bps) after higher than expected UK CPI data (cf infra). The dollar is gaining a few ticks (USD/JPY 134,35; EUR/USD 1.0965). Later today, there are again few eco data in the US and EMU. Speeches of ECB’s Lane, Knot, de Cos and Schnabel are worth to keep an eye on. Later this evening, the Fed will publish the Beige Book, preparing the May 3 policy meeting. EUR/USD trading for now is guided by a short-term consolidation pattern between 1.0831 and 1.1076. On yields markets, the US 2-y and 10-y yield face important resistance respectively near 4.25% and 4.64%.
UK March price data printed well above expectations. Headline CPI inflation rose 0.8% M/M and 10.1% Y/Y (0.5% and 9.8% expected). Core inflation stabilized at 6.2% while a decline to 6% was expected. PPI was also higher than expected. Combined with yesterday’s strong labour market data, the report gives the BoE little choice but to continue its hike cycle at the May 11 meeting. Sterling gains immediately after the release. EUR/GBP dropped to the 0.882 area. However, yesterday’s price action showed that one should be cautious to draw early conclusions.
News and views
Hungary’s central bank deputy governor Virag said the “multi-step” interest rate normalization may start at next week’s monetary policy meeting. The MNB in first instance could change the width of the interest rate corridor by cutting the top-end “by a significant margin”. This top-end collateralized lending rate currently stands at 25%. Modifying the O/N 18% tender rate, the de facto policy rate, would only be on the agenda at the subsequent rate meetings. Hungarian inflation barely eased from 25.4% in February to 25.2% last month. Virag nevertheless expects the disinflationary process to speed up from April. Helping the MNB’s inflation fight is the recent HUF strengthening. Boosted by the 18% interest rate, the forint appreciated from briefly above EUR/HUF 400 mid-March to the low 370 area yesterday. At EUR/HUF 371.09, the currency closed at the strongest level since April 2022.
EU negotiators yesterday agreed on a final version of a €43bn plan to turn Europe into a key player in the market of semiconductors after “just” 14 months. The continent is keen in ramping up own output in the wake of the pandemic and subsequent supply chain disruptions and in a context of rising geopolitical tensions. The European Union’s ambition is to manufacture about 20% of world’s production by 2030, up from 10% currently. The Chips Act allows EU member states to provide financial support for “first-of-a-kind” semiconductors. It is the first of a series of industrial plans that let governments increasingly intervene in the supply chain..
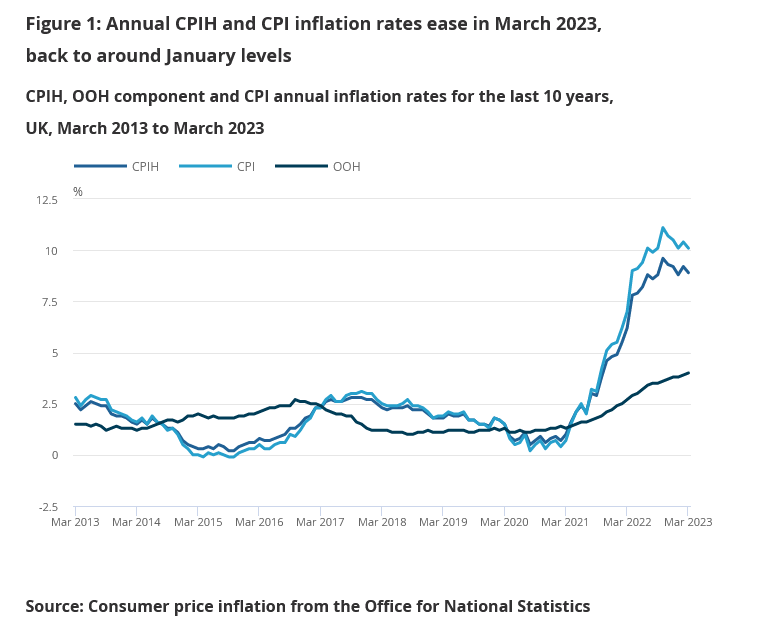
UK CPI slowed to 10.1% yoy, core CPI unchanged at 6.2% yoy
UK CPI slowed from 10.4% yoy to 10.1% yoy in march, above expectation of 9.8% yoy. CPI all goods index slowed from 13.4% yoy to 12.8% yoy. But CPI all services was unchanged at 6.6% yoy. On a monthly basis, CPI rose 0.8% mom, above expectation of 0.5% mom. Core CPI (CPI excluding energy, food, alcohol and tobacco) was unchanged at 6.2% yoy, above expectation of 6.0% yoy.
Also released, RPI was up 0.7% mom, 13.5% yoy, above expectation of 0.6% mom, 13.3% yoy. PPI input was at 0.2% mom, 7.6% yoy, versus expectation of -0.4% mom, 9.8% yoy. CPI output was at 0.1% mom, 8.7% yoy, versus expectation of -0.1% mom, 8.7% yoy. PPI core output was at 0.3% mom, 8/.5% yoy, versus expectation of 0.2% mom, 9.8% yoy.
GBP/JPY Daily Outlook
Daily Pivots: (S1) 166.20; (P) 166.60; (R1) 167.04; More...
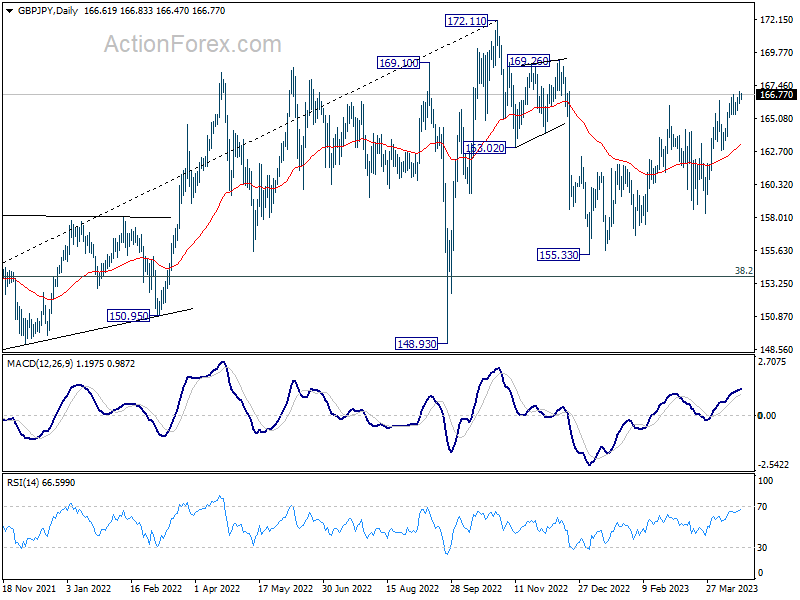
Intraday bias in GBP/JPY remains on the upside for the moment. Current rally is part of the whole rise from 155.33. Next target is 169.26 resistance first. However, considering bearish divergence condition 4 H MACD. Break of 165.38 minor support will argue that a short term top was already formed. Intraday bias will be turned back to the downside for 162.75 support instead.
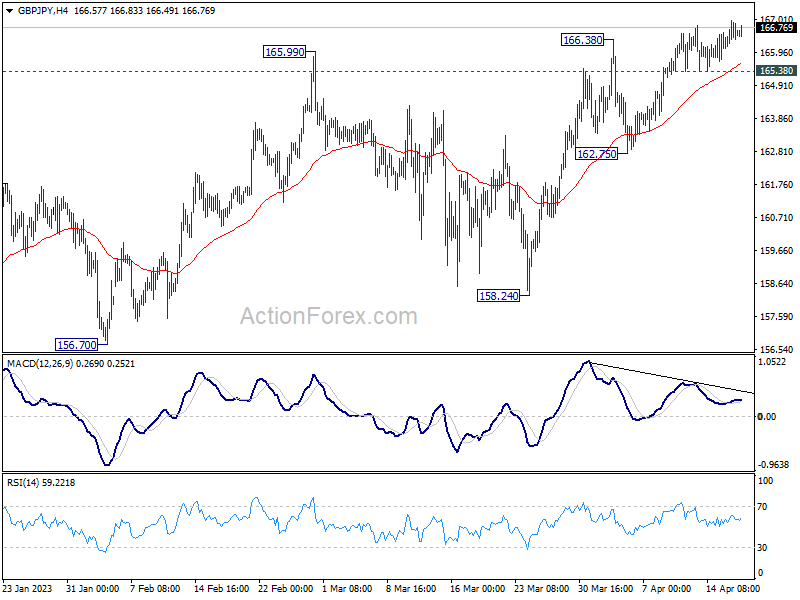
In the bigger picture, as long as 38.2% retracement of 123.94 (2020 low) to 172.11 (2022 high) at 153.70 holds, medium term bullishness is retained. That is, larger up trend from 123.94 (2020 low) is still in progress. Break of 172.11 high to resume such up trend is expected at a later stage.
Markets Lack Direction as UK CPI Data Looms; Sterling’s Path Hinges on Inflation Numbers
The markets have been somewhat directionless this week, with most major currencies remaining within last week's trading ranges against one another, excluding a few Yen pairs. US stock indexes are consolidating in tight ranges with minor pullbacks, while the 10-year yield struggles below a short-term resistance level. Gold prices are recovering weakly, and oil prices are slightly retreating from last week's highs.
Today's UK CPI data will be a key market focus. Sterling gained ground yesterday due to robust job data and strong wage growth, but buying pressure has not followed through. In a recent Reuters poll, 33 out of 61 economists predicted a 25 bps BoE rate hike to 4.50% at the May 11 meeting, while 28 expected rates to remain unchanged. The decision will depend on clear evidence of slowing inflation. Today's crucial data includes the expected drop in CPI from 10.4% yoy to 9.8% yoy in March and a decline in core CPI from 6.2% to 6.0% yoy.
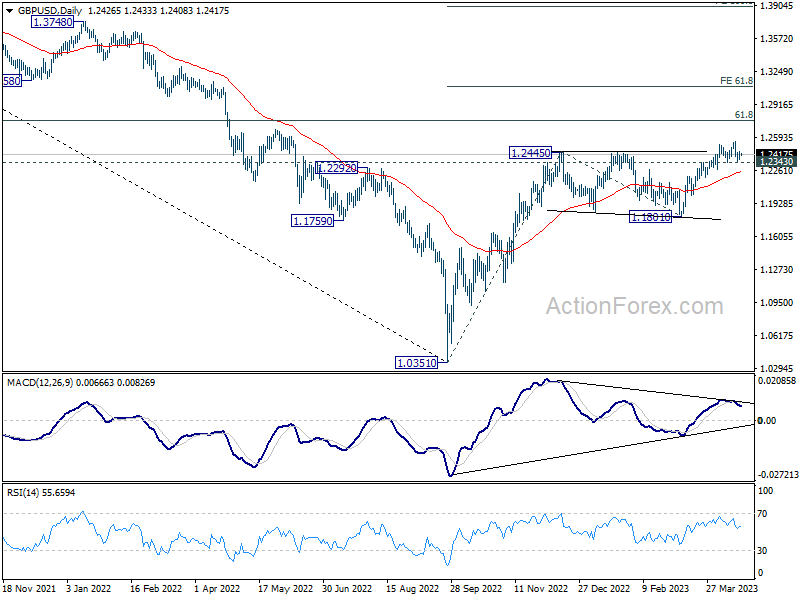
Technically, GBP/USD is visibly losing upside momentum as observed in D MACD. A downside surprise in today's UK CPI could trigger a selloff below 1.2343, potentially prompting a deeper pullback to the 55 D EMA (now at 1.2243). On the other hand, a bounce from the current level could pave the way for a break through 1.2545 resistance, resuming the overall uptrend from 1.0351.
In Asia, at the time of writing, Nikkei is down -0.37%. Hong Kong HSI is down -0.49%. China Shanghai SSE is down -0.21%. Singapore Strait Times is up 0.17%. Japan 10-year JGB yield is down -0.0001 at 0.476. Overnight, DOW dropped -0.03%. S&P 500 rose 0.09%. NASDAQ dropped -0.04%. 10-year yield dropped -0.019 to 3.572.
ECB Lane signals another hike in May, emphasizes data dependence
ECB Chief Economist Philip Lane has indicated in a Bloomberg TV interview that another rate hike in May is appropriate, given the current economic landscape. He stated, "As of now, two weeks away, I think the baseline is that we should increase interest rates in May but what we do in terms of scale, I'm not going to set a default number."
However, Lane emphasized the importance of waiting for more data before making a final decision. He highlighted the central bank's reliance on data, saying, "We are now in an intense phase of data dependence. I'm very much in wait-and-see mode."
He also discussed the ECB's deposit rate, which is currently at 3%, and suggested that it would likely remain at its peak for a prolonged period if inflation returns to 2% and the eurozone avoids a recession, as officials predict. "It would be appropriate to keep rates at the plateau level for a while before returning back to normal," Lane added.
Australia's Westpac Leading Index signals below-trend growth, RBA expected to hike rates in May
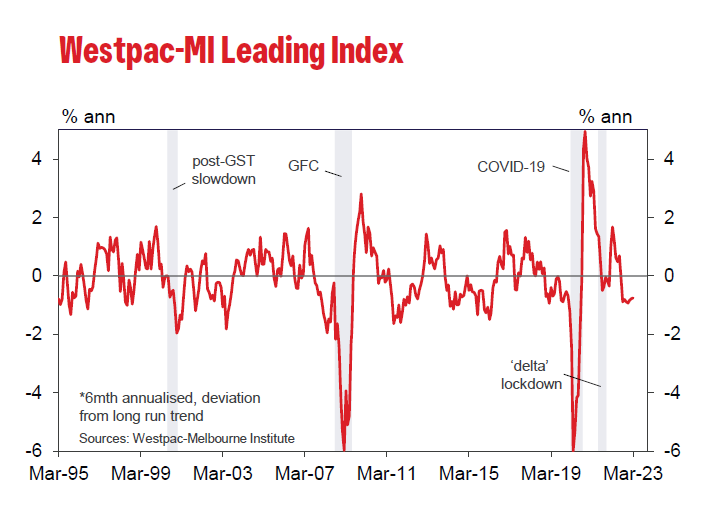
Australia Westpac-Melbourne Institute Leading Index rose slightly from -0.79% to -0.75% in March, marking the eighth consecutive negative reading. This indicates below-trend growth throughout 2023. Westpac forecasts a modest 1% growth for Australia in 2023, while IMF recently revised its growth forecast for the country from 1.9% to 1.6%. RBA also predicts just 1.6% growth in 2023.
Westpac anticipates a further 25bps increase in the cash rate to 3.85% at RBA's May 2 meeting. The April RBA minutes revealed additional concerns about the inflation outlook, including rising demand due to increased immigration, pressures in the housing market, and risks associated with growing wage growth, particularly in the public sector. The March quarter inflation report, scheduled for release on April 26, will be a crucial data point for the central bank's decision-making process.
Looking ahead
UK CPI is the major focus in European session while RPI and PPI will also be released. Eurozone will also publish March CPI final. Later in the day, Canada will release housing starts, IPPI and RMPI. Fed will publish Beige Book economic report.
GBP/JPY Daily Outlook
Daily Pivots: (S1) 166.20; (P) 166.60; (R1) 167.04; More...
Intraday bias in GBP/JPY remains on the upside for the moment. Current rally is part of the whole rise from 155.33. Next target is 169.26 resistance first. However, considering bearish divergence condition 4 H MACD. Break of 165.38 minor support will argue that a short term top was already formed. Intraday bias will be turned back to the downside for 162.75 support instead.
In the bigger picture, as long as 38.2% retracement of 123.94 (2020 low) to 172.11 (2022 high) at 153.70 holds, medium term bullishness is retained. That is, larger up trend from 123.94 (2020 low) is still in progress. Break of 172.11 high to resume such up trend is expected at a later stage.
Economic Indicators Update
| GMT | Ccy | Events | Actual | Forecast | Previous | Revised |
|---|---|---|---|---|---|---|
| 00:30 | AUD | Westpac Leading Index M/M Mar | 0.00% | -0.06% | ||
| 04:30 | JPY | Industrial Production M/M Feb F |
4.6%
|
4.50% | 4.50% | |
| 06:00 | GBP | CPI M/M Mar | 0.50% | 1.10% | ||
| 06:00 | GBP | CPI Y/Y Mar | 9.80% | 10.40% | ||
| 06:00 | GBP | Core CPI Y/Y Mar | 6.00% | 6.20% | ||
| 06:00 | GBP | RPI M/M Mar | 0.60% | 1.20% | ||
| 06:00 | GBP | RPI Y/Y Mar | 13.30% | 13.80% | ||
| 06:00 | GBP | PPI Input M/M Mar | -0.40% | -0.10% | ||
| 06:00 | GBP | PPI Input Y/Y Mar | 9.80% | 12.70% | ||
| 06:00 | GBP | PPI Output M/M Mar | -0.10% | -0.30% | ||
| 06:00 | GBP | PPI Output Y/Y Mar | 8.70% | 12.10% | ||
| 06:00 | GBP | PPI Core Output M/M Mar | 0.20% | -0.20% | ||
| 06:00 | GBP | PPI Core Output Y/Y Mar | 9.80% | 10.40% | ||
| 08:00 | EUR | Eurozone Current Account (EUR) Feb | 10.3B | 17.1B | ||
| 09:00 | EUR | Eurozone CPI Core Y/Y Mar F | 6.90% | 6.90% | ||
| 09:00 | EUR | Eurozone CPI Y/Y Mar F | 5.70% | 5.70% | ||
| 12:15 | CAD | Housing Starts Mar | 260K | 244K | ||
| 12:30 | CAD | Industrial Product Price M/M Mar | -0.40% | -0.80% | ||
| 12:30 | CAD | Raw Material Price Index Mar | -0.70% | -0.40% | ||
| 14:30 | USD | Crude Oil Inventories | -0.4M | 0.6M | ||
| 18:00 | USD | Fed's Beige Book |
Australia’s Westpac Leading Index signals below-trend growth, RBA expected to hike rates in May
Australia Westpac-Melbourne Institute Leading Index rose slightly from -0.79% to -0.75% in March, marking the eighth consecutive negative reading. This indicates below-trend growth throughout 2023. Westpac forecasts a modest 1% growth for Australia in 2023, while IMF recently revised its growth forecast for the country from 1.9% to 1.6%. RBA also predicts just 1.6% growth in 2023.
Westpac anticipates a further 25bps increase in the cash rate to 3.85% at RBA's May 2 meeting. The April RBA minutes revealed additional concerns about the inflation outlook, including rising demand due to increased immigration, pressures in the housing market, and risks associated with growing wage growth, particularly in the public sector. The March quarter inflation report, scheduled for release on April 26, will be a crucial data point for the central bank's decision-making process.
ECB Lane signals another hike in May, emphasizes data dependence
ECB Chief Economist Philip Lane has indicated in a Bloomberg TV interview that another rate hike in May is appropriate, given the current economic landscape. He stated, "As of now, two weeks away, I think the baseline is that we should increase interest rates in May but what we do in terms of scale, I'm not going to set a default number."
However, Lane emphasized the importance of waiting for more data before making a final decision. He highlighted the central bank's reliance on data, saying, "We are now in an intense phase of data dependence. I'm very much in wait-and-see mode."
He also discussed the ECB's deposit rate, which is currently at 3%, and suggested that it would likely remain at its peak for a prolonged period if inflation returns to 2% and the eurozone avoids a recession, as officials predict. "It would be appropriate to keep rates at the plateau level for a while before returning back to normal," Lane added.
Gold Price Dips But This Support Is The Key
Key Highlights
- Gold price started a downside correction from the $2,050 zone.
- It traded below a major bullish trend line with support at $2,020 on the 4-hour chart.
- EUR/USD remained well-bid above the 1.0880 support zone.
- Crude oil prices started a downside correction below $81.20.
Gold Price Technical Analysis
Gold price struggled to clear the $2,050 level against the US Dollar. The price traded as high as $2,048 and recently started a downside correction.
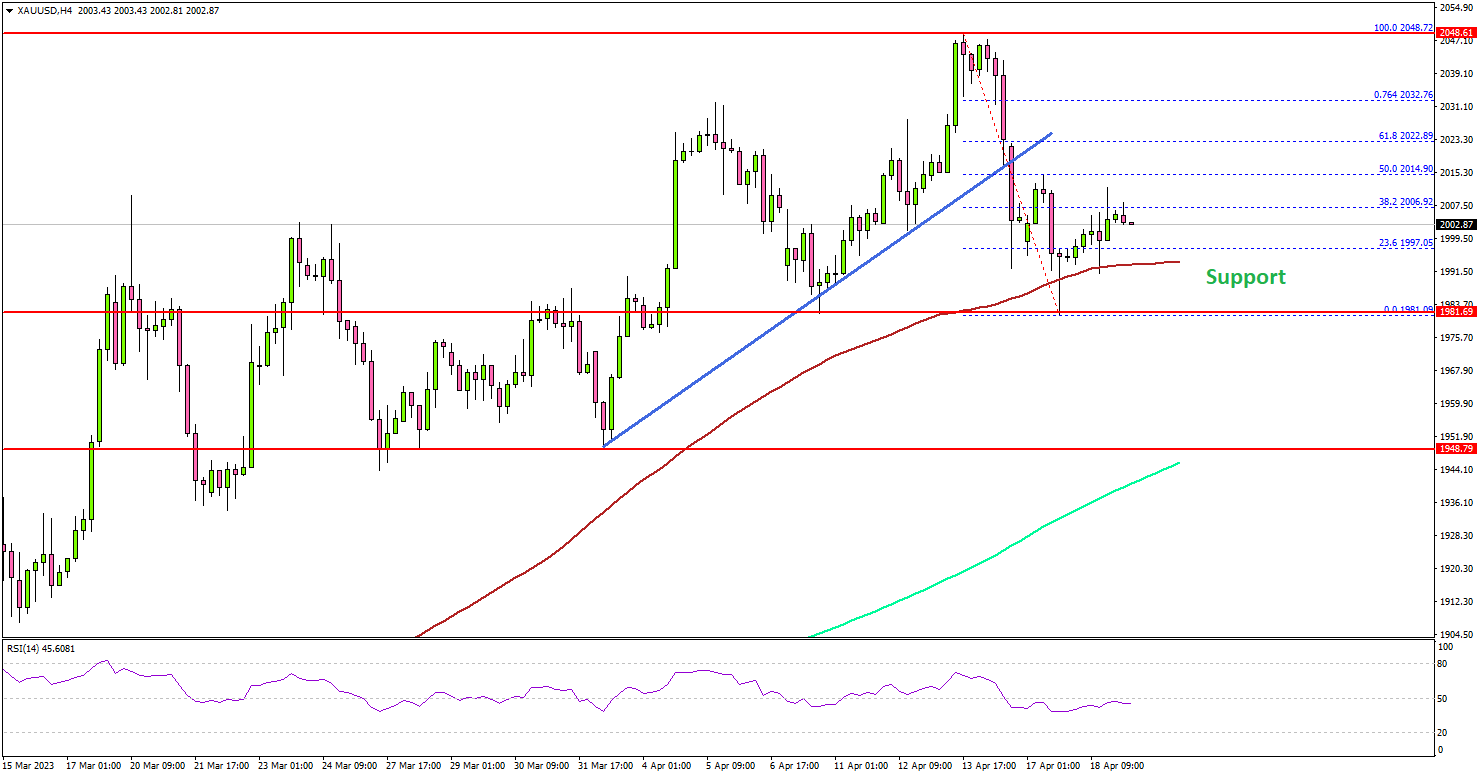
The 4-hour chart of XAU/USD indicates that the price declined below the $2,020 support. It also traded below a major bullish trend line with support at $2,020. The decline was such that the price spiked below the $2,000 level and tested the 100 Simple Moving Average (red, 4 hours).
It seems like there is major support forming near the $1,980 level. A close below the $1,980 support might send the price toward the $1,950 support or the 200 Simple Moving Average (green, 4 hours).
Immediate resistance near the $2,015 level. The next major resistance is near the $2,020 level. Any more gains might send the price toward the $2,050 level.
To continue higher, the bulls need to clear the $2,050 resistance region. If they succeed, the price might start a steady increase toward $2,080. In the stated case, the price may perhaps rise toward the $2,120 level in the coming sessions.
Looking at EUR/USD, the pair was supported above the 1.0880 level and it seems like the bulls might attempt a fresh increase.
Economic Releases to Watch Today
- UK Consumer Price Index for March 2023 (YoY) – Forecast +9.8%, versus +10.4% previous.
- UK Core Consumer Price Index for March 2023 (YoY) – Forecast +6.0%, versus +6.2% previous.
- Euro Zone CPI for March 2023 (YoY) - Forecast +6.9%, versus +6.9% previous.
- Euro Zone CPI for March 2023 (MoM) - Forecast +0.9%, versus +0.9% previous.
BoC Macklem: Inflation coming down quickly, but more concerned about upside risks
BoC Governor Tiff Macklem, during a parliamentary committee hearing, spoke on the progress made in curbing inflation. He stated, "Inflation is coming down quickly—data this morning show it fell to 4.3% in March. And we forecast it to be around 3% this summer."
He emphasized the need for inflation expectations, services price inflation, wage growth, and corporate pricing behavior to normalize before inflation can reach the 2% target. He warned, "if monetary policy is not restrictive enough to get us all the way back to the 2% target, we are prepared to raise the policy rate further to get there."
Macklem, expects inflation to return to 2% by the end of 2024 and noted that Canadian GDP growth would be weak for the rest of this year, gradually picking up in 2024 and through 2025.
He identified the biggest upside risk as the stickiness of services price inflation and the key downside risk as a global recession. While acknowledging that the risks around the inflation forecast are roughly balanced, he noted, "with inflation still well above our target, we continue to be more concerned about the upside risks."