Sample Category Title
GBP/USD Daily Outlook
Daily Pivots: (S1) 1.2379; (P) 1.2414; (R1) 1.2461; More...
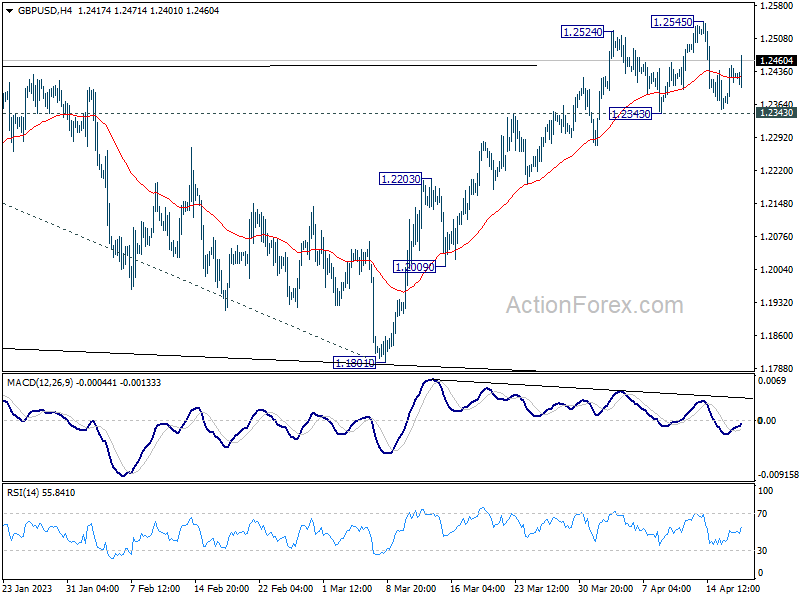
GBP/USD recovers further today but it's staying gin range of 1.2343/2545. Intraday bias remains neutral for the moment. Another rise is in favor with 1.2343 support intact. On the upside, above 1.2545 will target 1.2759 fibonacci level first. Firm break there will target 61.8% projection of 1.0351 to 1.2445 from 1.1801 at 1.3095. However, considering bearish divergence condition in 4H MACD, firm break of 1.2343 will confirm short term topping, and turn bias back to the downside for deeper pullback.
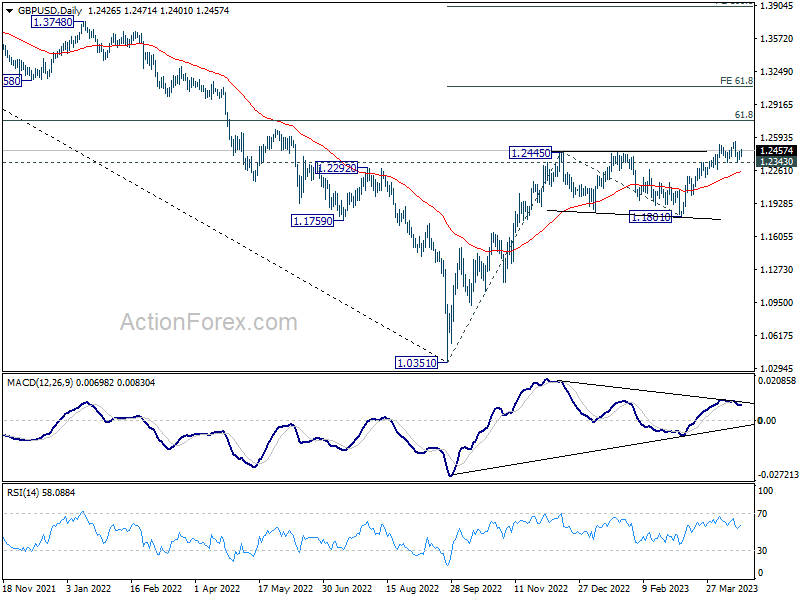
In the bigger picture, the rise from 1.0351 medium term term bottom (2022 low) is in progress for 61.8% retracement of 1.4248 (2021 high) to 1.0351 at 1.2759. Sustained break there will add to the case of long term bullish trend reversal. Further break of 61.8% projection of 1.0351 to 1.2445 from 1.1801 at 1.3095 could prompt upside acceleration to 100% projection at 1.3895. For now, this will remain the favored case as long as 1.1801 support holds, even in case of deep pull back.
USD/CHF Daily Outlook
Daily Pivots: (S1) 0.8947; (P) 0.8970; (R1) 0.8985; More...
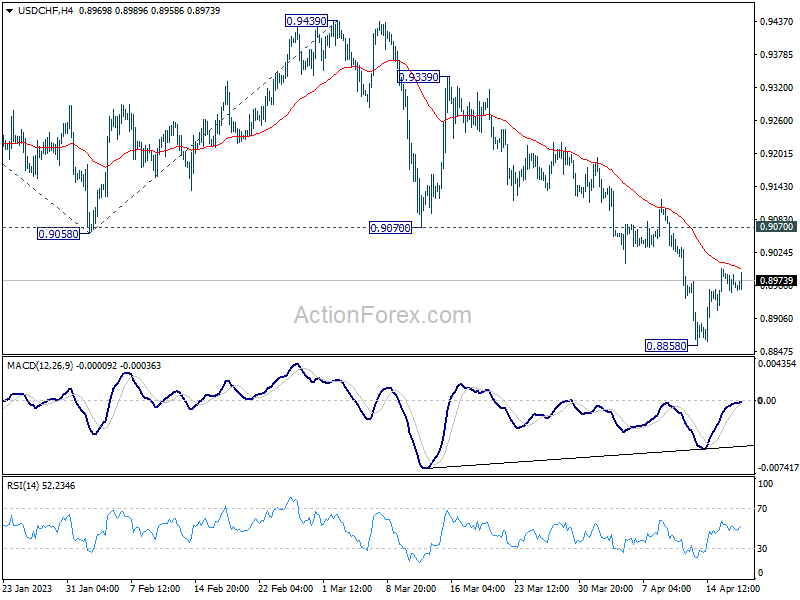
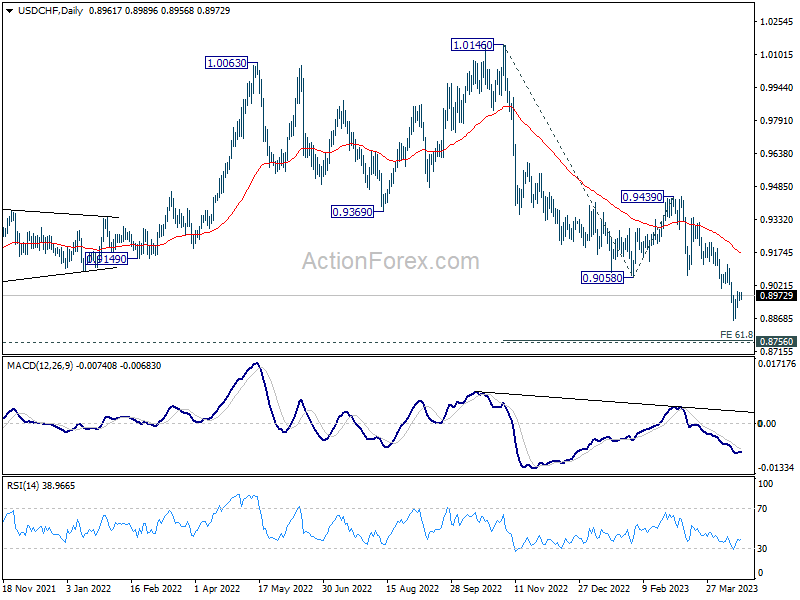
Intraday bias in USD/CHF stays neutral and outlook is unchanged. Another decline cannot be ruled out with 0.9070 support turned resistance intact. On the downside, below 0.8858 will resume the down trend to 61.8% projection of 1.0146 to 0.9058 from 0.9439 at 0.8767, which is close to 0.8756 long term support. Strong support is expected there to bring rebound, at least on first attempt. On the upside, break of 0.9070 support turned resistance will confirm short term bottoming and turn bias back to the upside.
In the bigger picture, fall from 1.1046 (2022 high) is in progress for 0.8756 support (2021 low). But overall, this fall is still seen as a leg in the long term range pattern from 1.0342 (2016 high). So, downside should be contained by 0.8756 to bring reversal. Sustained break of 0.9058 support turned resistance will be the first sign of medium term bottoming. However, decisive break of 0.8756 will carry larger bearish implications.
AUD/USD Daily Report
Daily Pivots: (S1) 0.6696; (P) 0.6722; (R1) 0.6753; More...
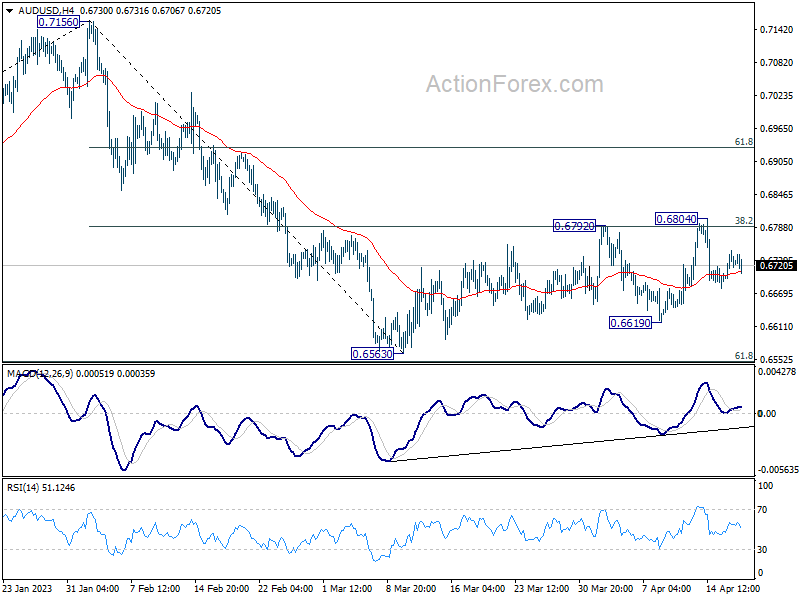
Intraday bias in AUD/USD remains neutral as corrective pattern from 0.6563 is still extending. On the downside, break of 0.6619 will indicate that decline from 0.7156 is resuming through 0.6563 low. Nevertheless, sustained break of 0.6804 will bring stronger rally back to 61.8% retracement of 0.7156 to 0.6563 at 0.6929.
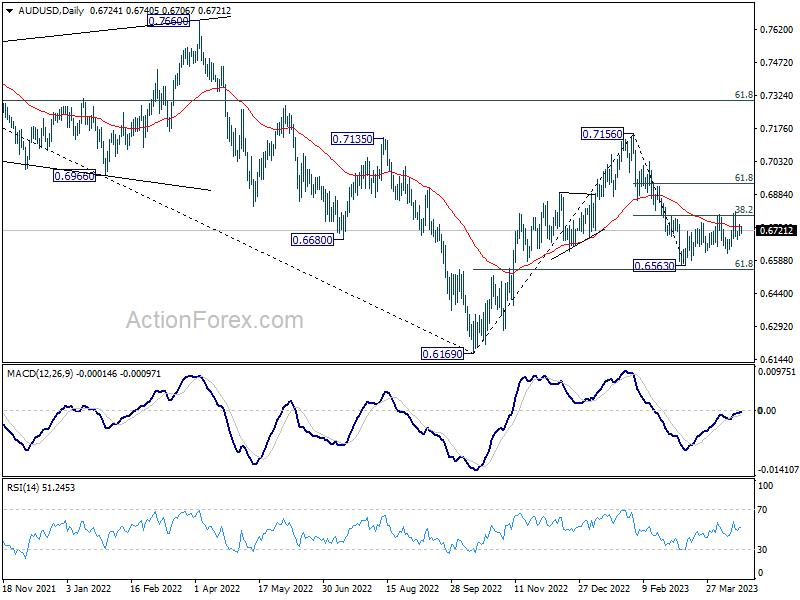
In the bigger picture, as long as 61.8% retracement of 0.6169 to 0.7156 at 0.6546 holds, the decline from 0.7156 is seen as a correction to rally from 0.6169 (2022 low) only. Another rise should still be seen through 0.7156 at a later stage. However, sustained break of 0.6546 will raise the chance of long term down trend resumption through 0.6169 low.
USD/CAD Daily Outlook
Daily Pivots: (S1) 1.3365; (P) 1.3383; (R1) 1.3407; More....
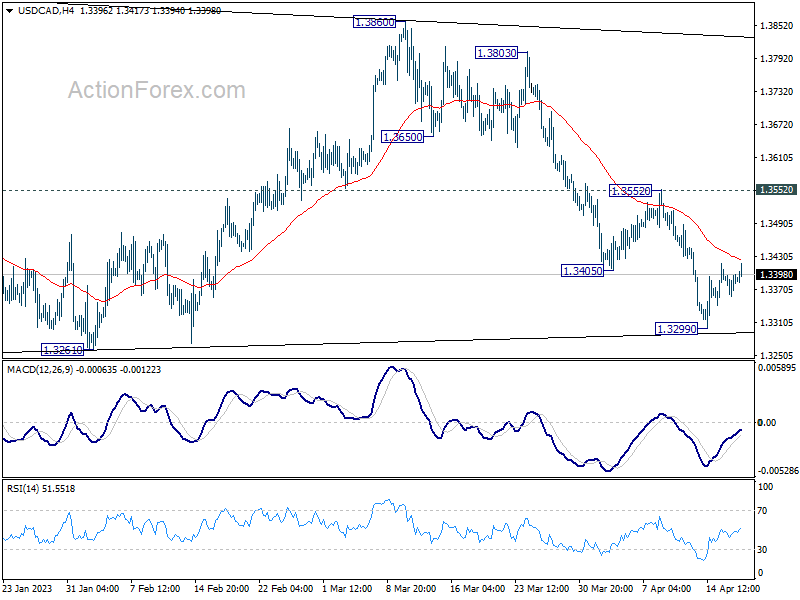
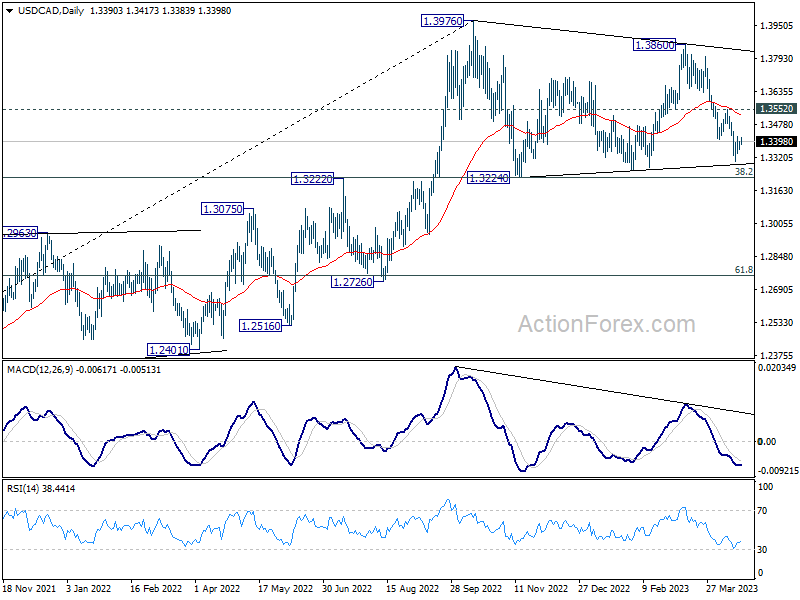
Intraday bias in USD/CAD remains neutral as it's staying in the corrective pattern from 1.3299. Overall, fall from 1.3860 is seen as the third leg of the corrective pattern from 1.3976. In case of another decline, down side should be contained by 1.3224/61 support zone to bring rebound. Break of 1.3552 should turn bias back to the upside for stronger rally.
In the bigger picture, the up trend from 1.2005 (2021 low) is still in progress. Break of 1.3976 will confirm resumption and target 61.8% projection of 1.2401 to 1.3976 from 1.3261 at 1.4234. Firm break there will pave the way to long term resistance zone at 1.4667/89 (2016, 2020 highs). On the downside, sustained break of 55 W EMA (now at 1.3282) is needed to confirm medium term topping. Otherwise, outlook will remain bullish even in case of deep pull back.
EUR/GBP Daily Outlook
Daily Pivots: (S1) 0.8817; (P) 0.8825; (R1) 0.8840; More...
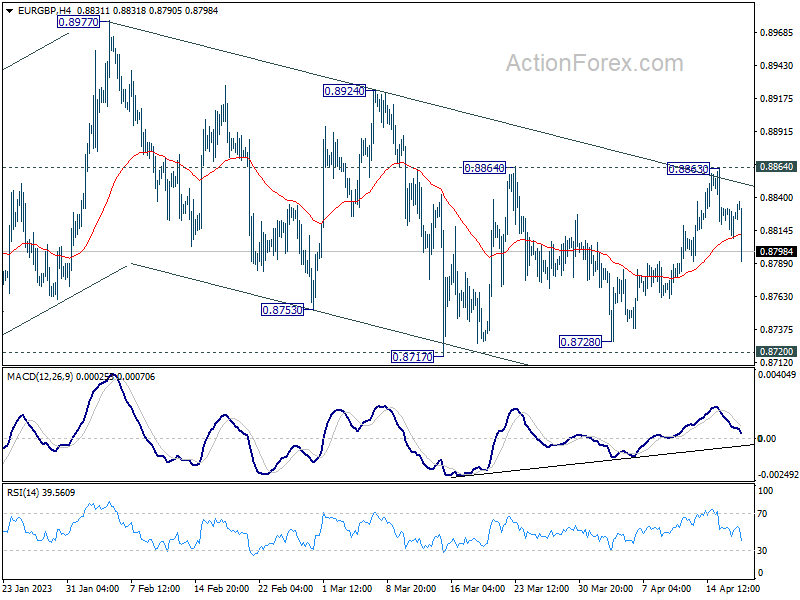
EUR/GBP is still bounded in range of 0.8717/8864 despite today's decline. Intraday bias remains neutral first. On the upside, firm break of 0.8864 will extend the rebound from 0.8717 to 0.8924 resistance. Further break there should confirm completion of the choppy decline from 0.8977, and should resume larger rise from 0.8545 through 0.8977 high. However, decisive break of 0.8717 support will resume the decline from 0.8977 instead.
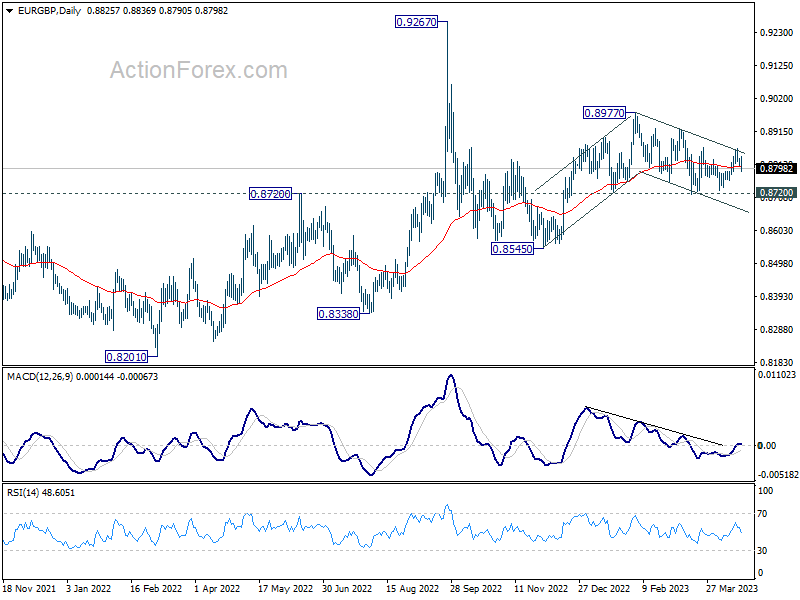
In the bigger picture, outlook remains rather mixed for now, except that price actions from 0.9267 (2022 high) are part of the long term range pattern from 0.9499 (2020 high). With 0.8720 support intact, rise from 0.8545 is in favor to continue through 0.8977. However, firm break of 0.8720 will argue that such rebound has completed, and open up deeper fall through this support level.
EUR/AUD Daily Outlook
Daily Pivots: (S1) 1.6264; (P) 1.6293; (R1) 1.6339; More...
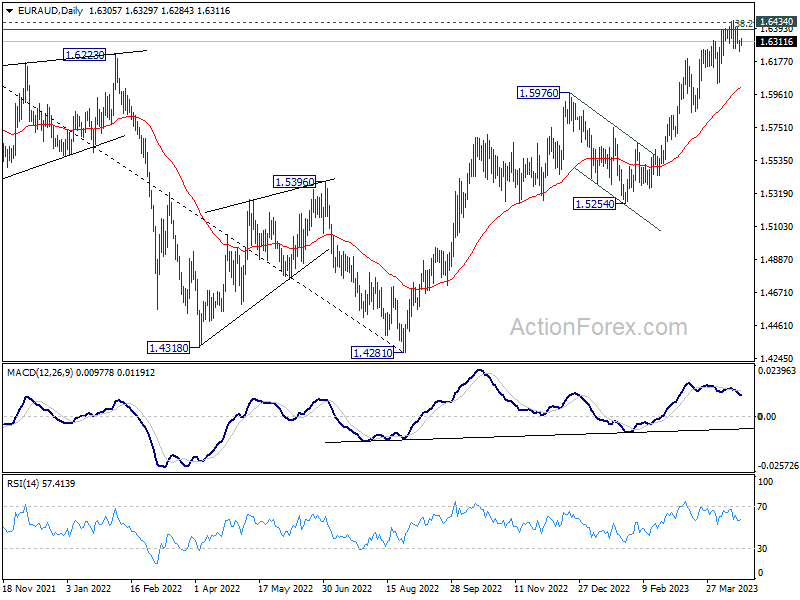
Range trading continues in EUR/AUD and intraday bias remains neutral at this point. On the upside, decisive break of 1.6434 resistance will carry larger bullish implications. However, considering bearish divergence condition in 4H MACD, firm break of 1.6216 should confirm short term topping, after rejection by 1.6389/6434 cluster resistance zone. Intraday bias will be back on the downside in this case, to 1.6033 support and possibly below.
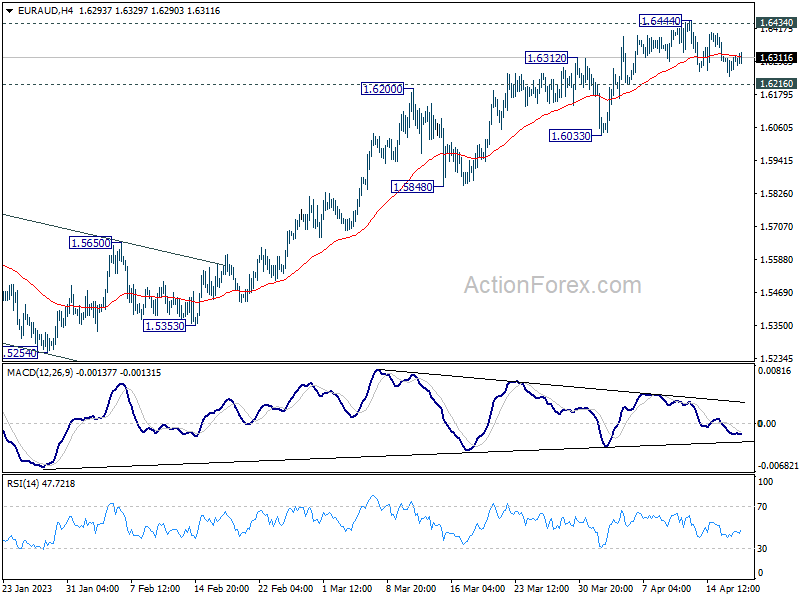
In the bigger picture, focus stays on 1.6389/6434 cluster resistance (38.2% retracement of 1.9799 to 1.4281 at 1.6389). Sustained break there should confirm that whole down trend from 1.9799 (2020 high) has completed. Further rally should then be seen to 61.8% retracement at 1.7691. However, rejection by this cluster resistance will make medium term outlook neutral at best.
EUR/CHF Daily Outlook
Daily Pivots: (S1) 0.9817; (P) 0.9830; (R1) 0.9849; More...
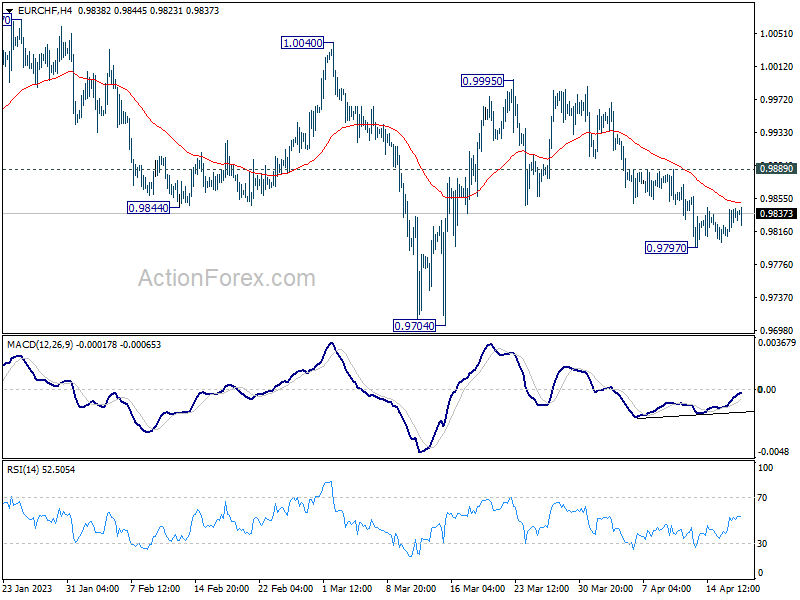
EUR/CHF is staying in consolidation above 0.9797 temporary low and intraday bias remains neutral at this point. Deeper decline is in favor with 0.9889 minor resistance intact. Break of 0.9797 will target 0.9704 support and possibly below, as whole corrective pattern from 1.0095 extends. On the upside, though, break of 0.9889 minor resistance will turn intraday bias back to the upside for stronger rebound.
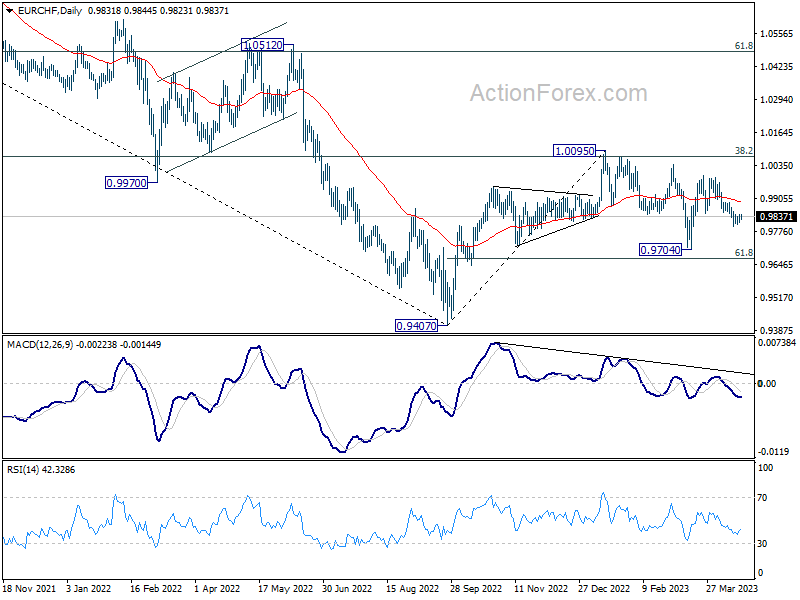
In the bigger picture, prior rejection by 55 W EMA (now at 0.9989) and 38.2% retracement of 1.1149 to 0.9407 at 1.0072 suggests that medium term outlook is staying bearish. That is, down trend from 1.2004 is not completed yet and is in favor to resume through 0.9407 at a later stage. However, decisive break of 1.0095 resistance will raise the chance of bullish trend reversal. Rise from 0.9407 should then target 1.0505 cluster resistance (2020 low at 1.0505, 61.8% retracement of 1.1149 to 0.9407 at 1.1484).
EUR/JPY Daily Outlook
Daily Pivots: (S1) 146.80; (P) 147.09; (R1) 147.45; More....
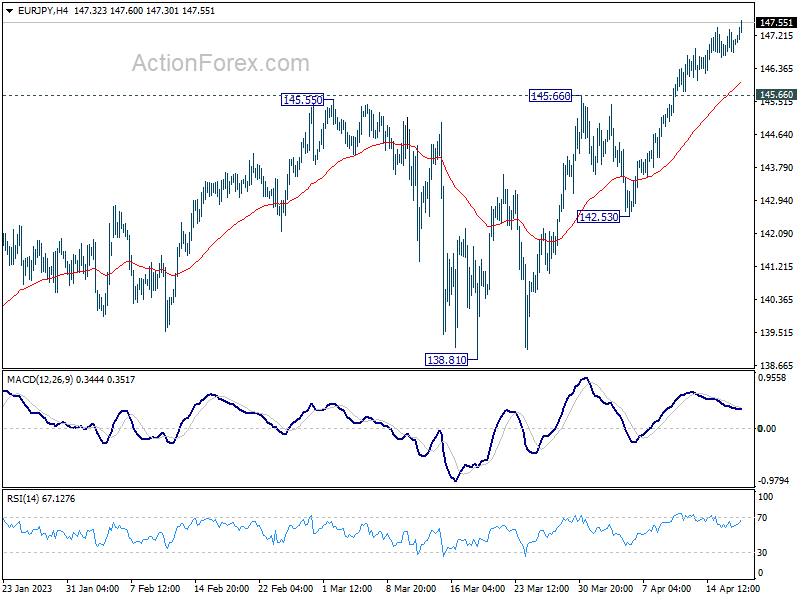
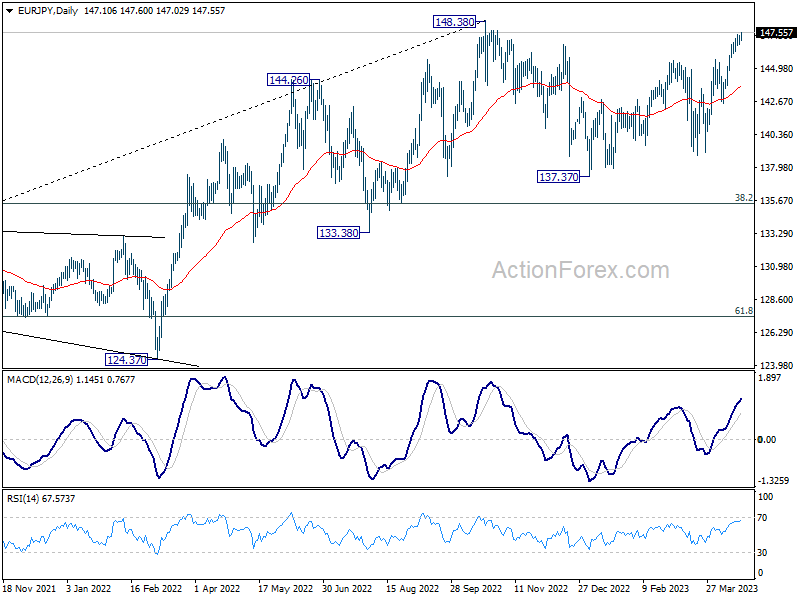
Upside momentum remains unconvincing in EUR/JPY as seen in 4H MACD. Still, further rally is expected as long as 145.66 resistance turned support holds. Rise from 137.37 should target 148.38 high. Firm break there will resume larger up trend to 149.75 long term resistance. However, break of 145.66 will turn bias back to the downside for 142.53 support instead.
In the bigger picture, as long as 55 W EMA (now at 140.44) holds, larger up trend from 114.42 (2020 low) is still in progress for 149.76 long term resistance. Decisive break there will resume long term up trend. However, sustained break of 55 W EMA will bring deeper fall to 38.2% retracement of 114.42 to 148.38 at 135.40.
Time to Take Note of Japan’s Stock Market Again
- Emerging markets and China’s risk premiums over Japan have been narrowed.
- Japan is considered a potential defensive play as its stock market valuation is much lowered than the rest of the world.
- Nikkei 225 is consolidating within a long-term uptrend phase in place since March 2009.
The Japanese stock market has underperformed and languished against the US since the infamous burst of Japan’s property bubble in early 1990 that led to two decades of sticky deflation. Even though, the implementation of “Abenomics” in December 2012; a potent mix of expansionary fiscal and monetary policies had led to an accumulated gain of 150% seen in the Nikkei 225 till the end of 2022, it is still 36% below its all-time high level of 38,957 printed in December 1989 before the bursting of the property bubble from its current level of 28,590 at this time of the writing.
Why this time may be different?
Let’s take a trip down memory lane. The underperformance of Japanese equities against the rest of the world since 1990 has been attributed to two main factors; localized demographics where Japan’s birth rate declined faster than the increase in her aging population which led to lower productivity.
Secondly, the entry of China into the World Trade Organization in December 2001 kickstarted two decades of globalization that saw the emergence and attractiveness of a new investing asset class, emerging markets over the prior 1980s decade of Japan’s electronics exports dominance.
Fast forward to today, the world is in a much different place; globalization has broken down since the US-China trade war implemented by the Trump administration in 2018, and under the current Biden administration, the rivalry between the two major superpowers remains intact, this time round is the “battle” of securing high-end semiconductor chips.
The impact of such “hostilities” between the US and China has led to a breakdown of globalization and the “emerging markets risk premium” once sought after by international investors has either narrowed or diminished. Also, China is now facing an aging population problem where its population shrank to a level below total deaths in 2022, the first time such an occurrence happen since the 1960s.
Hence, the edge once enjoyed by China and emerging markets over Japan is likely to take a backseat.
Japan’s central bank, BoJ may be forced to normalize its ultra-easy monetary policy
On 20 December, BoJ made a significant adjustment to the controlled bandwidth of its yield curve control (YCC) policy; another form of “creative” quantitative easing program that was introduced in September 2016. The latest YCC policy adjustment has now allowed the 10-year JGB bond yield to move 50 basis points on either side of the 0% target, wider than the previous 25 basis point band.
This “step-up” tweak is likely to be a precursor to an interest rate hike in 2023 by the BoJ as it normalized its decade-long ultra-loose monetary policy in Japan due to a growth in inflationary pressures where the core inflation has increased steadily above 2% year-on-year (the central bank’s target) for several consecutive months since April 2022.
Given that prices of market-based transacted financial instruments are determined by a significant portion of greed and fear, thus a small policy adjustment or tweak is likely to trigger a butterfly effect in the global financial markets.
Also, bearing in mind that Japanese corporations (financial institutions & non-financial institutions) are one of the highest net exporters of capital on a global scale as they seek to invest overseas to get a better return, and such flows of funds may start to flow back to Japan due to the normalization of domestic monetary policy.
For example, overseas fixed income yield premium over similar Japanese investment instruments is likely to be narrowed, hence making outbound investments unattractive for Japanese corporations on a hedged currency basis. Hence, it may trigger a positive feedback loop in the Japanese stock market.
Japan’s stock market may be considered a defensive play
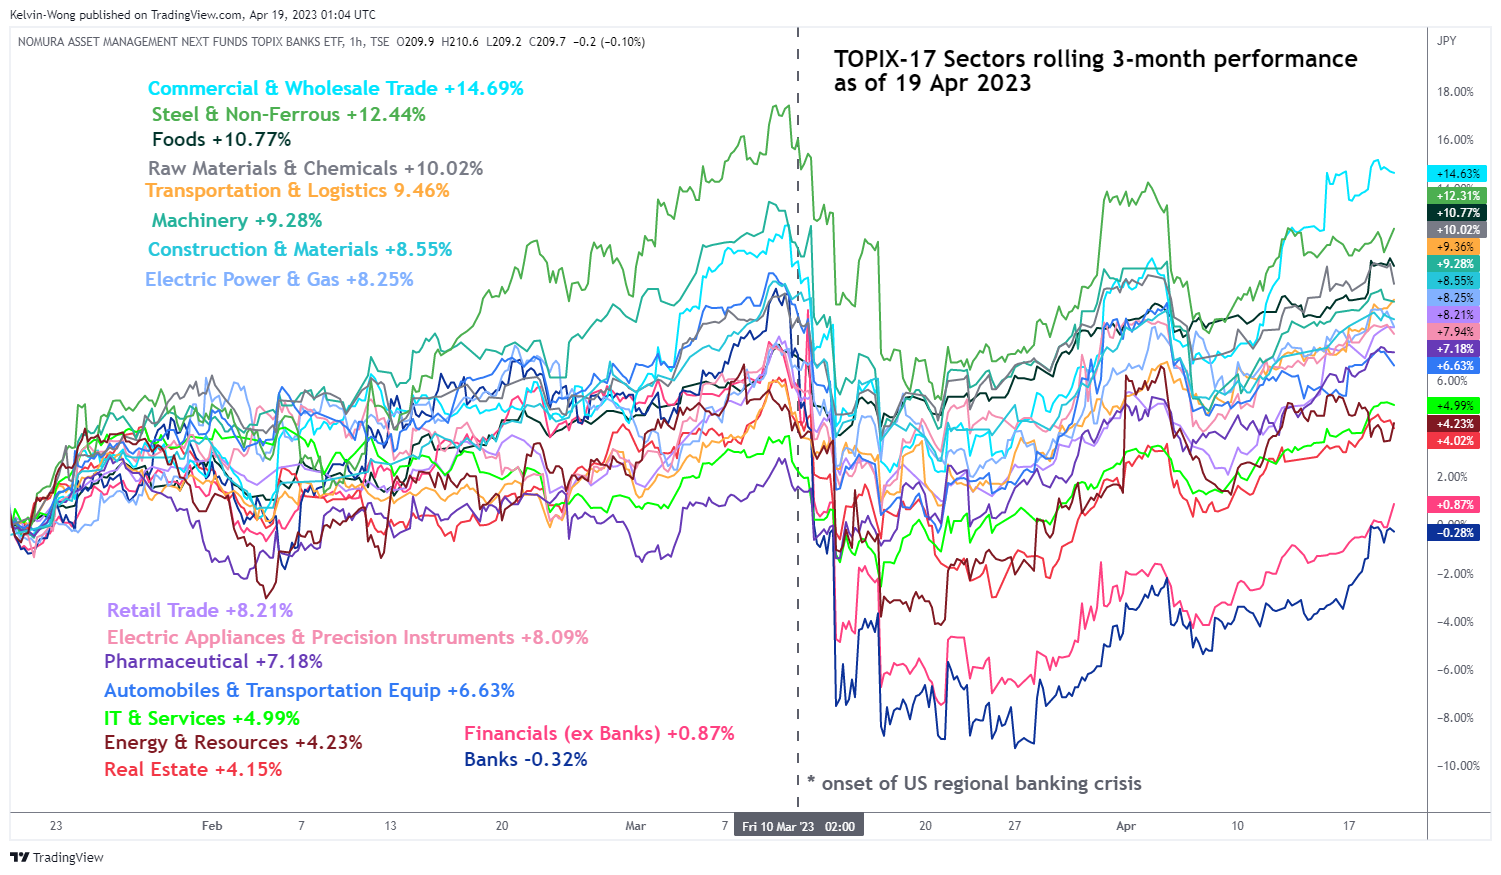
Source: TradingView as of 19 Apr 2023
Japan 225 Technical Analysis – Consolidating within a long-term secular uptrend phase with positive elements
Source: TradingView as of 19 Apr 2023
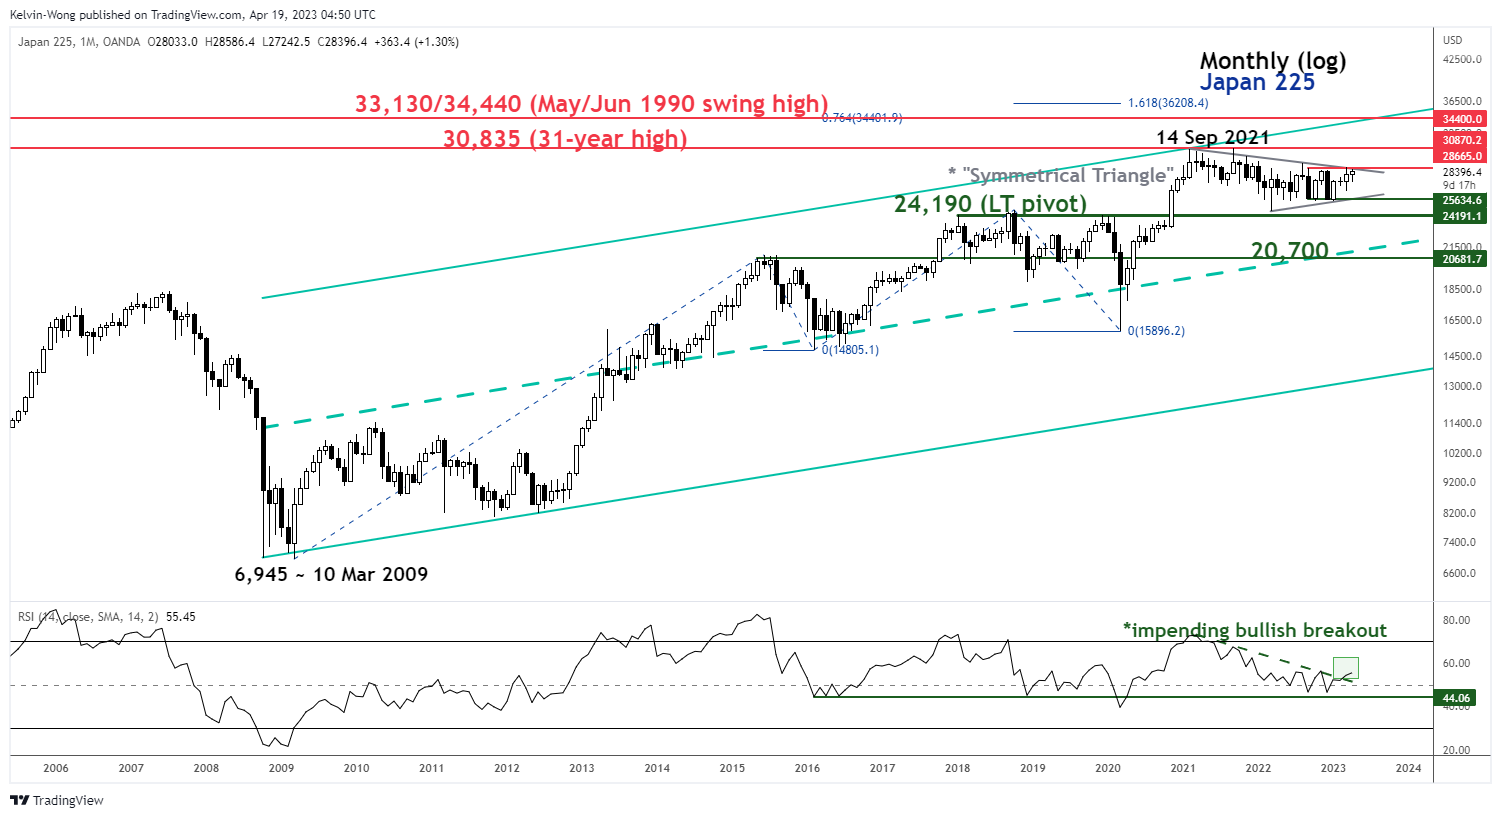
Since its 31-year high of 30,835 printed on 14 September 2021, the Japan 225 Index (a proxy for the Nikkei 225 futures) has evolved into a consolidation “Symmetrical Triangle” range configuration for 18 months within a long-term secular uptrend in place since 10 March 2009 low of 6,945.
The upper (resistance) and lower (support) boundaries of the “Symmetrical Triangle” is at 28,665 and 25,630 respectively.
The monthly RSI oscillator has staged an impending bullish breakout from its corresponding descending resistance which indicates a revival of long-term upside momentum that may translate to a potential bullish breakout of the “Symmetrical Triangle” range configuration of the Index.
However, a break with a weekly close below 24,190 long-term pivotal support invalidates the bullish tone for a decline towards the next support at 20,700.
USD Consolidates Gains
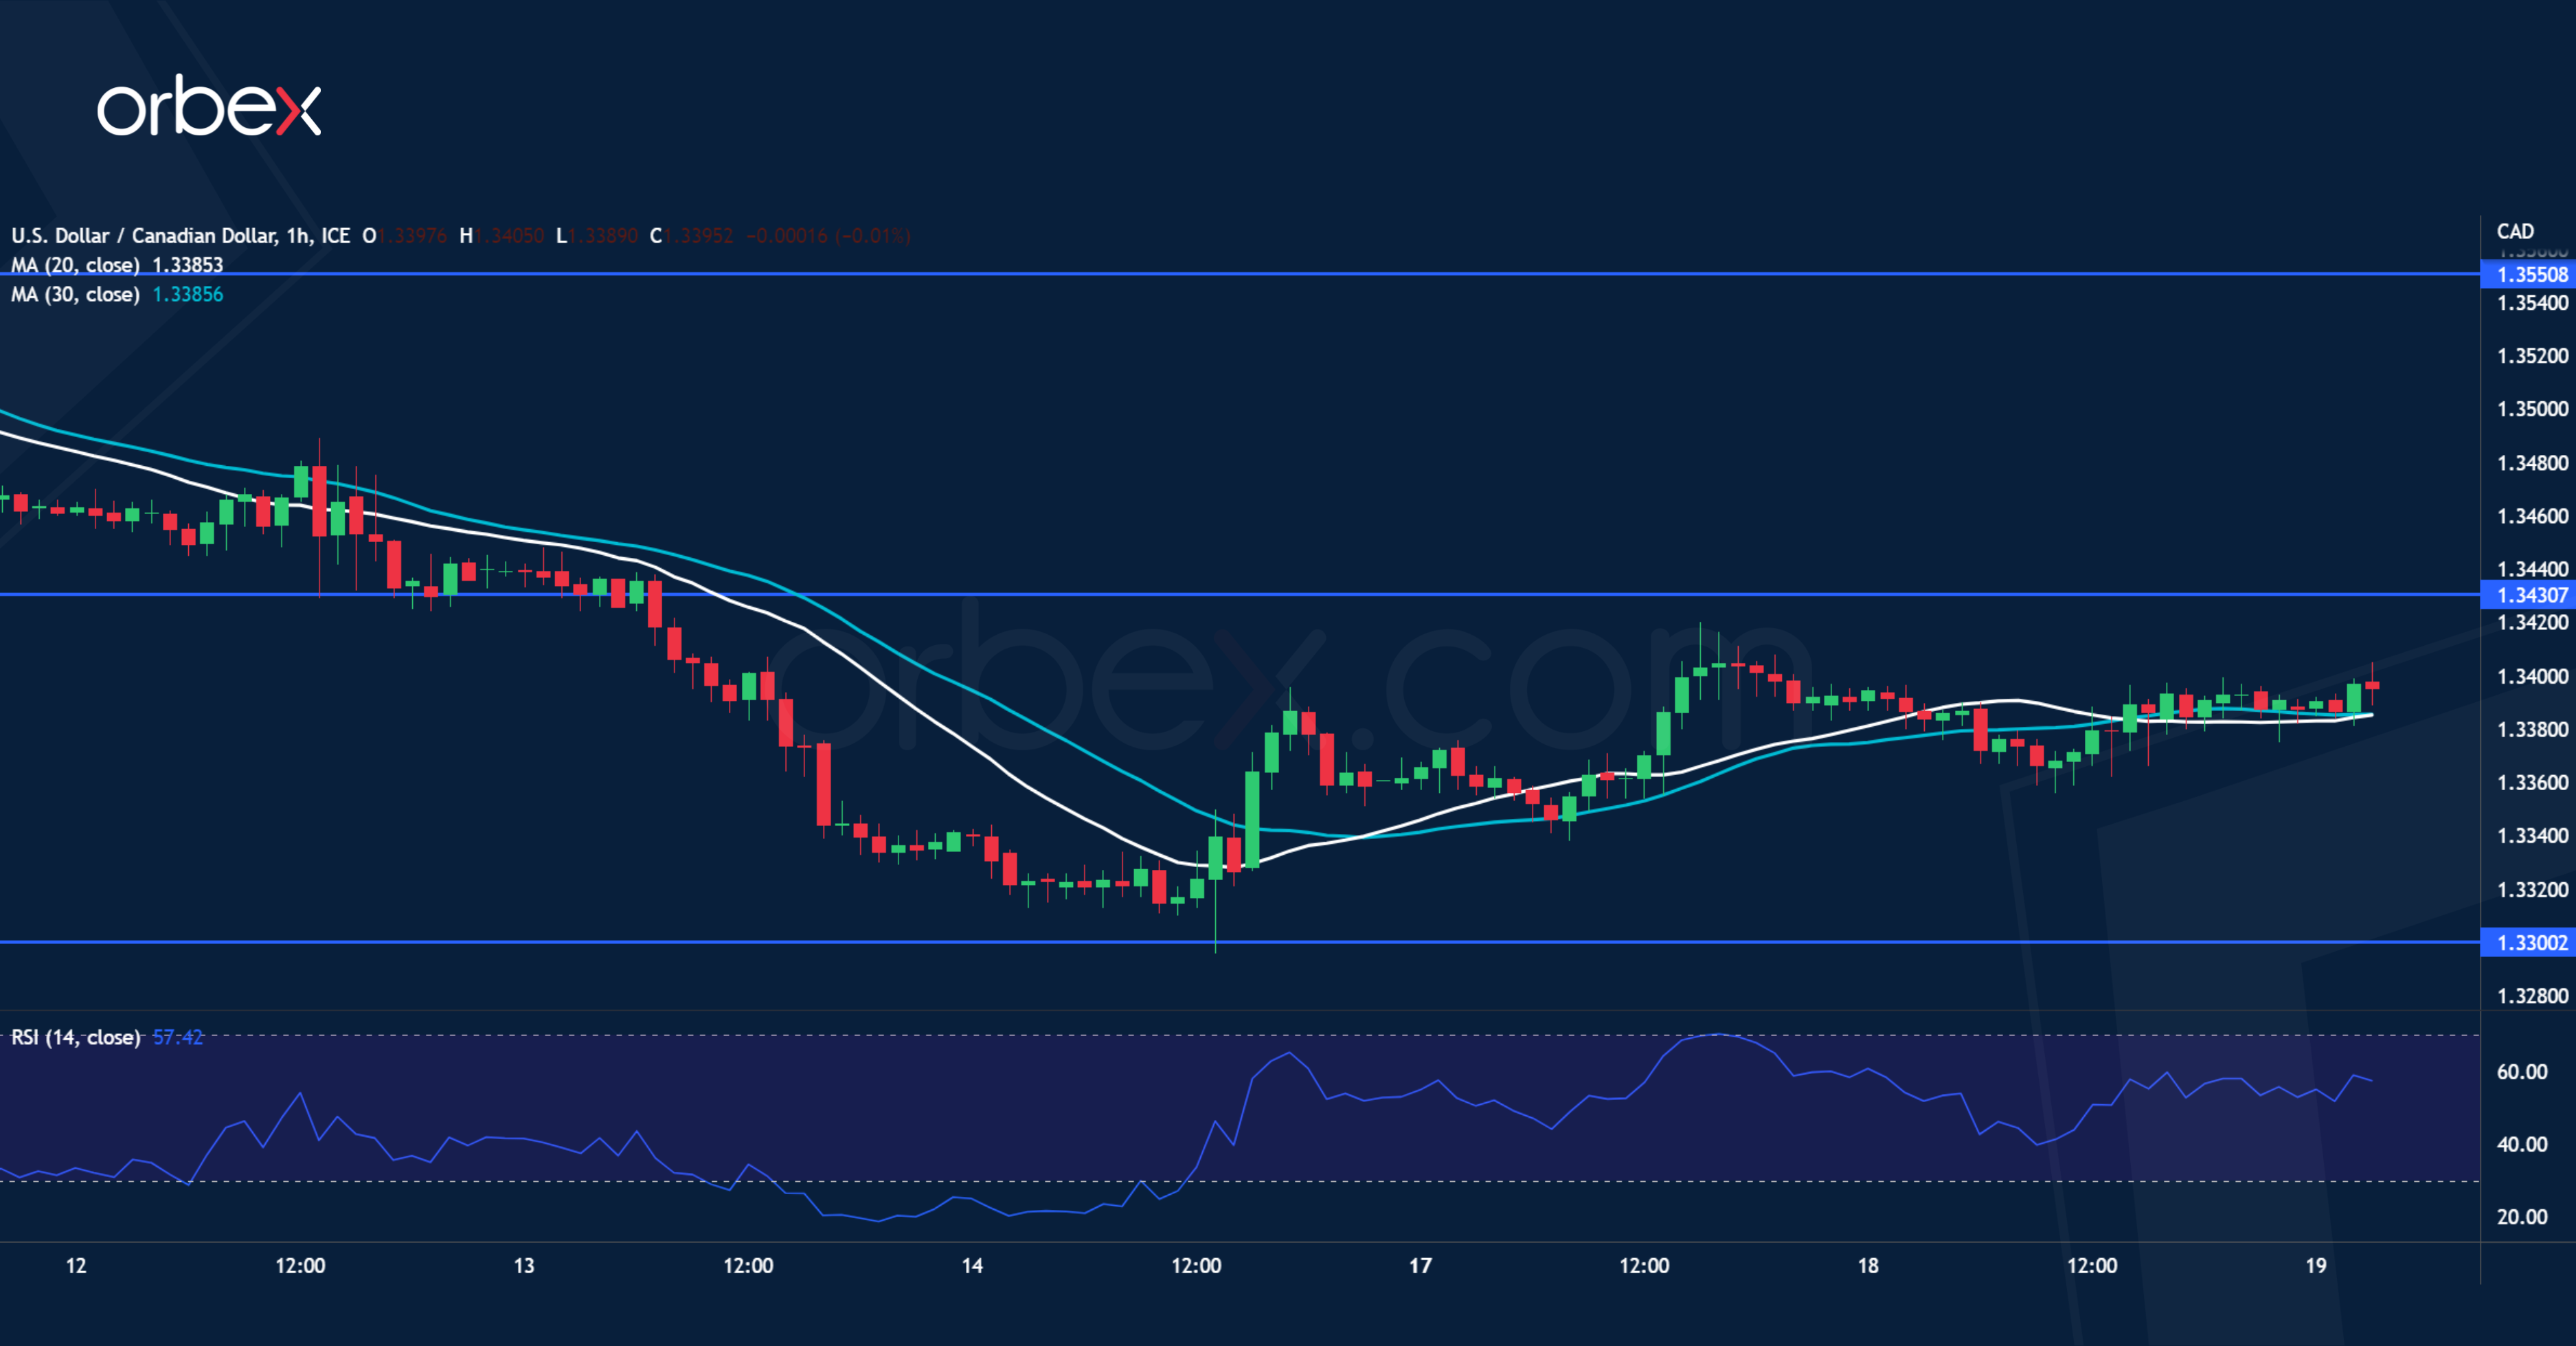
USD/CAD bounces off critical floor
The Canadian dollar retreats as the annual CPI showed a deceleration last month. The pair is still holding on to the February’s lows around 1.3300 with traders buying the dip in this major demand zone. The former support at 1.3430 is the first hurdle to lift to ease the downward pressure. Then the bulls will need to clear 1.3550 near the 30-day SMA before they could hope for a sustained recovery. Otherwise, a break below the critical level of 1.3300 would force buyers to bail out and trigger a bearish reversal in the medium-term.
EUR/GBP hits resistance
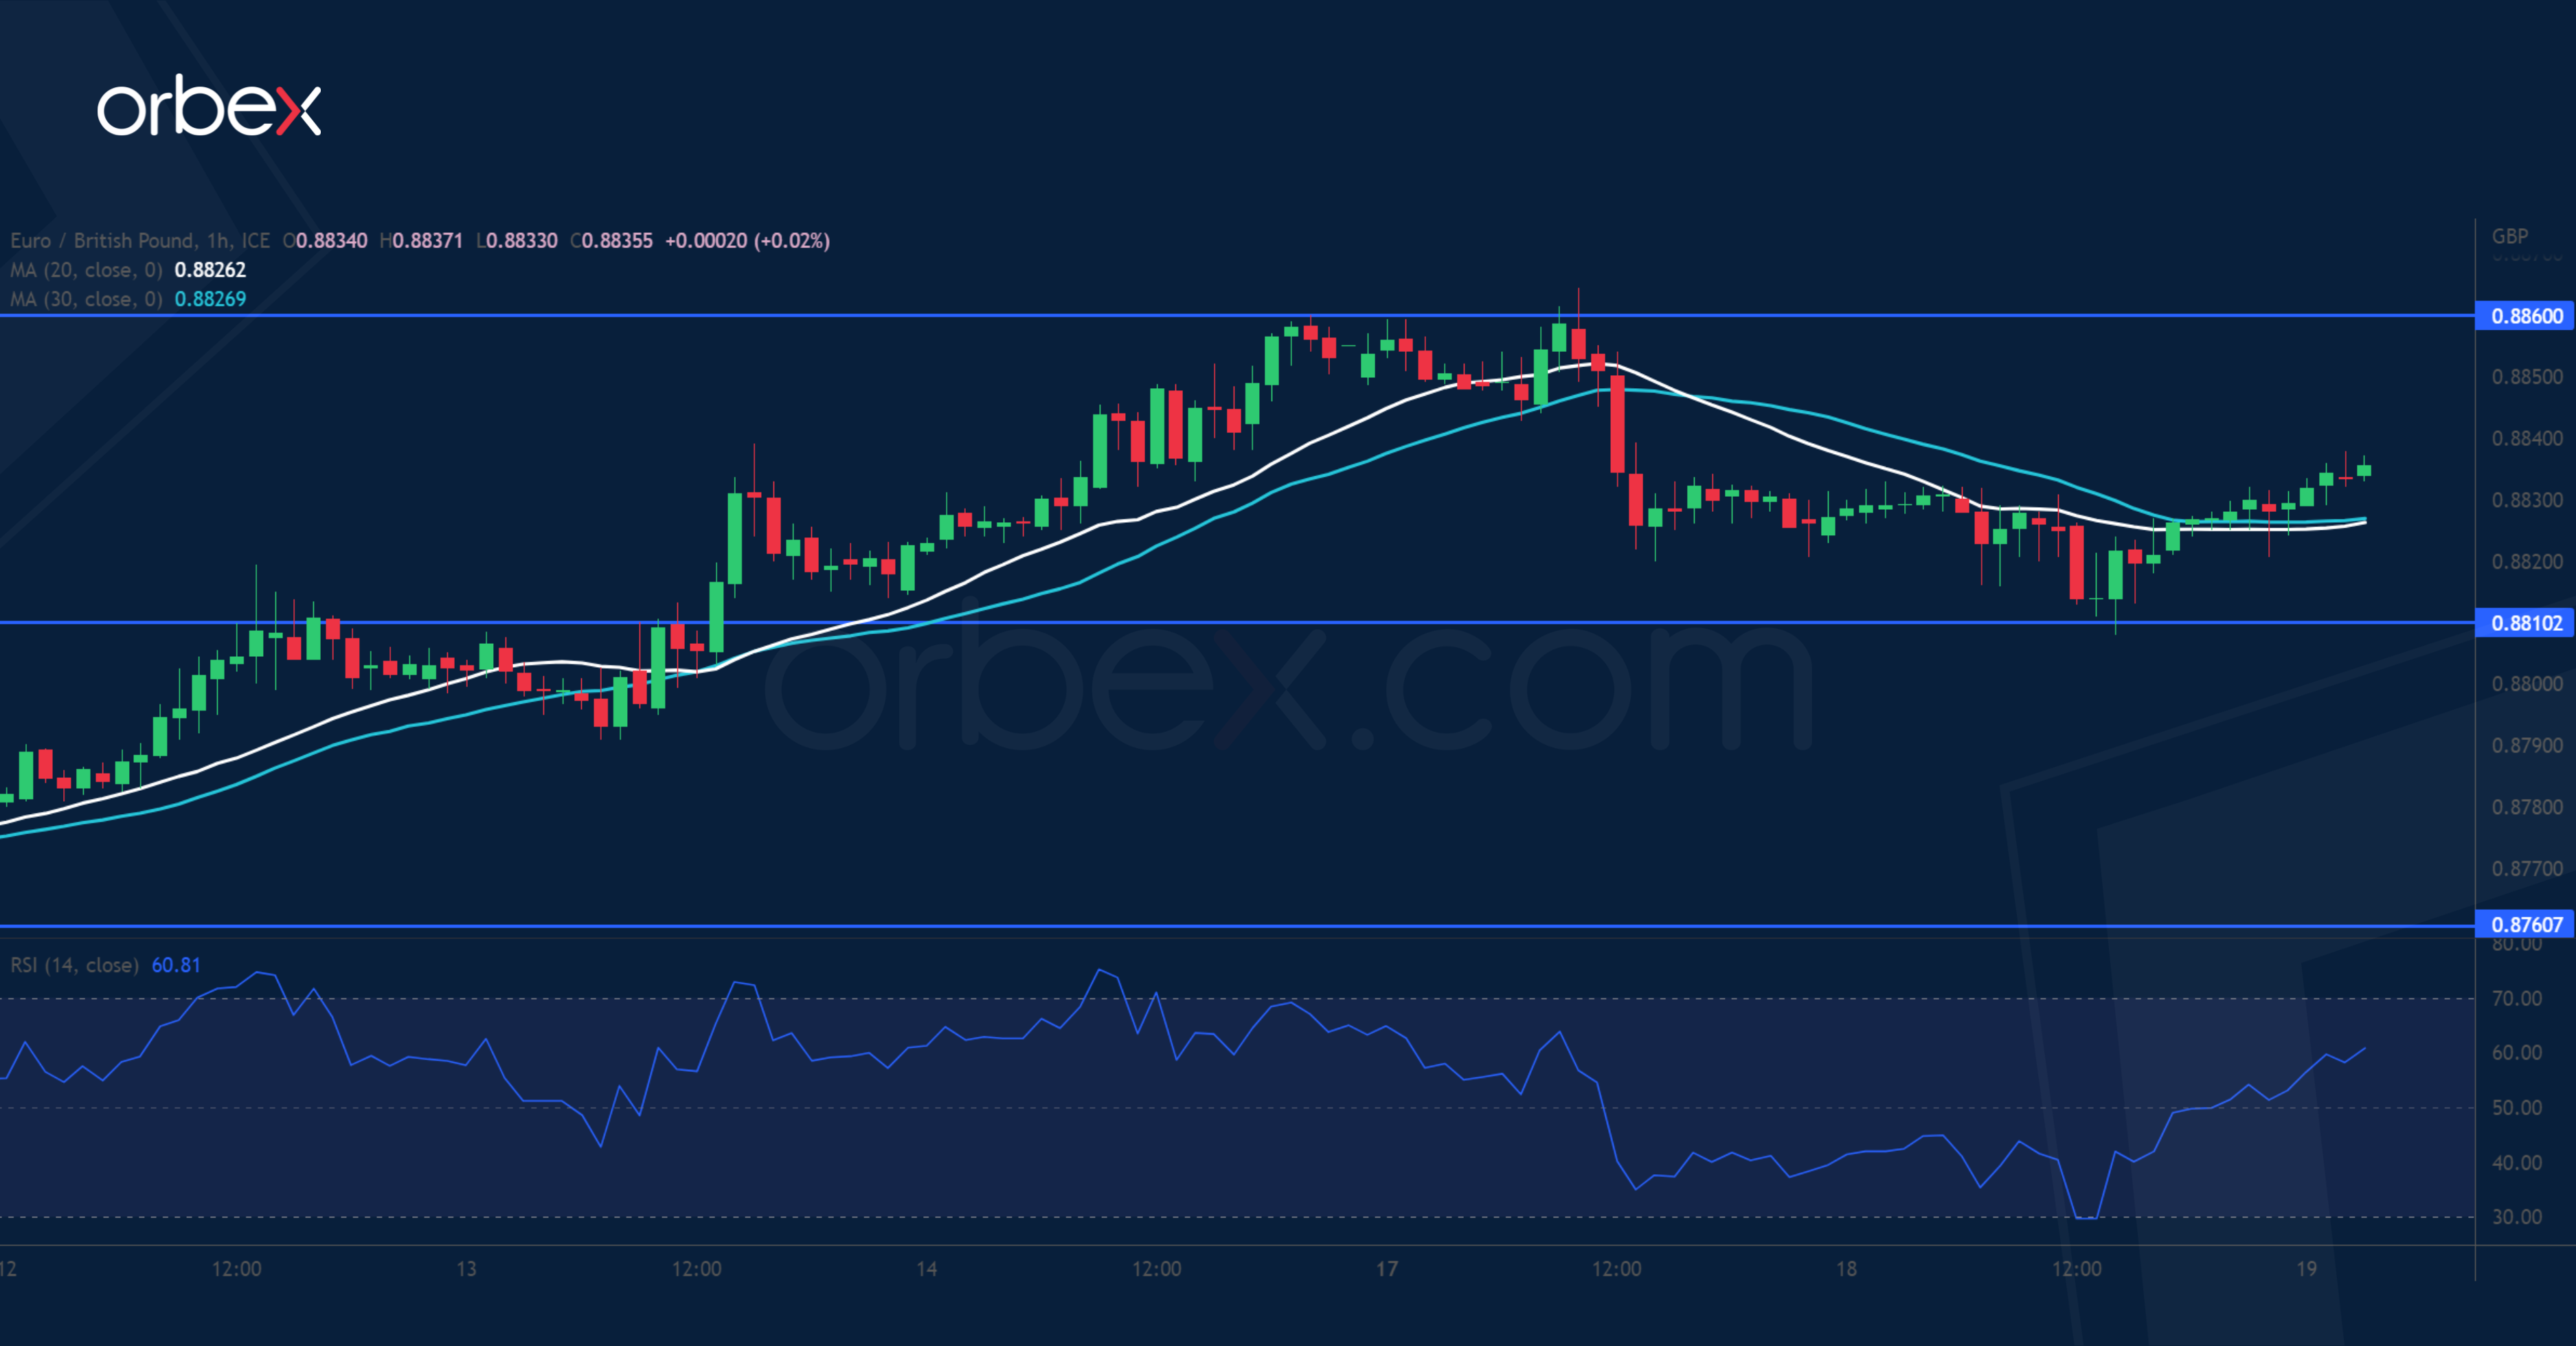
The pound bounces back as solid wage growth raises the odds of BoE rate rise. On the daily chart, the pair is consolidating its gains over 0.8720 which shows strong enough interest in keeping the bullish bias intact in the medium-term. However, intraday actions may see some choppy waters after the bulls hit a wall at 0.8860. 0.8810 is the first support with 0.8760 at the base of the current bounce as a second line of defence. A close above 0.8860 may attract momentum buyers and send the pair to March’s high of 0.8920.
Dow Jones 30 extends further
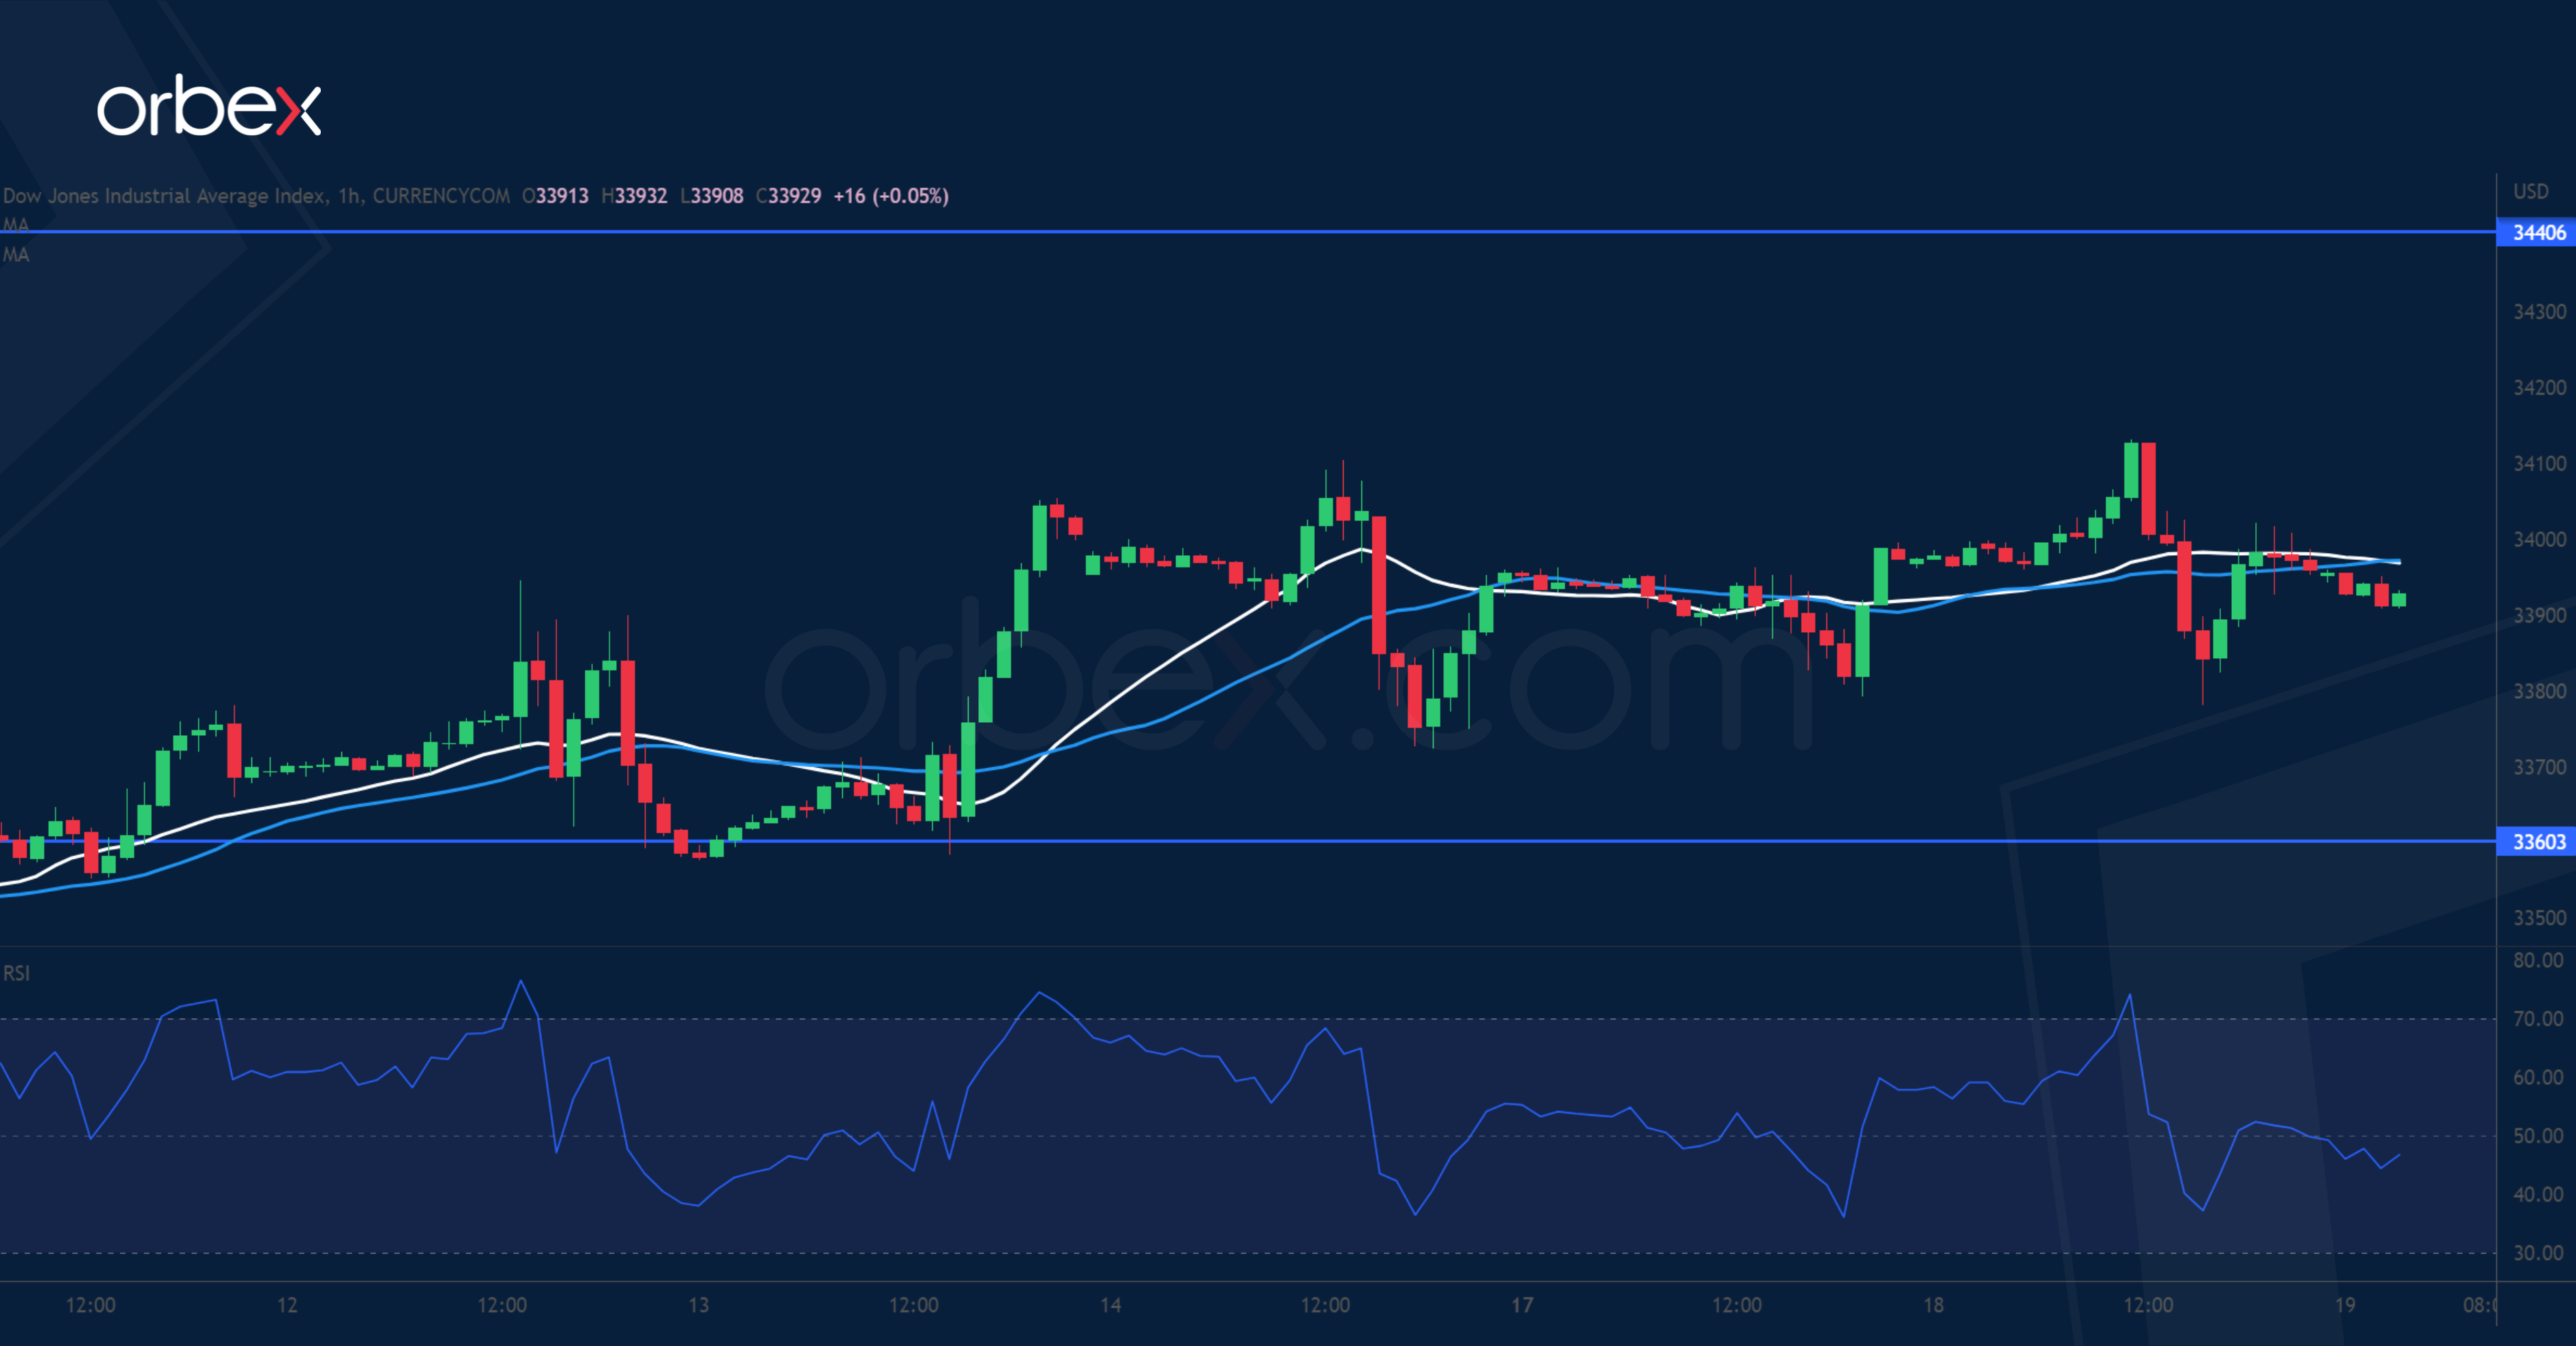
The Dow Jones 30 steadies as the first-quarter earnings season kicks off. A bullish MA cross on the daily chart after the index cleared the March high of 33600 is a sign of improved sentiment after the index started the year on the defensive. The bulls would flush out the remaining selling interests if they manage to lift offers at the year’s peak of 34400, then the path would be clear for an extension towards the all-time high of 37000 from January 2022. On the downside, 33600 has become a support in case of a pullback.