Sample Category Title
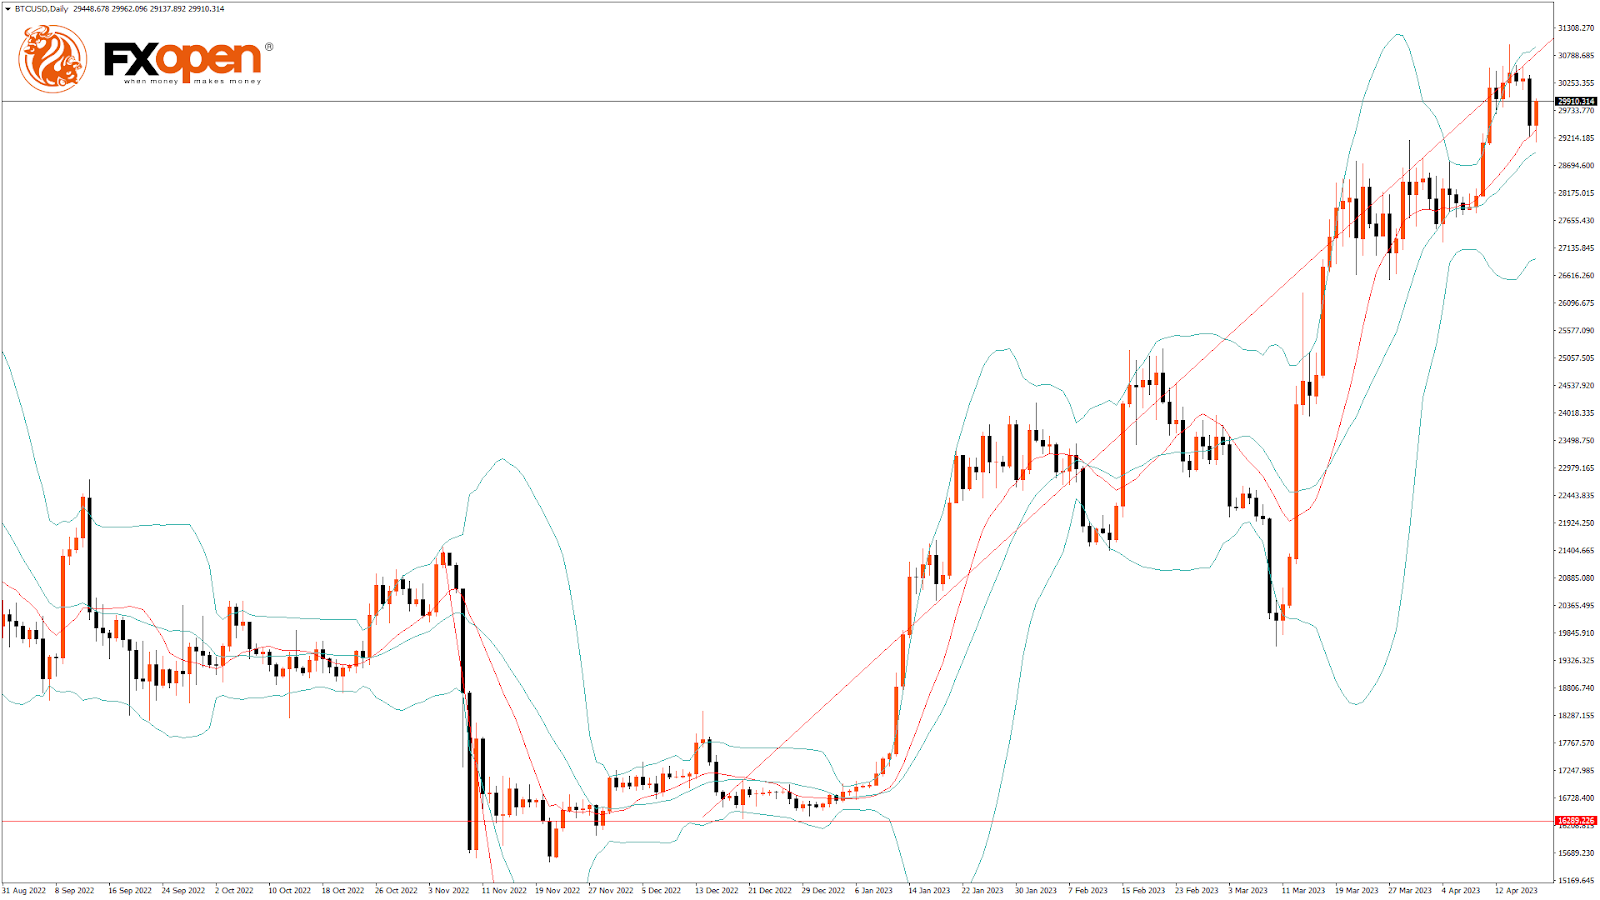
WTI Oil Price Fell for the Second Straight Day, Extending Pullback from $83.51 Top
Fresh weakness emerges from persisting worries about further increase of US interest rates and darkened growth outlook, with much stronger than expected China’s GDP data being insufficient to improve negative near-term sentiment.
Investors are particularly concerned about the situation in the US, after the economy was shaken by the collapse of two banks and not fully convinced that the worst is over.
In addition, further tightening in the monetary policy is very likely and tighter credit conditions would further undermine economic growth, still fragile according to the latest US economic data.
Further pressure on oil prices comes from signals that Iraq is on the way to resume oil exports, which were stopped last month.
Technical picture on daily chart is bullish overall, but loss of bullish momentum suggests that the near-term action may stand at the back foot for some time.
Dips so far face strong headwinds at psychological $80 support, which marks the upper boundary of pivotal support zone between $80 and $79 (the latter marks Fibo 23.6% retracement of 64.34/83.51 rally and Apr 3 low when the market opened with nearly $5 gap higher.
Immediate bullish structure is expected to remain intact while the action holds above these levels, though deeper dips cannot be ruled out, mainly dependent on fundamentals.
Larger bulls won’t be significantly harmed as long as gap remains unfilled, with extended pullback to face solid supports at $77.00/$76.00 zone.
Broken 10DMA reverted to immediate resistance ($81.31), violation of which would improve near-term structure and open way for fresh attack at key barriers at $82.75/$83.51 (200DMA / Apr 12 peak).
Res: 81.31; 81.98; 82.75; 83.51
Sup: 80.00; 79.35; 78.98; 78.14
BTCUSD Formed a Bullish Spinning Top Pattern above $29,138
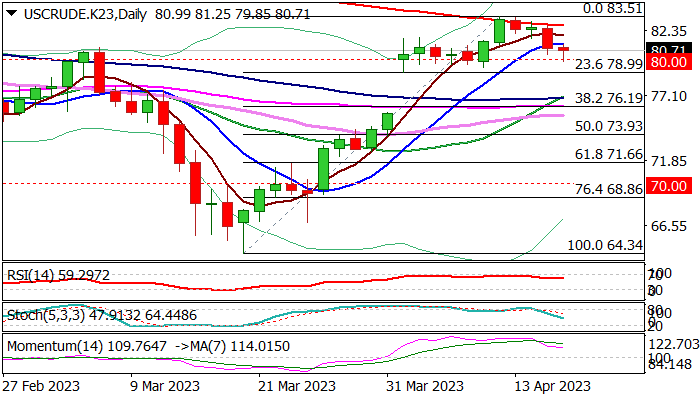
Bitcoin continues its bullish momentum from last week, and after touching a low of $29,138 on April 18, it moved towards a consolidation phase, after which we expect an upward movement to the $30,500-$32,000 range.
The market opened bullish this week. There is a bullish spinning top pattern above the $29,138 handle on the H1 timeframe.
Bitcoin continues to move up in a mild bullish momentum and is now aiming to cross the $30,000 psychological barrier.
Both the STOCH and STOCHRSI are in overbought zones, meaning that a decline in the price is expected in the immediate short term.
Bitcoin continues to range near a new 1-year high in the weekly timeframe.
The relative strength index is at 63.29, indicating a strong demand for Bitcoin and the continuation of the buying pressure in the markets.
Bitcoin is now moving above the 100-hour exponential and 200-hour exponential moving averages.
Most of the major technical indicators are bullish; the targets for the immediate short term are $30,500 and $32,000.
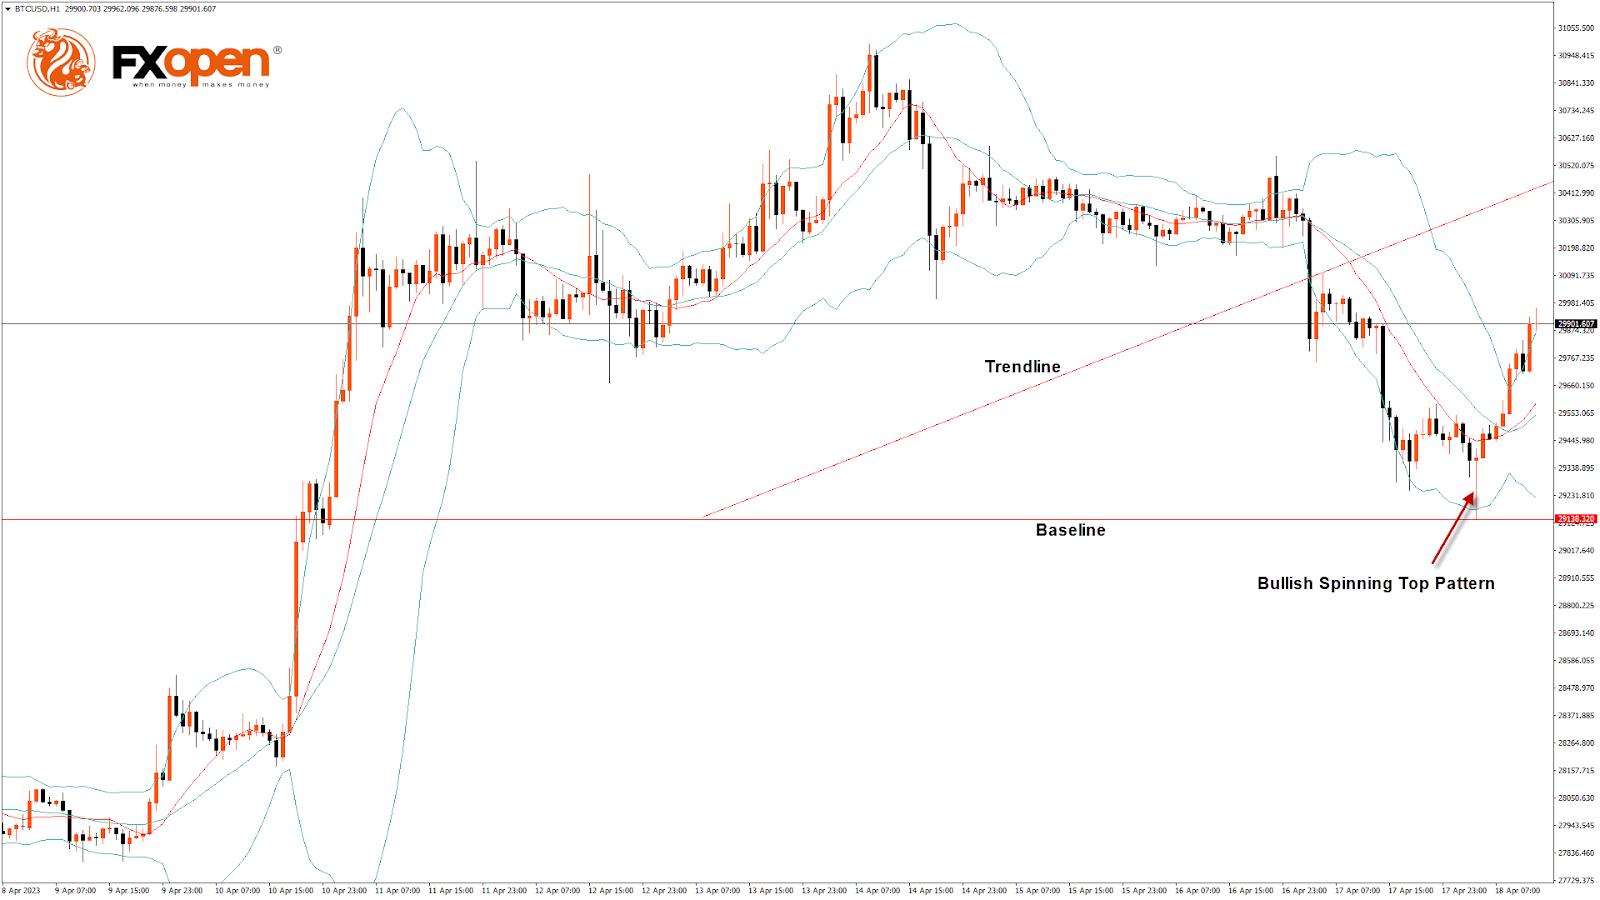
The average true range indicates low market volatility with mild bullish momentum.
- Bitcoin bullish continuation is seen above $29,138.
- The RSI remains above 50, indicating a bullish market.
- The price is now trading above its pivot level of $29,926.
- The short-term range is mildly bullish.
- Some major technical indicators signal that the price may move to $30,500 and $31,500 soon.
Bitcoin Bullish Continuation Seen Above $29,138
The price of Bitcoin has failed to cross the resistance barrier of $32,000, as the prices declined below $30,000 and entered into a consolidation zone.
There is a bullish price crossover pattern with 20- and 50-period adaptive moving averages in the 4-hour timeframe.
The Aroon indicator signals a bullish trend in the 2-hour timeframe.
The price is above the Ichimoku cloud in the 30-minute chart, indicating a bullish trend.
A support zone is at $28,782, which is a 50% retracement from a 4-week High/Low, and at $29,050, which is a 14-3 daily raw stochastic at 50%.
BTCUSD is now facing its classic resistance level of $30,066 and Fibonacci resistance level of $30,224, breaking above which the price will be able to move to $30,500.
There is an increase of 12.04% in the daily trading volume, which is normal. The short-term outlook for Bitcoin is bullish, the medium-term outlook has turned bullish, and the long-term outlook remains neutral under present market conditions.
The Week Ahead
We can see that Bitcoin continues to bounce from its lows which suggests that the long-term uptrend remains intact, with the current support at $27,645, which is a 14-day RSI at 50.
The price continues to range near the horizontal support in daily and weekly timeframes, indicating bullish sentiment.
We can see the formation of the bullish Harami pattern in the daily timeframe.
The immediate expected target is $31,000, after which we may see some consolidation in the zone of the $30,500 level.
Daily RSI is at 64.68, which indicates the continuation of the bullish trend and the formation of strong bullish demand for Bitcoin in the medium-term range.
We can see the formation of a bullish trend line from $29,138 to $30,456.
The BTCUSD is now facing resistance at $30,970, which is a 13-week high, and at $31,087, which is the second resistance level of the pivot point indicator.
WTI Wave Analysis
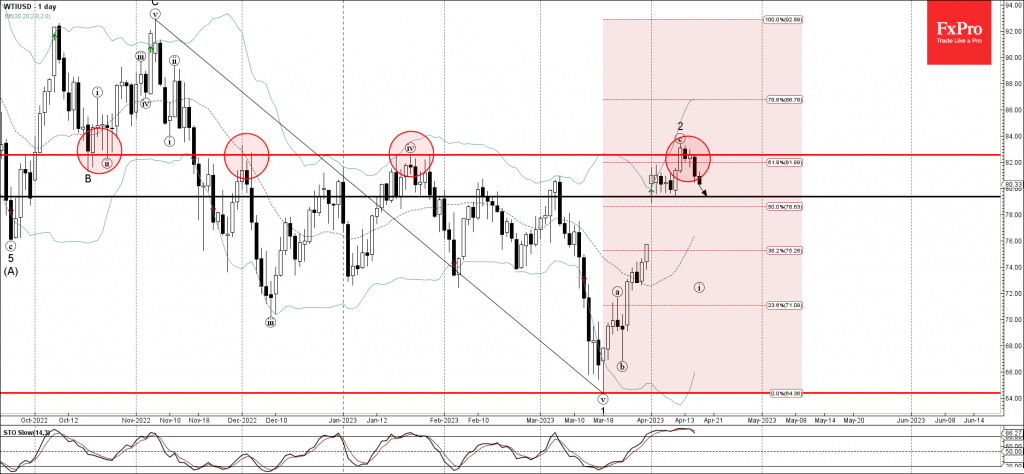
- WTI reversed from resistance level 82.55
- Likely to fall support level 79.40
WTI crude oil previously reversed down from the resistance level 82.55 (former strong support from October, which has been reversing all upward corrections after it was broken in November).
The downward reversal from the resistance level 82.55 stopped the previous minor correction 2.
Given the overbought daily Stochastic, WTI crude oil can then be expected to fall further toward the next support level 79.40 (low of the earlier correction from the start of April).
EURGBP Wave Analysis
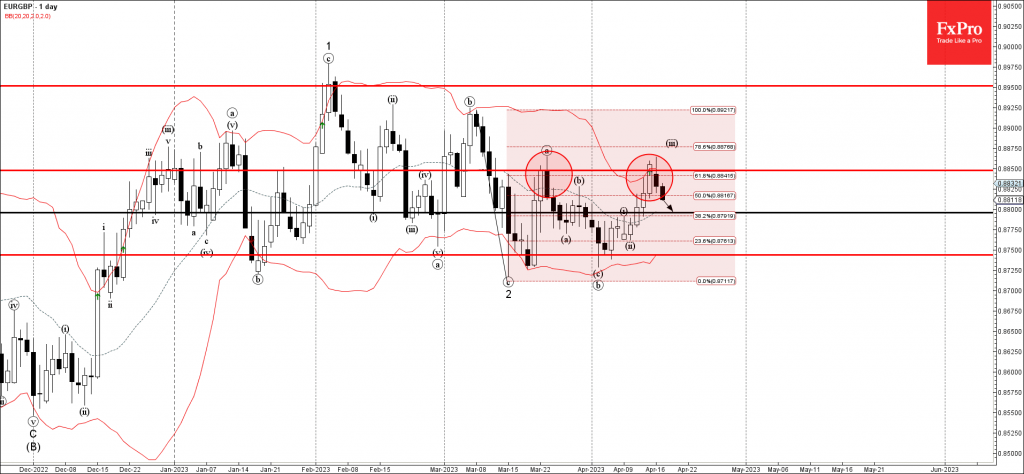
- EURGBP reversed from resistance level 0.8850
- Likely to fall support level 0.8800
EURGBP currency pair recently reversed down from the resistance level 0.8850 (which also stopped the previous wave (a) in the middle of March).
The resistance level 0.8850 was strengthened by the upper daily Bollinger Band and by the 61.8% Fibonacci correction of the downward impulse (c) from the start of March.
Given the strongly bullish sterling sentiment, EURGBP can then be expected to fall further toward the next support level 0.8800.
Rising UK Unemployment, Along With Earnings
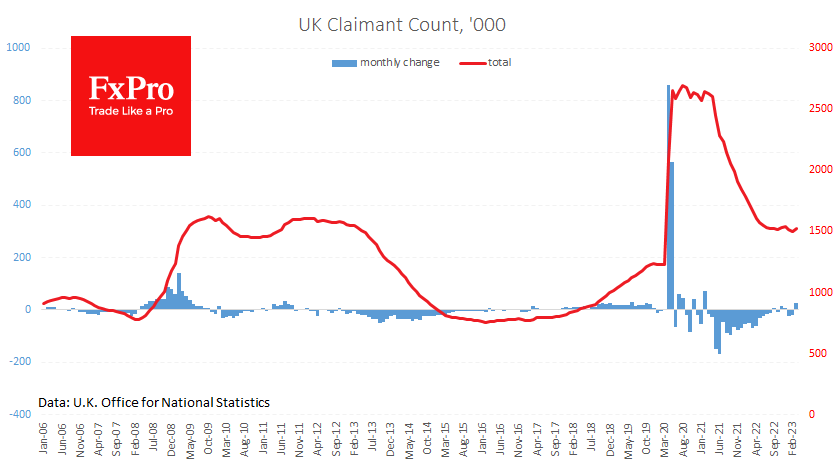
The labour market situation in the UK is worrying. Claimant counts rose by 28.2K in March, following two months of falls by 21.5K and 18.8K, and forecasts for a fall of 2.5K last month. In a broader picture, the number of people out of work has been broadly stable over the past nine months, hovering around 1,525K. This level was a ceiling for a long time between 2009 and 2013, as the country recovered from the financial crisis. By this measure, the labour market has considerable room for improvement.
At the same time, the unemployment rate rose to 3.8% in the December-February period, from 3.7% previously and a low of 3.5% in the three months to August, as more people joined the job search amid rising inflation and recovery from the pandemic.
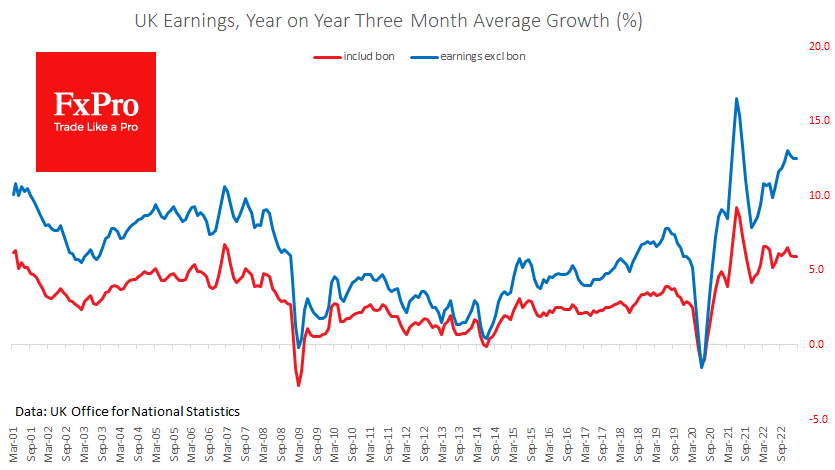
Meanwhile, the rate of wage growth excluding bonuses shows no significant signs of cooling at 6.6% y/y, while earnings, including bonuses, have stabilised around 6% for the past seven months. This trend generally indicates a decline in the bonus component and could signal a consolidation of inflationary trends.
Such news has a net positive effect on the Pound, allowing us to expect further interest rate hikes in the coming months. At the same time, monitoring the labour market to see if a rise in claimants is becoming a trend is essential. Sterling traders should also pay attention to tomorrow’s UK inflation data, which could either support or reverse expectations of further rate hikes.
EUR/USD: Euro Benefits from Improved Risk Sentiment
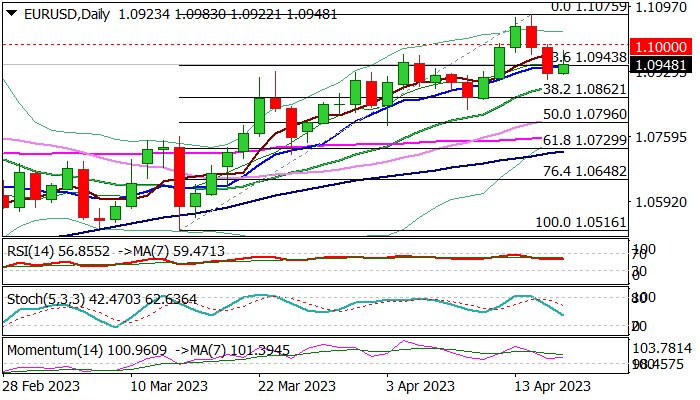
The Euro regained traction and bounces back on Tuesday, after a two-day pullback, lifted by renewed risk sentiment.
Much better than expected Chinese GDP and retail sales boosted hopes for economic growth, prompting investors into riskier assets.
On the other hand, German investor sentiment unexpectedly fell to 4.1% in April from 13.0 in March and signal that economic situation would remain unchanged in coming months, but so far with very limited negative impact on Euro.
Fresh recovery, however, needs more work on the upside to signal a higher low and end of corrective phase.
Break and close above psychological 1.10 level (reverted to solid resistance and also slightly above 50% retracement of 1.1075/1.0909 pullback), is needed to confirm a healthy correction and bring larger bulls back to play.
Bullish daily technical studies support the action, although possible stall under 1.10 pivot still cannot be ruled out.
Near-term action is expected to remain biased higher while holding above rising 20DMA (1.0896), with possible scenario of extended consolidation preceding fresh push higher.
Only loss of pivotal supports at 1.0862/31 (Fibo 38.2% of 1.0516/1.1075 / Apr 10 higher low) would sideline bulls and signal deeper pullback.
Res: 1.0980; 1.1000; 1.1032; 1.1075.
Sup: 1.0896; 1.0862; 1.0831; 1.0796.
Canada: Inflation Takes Another Step in the Right Direction in March
Consumer price inflation took a big step down in March to 4.3% year-on-year (y/y) from 5.2% in February. That is in line with market expectations.
Prices at the pump rose in March (+1.2% month-on-month (m/m) NSA), but remained well below the heights of the early days of Russia's invasion of Ukraine (-13.8% y/y). Energy prices as a whole were down 6.9% y/y, a key downward force on headline inflation.
Food inflation cooled a bit in March, but grocery bills likely still feel onerous to Canadians paying 9.7% more versus a year ago.
Shelter inflation also moved in the right direction in March, but remained a key source of inflation, up 5.4% y/y in March. Mortgage interest costs are up 26.4% versus a year ago in March, up from 23.9% in February. The cooling in the housing market as a result of higher mortgage rates has pushed homeowners' replacement costs down to only 1.7% y/y, down from nearly 15% in late 2021.
Goods inflation is decelerating faster than services. Inflation for durable goods decelerated from 3.4% y/y in February (and nearly 8% y/y last year) to 1.6% in March, as prices for furniture fell. Whereas services inflation remained above 5% in March, where it has been for nearly a year. Zeroing in on our measure of "supercore" inflation, which is a measure of demand-sensitive services prices, it ticked up slightly to 6.3% from 6.2% in February. One upward price move on the goods side was clothing prices, which were up 2.4% y/y in March, from 1.9% y/y in February.
The Bank of Canada's underlying inflation pressures cooled modestly in March. CPI-trim eased to 4.4% y/y (4.8% in Feb.) and CPI-median at 4.6% y/y (4.9% in Feb.).
Key Implications
Inflation continued to move in the right direction in March, supporting the Bank of Canada's stand pat rate decision last week. As outlined in our recent forecast, we expect core inflation to continue to decelerate below 3% y/y in the second half of the year, as does the Bank of Canada.
However, the persistently high level of demand-sensitive services inflation, or "supercore", speaks to the challenge Governor Macklem talked about last week in bringing inflation all the way back to 2%. This suggests that the BoC needs to remain vigilant to inflation pressures, and may need to hike again if momentum in the domestic economy does not cool as expected.
Sunset Market Commentary
Markets
UK Gilts underperform German Bunds and US Treasuries today following the release of UK labour market data. Employment rose by 169k in the Dec 2022-Feb 2023 period compared to Sep-Nov 2022. The UK employment rate rose from 75.6% to 75.8% over that period, driven by part-time employees and self-employed workers. The timeliest estimate of payrolled employees for March 2023 shows another monthly increase, up 31k (vs 48k expected). The unemployment rate for Dec-Feb ticked up by 0.1 percentage point to 3.8%, matching the pre-pandemic low (vs multi-decade low of 3.5% in August 2022). Growth in average total pay (including bonuses) was 5.9% and growth in regular pay was 6.6% among employees in Dec-Feb. Both significantly beat consensus of respectively 5.1% and 6.2% with upward revisions to last month’s data. Ongoing tightness of the UK labour market and strong(er) wage growth suggest that the Bank of England won’t be able to let its guard down already in its inflation battle. UK money markets are now close to pricing a full 25 bps rate hike at the May 11 policy meeting with an additional 25 bps increase discounted over during summer months. UK Gilt yields add 4.1 bps (30-yr) to 7.2 bps (3-yr) today. Daily German yield changes vary between +1 bp and -1 bp. US yields trade 2 to 3 bps lower across the curve. European eco data today were confined to German April ZEW investor sentiment. The current situation index improved more than forecast from -46.5 to -32.5, but forward looking expectations fell back from 13 to 4.1. The deteriorating outlook comes on the back of concern about the banking sector and elevated inflation. US housing figures turned out a mixed bag with March housing starts declining only by 0.8% M/M (vs -3.5% expected) but building permits fell a larger-than-forecast 8.8% M/M. From central bankers, we retain comments by St. Louis Fed Bullard who is in favour of more rate hikes (plural), adding to the recent more hawkish tone from the likes of Fed Waller and Barkin.
Sterling outperformed slightly in FX space with EUR/GBP extending yesterday’s rather strange slide. The pair currently changes hands around 0.8815 from an open at 0.8830. Gains for cable are bigger (1.2435 from 1.2375) with dollar fatigue adding to the picture. EUR/USD rose from around 1.0920 to an intraday high at 1.0980. Global risk sentiment is still EUR/USD supportive with main European equity indices winning 0.5-1%. Key US indices open from little changed (Dow) to 0.50% higher (Nasdaq). The Eurostoxx 50 (4405) is close to testing the 2021 top at 4415.
News & Views
According to the UK government’s Insolvency Service, the number of UK firms going belly up jumped to the highest level in at least four years. Monthly data collection only began in January 2019. But with a toll of 2 457 in March, numbers nevertheless reveal the impact of surging interest rates and energy bills on firm’s finances. Compared to a year earlier, failures were up by 16%. Annual data, which have been collected over a much longer period, showed that insolvencies in 2022 (22 109) were at their highest since 2009. In the wake of the pandemic, the UK government protected companies from going bankrupt as the country went into lockdown for an extended period of time. These measures however were largely removed in 2021.
Canadian March inflation was broadly in line with analyst’s and the Bank of Canada’s April estimates. Headline prices rose by 0.5% m/m to be up 4.3% y/y. That’s a sharp cooldown from the 5.2% in February following sharply retreating energy/gas prices and favourable base effects. Food price increases eased from 10.6% to 9.7% last month. Core CPI inflation also ticked lower, between 4.4% and 4.6% depending on the gauge, but to a much lesser extent than the headline figure. The Canadian central bank last week kept the policy rate stable at 4.5% for a second meeting straight. The wait-and-see is based on expectations for (core) inflation to come down over the coming months but could still flip into further tightening if that doesn’t happen (sufficiently). Canadian money markets assume the BoC has already hit the terminal rate and instead start discounting rate cuts for end 2023/early 2024. The Canadian dollar is unfazed by today’s CPI outcome. USD/CAD trades virtually unchanged around 1.338.
Fed Bullard foresees higher rates to tackle inflation, dismisses recession fears
In a Reuters interview, St. Louis Fed President James Bullard expressed his views on interest rates, inflation, and the possibility of a recession.
Contrary to some of his FOMC colleagues who foresee interest rates peaking at 5.00-5.25%, Bullard believes the policy rate may need to rise between 5.50% and 5.75% to effectively combat inflation.
Bullard emphasized that once rates reach a "sufficiently restrictive" level, the bias should be to maintain them "higher for longer" to ensure inflation is fully under control.
He also stressed the importance of being responsive to incoming data in the coming months, rather than committing to a fixed path for interest rates. "You wouldn't want to be caught giving forward guidance that said we're definitely not doing anything and then have inflation coming in too hot or too sticky," he said.
As for the possibility of a recession, Bullard dismissed the idea, citing a strong labor market as a key indicator. He explained, "the labor market just seems very, very strong. And the conventional wisdom is that if you have a strong labor market, that feeds into strong consumption... and that's a big chunk of the economy."
He added, "it doesn't seem like the moment to be predicting that you have a recession in the second half of 2023."
EUR/USD Mid-Day Outlook
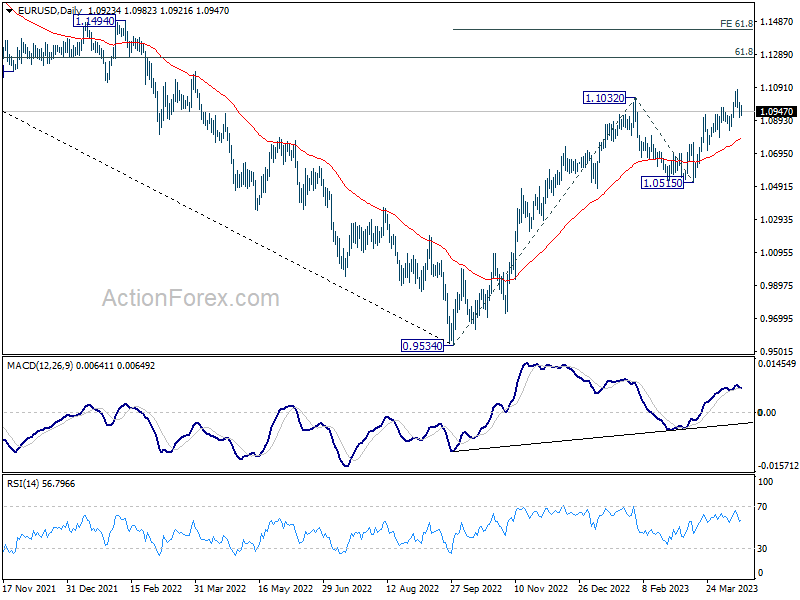
Daily Pivots: (S1) 1.0892; (P) 1.0946; (R1) 1.0982; More...
EUR/USD is continuing the consolidation below 1.1075 and intraday bias stays neutral. Outlook remains bullish with 1.0830 support intact. On the upside, break of 1.1075 will will resume larger up trend to 1.1273 fibonacci level. Break there will target 61.8% projection of 0.9534 to 1.1032 from 1.0515 at 1.1441. However, firm break of 1.0830 will confirm short term topping and bring deeper decline to 1.0711 support instead.
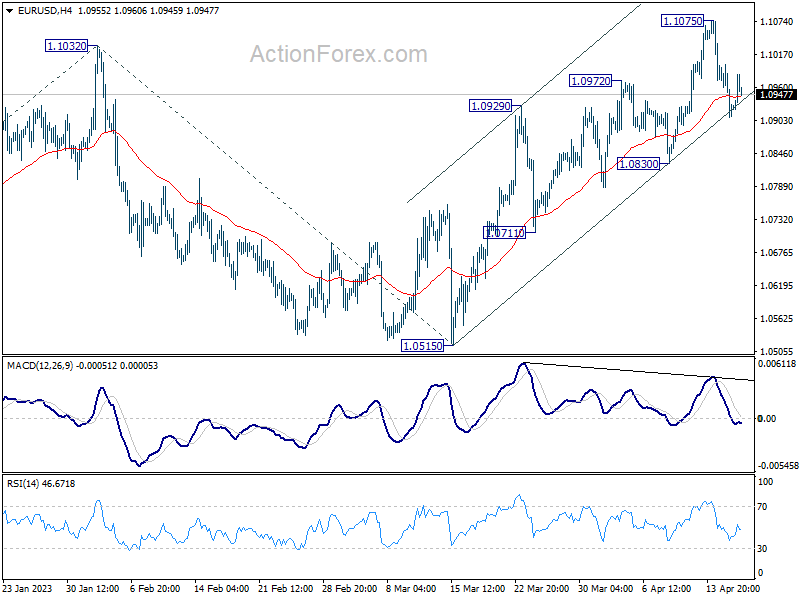
In the bigger picture, rise from 0.9534 (2022 low) is in progress for 61.8% retracement of 1.2348 (2021 high) to 0.9534 at 1.1273. Sustained break there will solidify the case of bullish trend reversal and target 1.2348 resistance next (2021 high). This will now remain the favored case as long as 1.0515 support holds, even in case of deeper pull back.