Sample Category Title
Eurozone CPI finalized at 6.9% yoy in Mar, core CPI at 5.7% yoy
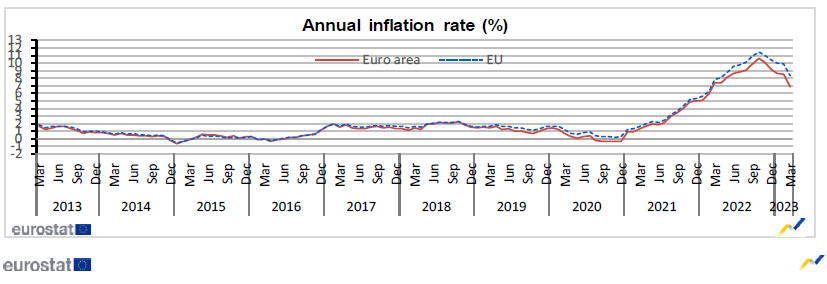
Eurozone CPI was finalized at 6.9% yoy in March, down from February's 8.5% yoy. Core CPI (all items excluding energy, food, alcohol & tobacco) was finalized at 5.7%, up from prior month's 5.6% yoy. The highest contribution to the annual Eurozone inflation rate came from food, alcohol & tobacco (+3.12%), followed by services (+2.10%), non-energy industrial goods (+1.71%) and energy (-0.05%).
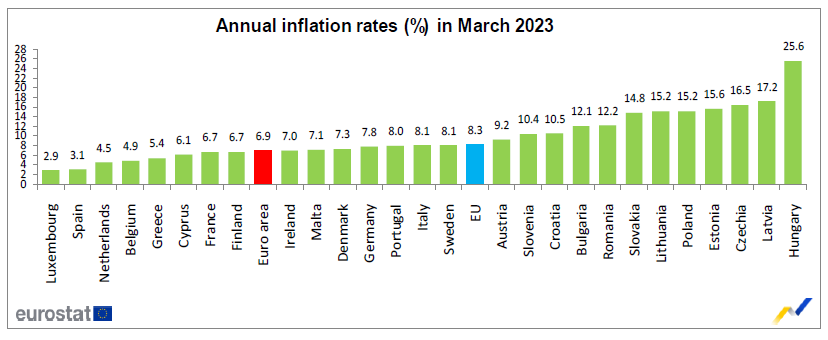
EU CPI was finalized at 8.3% yoy, down from prior month's 9.9% yoy. The lowest annual rates were registered in Luxembourg (2.9%), Spain (3.1%) and the Netherlands (4.5%). The highest annual rates were recorded in Hungary (25.6%), Latvia (17.2%) and Czechia (16.5%). Compared with February, annual inflation fell in twenty-five Member States and rose in two.
EUR/USD Struggles Below 1.1000 While USD/JPY Aims Higher
EUR/USD started a downside correction from the 1.1075 resistance. USD/JPY is rising and might rally further above the 134.30 resistance.
Important Takeaways for EUR/USD and USD/JPY
- The Euro struggled to stay above 1.1000 and corrected lower.
- There is a key bearish trend line forming with resistance near 1.0990 on the hourly chart of EUR/USD at FXOpen.
- USD/JPY is showing a lot of bullish signs above the 133.85 support zone.
- There is a major bearish trend line forming with resistance near 134.30 on the hourly chart at FXOpen.
EUR/USD Technical Analysis
On the hourly chart of EUR/USD at FXOpen, the pair struggled to clear the 1.1075 resistance. The Euro started a fresh decline below 1.1000 against the US Dollar.
There was a drop below the 1.0935 support but the bulls were active near the 1.0910 support. A low is formed near 1.0909 and the pair is now attempting a fresh increase. There was a break above the 1.0935 level and the 50-hour simple moving average.
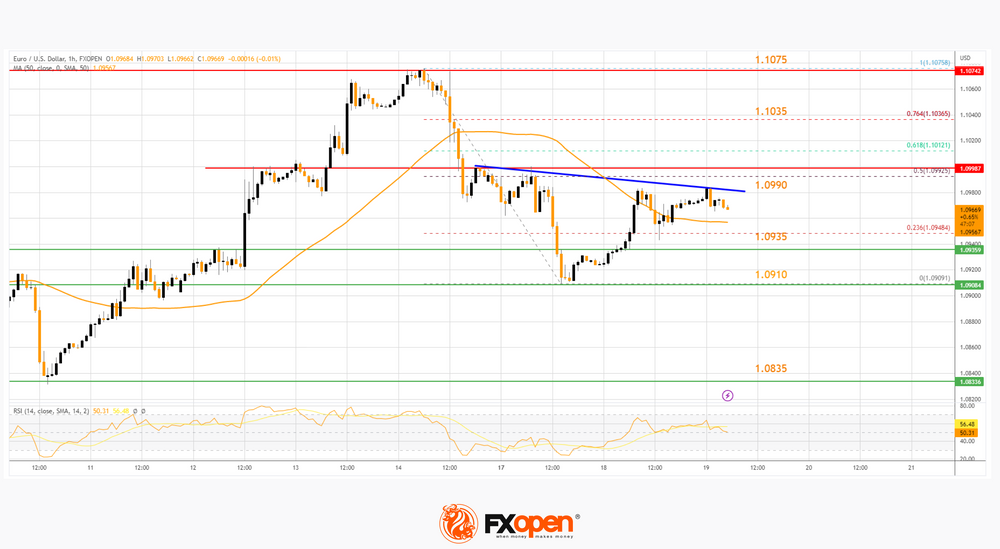
It is now facing resistance near a key bearish trend line forming with resistance near 1.0990. The trend line is close to the 50% Fib retracement level of the downward move from the 1.1075 swing high to the 1.0910 low.
The next major resistance is near the 76.4% Fib retracement level of the downward move from the 1.1075 swing high to the 1.0910 low at 1.1035. An upside break above 1.1035 could set the pace for another increase. In the stated case, the pair might visit 1.1075. Any more gains might send the pair towards 1.1150.
If not, EUR/USD might decline again below the 1.0935 support. The first major support is near the 1.0910 level, below which the pair could start a major decline. In the stated case, the pair might dive toward the 1.0835 support zone.
USD/JPY Technical Analysis
On the hourly chart of USD/JPY at FXOpen, the pair started a fresh increase from the 132.15 zone. It gained bullish momentum and was able to clear the 133.00 resistance.
Finally, there was a move above 134.00 but the bears were active near 134.70. A high was formed near 134.70 before the pair corrected lower to 133.85. It is rising again and trading above the 50-hour simple moving average.
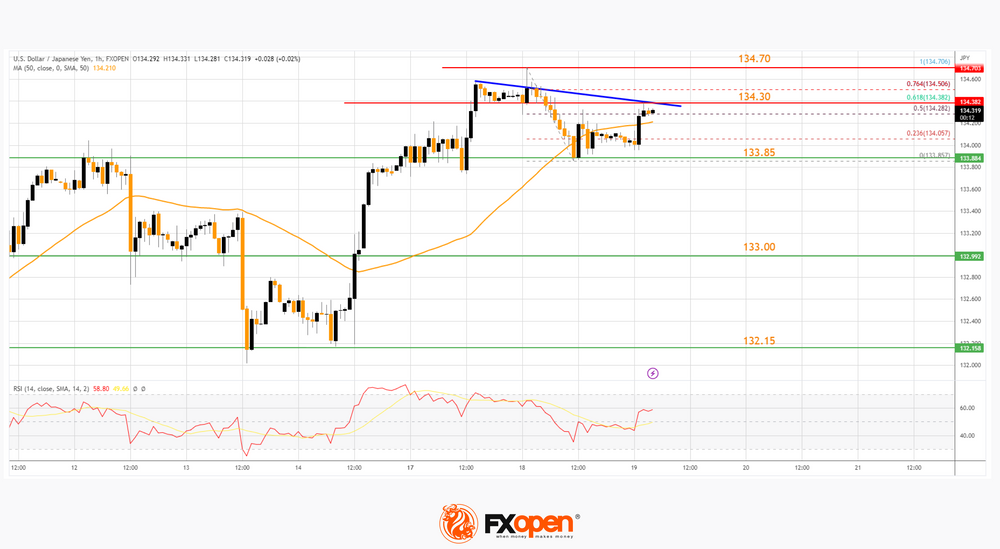
There was a break above the 50% Fib retracement level of the downward move from the 134.70 swing high to the 133.85 low. On the upside, the pair is facing resistance near a major bearish trend line forming with resistance near 134.30.
The trend line coincides with the 61.8% Fib retracement level of the downward move from the 134.70 swing high to the 133.85 low. A clear move above the trend line resistance might call for a retest of 134.70. The next major resistance is near 135.00, above which the pair could test 135.50.
Initial support on the downside is near the 50-hour simple moving average. The first major support is near 133.85, below which the pair could start a major decline.
In the stated case, the pair might dive toward the 133.00 support. Any more losses might send the USD/JPY pair toward the 132.15 support.
USDJPY Slices Through 50-day SMA
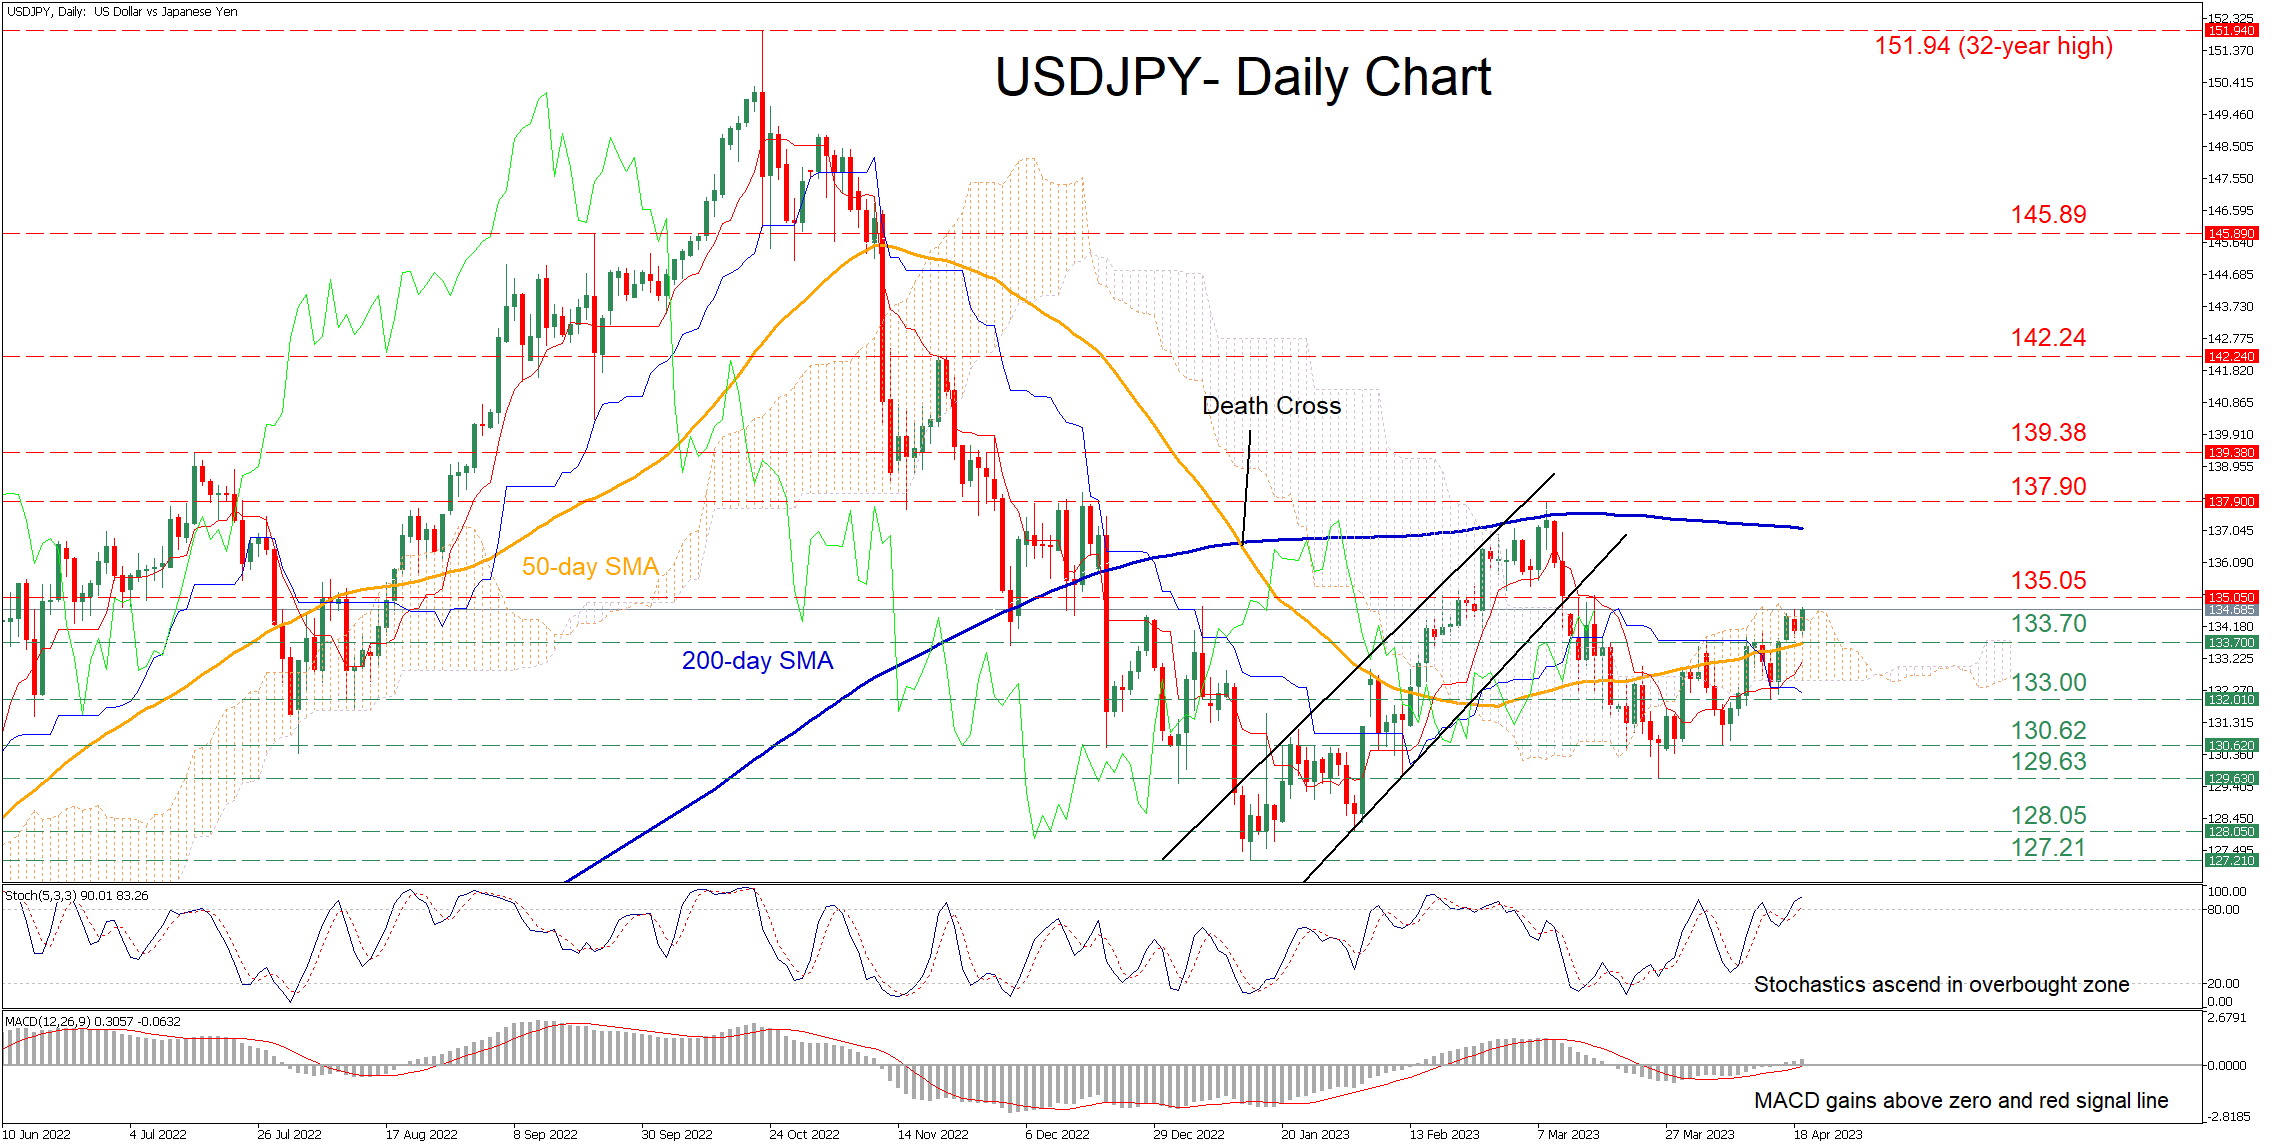
USDJPY had been trending lower since its upward sloping channel broke to the downside in early March. However, the pair crossed above its 50-day simple moving average (SMA) following the strong rebound from its March lows, which has temporarily stalled at the upper Boundary of the Ichimoku cloud.
The momentum indicators currently suggest that bullish forces are in control. Specifically, the stochastic oscillator is ascending within the 80-overbought zone, while the MACD histogram is strengthening above both zero and its red signal line.
If the pair manages to extend its advance, initial resistance could be found at the 135.05 hurdle. Violating this territory, the price may ascend to challenge the 2023 peak of 137.90. Should that barricade fail, the bulls could then aim for the July 2022 high of 139.38.
On the flipside, should the recent recovery fade and the prices reverses downwards, the 50-day SMA at 133.70 could act as the first line of defence. Dipping lower, the pair might test 133.00 before the April bottom of 130.62 comes under examination. Further retreats could then come to a halt at the March low of 129.63.
Overall, USDJPY’s latest rebound seems to have paused after encountering strong resistance but the technical picture has not turned bearish yet. Therefore, a strong exit from the Ichimoku coupled with a break above the 135.05 resistance is needed to revive bulls’ hopes for a sustained uptrend.
US Oil: Has a New Bullish Trend Started?
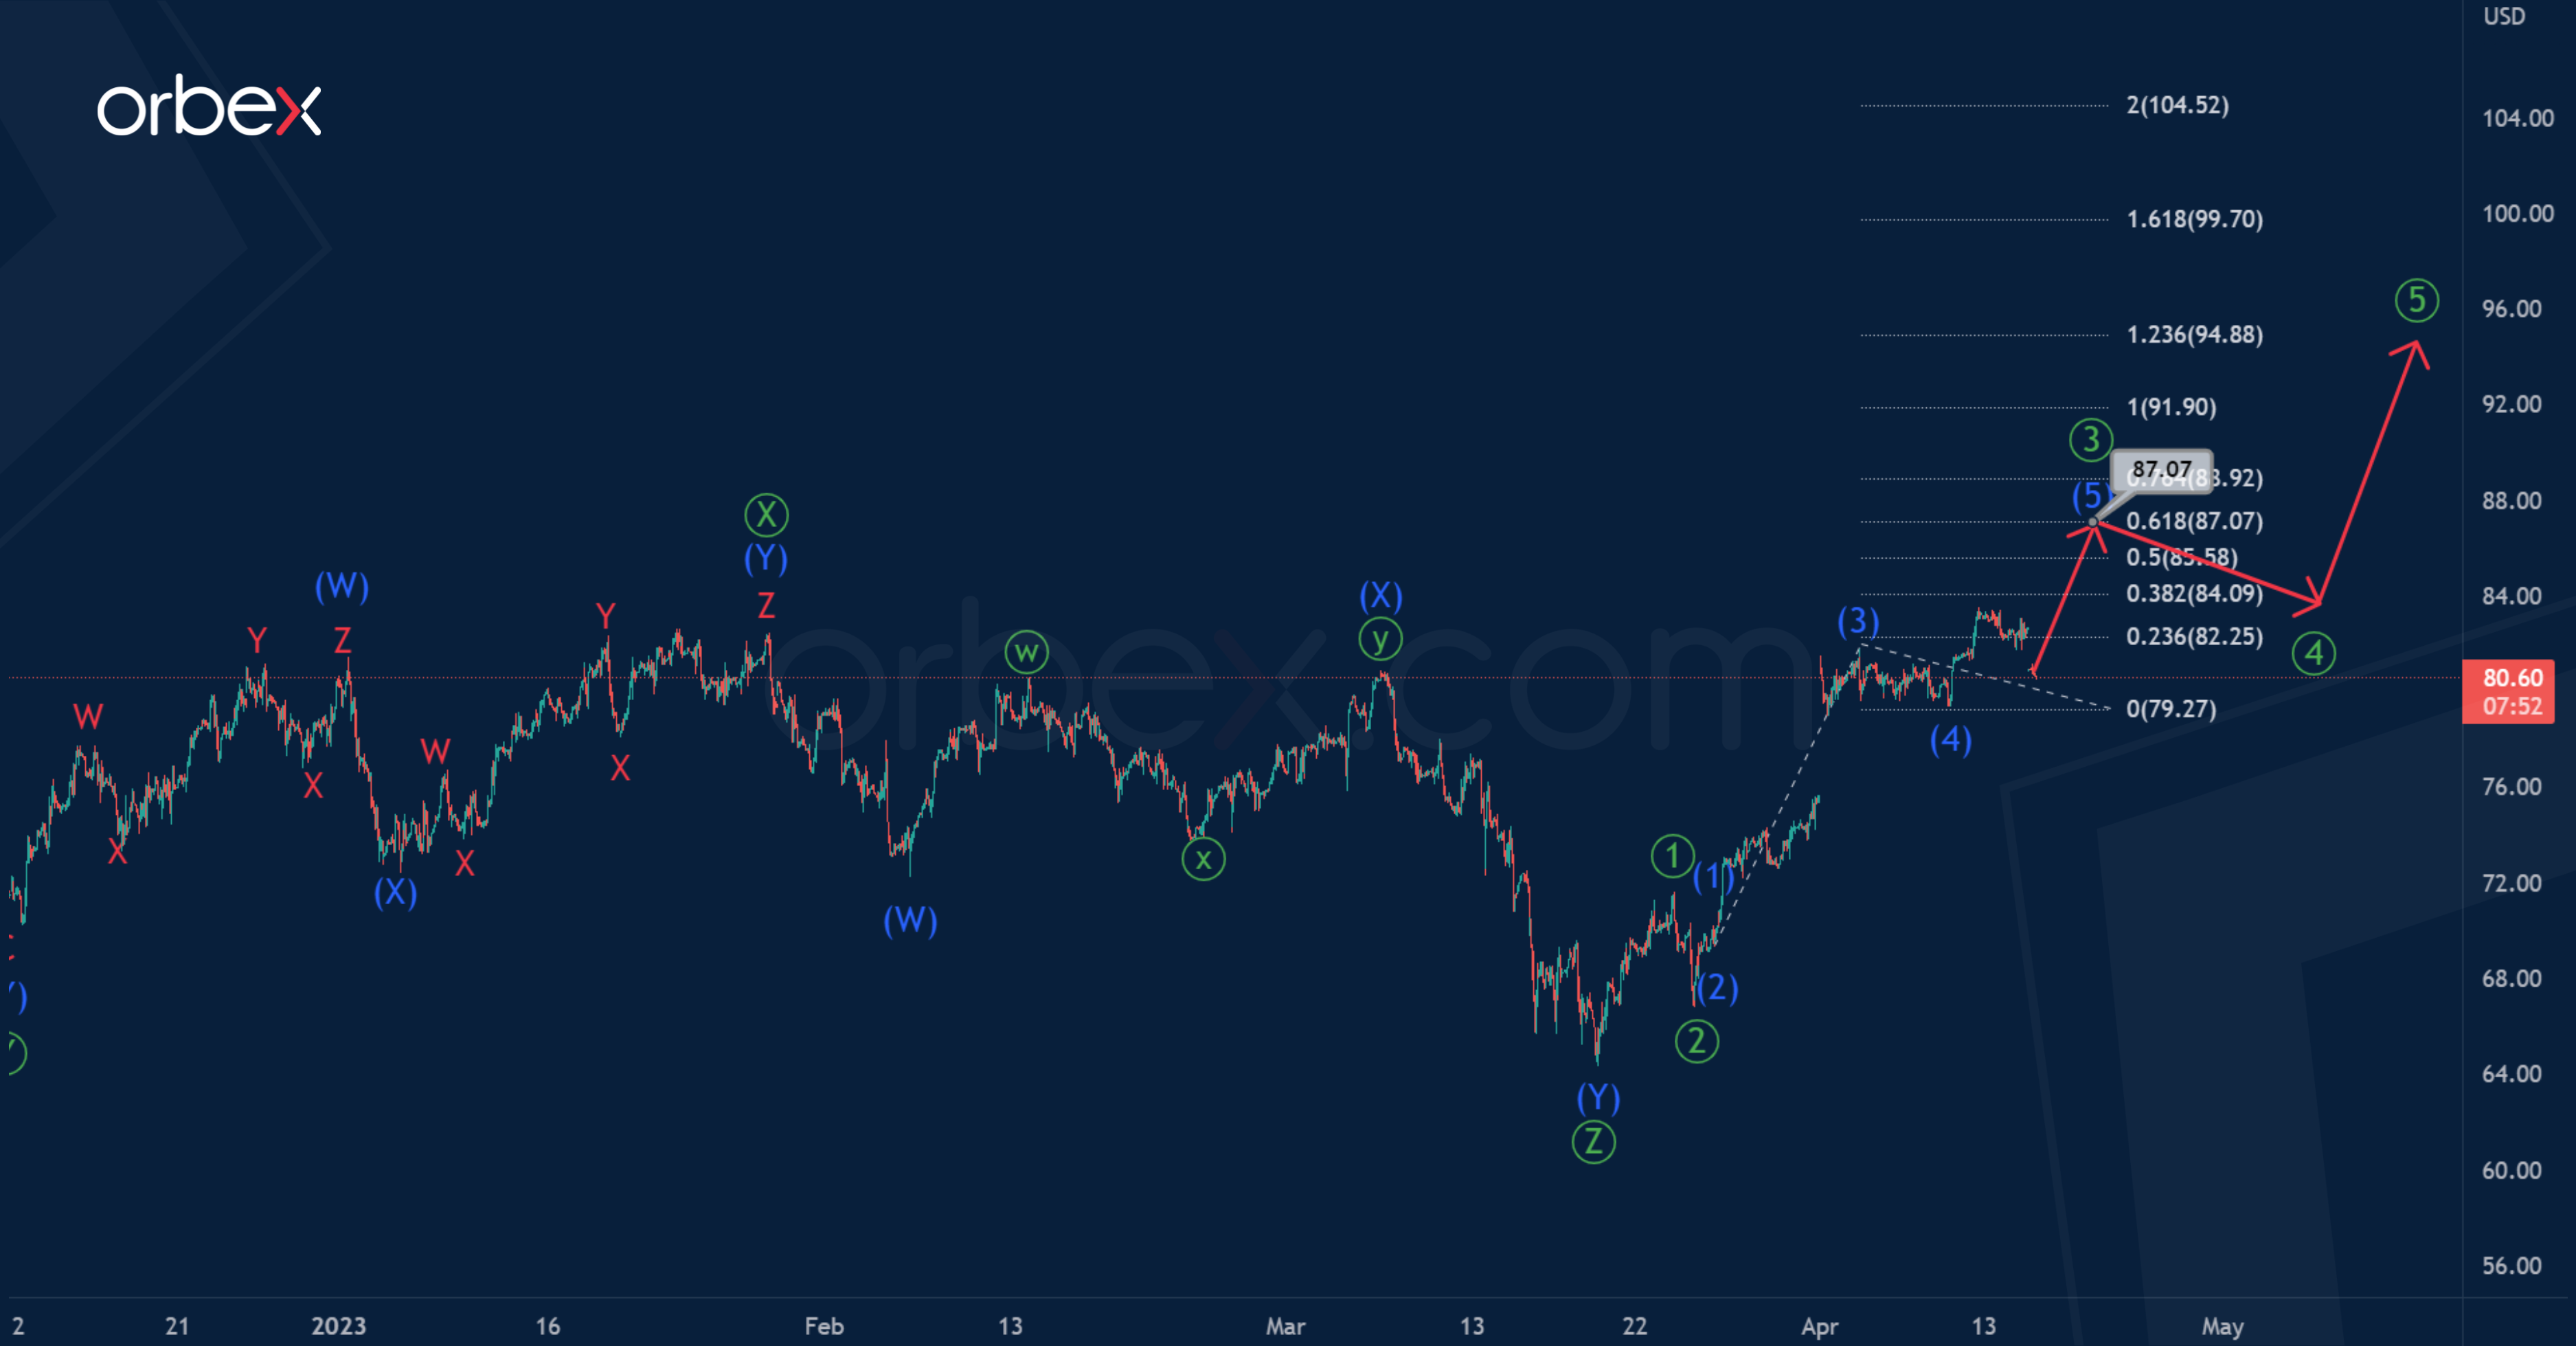
There is a high probability that a long-term corrective trend has ended for USOIL. It took the form of a primary triple zigzag consisting of sub-waves.
In the last section of the chart, we can see a market reversal and the beginning of a new bullish trend. Perhaps there is a construction of the primary impulse wave ①-②-③-④-⑤.
The end of the third sub-wave ③ is expected to reach the price level of 87.07, at which the intermediate sub-wave (5), which is currently being built, will be at 61.8% of impulse (3).
An approximate scheme of possible future movement is shown on the chart.
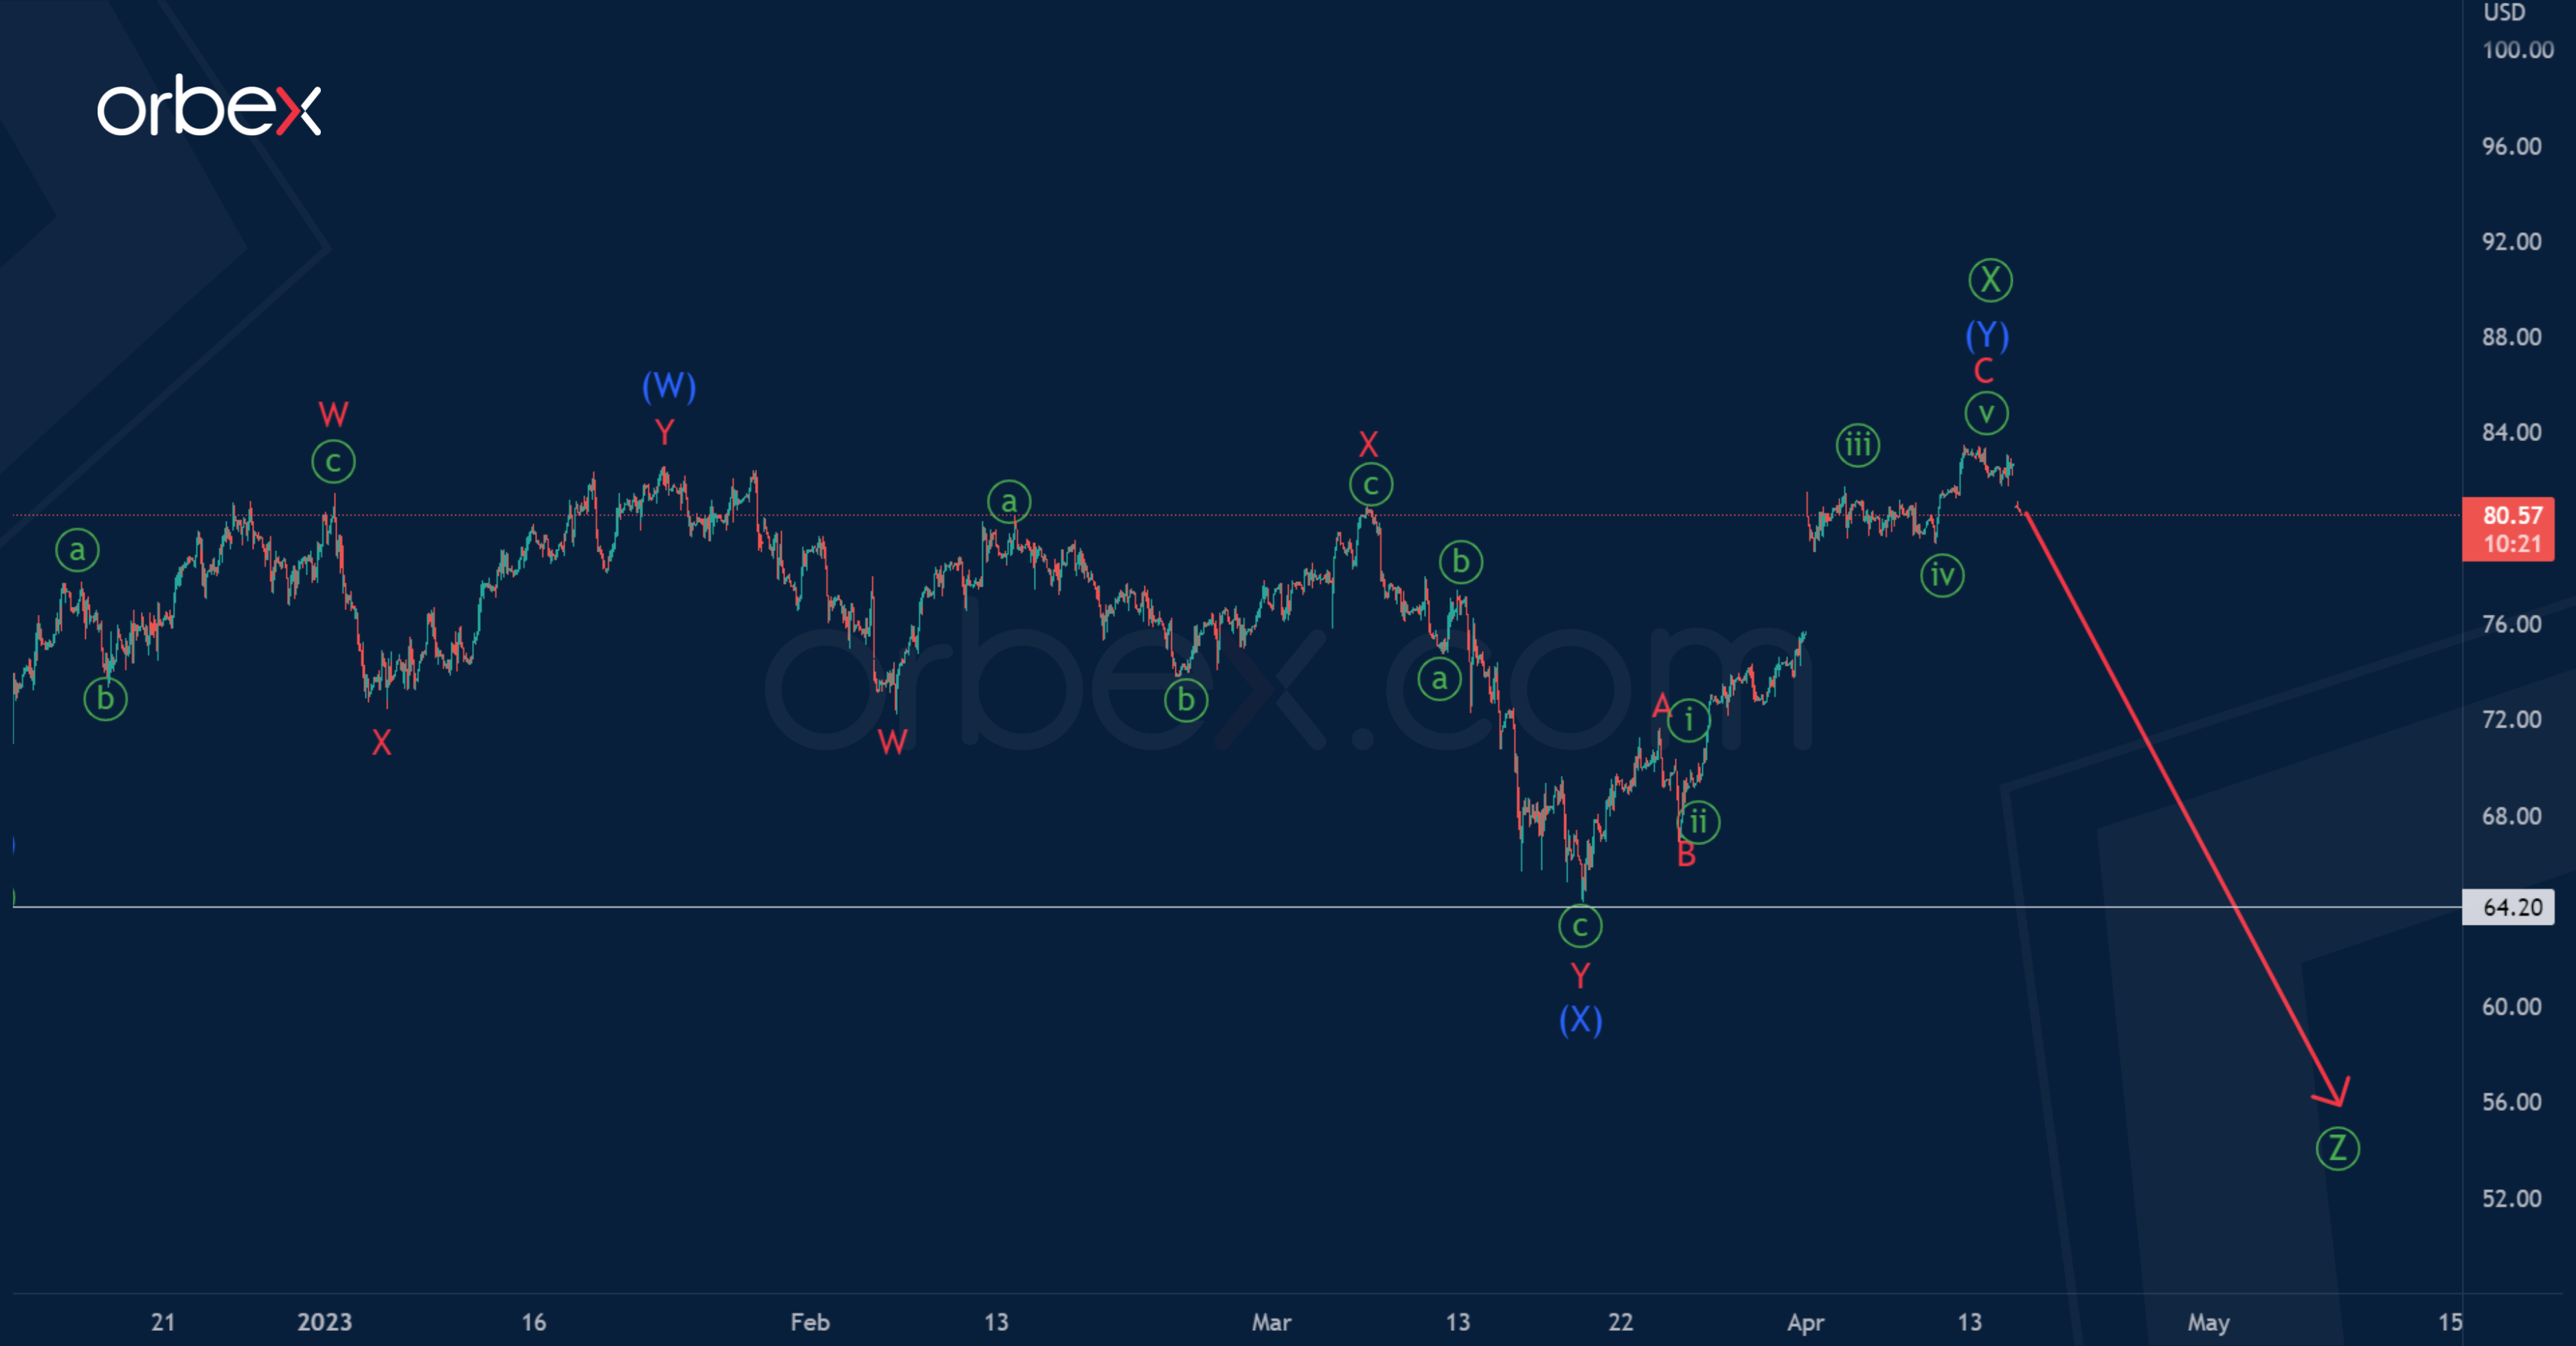
Alternatively, a continuation of the bearish trend is possible. Only the second intervening wave could be completed, it has the form of a double three (W)-(X)-(Y).
The scenario will be confirmed if the bears take the initiative and lead the market down, building a final wave.
The first goal, as far as the bears can reach, is a minimum of 64.20. At that level the actionary intermediate wave (Y) was completed.
GBP/USD: Cable Remains Constructive But Recovery Fragile Below Daily Tenkan-sen
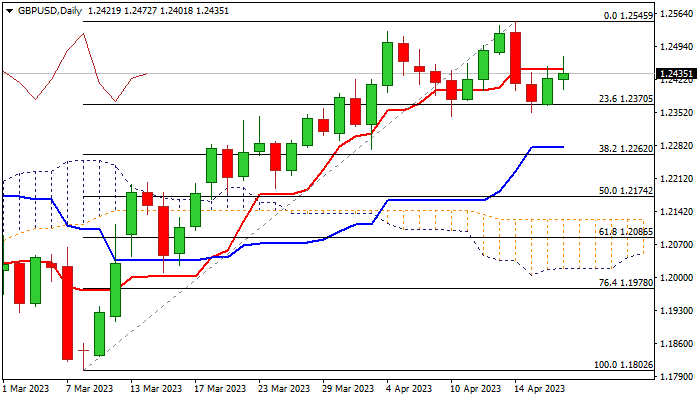
Cable extends recovery from Monday’s low (1.2353) into second straight day, after receiving fresh boost from higher than expected UK inflation data for March, which added to expectations for 25 basis points BOE rate hike in May.
Fresh bulls rose above daily Tenkan-sen (1.2444) and hit Fibo 61.8% retracement of two-day 1.2545/1.2353 pullback (1.2472), adding to initial bullish signal from Tuesday’s bullish engulfing pattern.
The signal still requires verification on daily close above Tenkan-sen, as a minimum requirement to reinforce near-term bullish structure and signal higher low at 1.2353 (Apr 17) and end of corrective phase.
Further advance would also signal a double bottom at 1.2343/53 (Apr 10/17) and add to upside prospect for retest of 2023 high at 1.2545 (Apr 14).
On the other hand, weakening positive momentum on overall bullish daily chart studies, warns that bulls may face headwinds.
Also, next week’s twist of daily Ichimoku cloud might be magnetic and obstruct recovery.
The downside is expected to remain vulnerable while daily Tenkan-sen limits recovery, although slight bullish bias still seen while the action holds above rising 20DMA (1.2392).
Look for clearer direction signals.
Res: 1.2444; 1.2472; 1.2500; 1.2525.
Sup: 1.2392; 1.2370; 1.2343; 1.2274.
GBP/USD Edges Higher as UK Inflation Higher than Expected
- UK inflation falls to 10.1%, higher than expected
- BoE likely to raise rates in May
- Three Fed members will deliver public remarks today
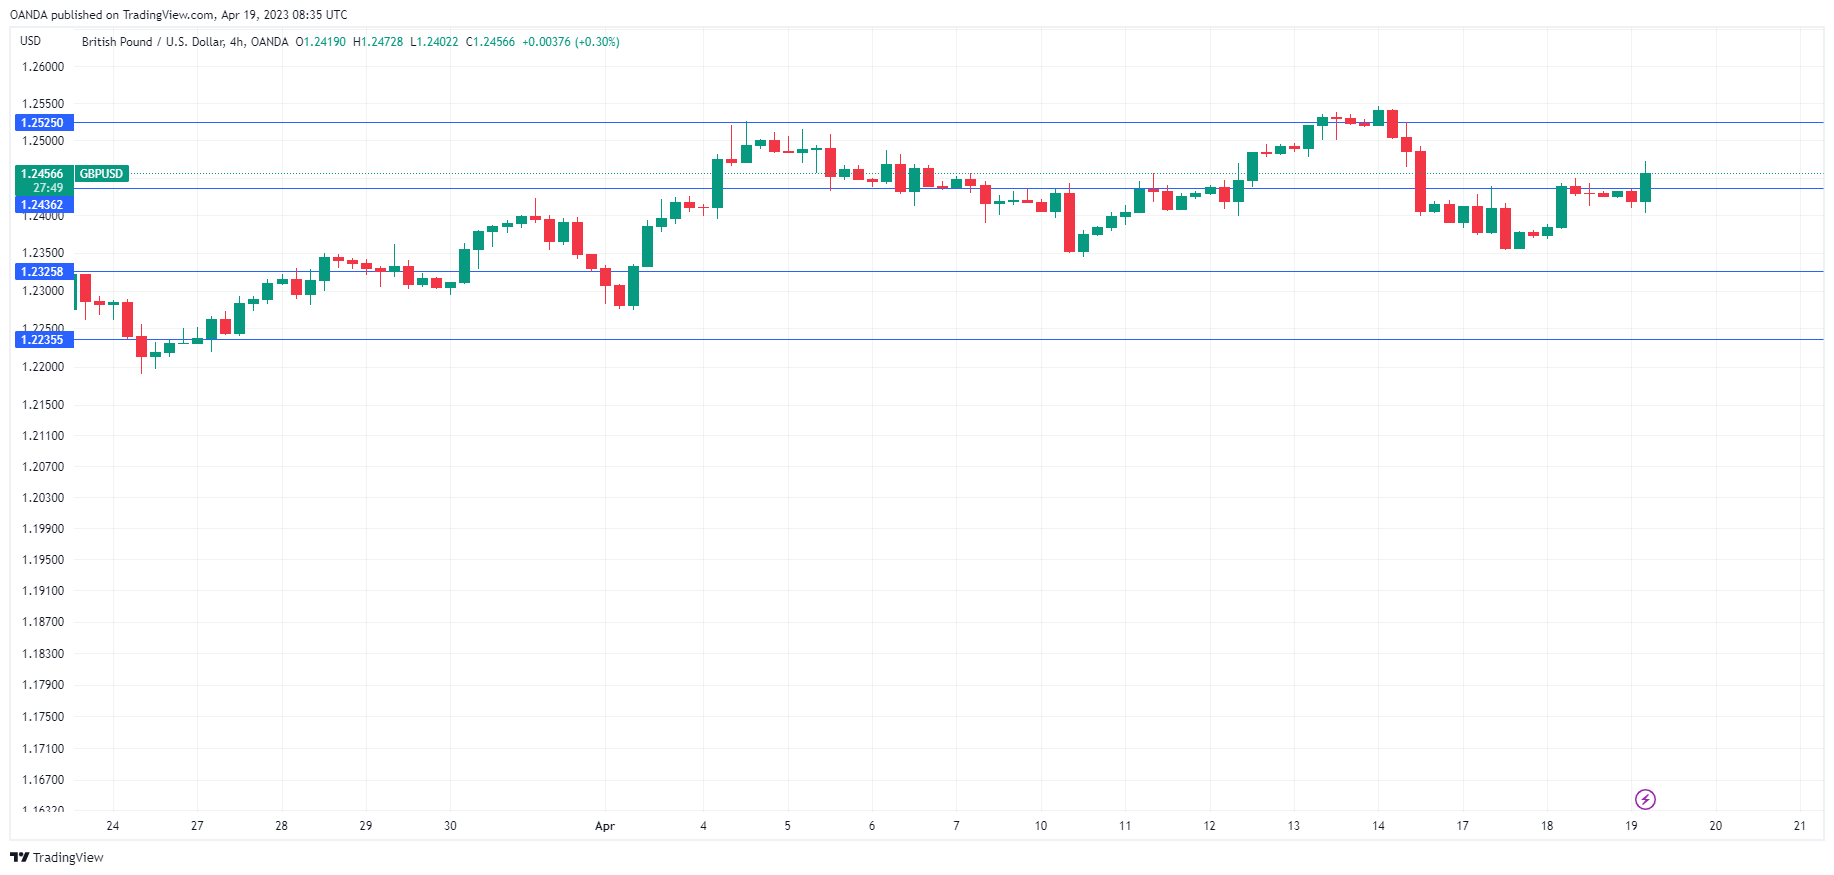
- GBP/USD is trading at 1.2445, up 0.16% on the day.
UK inflation stays above 10%
UK inflation remains hot and stubbornly high. In March, headline CPI dropped to 10.1%, down from 10.4% but above the consensus estimate of 9.8%. Inflation is still stuck in double digits, but the silver lining is that inflation has resumed its downswing after unexpectedly rising in February from 10.4% to 10.1%. The core rate remained unchanged at 6.2%, above the estimate of 6.0%. The usual suspects were at play in the headline release, as food and energy costs continue to drive inflationary pressures.
It hasn’t been the best of weeks for the Bank of England. The employment report showed that wage growth remains high and inflation is galloping at a double-digit pace. The BoE has raised rates to 4.25%, but the battle against inflation has been difficult, and it’s unclear if inflation has even peaked. The latest wage and inflation numbers have likely cemented another rate hike at the May meeting, but that’s not good news for a struggling economy.
GDP in February was flat, as widespread strikes and the cost-of-living crisis dampened economic activity. Consumers are struggling with higher taxes, hot inflation and rising interest rates. Inflation remains the central bank’s number one priority and a pause in rates will isn’t likely until the tight labour market, which is causing higher wage growth, cools down.
In the US, there are no tier-1 events on the calendar. Investors will be focussing on Fedspeak, with Fed members Williams, Goolsbee and Mann making public statements. Earlier this week, Williams said that he expects inflation to continue falling and to reach 3.75% by the end of this year and hit the 2% target by 2025.
GBP/USD Technical
- GBP/USD is testing resistance at 1.2436. The next resistance line is 1.2526
- There is support at 1.2325 and 1.2235
NZDUSD Range Bound Ahead of Quarterly CPI
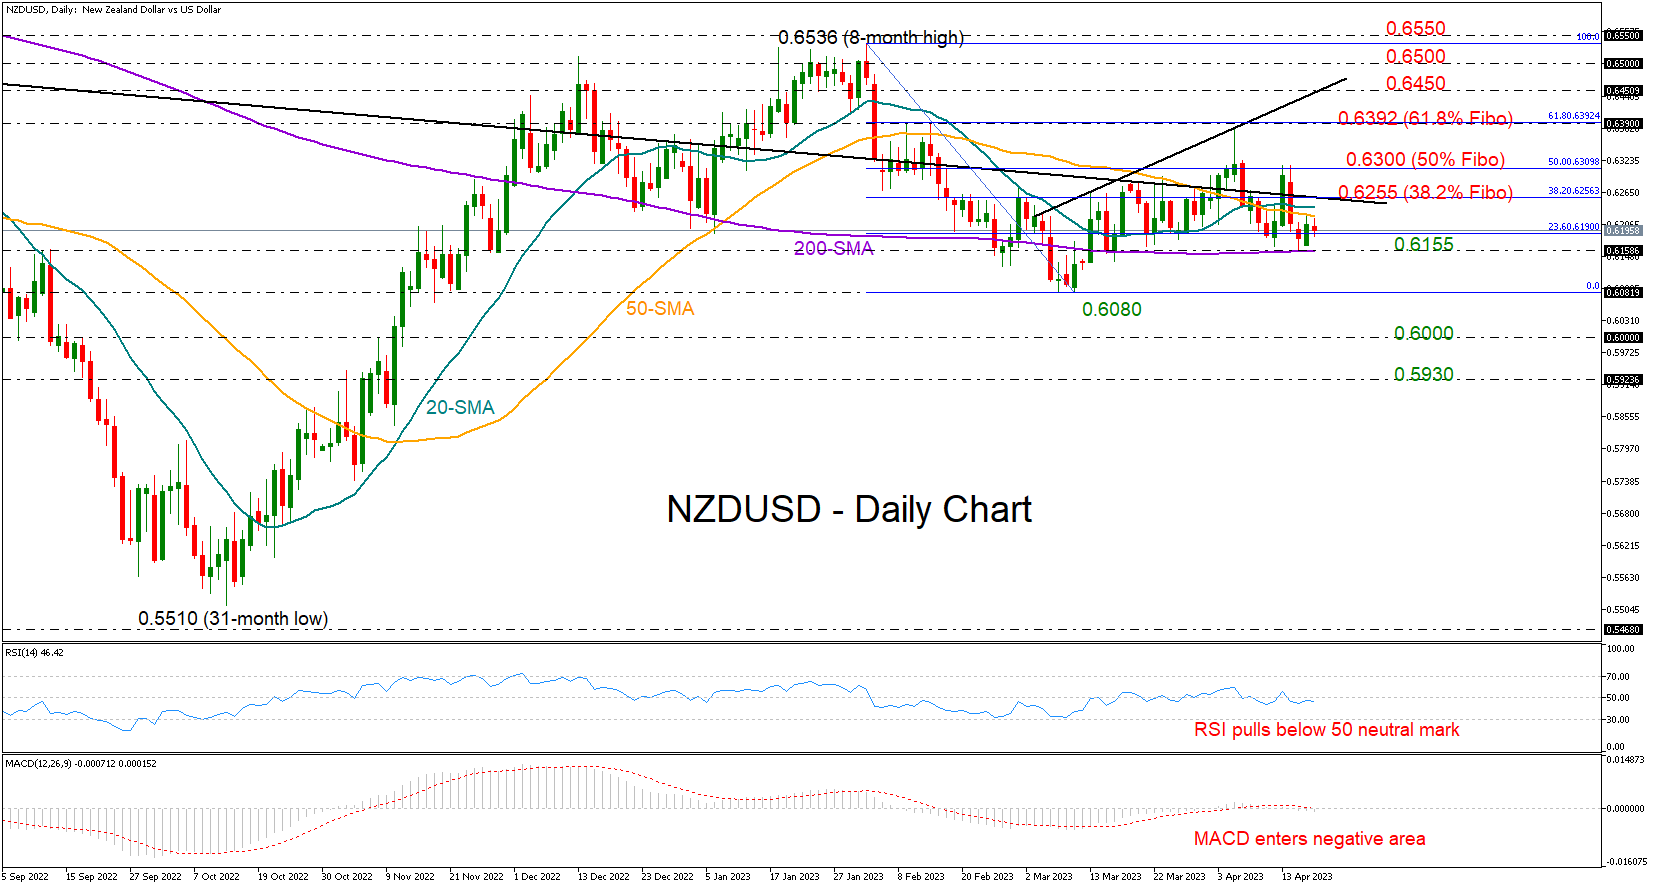
NZDUSD got another rejection near the 0.6300 round-level last week, drifting lower to retest the 200-day simple moving average (SMA) around 0.6158 ahead of New Zealand’s quarterly CPI inflation data.
The focus will remain on the downside as the RSI has returned to the bearish region, and the MACD has slipped into the negative area, both suggesting that downside corrections are more likely than upside ones.
A close below the 200-day SMA may renew selling pressures, likely driving the price straight to the March low of 0.6080. Another bearish correction here would shift the outlook back to bearish, bringing the 0.6000 psychological mark next into view. A steeper decline could halt around 0.5930.
Alternatively, traders may wait for a sustainable bullish move above the 0.6255-0.6300 zone before targeting the tough resistance of 0.6390 and the ascending line near 0.6450. Should the bulls claim this territory, the door would open for the 0.6500 number and then for the 0.6550 barrier.
All in all, NZDUSD may struggle to find a new direction unless it drops below 0.6155 or climbs above 0.6300.
GBP/USD Technical Analysis
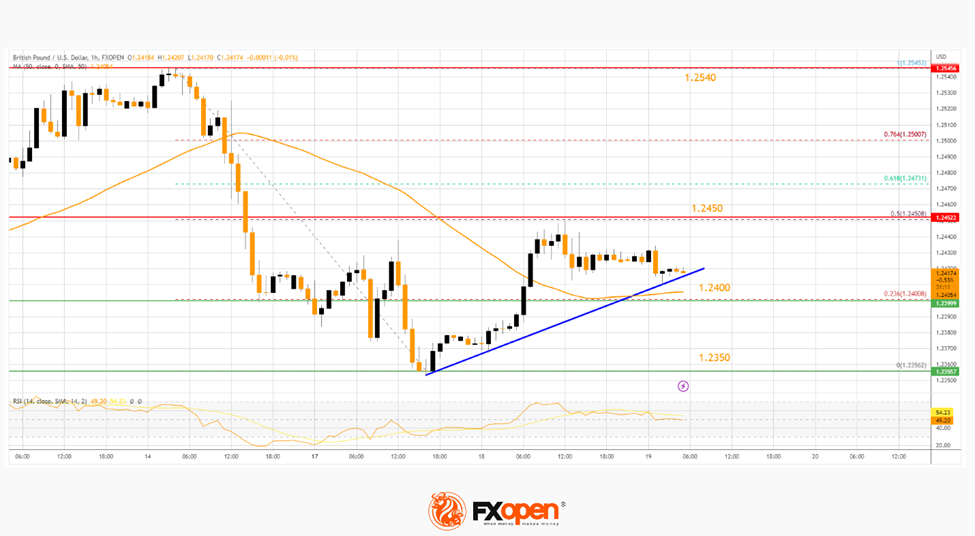
On the hourly chart of GBP/USD at FXOpen, the pair started a fresh decline from the 1.2540 zone. The British Pound declined heavily below the 1.2450 level against the US Dollar.
Finally, it tested the 1.2350 support and recently started an upside correction. There was a move above the 50-hour simple moving average and 1.2400. The pair is now facing resistance near the 50% Fib retracement level the downward move from the 1.2540 swing high to the 1.2350 low at 1.2450.
If there is a clear upside break above the 1.2450 resistance, the pair could rise steadily toward the 1.2540 level in the near term. The next major resistance sits near the 1.2600 level.
On the downside, the first major support is near the 1.2400 level. The main support is forming near the 1.2350 level. A break below the 1.2350 support could push the pair toward the 1.2300 support.
EUR/USD Daily Outlook
Daily Pivots: (S1) 1.0936; (P) 1.0960; (R1) 1.0997; More...
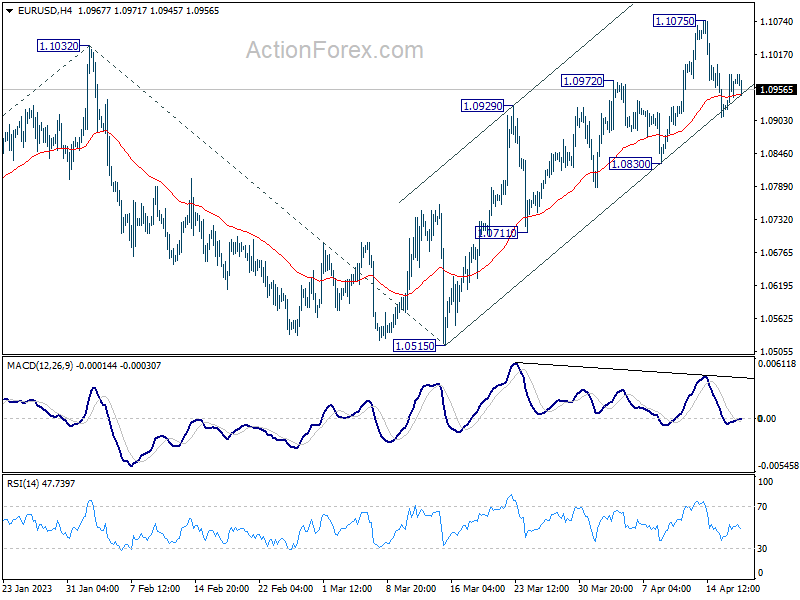
Intraday bias in EUR/USD remains neutral as consolidation from 1.1075 is still extending. Outlook remains bullish with 1.0830 support intact. On the upside, break of 1.1075 will will resume larger up trend to 1.1273 fibonacci level. Break there will target 61.8% projection of 0.9534 to 1.1032 from 1.0515 at 1.1441. However, firm break of 1.0830 will confirm short term topping and bring deeper decline to 1.0711 support instead.
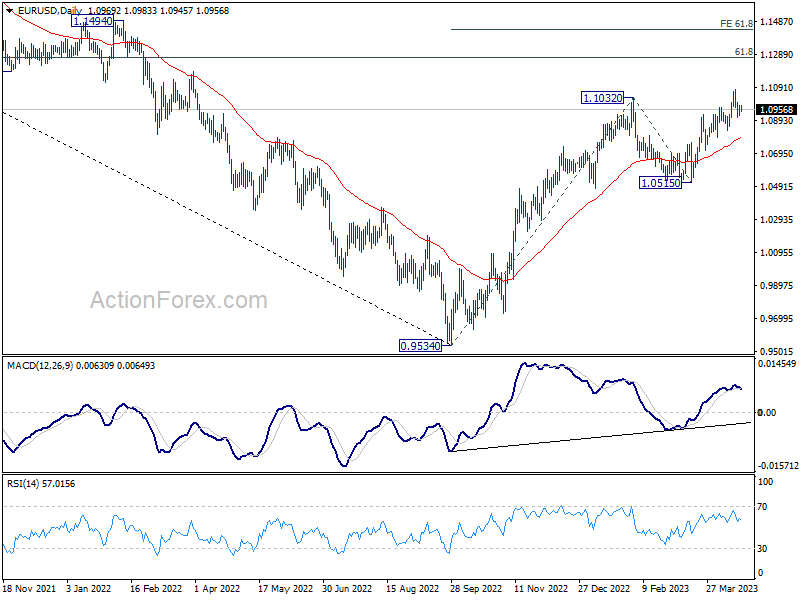
In the bigger picture, rise from 0.9534 (2022 low) is in progress for 61.8% retracement of 1.2348 (2021 high) to 0.9534 at 1.1273. Sustained break there will solidify the case of bullish trend reversal and target 1.2348 resistance next (2021 high). This will now remain the favored case as long as 1.0515 support holds, even in case of deeper pull back.
USD/JPY Daily Outlook
Daily Pivots: (S1) 133.74; (P) 134.23; (R1) 134.58; More...
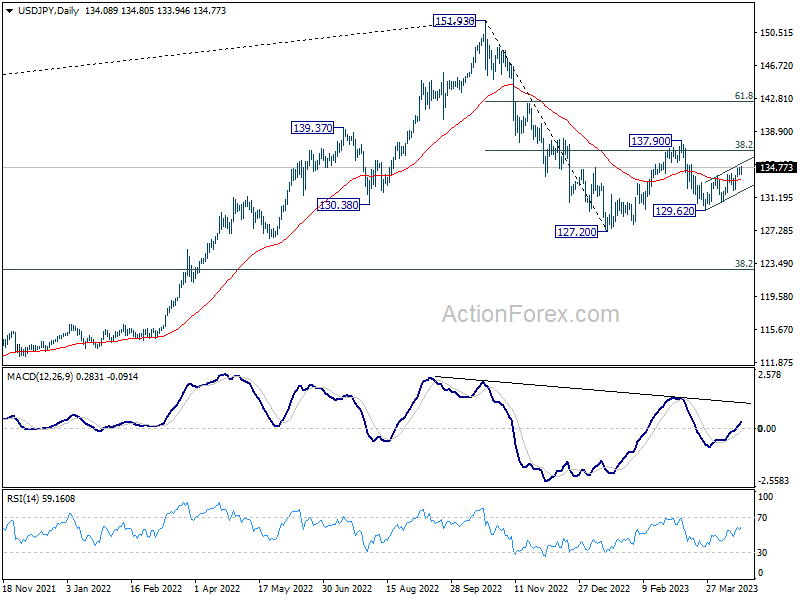
USD/JPY's rally from 129.62 resumed after brief consolidations. Intraday bias is back on the upside and further rise should be seen towards 137.90 resistance. On the downside, below 133.85 minor support will turn intraday bias neutral again. But further rally will remain in favor as long as 132.03 support holds.
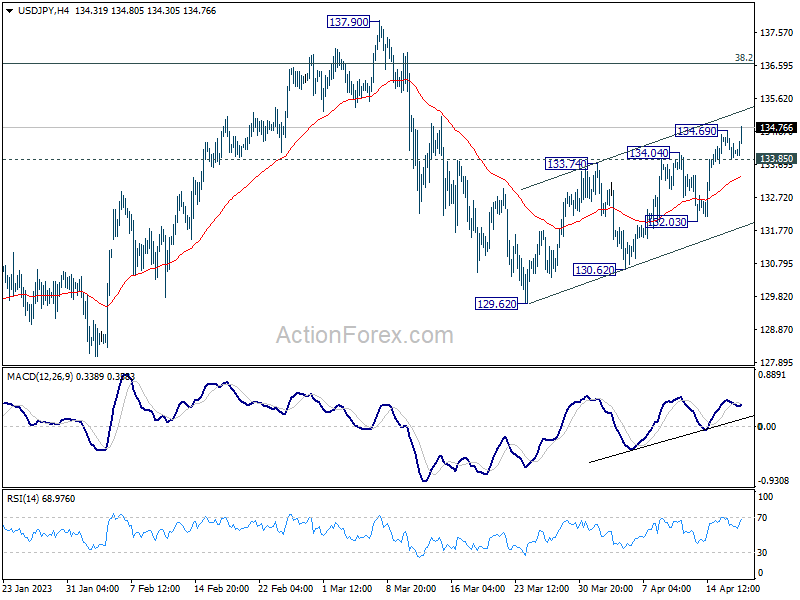
In the bigger picture, corrective pattern from 127.20 might be extending. But after all, down trend from 151.93 is expected to resume at a later stage. Break of 127.20 will resume this down trend and target 61.8% projection of 151.93 to 127.20 from 137.90 at 122.61. This will now be the favored case as long as 137.90 resistance holds.