

Sample Category Title
Plenty of Fed and ECB Governors Scheduled to Give Their View
Markets
Yesterday’s higher than expected UK CPI data provided a wake-up call for global markets. Despite rising uncertainty on growth, monetary policy probably needs to be tighter for longer compared to what was hoped for after the financial turmoil last month. Gilts understandably underperformed Bunds and Treasuries with UK yields adding between 13.9 bps (2-y) and 8.5 bps (30-y). US and European yields followed the UK move at a distance. US yields gained up to 4.7 bps (2-y) implying some modest further curve inversion. German yields rose between 6.2 bps (2-y) and 1.9 bp (30-y). The Fed Beige Book preparing the May 02-03 policy meeting suggests that economic activity recently was little changed. Credit conditions have tightened. The rate of price increases appears to be slowing. Labour market/wage indications also showed somewhat of a more balanced picture. In a speech after the close of markets, New York Fed President John Williams basically joined the (anecdotical) evidence from the Beige Book. He admitted that inflation stays too high, but recent data indicate it might continue to slow. He also sees signs of a gradual cooling in demand for labour. Tightening of credit conditions might further weigh on activity/demand. Both the Beige Book and the Williams comments support the case for the Fed to raise the policy rate by 25 bps in May and then taking a wait-and-see approach. The impact of the repositioning in yields on other markets was modest. Equities, both in the US and Europe, finished the day little changed. The dollar rebounded, but gains remained modest and moves easily stayed within recent barriers. DXY closed at 101.97 (from 101.70). EUR/USD finished at 1.0955 (from 1.0972). USD/JPY extended its recent gradual uptrend (134.72 from 134.12). Sterling outperformed the dollar and the euro. Even so, EUR/GBP still closed north of 0.88(07).
Asian equities show modest losses this morning. US yields and the dollar are little changed. Later today, the eco calendar contains EC consumer confidence, US initial jobless claims and the Philly Fed business outlook. There are again plenty of Fed and ECB governors scheduled to give their view ahead of upcoming black-out period. We keep a close eye at the ECB comments to get some insight on the chances of an additional 50 bps step at the May meeting. We dissect Minutes of the ECB meeting in the same way. Markets probably underestimate the odds for such a move. This debate keeps EMU yields, especially at the short end of the curve, well supported. The German 2-y yield nears 3% resistance. The downside in EUR/USD at 1.0831 is currently well protected.
News and views
New Zealand inflation decelerated from 1.4% q/q in 2022Q4 to 1.2% in the first quarter of this year, going against expectations for a quickening to 1.5%. The yearly figure as a result eased more than anticipated, from 7.2% to 6.7%. The Reserve Bank of New Zealand in its February statement projected 7.3%. Food (3.7% q/q) and tobacco (4.1% q/q) were key drivers while housing & household utilities eased to a still above-average 1% q/q. Transportation costs weighed heavily (-1.3% q/q) as energy/oil prices dropped considerably. CPI excluding food, household energy and vehicle fuels increased 6.5% y/y, only marginally lower than the 6.7% 2022Q4 while non-tradeable inflation (a proxy for services inflation) quickened to 1.7% q/q. The RBNZ earlier this month hiked by 50 bps to 5.25% and said the direction of future monetary policy will be determined by the course of core inflation. New Zealand swap rates tumble between 8.9 and 12 bps with the front end of the curve outperforming. Market expectations for the terminal rate have lowered about 10 bps to 5.50%, implying one more 25 bps rate hike at either the May or July meeting. The kiwi dollar underperforms peers this morning. USD/NZD eases from 0.62 to 0.6157 currently.
The EU is preparing an emergency ban on Ukrainian grain imports to the four member states bordering Ukraine plus Bulgaria, the Financial Times reported. The move seeks to regularize unilateral moves by the likes of Poland and Hungary. They barred imports that were meant to but couldn’t be re-exported because of truck and train shortages, pressuring local prices and farmers. Problems arose when the EU following the Russian invasion introduced a wartime free-trade regime for agricultural products. Originally planned to end in June this year, the EU wants to extend it. The renewed version is likely to include stronger provisions that allow the bloc to take measures to protects its own market more rapidly.
Gold Consolidates Gains
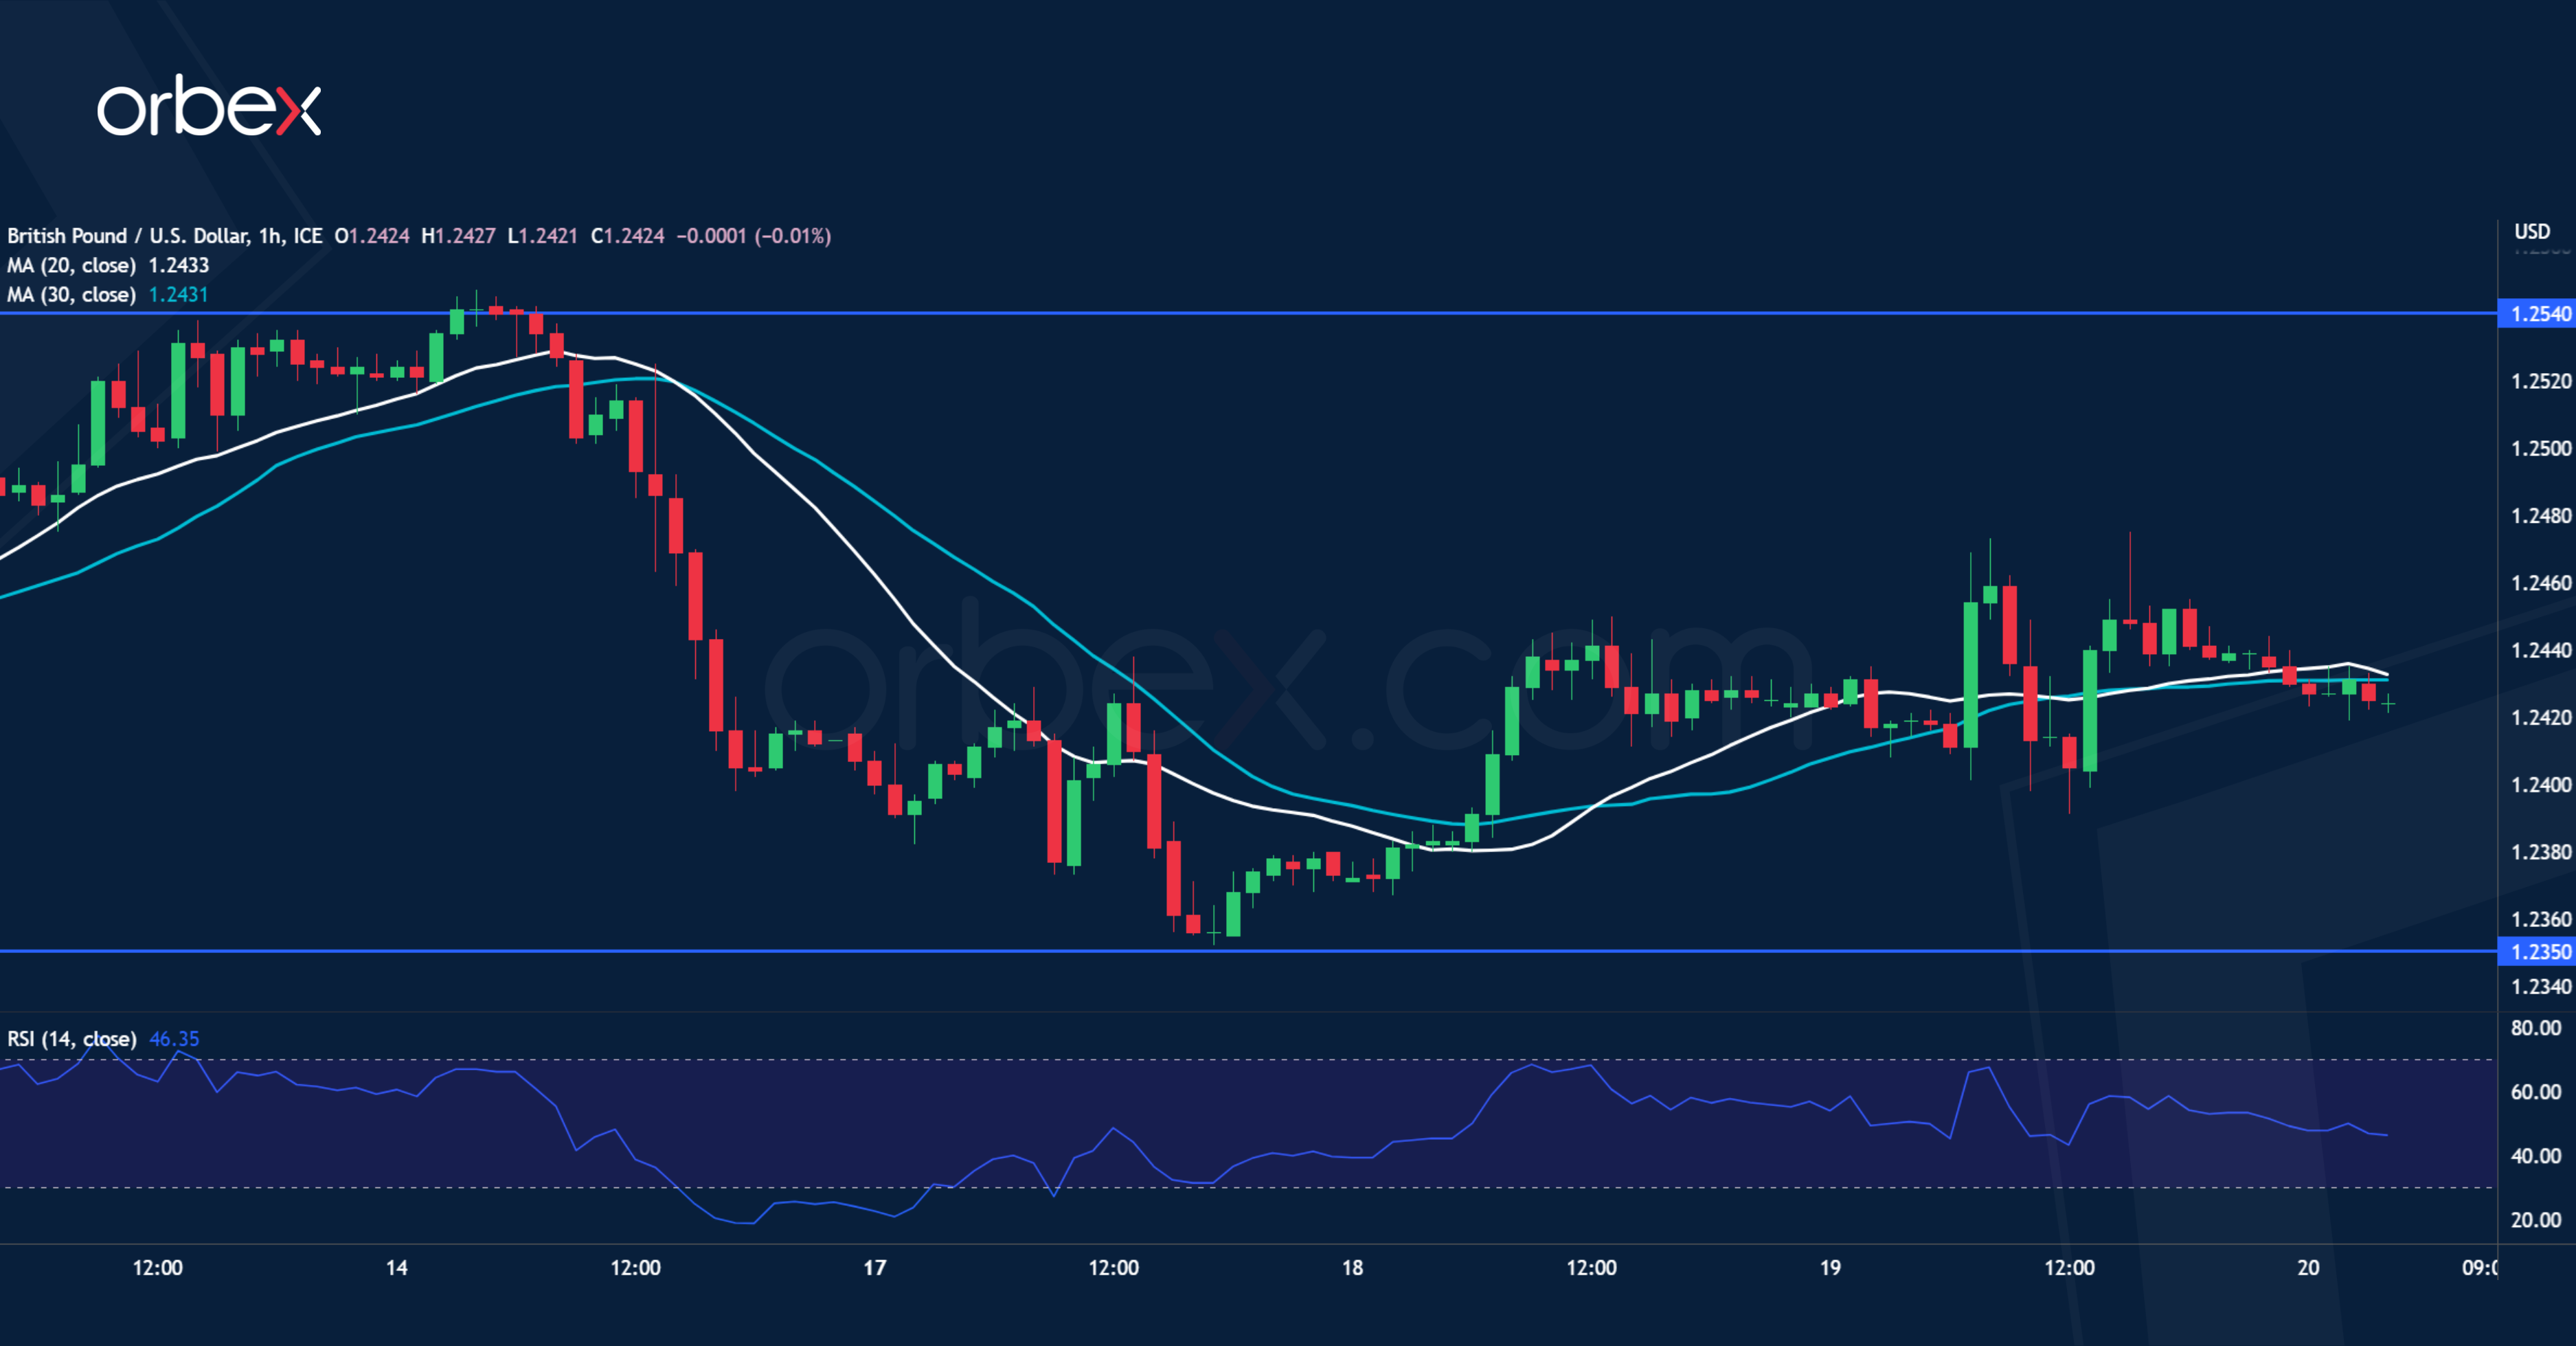
GBP/USD attempts to rebound
Cable inched higher as Britain’s inflation remained double digit. The latest retracement has found support on the 20-day SMA (1.2350) and a bounce above the immediate resistance of 1.2340 eased some pressure. Sentiment remains positive from the daily chart’s perspective and the bulls may see the short-term consolidation as an opportunity to join the uptrend. A break above the recent high of 1.2540 may convince more conservative traders to jump in. On the downside, 1.2270 would be a second support level.
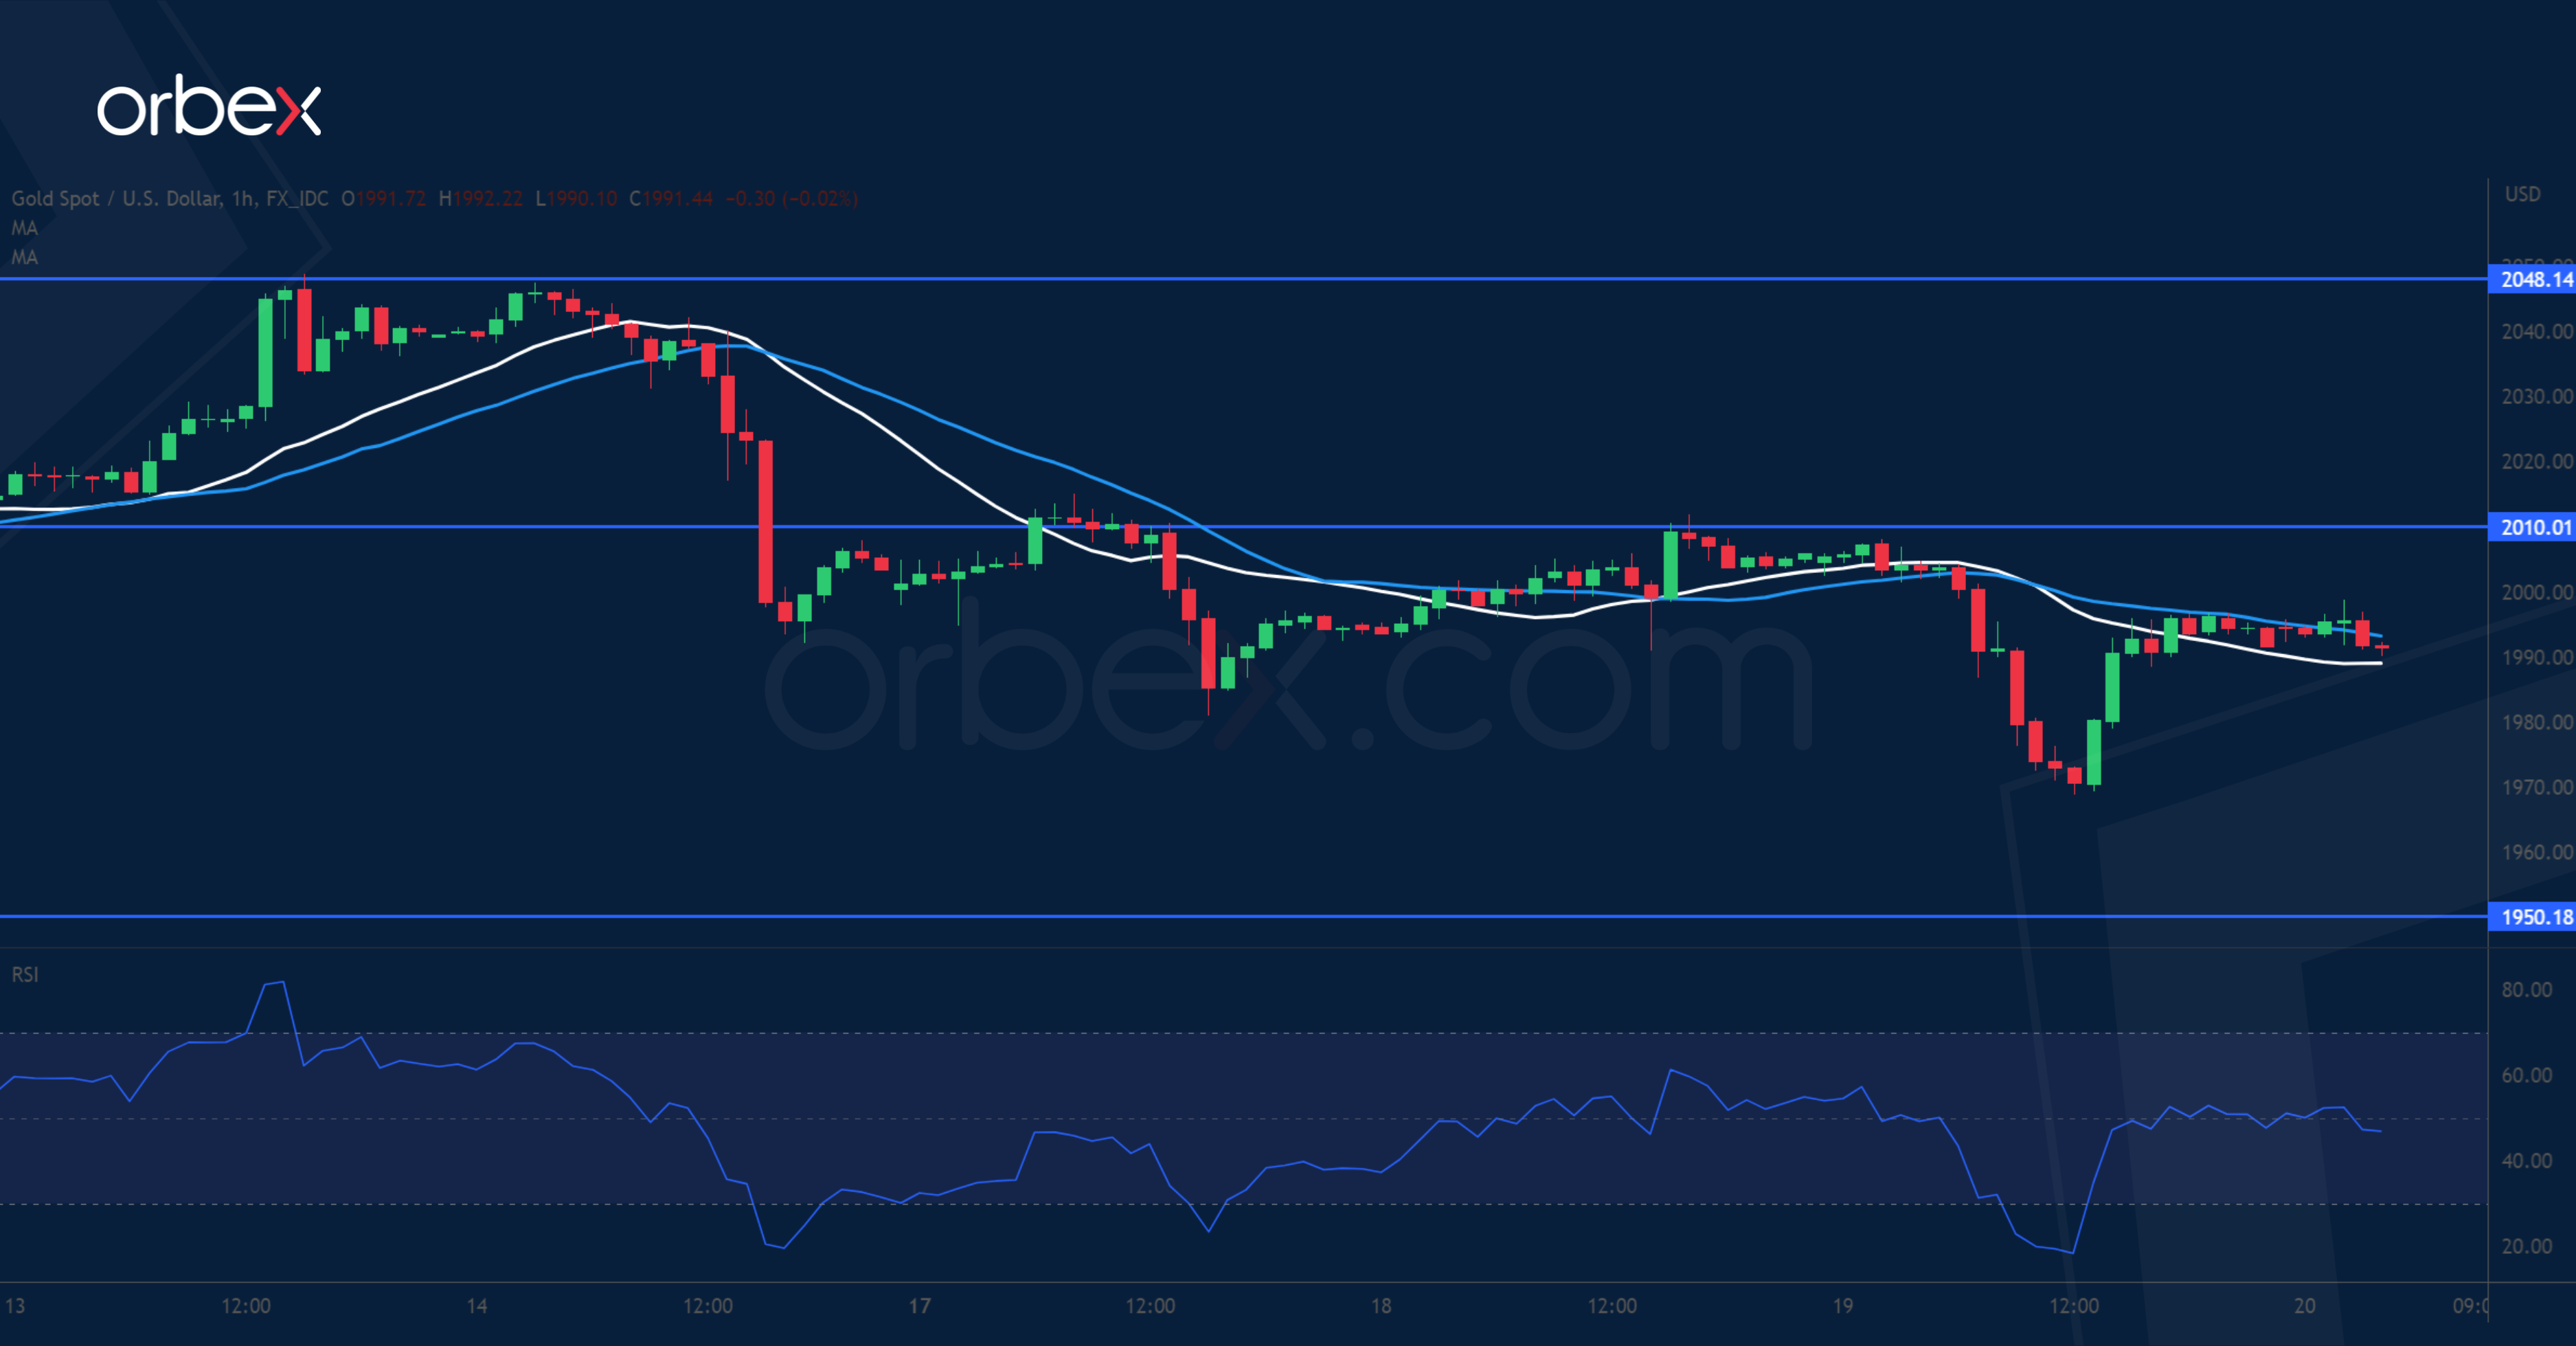
XAU/USD seeks support
Gold tumbles as the dollar index and Treasury yields recover. Following the RSI’s overbought double top on the daily chart, the price turned south at 2048, falling short of the all-time high at 2070. The pullback would give the metal some breathing room after a month-long rally. Successive breaks below the psychological level of 2000 then 1980 led to the liquidation of leveraged short-term positions. The demand zone around 1950 is critical to see buyers’ commitment. 2010 is the first hurdle should the price bounces back.
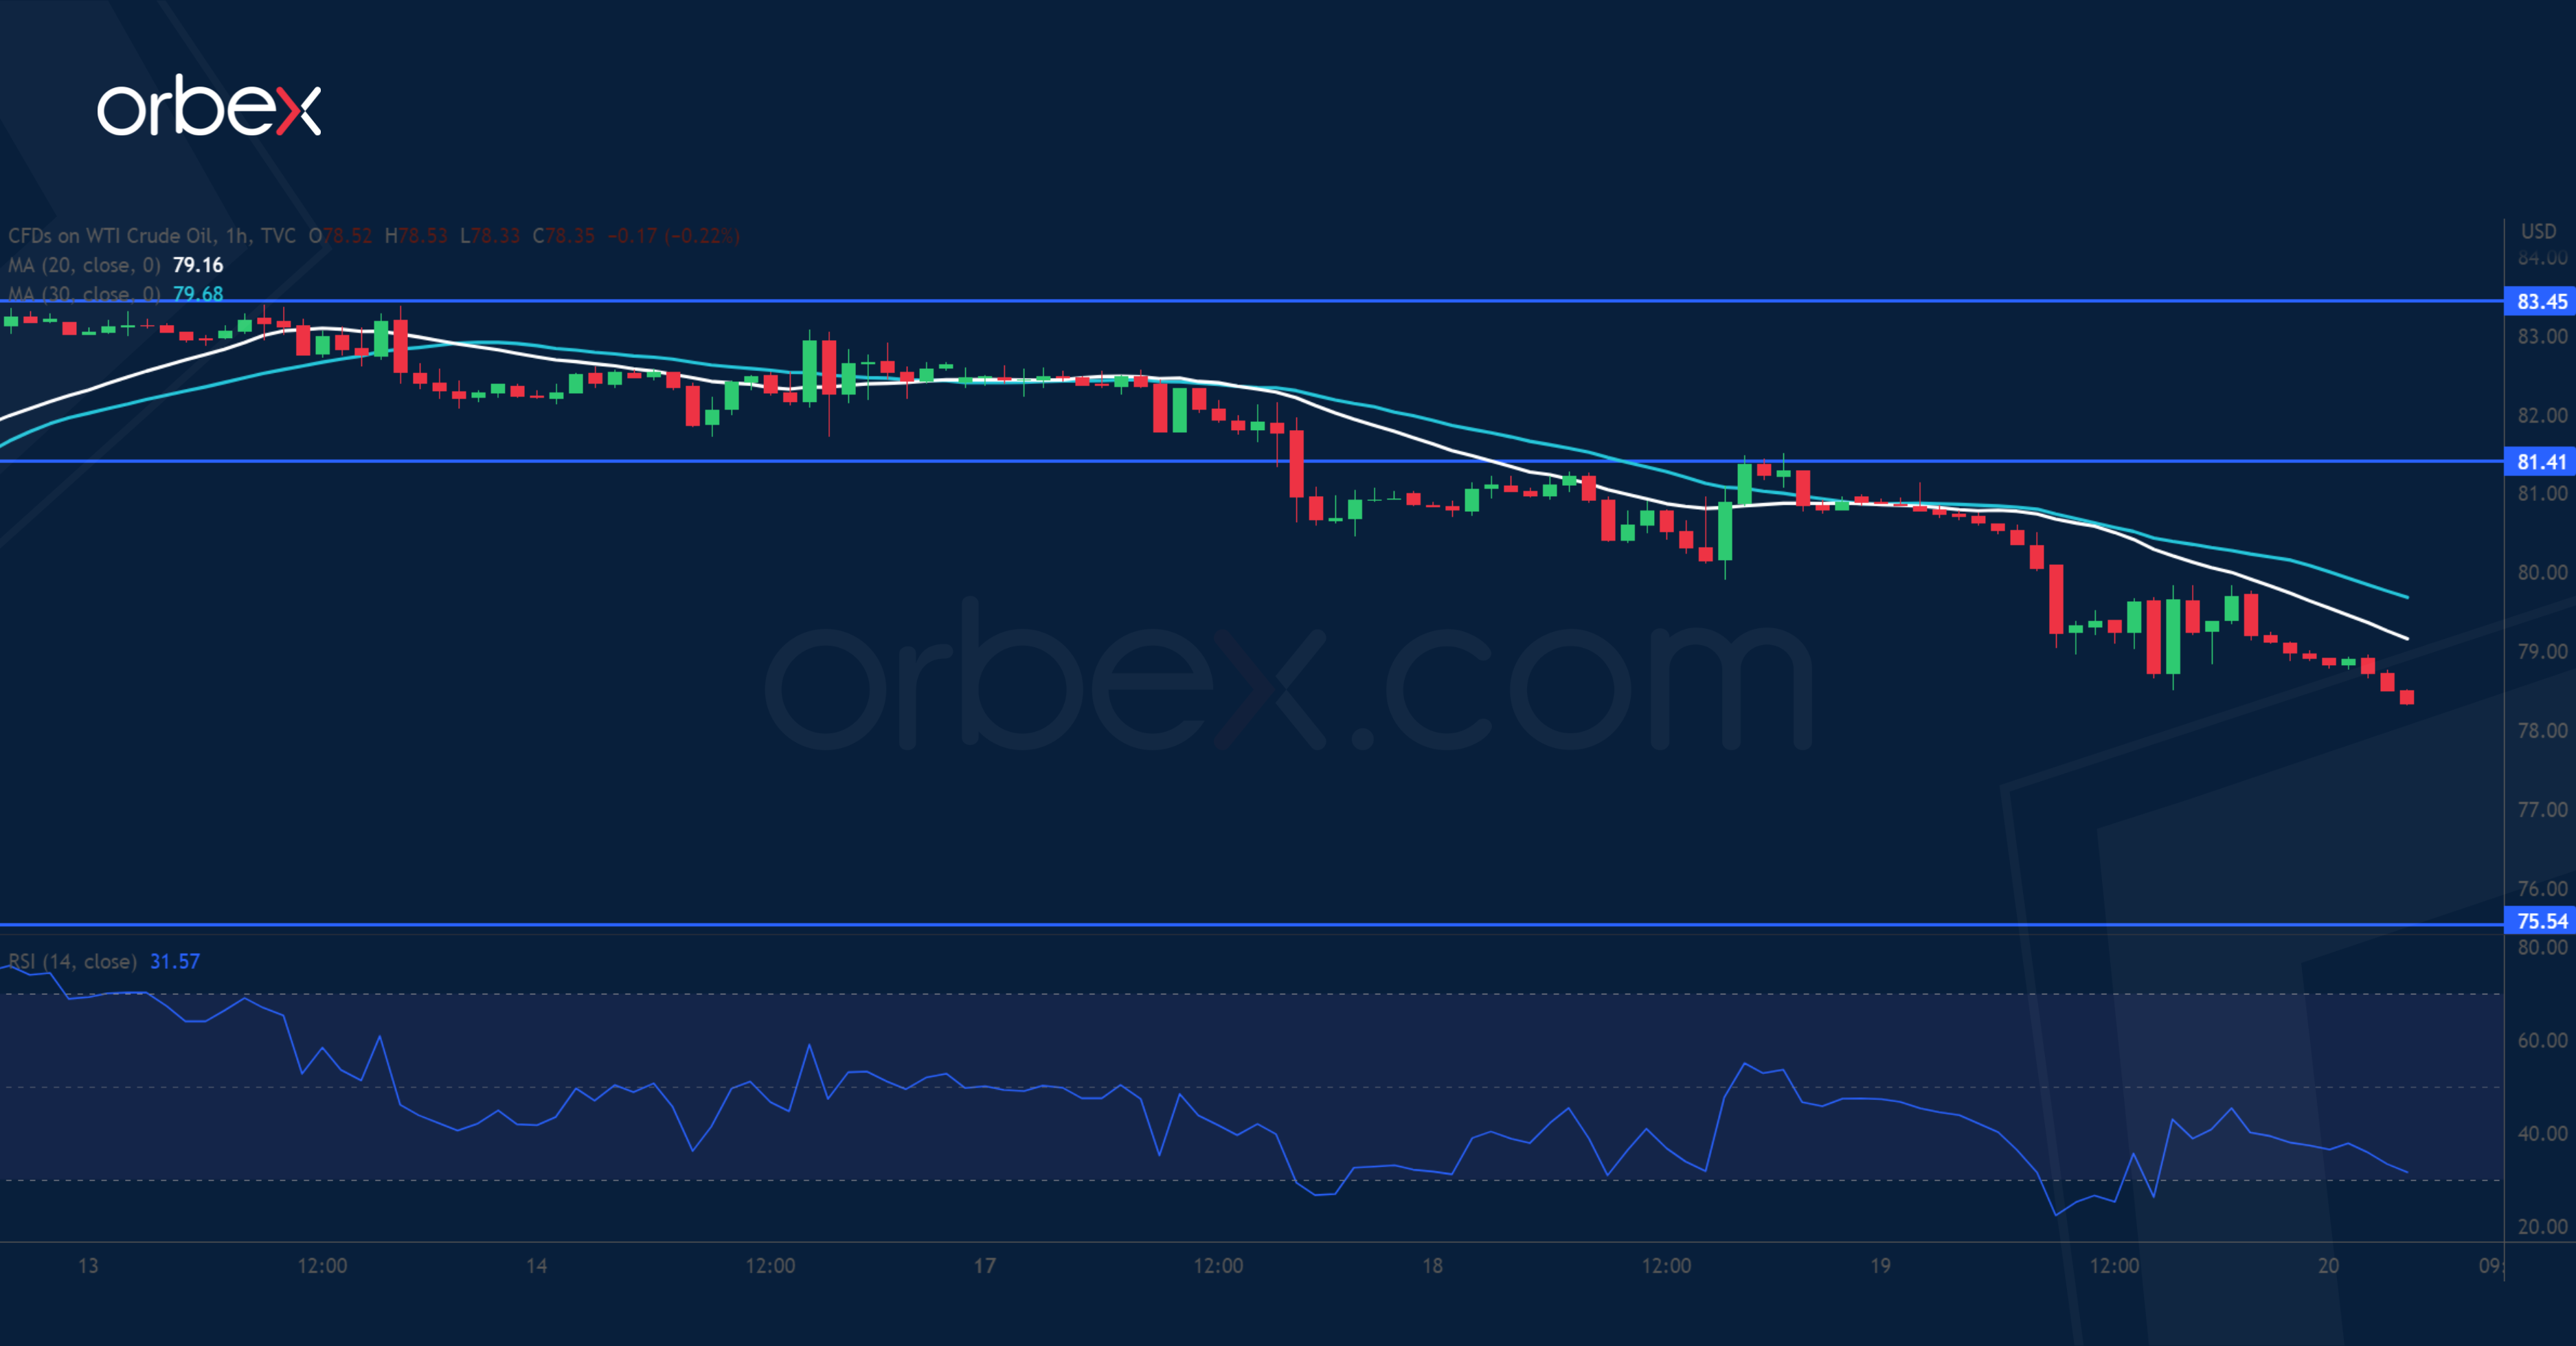
US Oil drifts lower
WTI softens on subdued risk appetite across markets. The bulls have struggled to hold the psychological level of 80.00 near the base of a follow-through rally from last week. As the upward momentum dies down, bids come lower as short-term traders take their chips off the table. The price might be vulnerable to a broader sell-off after it broke below the swing low of 79.30, which would fill the gap from early April. 75.50 next to the daily SMAs’ bullish cross would be a key support. 81.40 is the closest resistance ahead.
Debt Ceiling Clock is Ticking
Market movers today
Today we get April consumer confidence out of both the euro area and Denmark. It will be interesting to see if the mood among consumers continues to improve.
Statistics Norway releases its business tendency survey from Q1.
We also have several releases from the US, among others the Philly Fed index and initial jobless claims. Later, we have several Fed speakers on the wire.
Overnight, we get inflation figures and PMIs from Japan. This data will be scrutinised by the Bank of Japan to gauge the strength of the Japanese economic recovery and the underlying price pressure ahead of the BoJ meeting next week.
The 60 second overview
Oil: Oil prices dropped yesterday and further overnight, with Brent falling to USD82/bbl, without any oil specific news to spook the market. US recession fears have started to grow again and the USD rebound, which could be likely causes for the drop in prices. It could also be the effect of renewed selling of strategic reserves by the US. Prices would need to fall further to trigger a response from OPEC+ in the form of another production cut. For starters, we think the cartel would like to see the effect of its recently announced cut before slashing output further.
US: The US Treasury cash balance rose USD108bn on Tuesday. It should give the Treasury enough money to cover expenses until at least early June and potentially until mid-July amid the current debt ceiling constraint. US Speaker Republican, Kevin McCarthy is set to propose a USD1.5tn increase in the debt ceiling in return for among other things spending cuts. A group of moderate Republicans and Democrats in the House of Representatives are mulling a plan B to suspend the debt ceiling until the end of the year and tie a long-term solution to budget negotiations according to a Bloomberg story yesterday.
Equities: Global equities fell yesterday with defensives, banks, and value outperforming. Part of the retracement should be seen in light of the strong performance lately. Please also note, the VIX index came lower again yesterday, ending close to 16. Considering where we are in the cycle and the level of growth one should not expect the VIX to contract further. Hence, no more tailwind to equities from fading equity vol right now. In US Dow -0.2%, S&P 500 -0.01%, Nasdaq +0.03% and Russell 2000 +0.2%. Asian markets are mixed this morning and the same goes for futures in Europe and US. That being said, European futures are higher than the US futures where especially the tech/growth part of the indices are dragging down.
FI: Rates volatility continued to be relatively contained yesterday, as in previous days, after it has taken a significant dive lower following the banking turmoil one month ago. Alongside the lower volatility the rates up environment continued with 10y Bunds 4bp higher to 2.51%. Curves flattened again from the front end initially driven by the surprisingly high UK CPI in the morning. Markets added 10bp to 3.86% peak policy rate.
FX: Broad USD firmed somewhat on the day, whereas CAD and NOK were yesterday's losers as oil prices were lower on the day. USD/JPY is closing in on 135, driven by rising US yields and a still dovish BoJ. UK inflation surprised to the upside, temporarily pushing EUR/GBP below 0.88. Scandies lost some ground, with NOK as the relative loser.
Credit: Secondary credit spreads continued the last week's tendency of very subdued volatility and lack of clear direction, with iTraxx Xover widening a modest 1.4bp and Main 0.5bp. The primary market remains open, but some issuers have to pay slightly higher NIPs than usual as was highlighted by yesterday's transaction from Jyske Bank, which priced a EUR500m senior non-preferred transaction.
Nordic macro
Norwegian manufacturers are still battling with weak final demand, rising prices and larger stocks than normal. All leading manufacturing indicators are pointing to a further decline in activity, and the PMI has fallen in recent months. There is an upswing under way in oil services, however, driven by increased investment in the Norwegian sector. We suspect that this is not being captured adequately by the PMI, so it will be interesting to see if Statistics Norway's business tendency survey shows the same trend.
Technical Outlook and Review
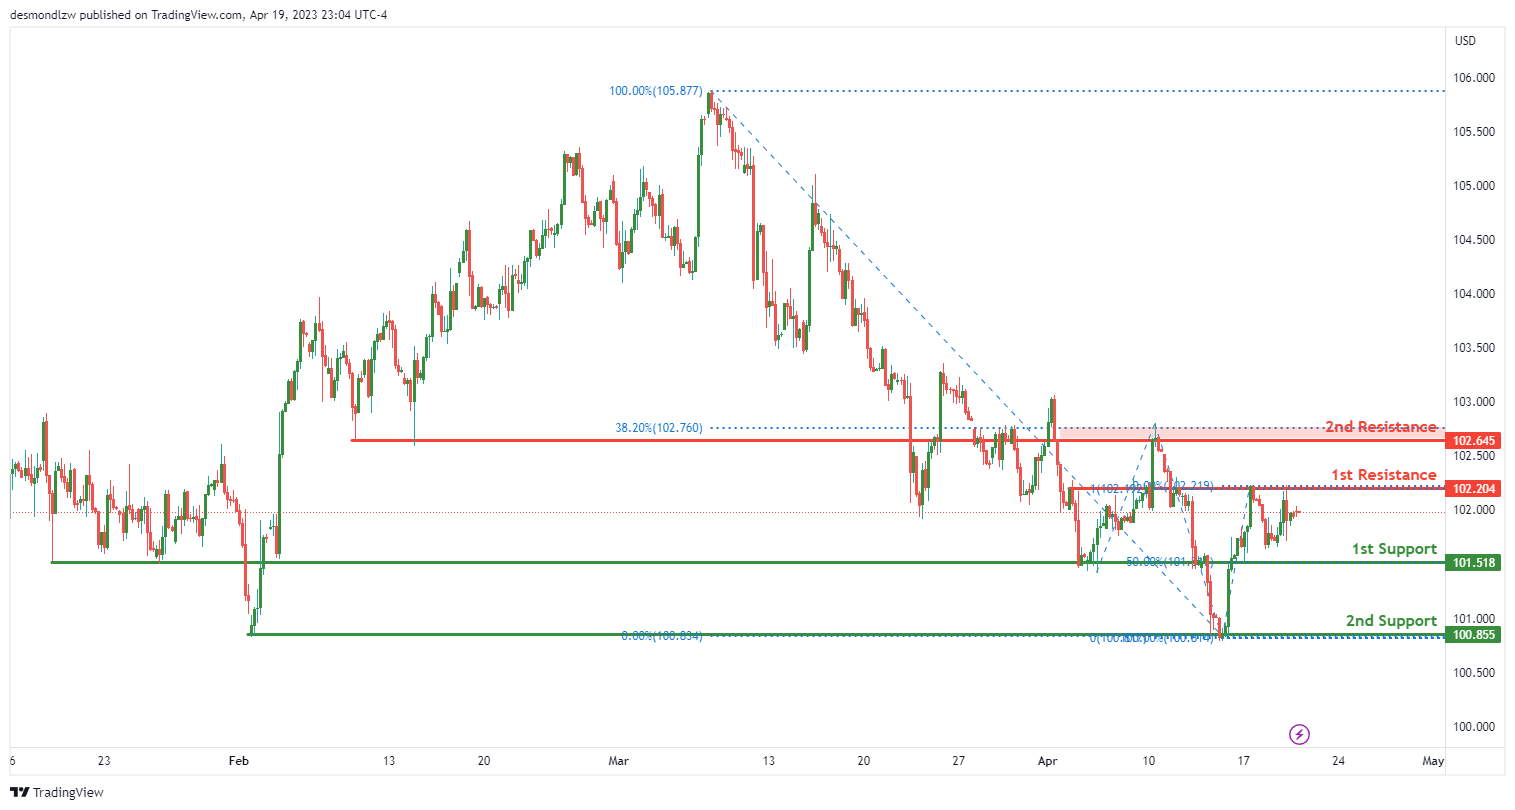
DXY:
The DXY chart exhibits a neutral momentum, with potential fluctuations between the 1st resistance and 1st support level. Currently, the price is trading around the 1st resistance level at 102.20, which is a strong overlap resistance coinciding with the 100% Fibonacci projection. If price were to break above this level, it could potentially rise towards the 2nd resistance level at 102.79, which is another overlap resistance coinciding with the 38.20% Fibonacci retracement.
On the downside, the 1st support level is at 101.51, which is a significant level as it is an overlap support coinciding with the 50% Fibonacci retracement. Another support level is the 2nd support at 100.85, which is a multi-swing low support.
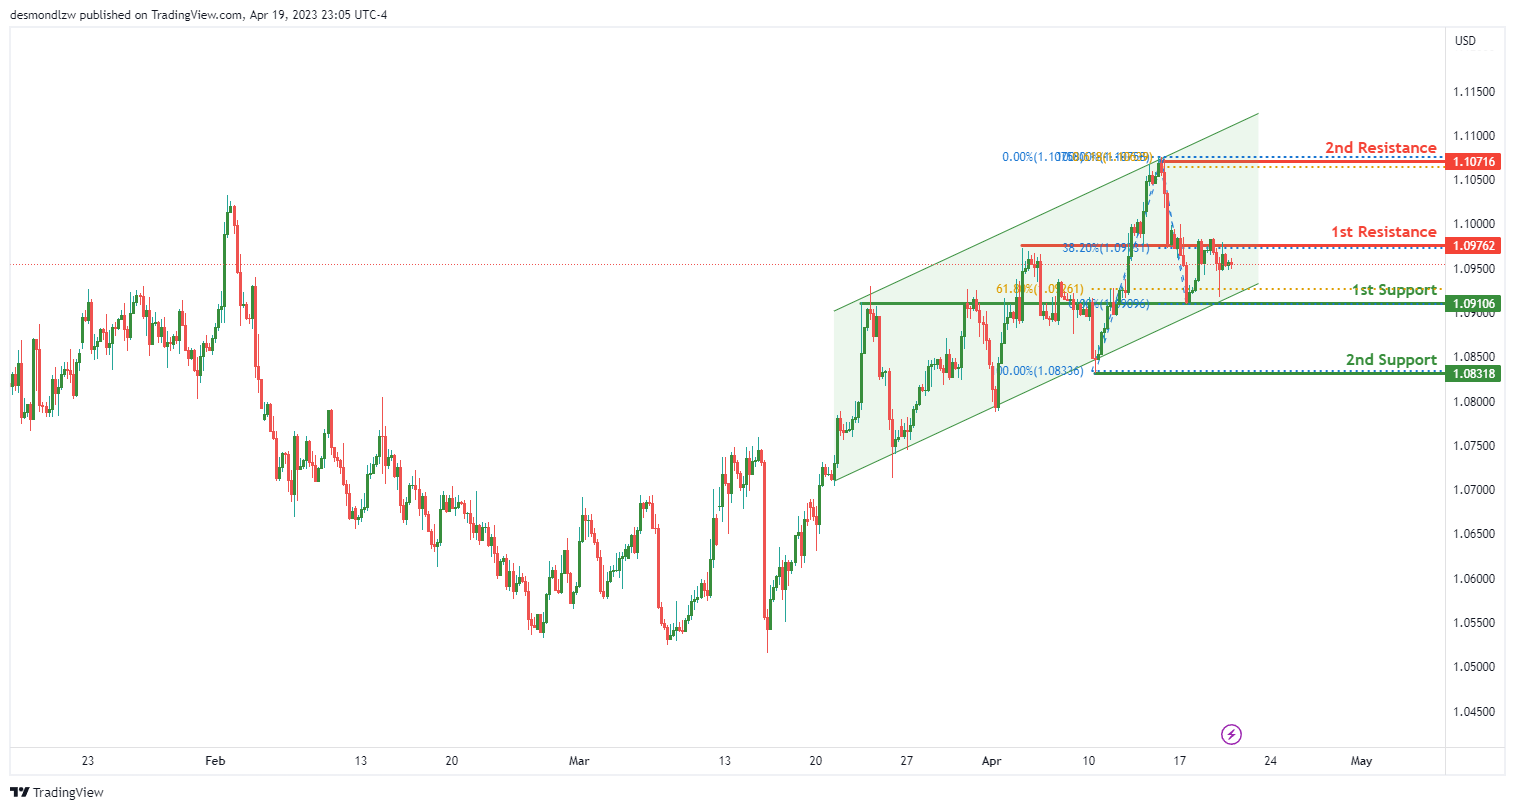
EUR/USD:
The EUR/USD chart shows strong bullish momentum as it is in a bullish ascending channel, indicating a potential continuation of the uptrend. This suggests that the price might potentially make a bullish break through the 1st resistance level and rise towards the 2nd resistance level.
The 1st support level is at 1.09, which is an overlap support and coincides with a 50% Fibonacci retracement level, making it a significant level to watch out for. Another support level is the 2nd support level at 1.08, which is a multi-swing low support.
On the other hand, the 1st resistance level is at 1.1020, which is an overlap resistance and coincides with a 100% Fibonacci projection level. The 2nd resistance level is at 1.1079, which is an overlap resistance and coincides with a 38.20% Fibonacci retracement level.
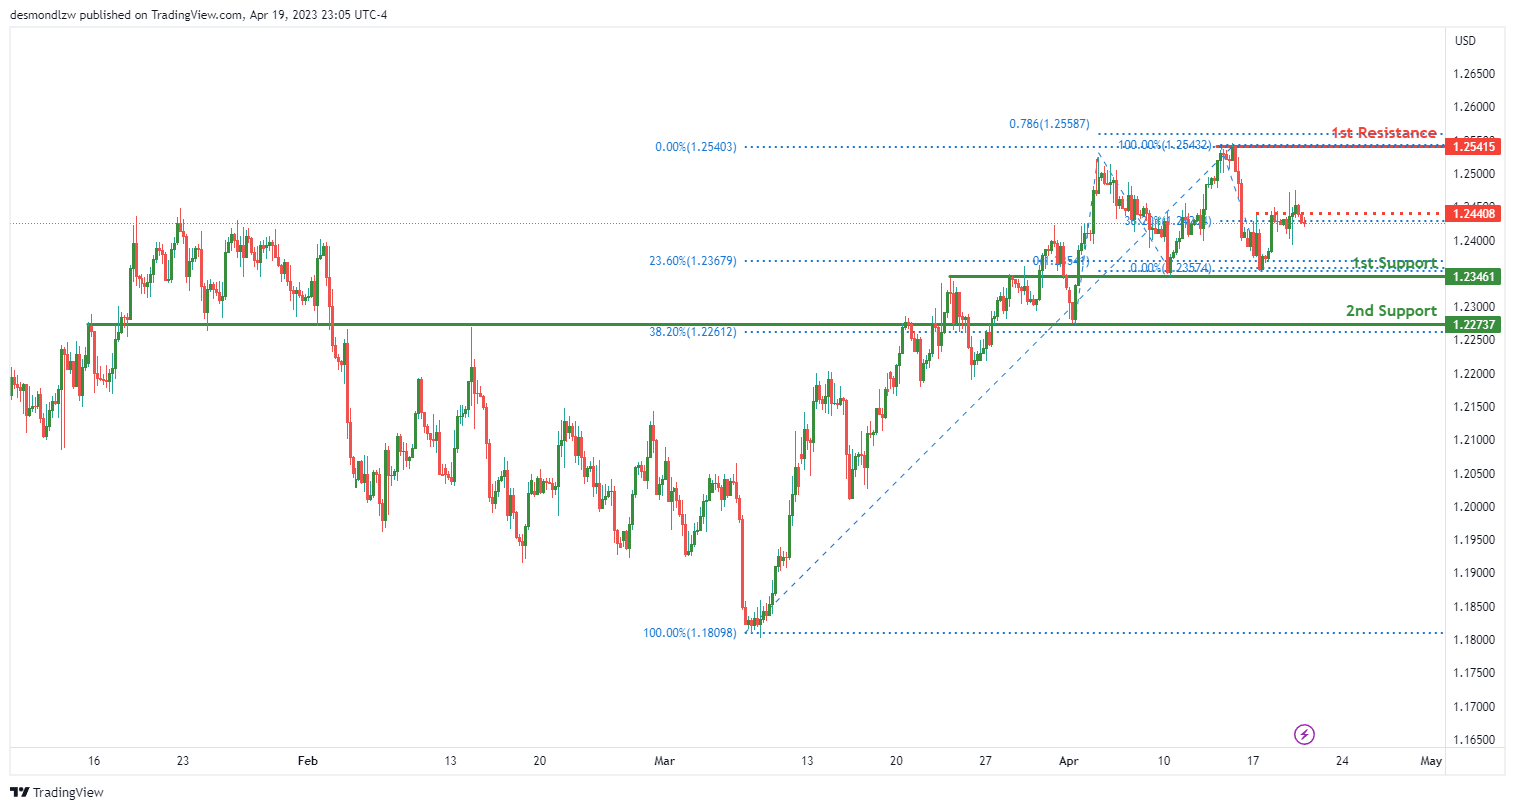
GBP/USD:
The GBP/USD chart exhibits a bullish bias, indicating a potential continuation towards the first resistance level. Price is currently trading above an ascending support line, which is in line with the bullish momentum of the chart.
The first support level is at 1.2346, which is a strong overlap support level, coinciding with the 38.20% Fibonacci retracement. The second support level is at 1.2273, which is another overlap support level.
On the other hand, the first resistance level is at 1.2541, which is a multi-swing high resistance level. It is a significant level to watch out for, as a break through this level could trigger a strong bullish acceleration towards the intermediate resistance level at 1.2440, which is also an overlap resistance and coincides with the 38.20% Fibonacci retracement.
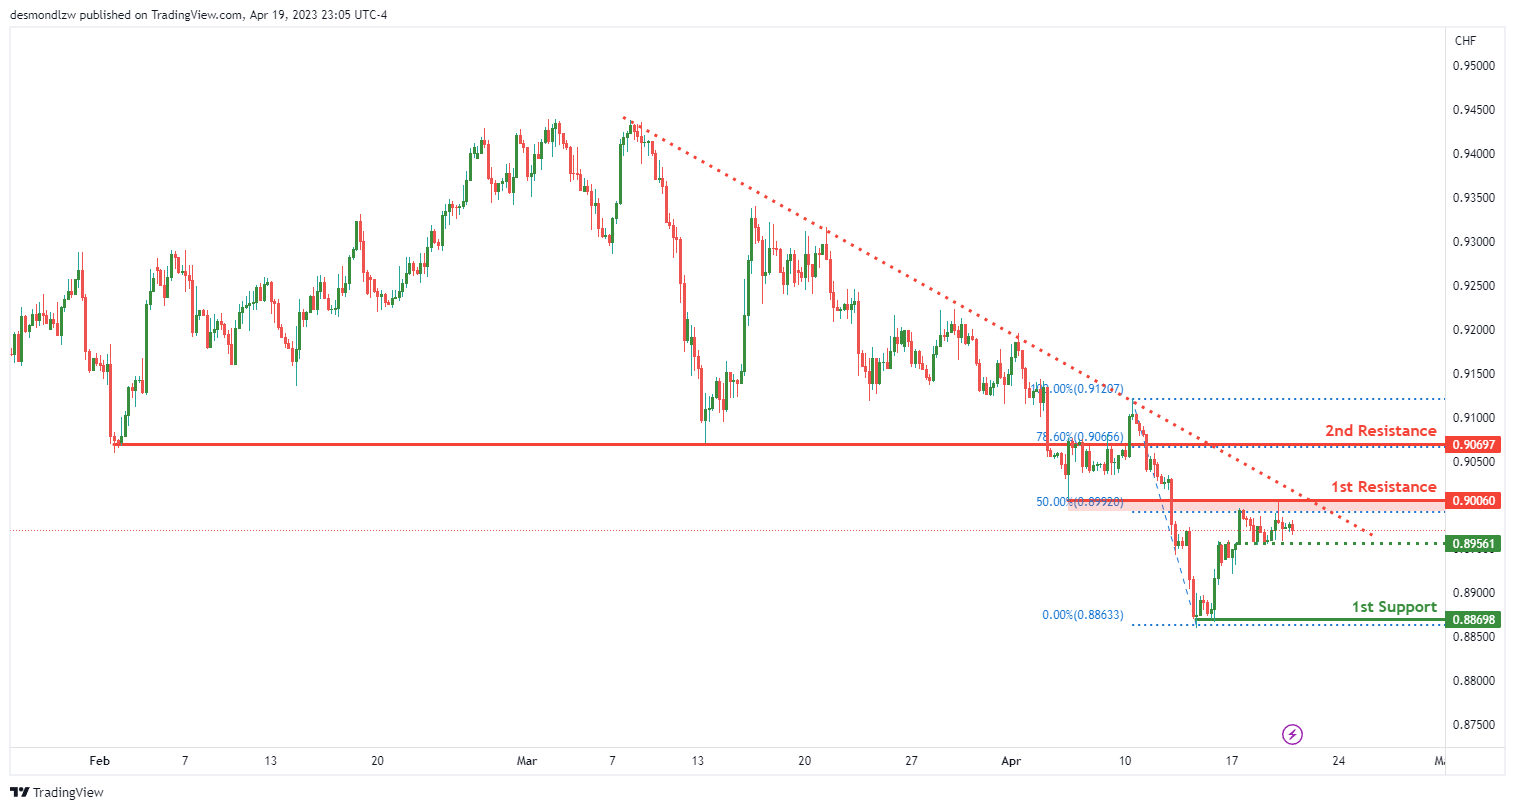
USD/CHF:
The USD/CHF chart currently shows a bearish bias as price is trading below a major descending trend line, suggesting a potential further downward movement. The first support level is at 0.8869, which is a multi-swing low support and could provide strong support for the pair. The intermediate support level is at 0.8956, which is an overlap support and could provide a short-term pause to the bearish momentum.
On the other hand, the first resistance level is at 0.9006, which is a significant level to watch out for as it is a multi-swing high resistance and coincides with a 50% Fibonacci retracement level. Another potential resistance level is at 0.9069, which is a pullback resistance and coincides with a 78.60% Fibonacci retracement level.
If price fails to break the first resistance level, it could potentially make a bearish continuation towards the first support level. However, if the first resistance level is broken, it could trigger a bullish acceleration towards the second resistance level.
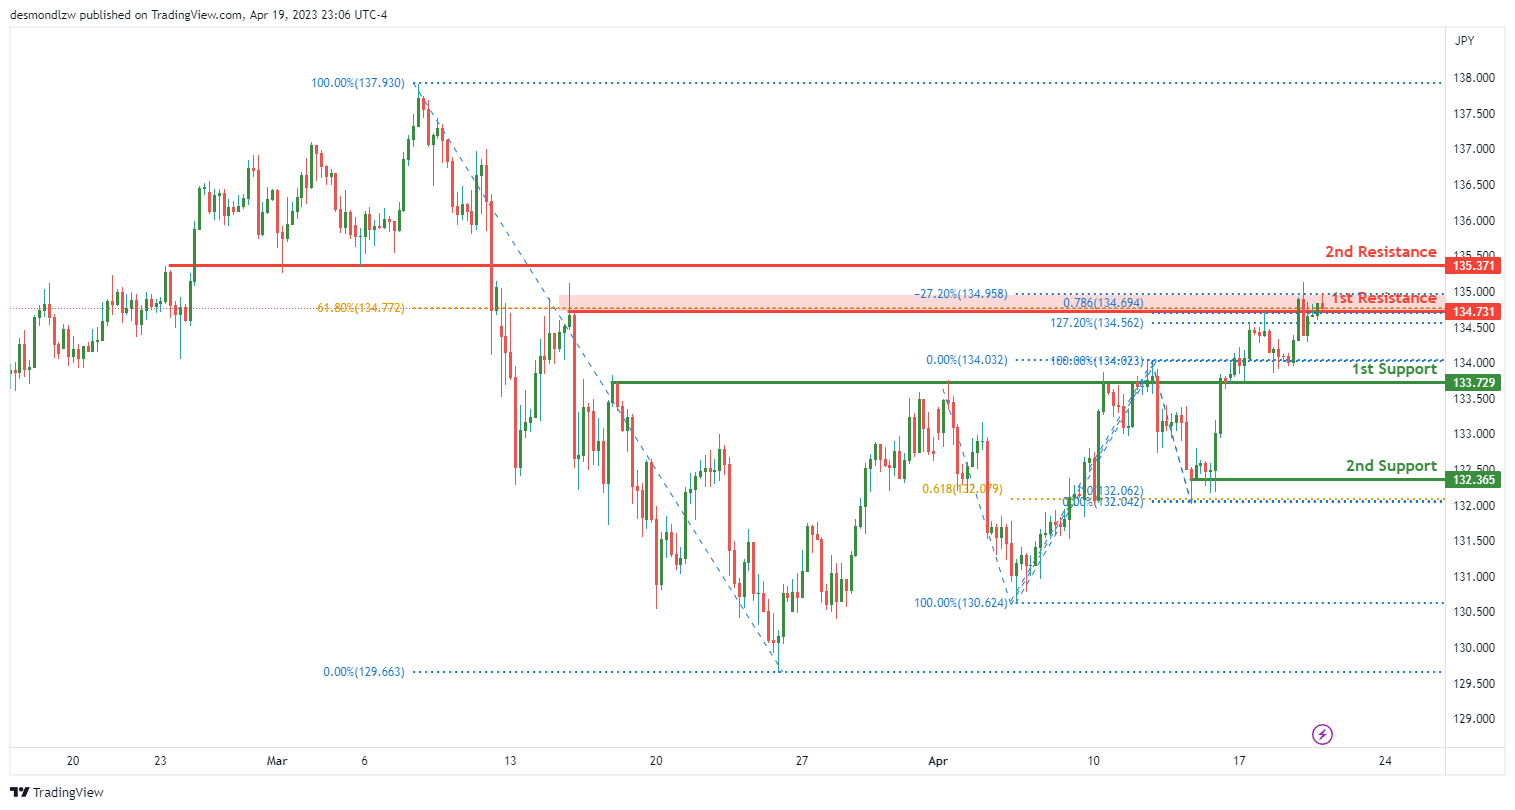
USD/JPY:
The USD/JPY chart, the overall momentum of the chart is currently bearish. This is due to the presence of a strong descending trend line, which suggests potential further downside movement.
In this scenario, the 1st support level is at 133.72, which is a good support level as it is an overlap support. The 2nd support level is at 132.36, which also serves as an overlap support and coincides with the 61.80% Fibonacci projection.
On the other hand, the 1st resistance level is at 134.73, which is a multi-swing high resistance and coincides with the 61.80% Fibonacci retracement. The 2nd resistance level is at 135.37, which serves as a pullback resistance.
If price fails to break the 1st resistance level, it could potentially make a bearish continuation towards the 1st support level. In the event that the 1st support level is breached, the next support level it could drop to is the 2nd support at 132.36.
AUD/USD:
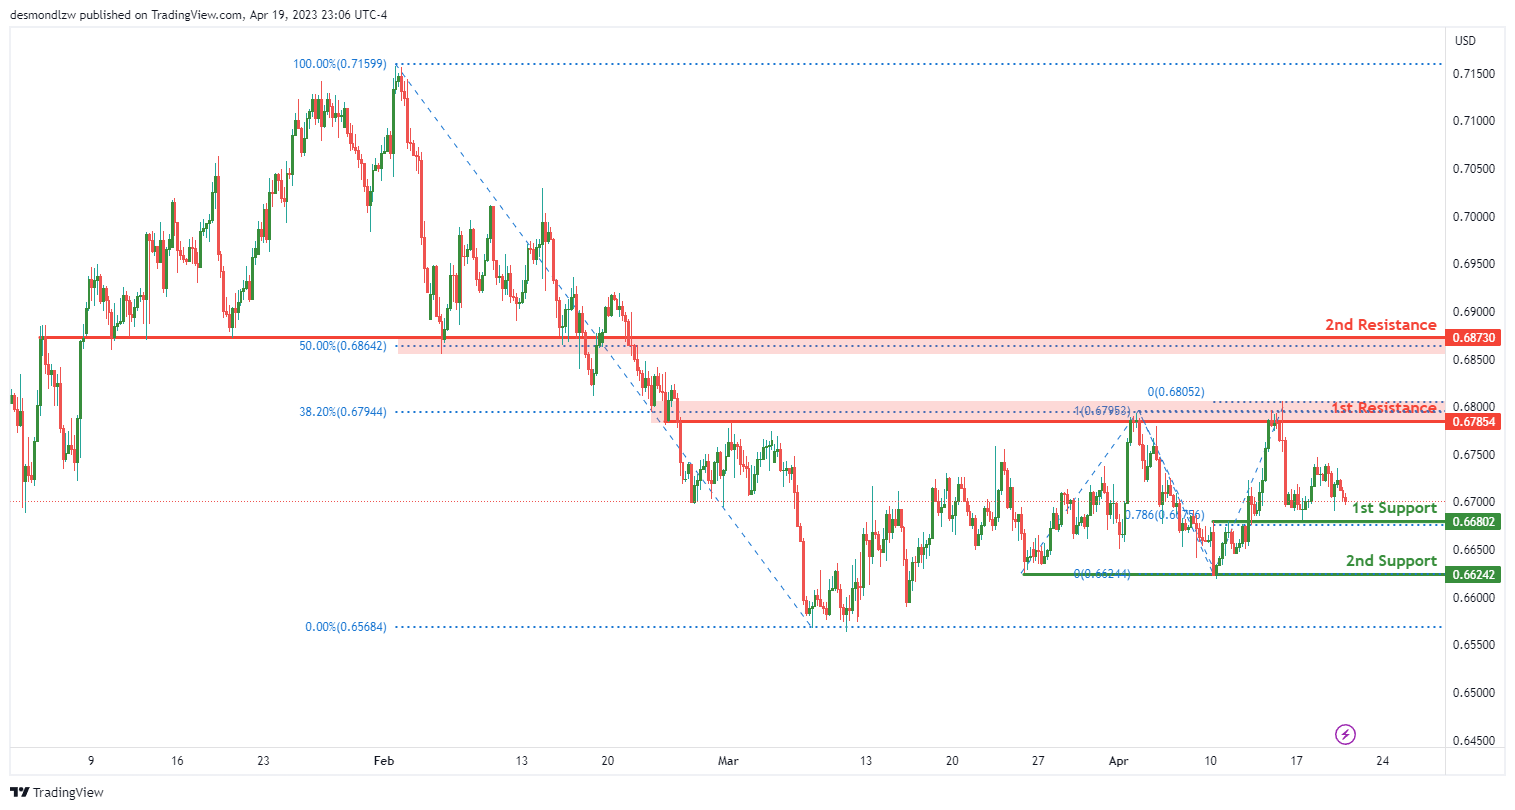
The AUD/USD chart, the overall momentum of the chart is bearish. There is a possibility of a bearish continuation towards the first support level, which is at 0.6680. This support level is a strong overlap support and coincides with the 78.60% Fibonacci projection. The second support level is at 0.6624, which is a multi-swing low support.
On the other hand, the first resistance level is at 0.6785, which is an overlap resistance and coincides with the 38.20% Fibonacci retracement level. The second resistance level is at 0.6873, which is a pullback resistance and coincides with the 50% Fibonacci retracement level.
It’s worth noting that the overall momentum of the chart is bearish, which suggests that the price may continue to move downwards. A break of the first support level could potentially trigger a strong bearish acceleration towards the second support level. However, if price were to break through the first resistance level instead, it could potentially rise towards the second resistance level
NZD/USD:
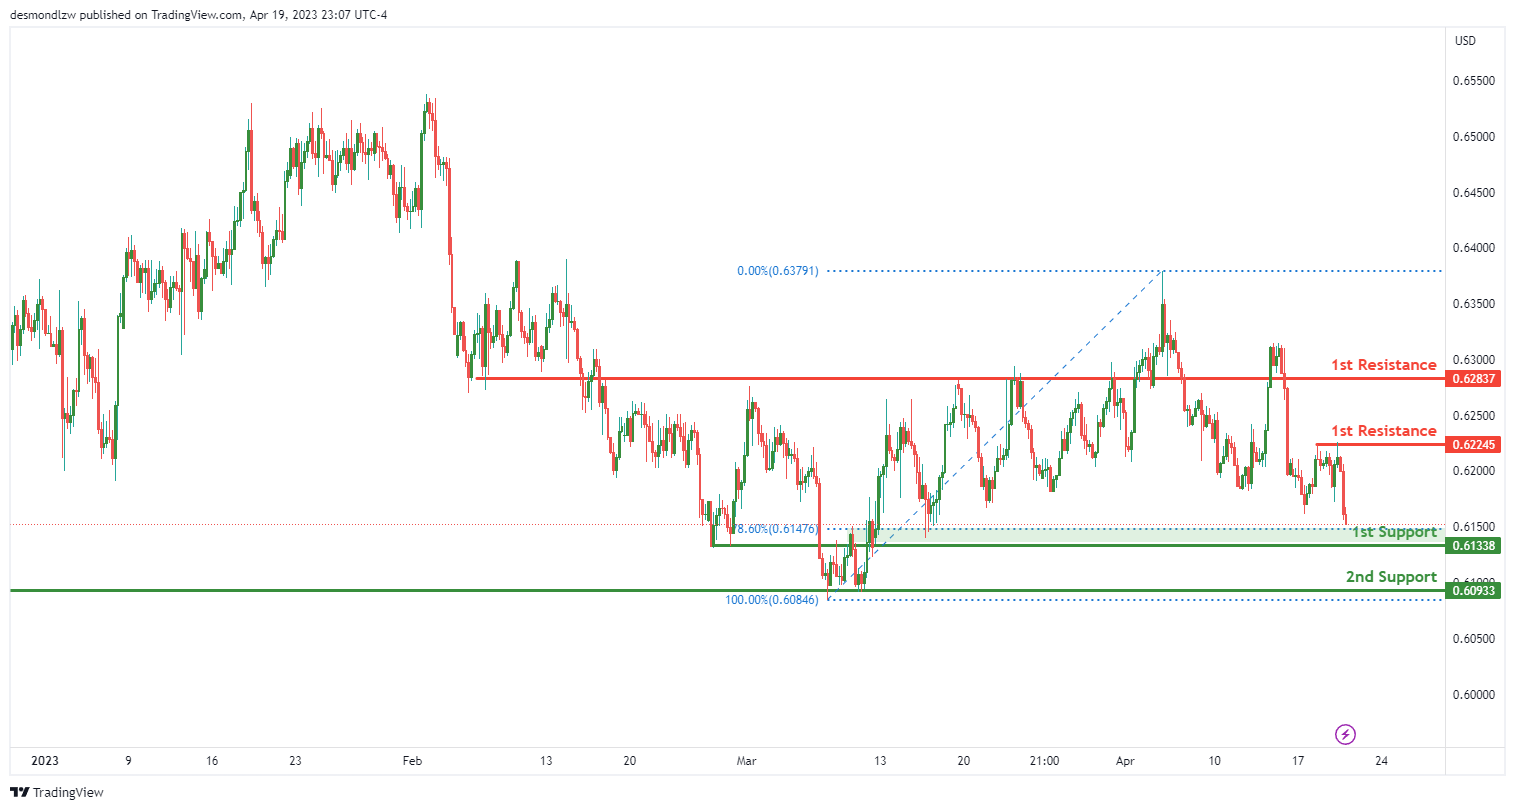
The NZD/USD chart is currently exhibiting bullish momentum overall. However, in the short term, there may be a potential drop towards the 1st support level at 0.6133, which is a strong overlap support and coincides with the 78.60% Fibonacci retracement level. If price bounces from this support, it could rise towards the 1st resistance level at 0.6224, which is a swing high resistance level.
If price manages to break above the 1st resistance level, it could potentially trigger a stronger bullish acceleration towards the 2nd resistance level at 0.6283, which is a pullback resistance level. On the other hand, if price fails to hold the 1st support level, the next support level it could drop to is the 2nd support level at 0.6093, which is a multi-swing low support level.
USD/CAD:
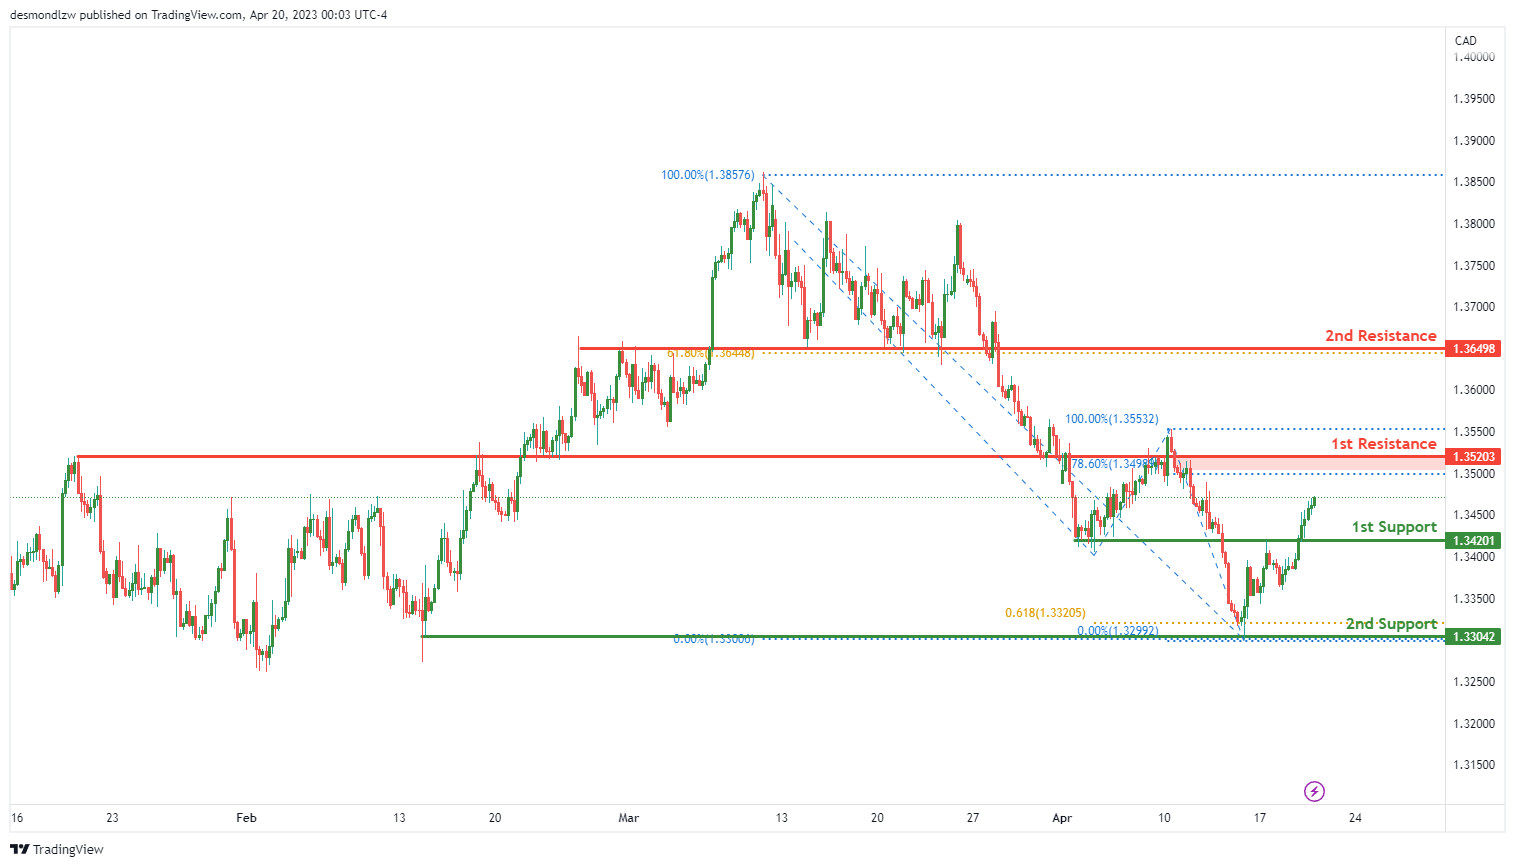
The USD/CAD chart is showing strong bullish momentum, with potential for further upside. Price is currently trading above a major descending trend line, which suggests that bullish momentum is on the cards.
If the momentum continues, there is a possibility that the price could potentially make a bullish continuation towards the first resistance level. The first support level is at 1.3420, which is a good overlap support level. It is also worth noting that this level lines up with a 23.6% Fibonacci retracement, which further strengthens its significance. Another support level is at 1.3304, which is a multi-swing low support level, coinciding with a 61.80% Fibonacci projection.
On the other hand, the first resistance level is at 1.3520, which is a pullback resistance. This level lines up with a 78.60% Fibonacci retracement, further adding to its strength. The second resistance level is at 1.3649, which is another pullback resistance, coinciding with a 61.80% Fibonacci retracement.
DJ30:
DJ30 chart analysis: Potential for short-term drop before a bounce towards resistance
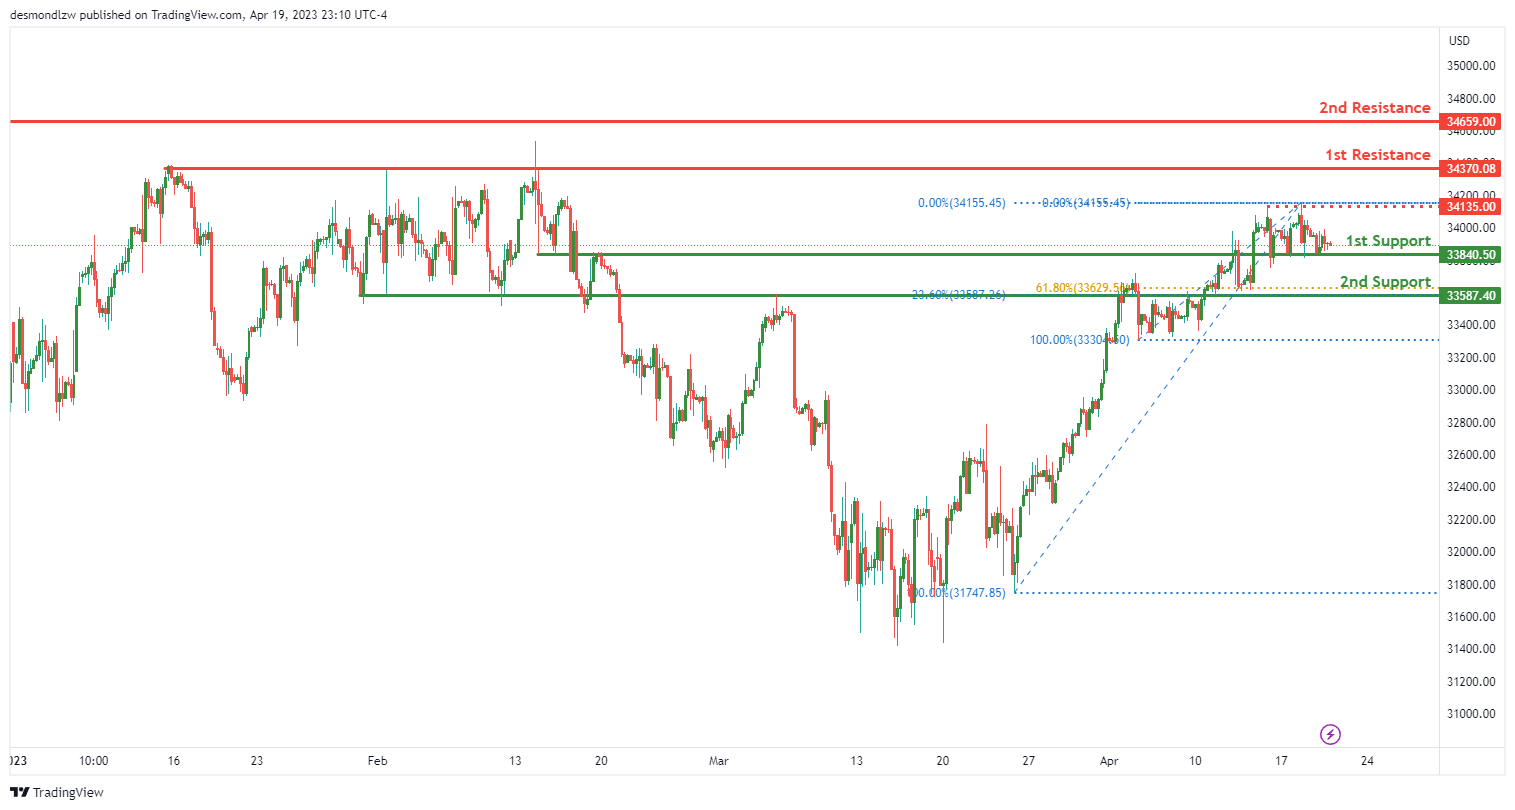
The overall momentum of the DJ30 chart is bullish, suggesting that prices might continue to rise. However, the short-term momentum seems bearish as the price could potentially drop to the 1st support before bouncing back towards resistance.
The 1st support is at 33840.50, which is a good overlap support level. Another support level is the 2nd support level at 33587.40, which is a multi-swing low support and lines up with the 61.80% Fibonacci retracement.
On the other hand, the 1st resistance level is at 34370.08, which is a multi-swing high resistance level. The 2nd resistance level is at 34659.00, which is a swing high resistance. An intermediate resistance level can be found at 34135.00, which is a multi-swing high resistance level.
It’s worth noting that the overall momentum is bullish, and if the short-term drop occurs and the price bounces from the support level, it could potentially rise towards the resistance levels. However, if the price were to break the 1st support, the next support level it could drop to is the 2nd support level down at 33587.40.
GER30:
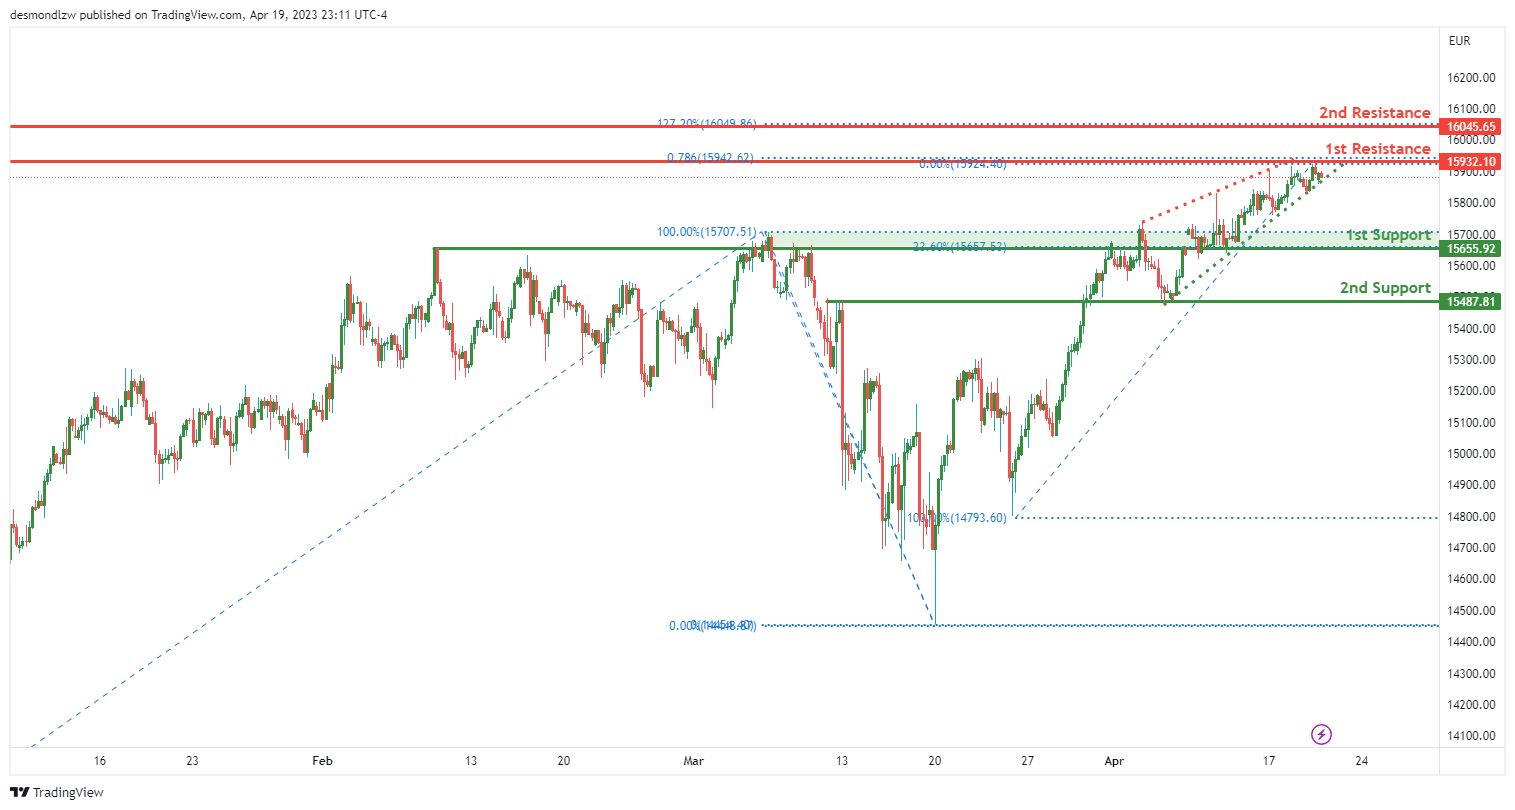
The overall momentum of GER30 is bearish, with the rising wedge pattern suggesting an imminent breakout to the downside. The potential move is a bearish reaction off the 1st resistance level, dropping towards the 1st support level.
The 1st support level at 15655.92 is an overlap support and lines up with a 23.60% Fibonacci retracement, making it a strong support level. If price were to break below this level, it could drop towards the 2nd support level at 15487.81, which is also an overlap support.
On the other hand, the 1st resistance level at 15932.10 is a multi-swing high resistance level, making it a strong resistance level. If price were to break above this level, it could potentially rise towards the 2nd resistance level at 16045.65, which is a swing high resistance and lines up with a 127.20% Fibonacci extension.
However, given the overall bearish momentum of the chart and the rising wedge pattern, a bearish continuation is more likely. Thus, a bearish reaction off the 1st resistance level is expected, with a drop towards the 1st support level.
BTC/USD:
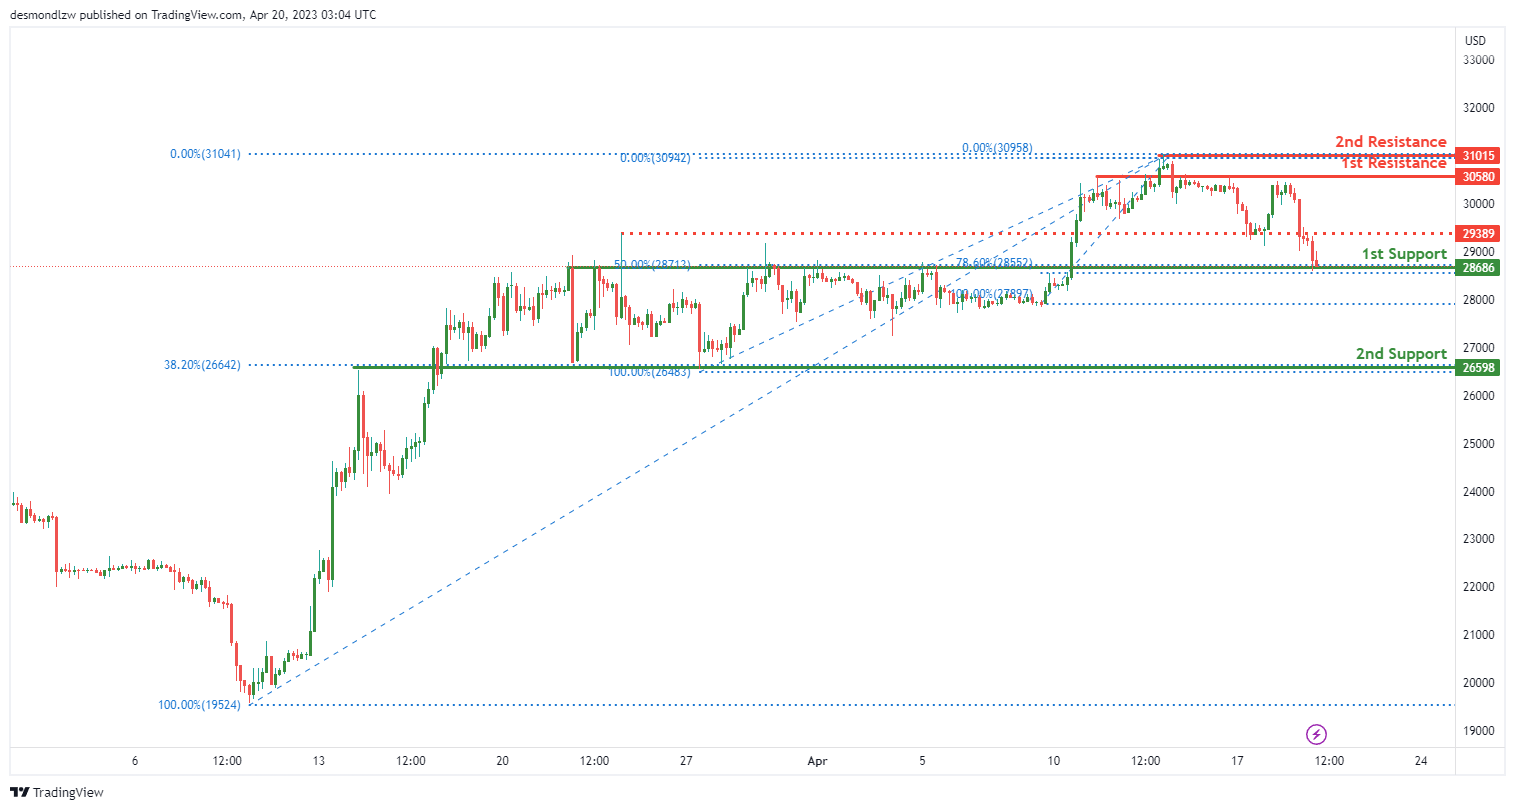
The BTC/USD chart is currently bullish, with prices potentially heading towards the first resistance level after a potential bounce off the first support level. The first support level at 28686 is a pullback support and is accompanied by a 50% Fibonacci retracement level, making it a strong support level. If prices bounce from this level, they could potentially rise towards the first resistance level at 30580, which is an overlap resistance.
The second support level at 26598 is another strong support level, as it is an overlap support accompanied by a 38.20% Fibonacci retracement level. However, if prices break below this level, they could drop towards the lower levels of support.
On the upside, the second resistance level at 31015 is a swing high resistance level and could prove to be a challenge for prices to break above. However, if prices manage to break above this level, they could potentially rise further.
In addition, there is an intermediate resistance level at 29389, which is also an overlap resistance level. If prices manage to break above this level, it could trigger a stronger bullish acceleration towards the first resistance level.
US500
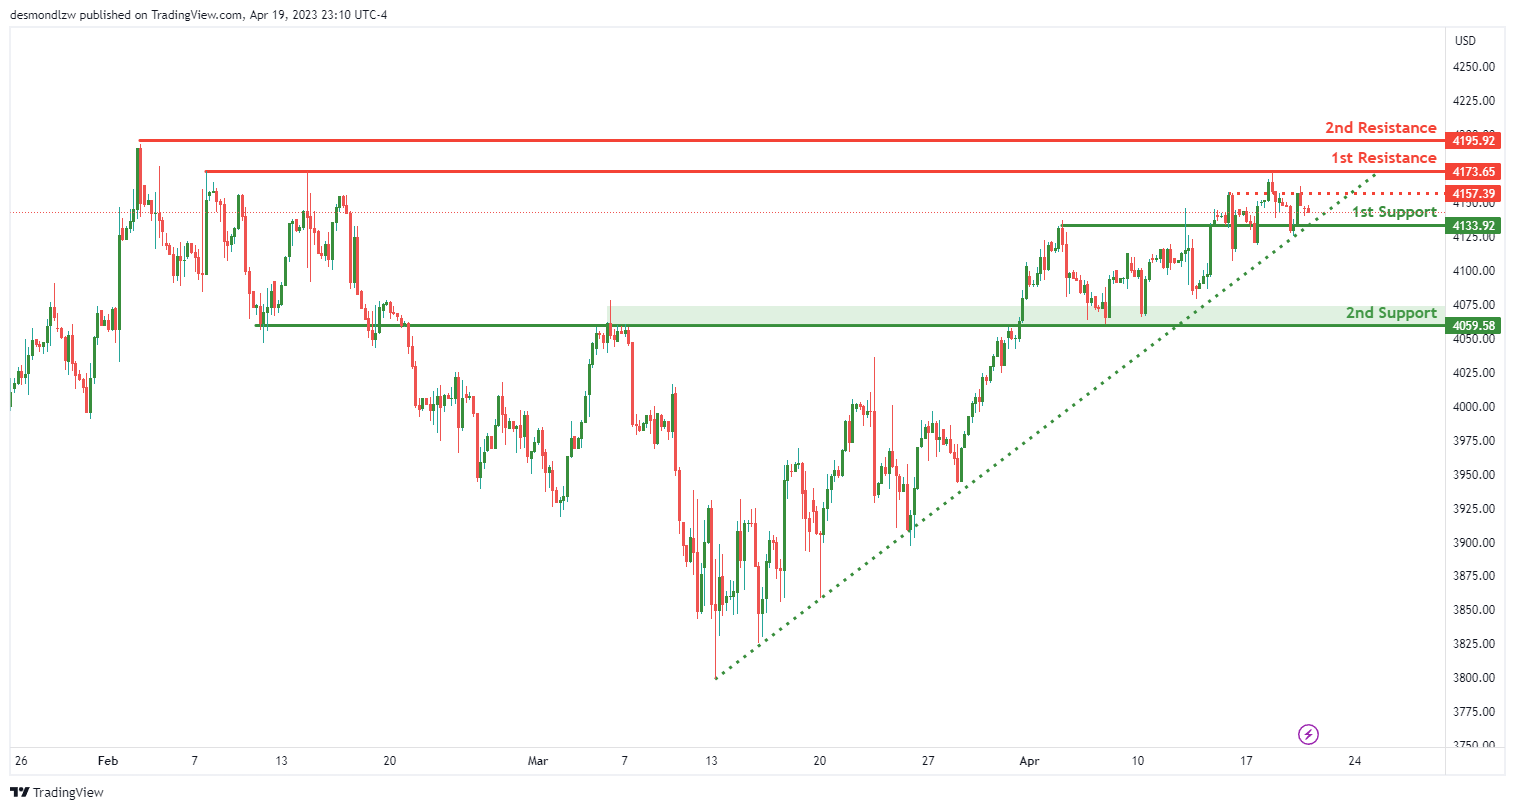
The US500 index is showing strong bullish momentum as it continues to trade above a major ascending trend line. This suggests that further gains could be on the horizon for the US stock market.
At present, the price is hovering around the 1st support level of 413.92. This is a good level for a bullish bounce as it is an overlap support level that provides a strong foundation for the index. Additionally, the 2nd support level at 4059.58 is also a good level to keep an eye on as it is an overlap support level.
If the price bounces from the 1st support level, it could head towards the 1st resistance level of 4173.65. This is a multi-swing high resistance level that will require significant bullish momentum to break. If the price breaks through this level, it could potentially continue to rise towards the 2nd resistance level of 4195.92, which is a swing high resistance level.
It’s worth noting that there is an intermediate resistance level at 4157.39, which is also an overlap resistance level. If the price is able to break through this level, it could indicate a strong bullish move towards the 1st resistance level.
ETH/USD:
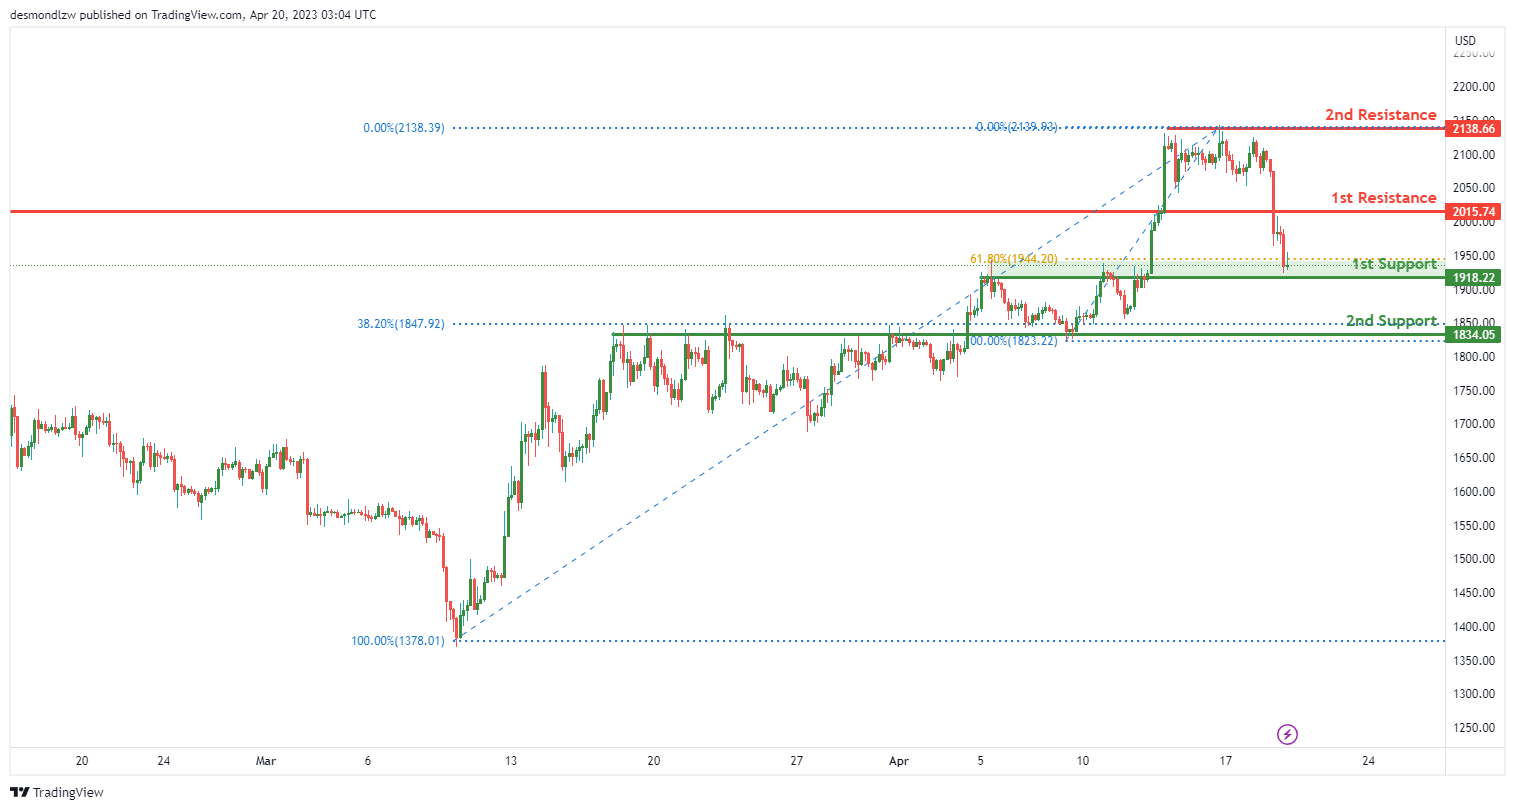
the ETH/USD chart shows an overall bullish momentum, which suggests that the price might continue to rise due to its bullish momentum. The potential price action could see a bullish bounce off the first support and head towards the first resistance.
The first support level for ETH/USD is at 1918.22, which is an overlap support and also coincides with the 61.80% Fibonacci retracement level. This support level has the potential to provide a strong buying opportunity for traders.
The second support level is at 1834.05, which is another overlap support and coincides with the 38.20% Fibonacci retracement level. This level is also important as it could provide a good buying opportunity for traders looking to enter the market.
On the upside, the first resistance level is at 2015.74, which is a pullback resistance level. This level could act as a temporary resistance, and if the price manages to break above it, it could continue to rise towards the second resistance level at 2138.66, which is a swing high resistance level.
WTI/USD:
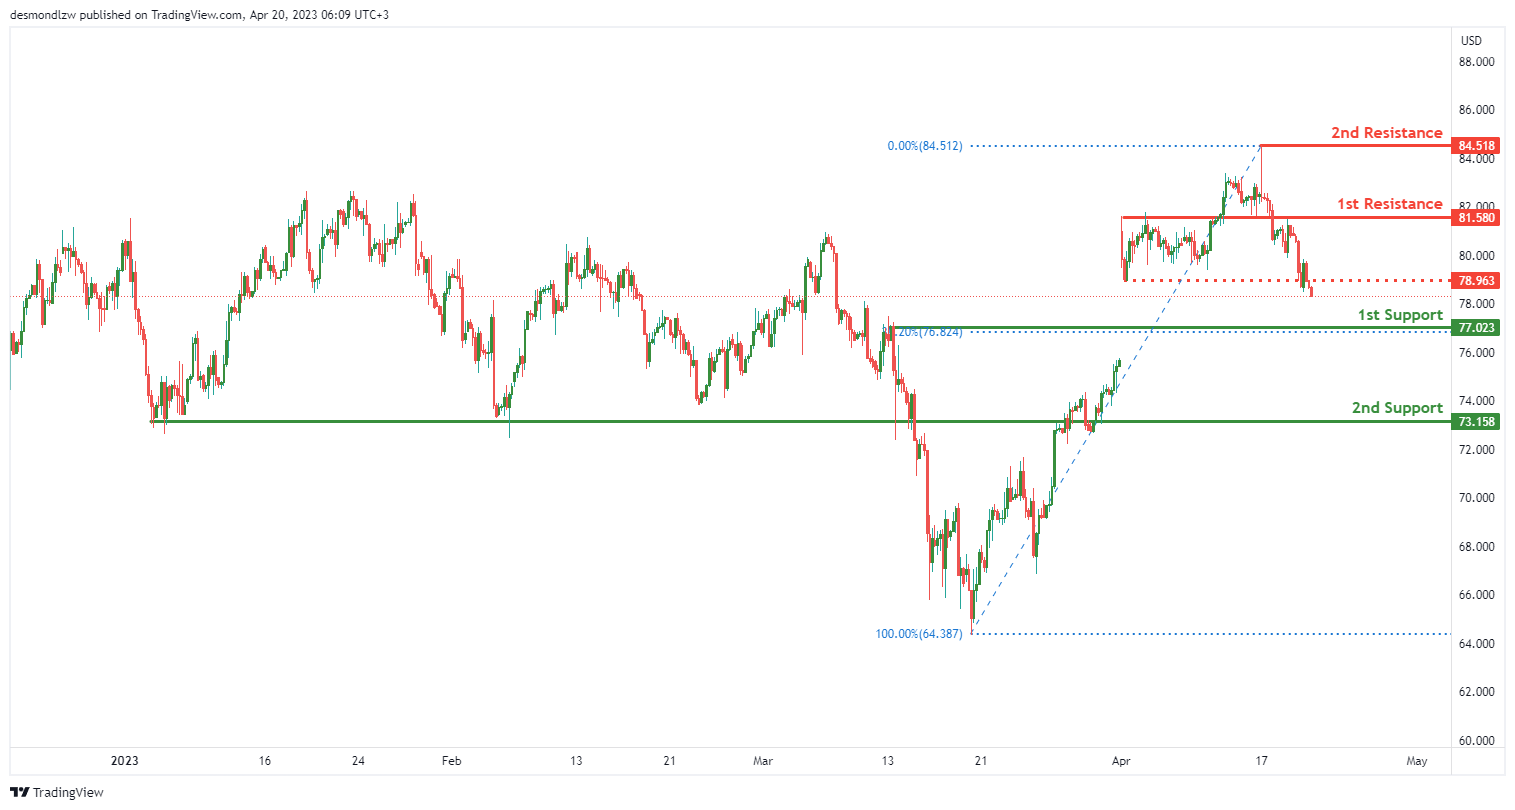
The overall momentum of WTI crude oil is bearish, and price could potentially make a bearish continuation towards the first support level. The swing low support at 77.02 is the first support level, followed by the overlap support at 73.15.
On the upside, the first resistance level is at 81.58, which is an overlap resistance. The swing high resistance is at 84.51, which is the second resistance level. Additionally, there is an intermediate resistance at 78.96, which is a pullback resistance.
The 38.20% Fibonacci retracement level at 77.02 is a good support level. If price breaks below this level, it could drop to the next support level at 73.15, which is also an overlap support.
On the upside, the first resistance level at 81.58 is a good level for traders to watch. If price manages to break above this level, it could rise to the second resistance level at 84.51, which is a swing high resistance.
XAU/USD (GOLD):
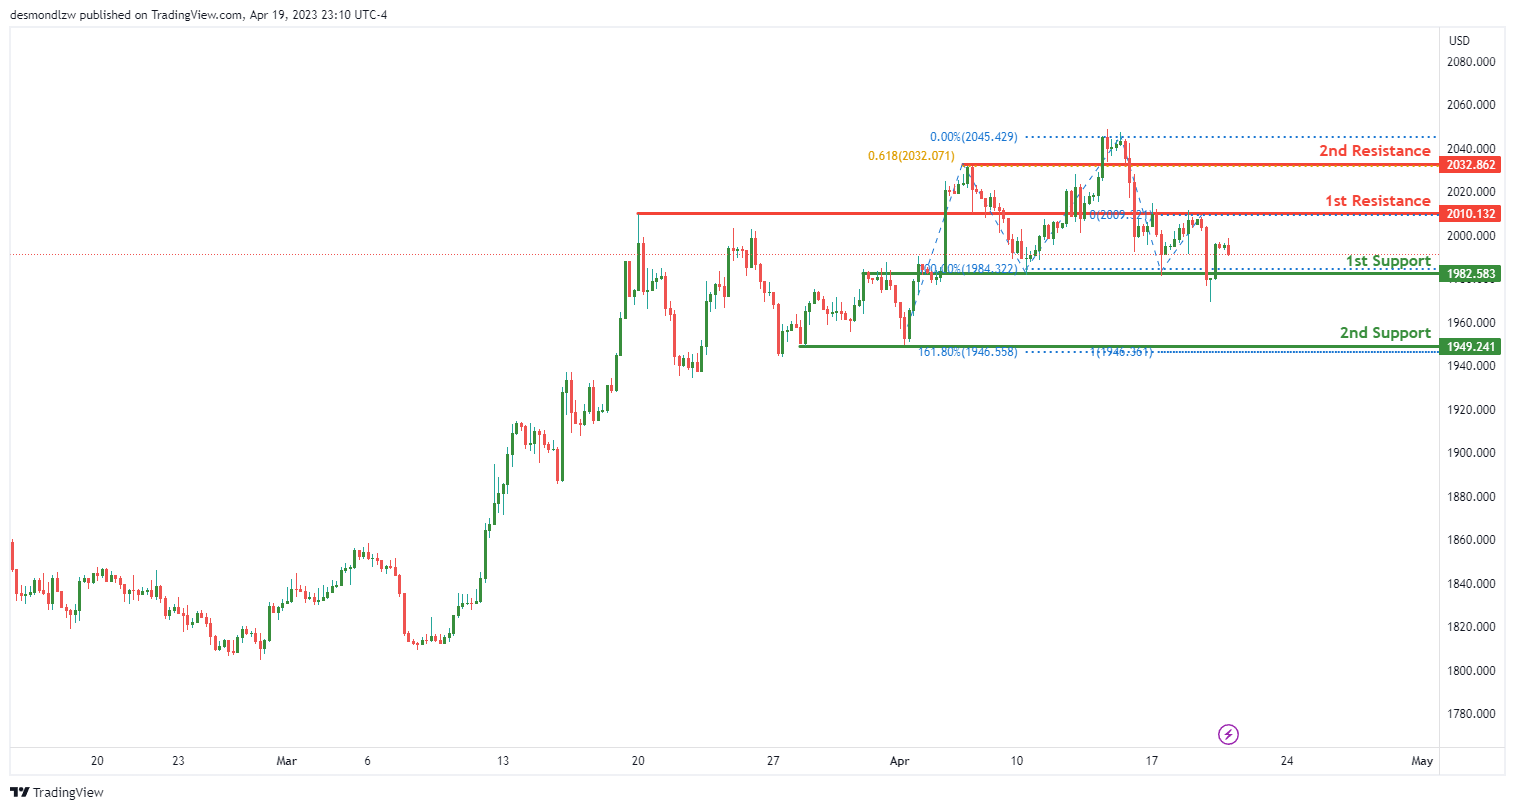
Gold (XAU/USD) continues to show a bearish momentum on the chart. Currently, the price is expected to break below the 1st support level and drop towards the 2nd support level. The 1st support level is at 1982.58, which is a good level because it is an overlap support. The 2nd support level is at 1949.24, which is a swing low support and a 161.80% Fibonacci extension level.
On the resistance side, the 1st resistance level is at 2010.13, which is an overlap resistance level. The 2nd resistance level is at 2032.86, which is a pullback resistance level and a 61.80% Fibonacci projection level.
Overall, the momentum of the chart is still bearish, and the price is expected to drop towards the 2nd support level. If the price manages to break above the 1st resistance level, it could signal a potential shift in momentum towards the bullish side.
AUD/USD Daily Report
Daily Pivots: (S1) 0.6689; (P) 0.6715; (R1) 0.6740; More...
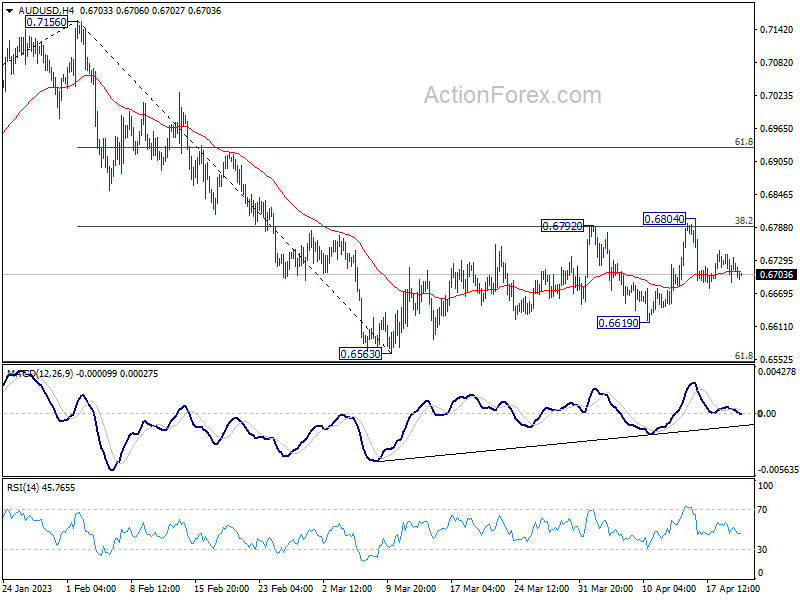
AUD/USD dips mildly today but stays in range of 0.6619/6804. Intraday bias remains neutral at this point. On the downside, break of 0.6619 will indicate that decline from 0.7156 is resuming through 0.6563 low. Nevertheless, sustained break of 0.6804 will bring stronger rally back to 61.8% retracement of 0.7156 to 0.6563 at 0.6929.
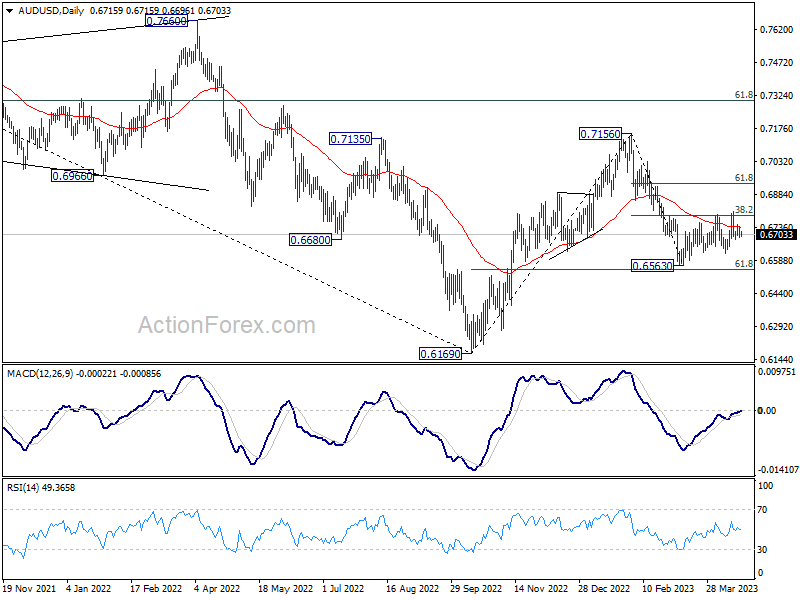
In the bigger picture, as long as 61.8% retracement of 0.6169 to 0.7156 at 0.6546 holds, the decline from 0.7156 is seen as a correction to rally from 0.6169 (2022 low) only. Another rise should still be seen through 0.7156 at a later stage. However, sustained break of 0.6546 will raise the chance of long term down trend resumption through 0.6169 low.
NZ Dollar Weakens on Lower Inflation Data, Dragging Down Aussie
New Zealand Dollar dropped broadly in Asian session today after a lower-than-expected consumer inflation reading increased speculation that the next RBNZ rate hike may be the last in the current cycle. This development also pulled Australian Dollar down, making them the day's worst performers so far. In contrast, Swiss Franc and Euro are trading higher, followed by US Dollar and Japanese Yen, suggesting that the markets are not in a risk-on mood. British Pound and Canadian Dollar are currently mixed.
For the week, the Pound is the strongest currency, bolstered by this week's employment and inflation data, which likely paves the way for another BoE rate hike in May and possibly more afterwards. Dollar is the second strongest, supported by a rebound in treasury yields. Meanwhile, New Zealand Dollar is the weakest, followed by Canadian Dollar and Japanese Yen. Australian Dollar remains resilient, while the Euro's direction is unclear.
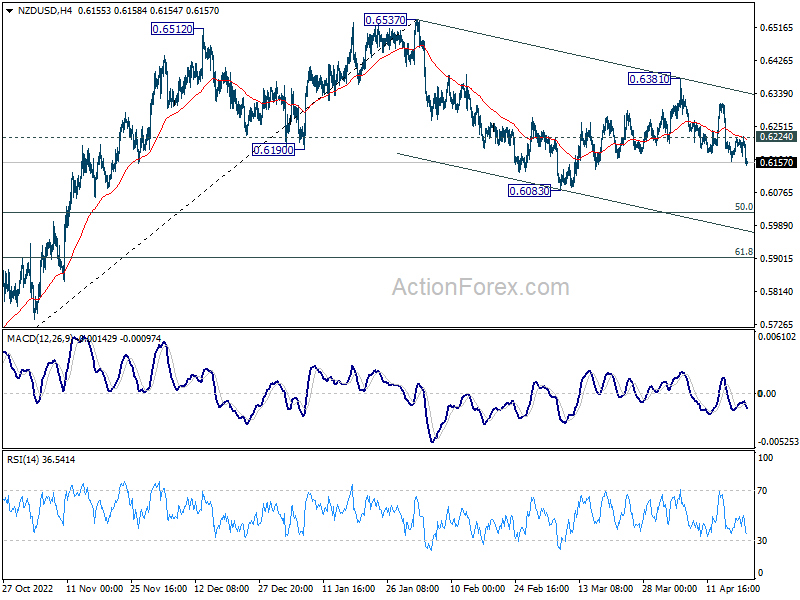
Technically, NZD/USD has resumed its decline from 0.6381 following the release of New Zealand's CPI data. Intraday bias is back on the downside, targeting 0.6083 support level and below. However, without strong downward acceleration, significant support could emerge around 50% retracement of 0.5511 to 0.6537 at 0.6024, potentially leading to a rebound and completing the overall corrective pattern from the 0.6537 high.
In Asia, at the time of writing, Nikkei is up 0.28%. Hong Kong HSI is up 0.01%. China Shanghai SSE is down -0.52%. Singapore Strait Times is down -0.49%. Japan 10-year JGB yield is down -0.0060 at 0.472. Overnight, DOW dropped -0.23%. S&P 500 dropped -0.01%. NASDAQ rose 0.03%. 10-year yield rose 0.030 to 3.602.
ECB Schnabel emphasizes data-driven approach amid banking sector disturbances
European Central Bank (ECB) Executive Board member Isabel Schnabel emphasized the importance of a data-driven approach to policy decisions in light of recent disturbances in the banking sector. She stated yesterday, "I can't tell you what we'll decide at the next meeting, and especially at the following meetings," adding that the situation has become "even more complex."
Schnabel noted the significance of monitoring the potential impact of banking sector uncertainty on lending, saying, "It's even more important that we look at all the data we'll get. It's important whether the uncertainty in the banking sector will have an additional impact on lending."
When discussing the ECB's future plans for its balance sheet, Schnabel admitted that the endpoint remains uncertain and is currently under discussion. She emphasized the need to manage the balance sheet in a way that markets can digest during these turbulent times and expressed satisfaction with the current approach, stating, "So far, it's worked extraordinarily well."
Fed Williams sees continuing trend of slowing inflation
New York Fed President John Williams emphasized the need to utilize monetary policy tools to achieve price stability during a speech at the Money Marketeers of New York University. He expressed confidence in attaining a sufficiently restrictive stance to bring inflation down to Fed's 2% longer-run goal
Williams noted that "the most recent data indicate that this trend of slowing inflation is continuing." He expects PCE core inflation to ease to 3.25% this year and reaching the 2% target within the next two years. He also commented on the labor market, calling it "very tight" but showing some signs of cooling. Williams expects the unemployment rate to rise to between 4% and 4.5% over the next year, with growth moderating this year before rebounding next year.
Additionally, Williams addressed the recent major bank collapse in the US, stating that the banking system remains sound and resilient. However, he anticipates that the collapse will result in tighter credit conditions for households and businesses, which could impact spending. Williams highlighted the importance of closely monitoring credit conditions and their potential effects on the economy.
Fed's Goolsbee discusses May FOMC Prospects, robust job market, and lingering inflation concerns
Chicago Fed President Austan Goolsbee discussed the upcoming May FOMC meeting, the strength of the job market, and persistent inflation in an interview. Goolsbee cautioned against reading too much into his stance on interest rates, stating, "We still got a couple of weeks before the actual meeting, so if anybody imputed some specific basis points of what I was for, that'd be inaccurate."
Goolsbee acknowledged the strong job market as the most robust part of the economy, with "unprecedented numbers," while noting that inflation remains a concern. He said, "Inflation — there's been some improvement, but in a way that's the worst part of the economy," adding that it has been "more persistent than we wanted."
As for the potential impact of the recent failure of two US banks on the economy, Goolsbee said it is essential to monitor the extent of the slowdown. He explained, "How much squeezing is going to be coming from the bank side I think is going to matter for whether this economy is going to slow down." Goolsbee emphasized that the intensity of the anticipated growth slowdown in the second half of the year would depend significantly on the financial sector.
New Zealand CPI slows in to 6.7% Q1, RBNZ may conclude rate hike cycle soon
In Q1, New Zealand CPI growth slowed down from prior quarter's 7.2% yoy, registering a 6.7% yoy increase, falling short of the expected 7.0% yoy. The largest contributor to the annual inflation rate was the food sector, followed by housing and household utilities.
On a quarterly basis, CPI rose by 1.2% qoq in Q1, below the anticipated 1.5% qoq increase, marking the lowest result in two years. Vegetables and fruit were the primary drivers of food prices, rising by 8.6% and 11%, respectively.
These figures came in lower than RBNZ's forecast of a 1.8% qoq and 7.3% yoy inflation. Despite the slowdown in inflation, another 25bps rate hike is still anticipated in May due to the persistently high inflation levels. However, it appears increasingly likely that the upcoming rate hike will be the last in the current cycle.
Australia NAB quarter business conditions resilient, but confidence clearly negative
Australia NAB Quarterly Business Confidence dropped from -1 to -4 in Q1. Current Business Conditions fell from 20 to 16. Business Conditions for the next three months decreased from 22 to 19. But Business Conditions for the next 12 months rose from 18 to 20.
"Consistent with our monthly business survey, today's release confirms business conditions remained resilient through the first quarter of 2023 at levels well above average," said NAB Chief Economist Alan Oster. "This strength remains broad based and leading indicators are also holding up, although business confidence is now clearly negative."
Japan sees 25th consecutive month of export growth, record trade deficit in fiscal 2022
In March, Japan's exports rose 4.3% yoy to JPY 8824B, above expectation of 2.6% yoy. This marks the 25th consecutive month of growth, primarily driven by auto shipments to the United States.
By region, exports to the US increased by 9.4% yoy in March, slowing down from prior month's 14.9% yoy growth. On the other hand, exports to China, Japan's largest trading partner, declined by -7.7% yoy marking the fourth consecutive month of decline.
Imports rose 7.3% yoy to JPY 9579B, below expectation of 11.4% yoy. Consequently, Japan registered a trade deficit of JPY -755 billion.
In fiscal 2022 ended March, Japan recorded a record trade deficit of JPY -21.73T, surpassing prior record of JPY -13.76T registered in fiscal 2013. Imports rose 32.2% to JPY 120.95T while exports rose 15.5% to JPY 99.23T.
Looking ahead
Germany PPI and ECB meeting accounts are the main features. Later in the day, US jobless claims, existing home sales and Philly Fed survey will be released.
AUD/USD Daily Report
Daily Pivots: (S1) 0.6689; (P) 0.6715; (R1) 0.6740; More...
AUD/USD dips mildly today but stays in range of 0.6619/6804. Intraday bias remains neutral at this point. On the downside, break of 0.6619 will indicate that decline from 0.7156 is resuming through 0.6563 low. Nevertheless, sustained break of 0.6804 will bring stronger rally back to 61.8% retracement of 0.7156 to 0.6563 at 0.6929.
In the bigger picture, as long as 61.8% retracement of 0.6169 to 0.7156 at 0.6546 holds, the decline from 0.7156 is seen as a correction to rally from 0.6169 (2022 low) only. Another rise should still be seen through 0.7156 at a later stage. However, sustained break of 0.6546 will raise the chance of long term down trend resumption through 0.6169 low.
Economic Indicators Update
| GMT | Ccy | Events | Actual | Forecast | Previous | Revised |
|---|---|---|---|---|---|---|
| 22:45 | NZD | CPI Q/Q Q1 | 1.20% | 1.50% | 1.40% | |
| 22:45 | NZD | CPI Y/Y Q1 | 6.70% | 7.00% | 7.20% | |
| 23:50 | JPY | Trade Balance (JPY) Mar | -1.21T | -1.78T | -1.19T | -1.25T |
| 01:30 | AUD | NAB Business Confidence Q1 | -4 | -1 | ||
| 04:30 | JPY | Tertiary Industry Index M/M Feb | 0.70% | 0.40% | 0.90% | 0.70% |
| 06:00 | EUR | Germany PPI M/M Mar | -0.50% | -0.30% | ||
| 06:00 | EUR | Germany PPI Y/Y Mar | 9.80% | 15.80% | ||
| 11:30 | EUR | ECB Monetary Policy Meeting Accounts | ||||
| 12:30 | USD | Initial Jobless Claims (Apr 14) | 238K | 239K | ||
| 12:30 | USD | Philadelphia Fed Manufacturing Survey Apr | -19.1 | -23.2 | ||
| 14:00 | USD | Existing Home Sales Mar | 4.50M | 4.58M | ||
| 14:00 | EUR | Eurozone Consumer Confidence Apr P | -18 | -19 | ||
| 14:30 | USD | Natural Gas Storage | 69B | 25B |
Japan sees 25th consecutive month of export growth, record trade deficit in fiscal 2022
In March, Japan's exports rose 4.3% yoy to JPY 8824B, above expectation of 2.6% yoy. This marks the 25th consecutive month of growth, primarily driven by auto shipments to the United States.
By region, exports to the US increased by 9.4% yoy in March, slowing down from prior month's 14.9% yoy growth. On the other hand, exports to China, Japan's largest trading partner, declined by -7.7% yoy marking the fourth consecutive month of decline.
Imports rose 7.3% yoy to JPY 9579B, below expectation of 11.4% yoy. Consequently, Japan registered a trade deficit of JPY -755 billion.
In fiscal 2022 ended March, Japan recorded a record trade deficit of JPY -21.73T, surpassing prior record of JPY -13.76T registered in fiscal 2013. Imports rose 32.2% to JPY 120.95T while exports rose 15.5% to JPY 99.23T.
Australia NAB quarter business conditions resilient, but confidence clearly negative
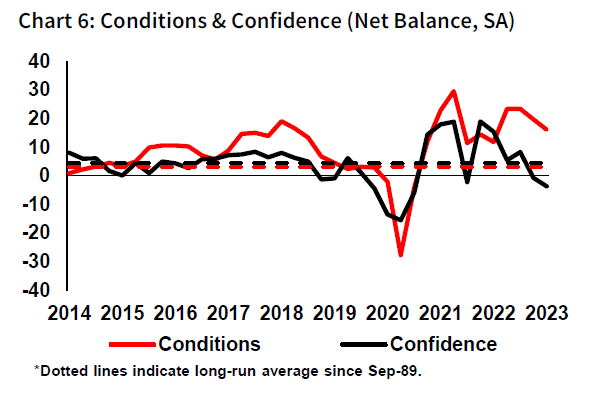
Australia NAB Quarterly Business Confidence dropped from -1 to -4 in Q1. Current Business Conditions fell from 20 to 16. Business Conditions for the next three months decreased from 22 to 19. But Business Conditions for the next 12 months rose from 18 to 20.
"Consistent with our monthly business survey, today's release confirms business conditions remained resilient through the first quarter of 2023 at levels well above average," said NAB Chief Economist Alan Oster. "This strength remains broad based and leading indicators are also holding up, although business confidence is now clearly negative."
New Zealand CPI slows in to 6.7% Q1, RBNZ may conclude rate hike cycle soon
In Q1, New Zealand CPI growth slowed down from prior quarter's 7.2% yoy, registering a 6.7% yoy increase, falling short of the expected 7.0% yoy. The largest contributor to the annual inflation rate was the food sector, followed by housing and household utilities.
On a quarterly basis, CPI rose by 1.2% qoq in Q1, below the anticipated 1.5% qoq increase, marking the lowest result in two years. Vegetables and fruit were the primary drivers of food prices, rising by 8.6% and 11%, respectively.
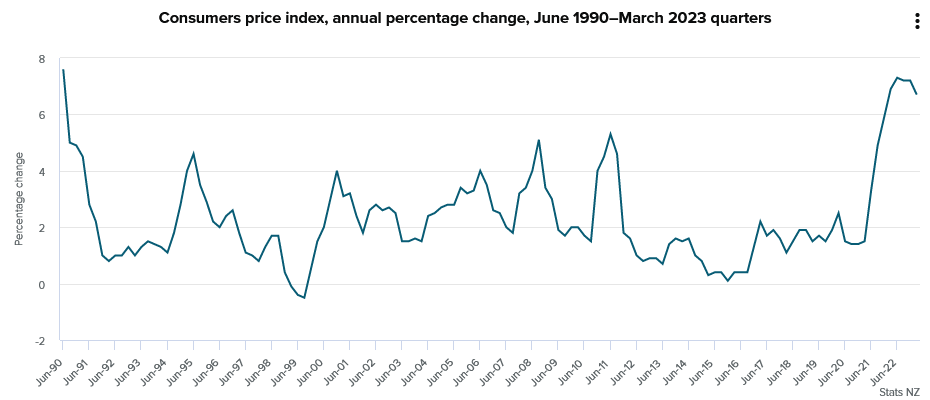
These figures came in lower than RBNZ's forecast of a 1.8% qoq and 7.3% yoy inflation. Despite the slowdown in inflation, another 25bps rate hike is still anticipated in May due to the persistently high inflation levels. However, it appears increasingly likely that the upcoming rate hike will be the last in the current cycle.
Fed Williams sees continuing trend of slowing inflation
New York Fed President John Williams emphasized the need to utilize monetary policy tools to achieve price stability during a speech at the Money Marketeers of New York University. He expressed confidence in attaining a sufficiently restrictive stance to bring inflation down to Fed's 2% longer-run goal
Williams noted that "the most recent data indicate that this trend of slowing inflation is continuing." He expects PCE core inflation to ease to 3.25% this year and reaching the 2% target within the next two years. He also commented on the labor market, calling it "very tight" but showing some signs of cooling. Williams expects the unemployment rate to rise to between 4% and 4.5% over the next year, with growth moderating this year before rebounding next year.
Additionally, Williams addressed the recent major bank collapse in the US, stating that the banking system remains sound and resilient. However, he anticipates that the collapse will result in tighter credit conditions for households and businesses, which could impact spending. Williams highlighted the importance of closely monitoring credit conditions and their potential effects on the economy.