Sample Category Title
ETHUSD Pulls Back Aggressively from 11-month Peak
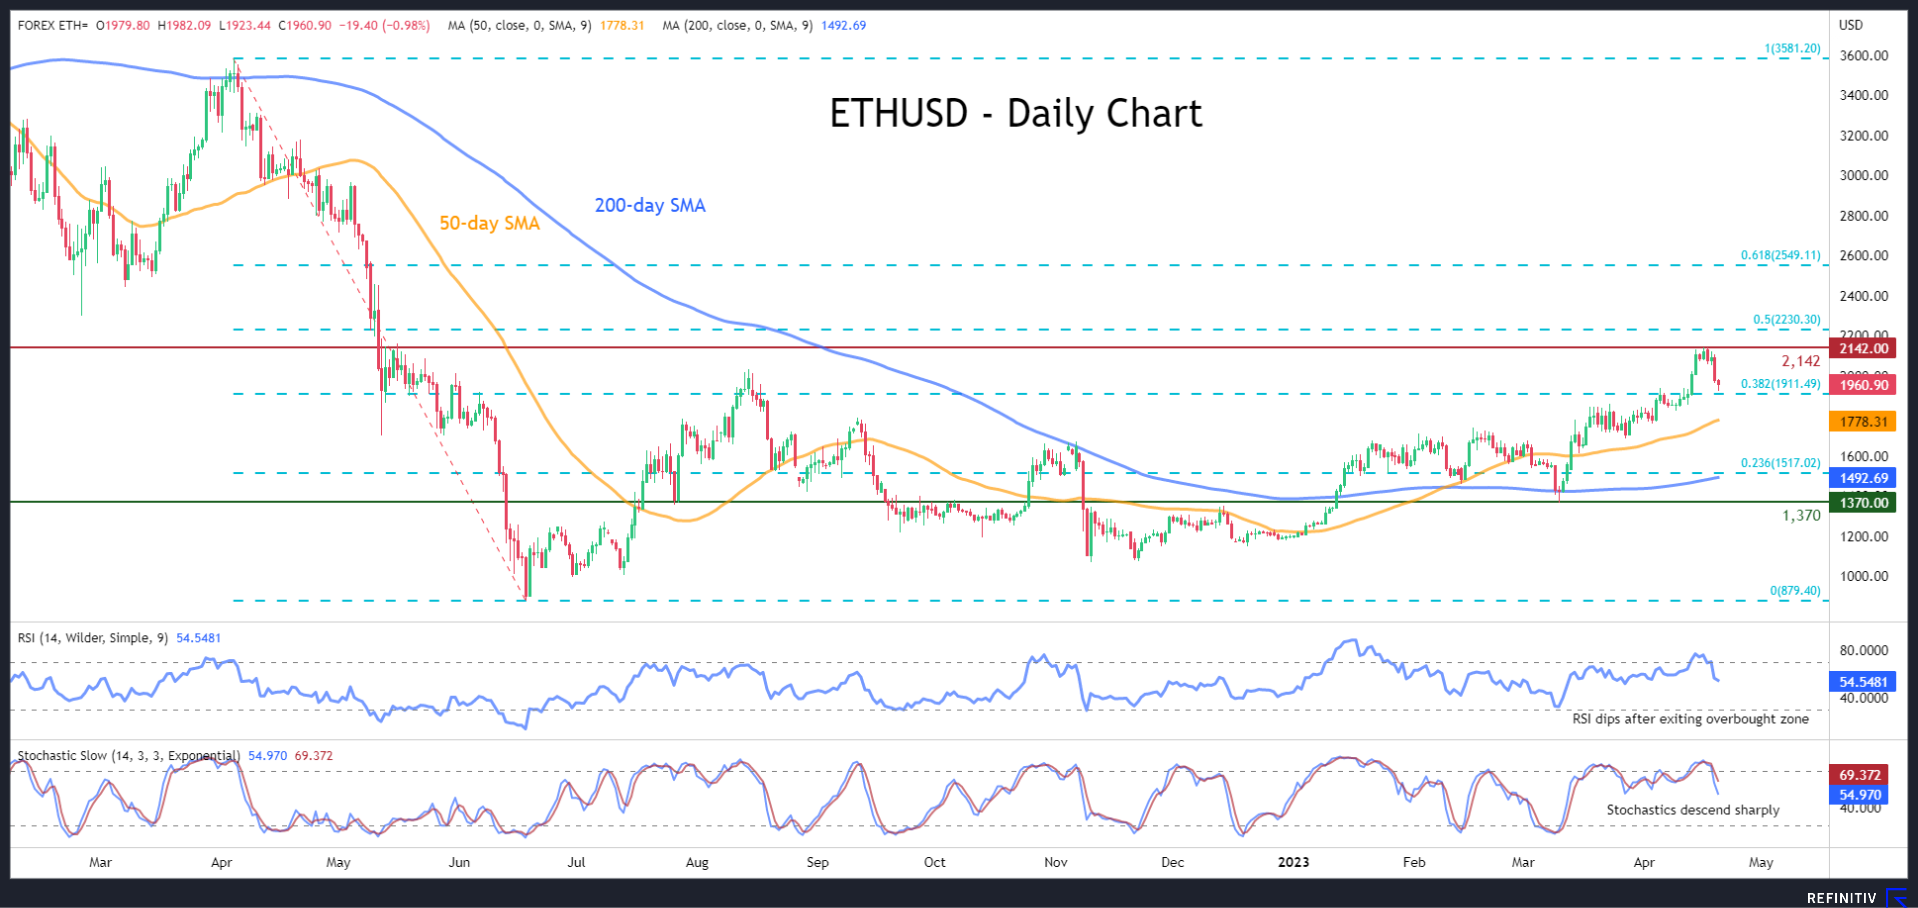
ETHUSD (Ethereum) had been trending higher since the beginning of the year, peaking at a fresh 11-month high of 2,142 after the successful completion of the Shanghai update. However, the digital coin experienced a significant downside correction in the past couple of sessions after reaching extremely overbought conditions.
The momentum indicators currently suggest that the recent advance was indeed overstretched as both the RSI and the stochastic oscillator are coming down from their overbought territories. However, they remain above their 50-neutral marks, hinting that bulls have not totally surrendered yet.
Should Ethereum extend its retreat, the bears could aim for 1,911, which is the 38.2% Fibonacci retracement of the 3,581-879.40 downleg. If that barricade fails, the spotlight may turn to the 23.6% Fibo of 1,517, which lies very close to the 200-day simple moving average (SMA). Even lower, the March bottom of 1,370 may provide downside protection.
On the flipside, if buyers re-emerge and push the price above the 2,000 psychological mark, the recent 11-month high of 2,142 might act as initial resistance. Surpassing that zone, the price could challenge the 50.0% Fibo of 2,230. Further advances could then cease at the 61.8% Fibo of 2,549.
Overall, ETHUSD experienced a pullback after its remarkable surge came to a halt at an 11-month high, but its bullish technical structure remains intact. For the sentiment to turn bearish, the price needs to drop beneath its 200-day SMA, currently at 1,492.
XAU/USD: The Final Leg of the Bullish Zigzag Gas Started
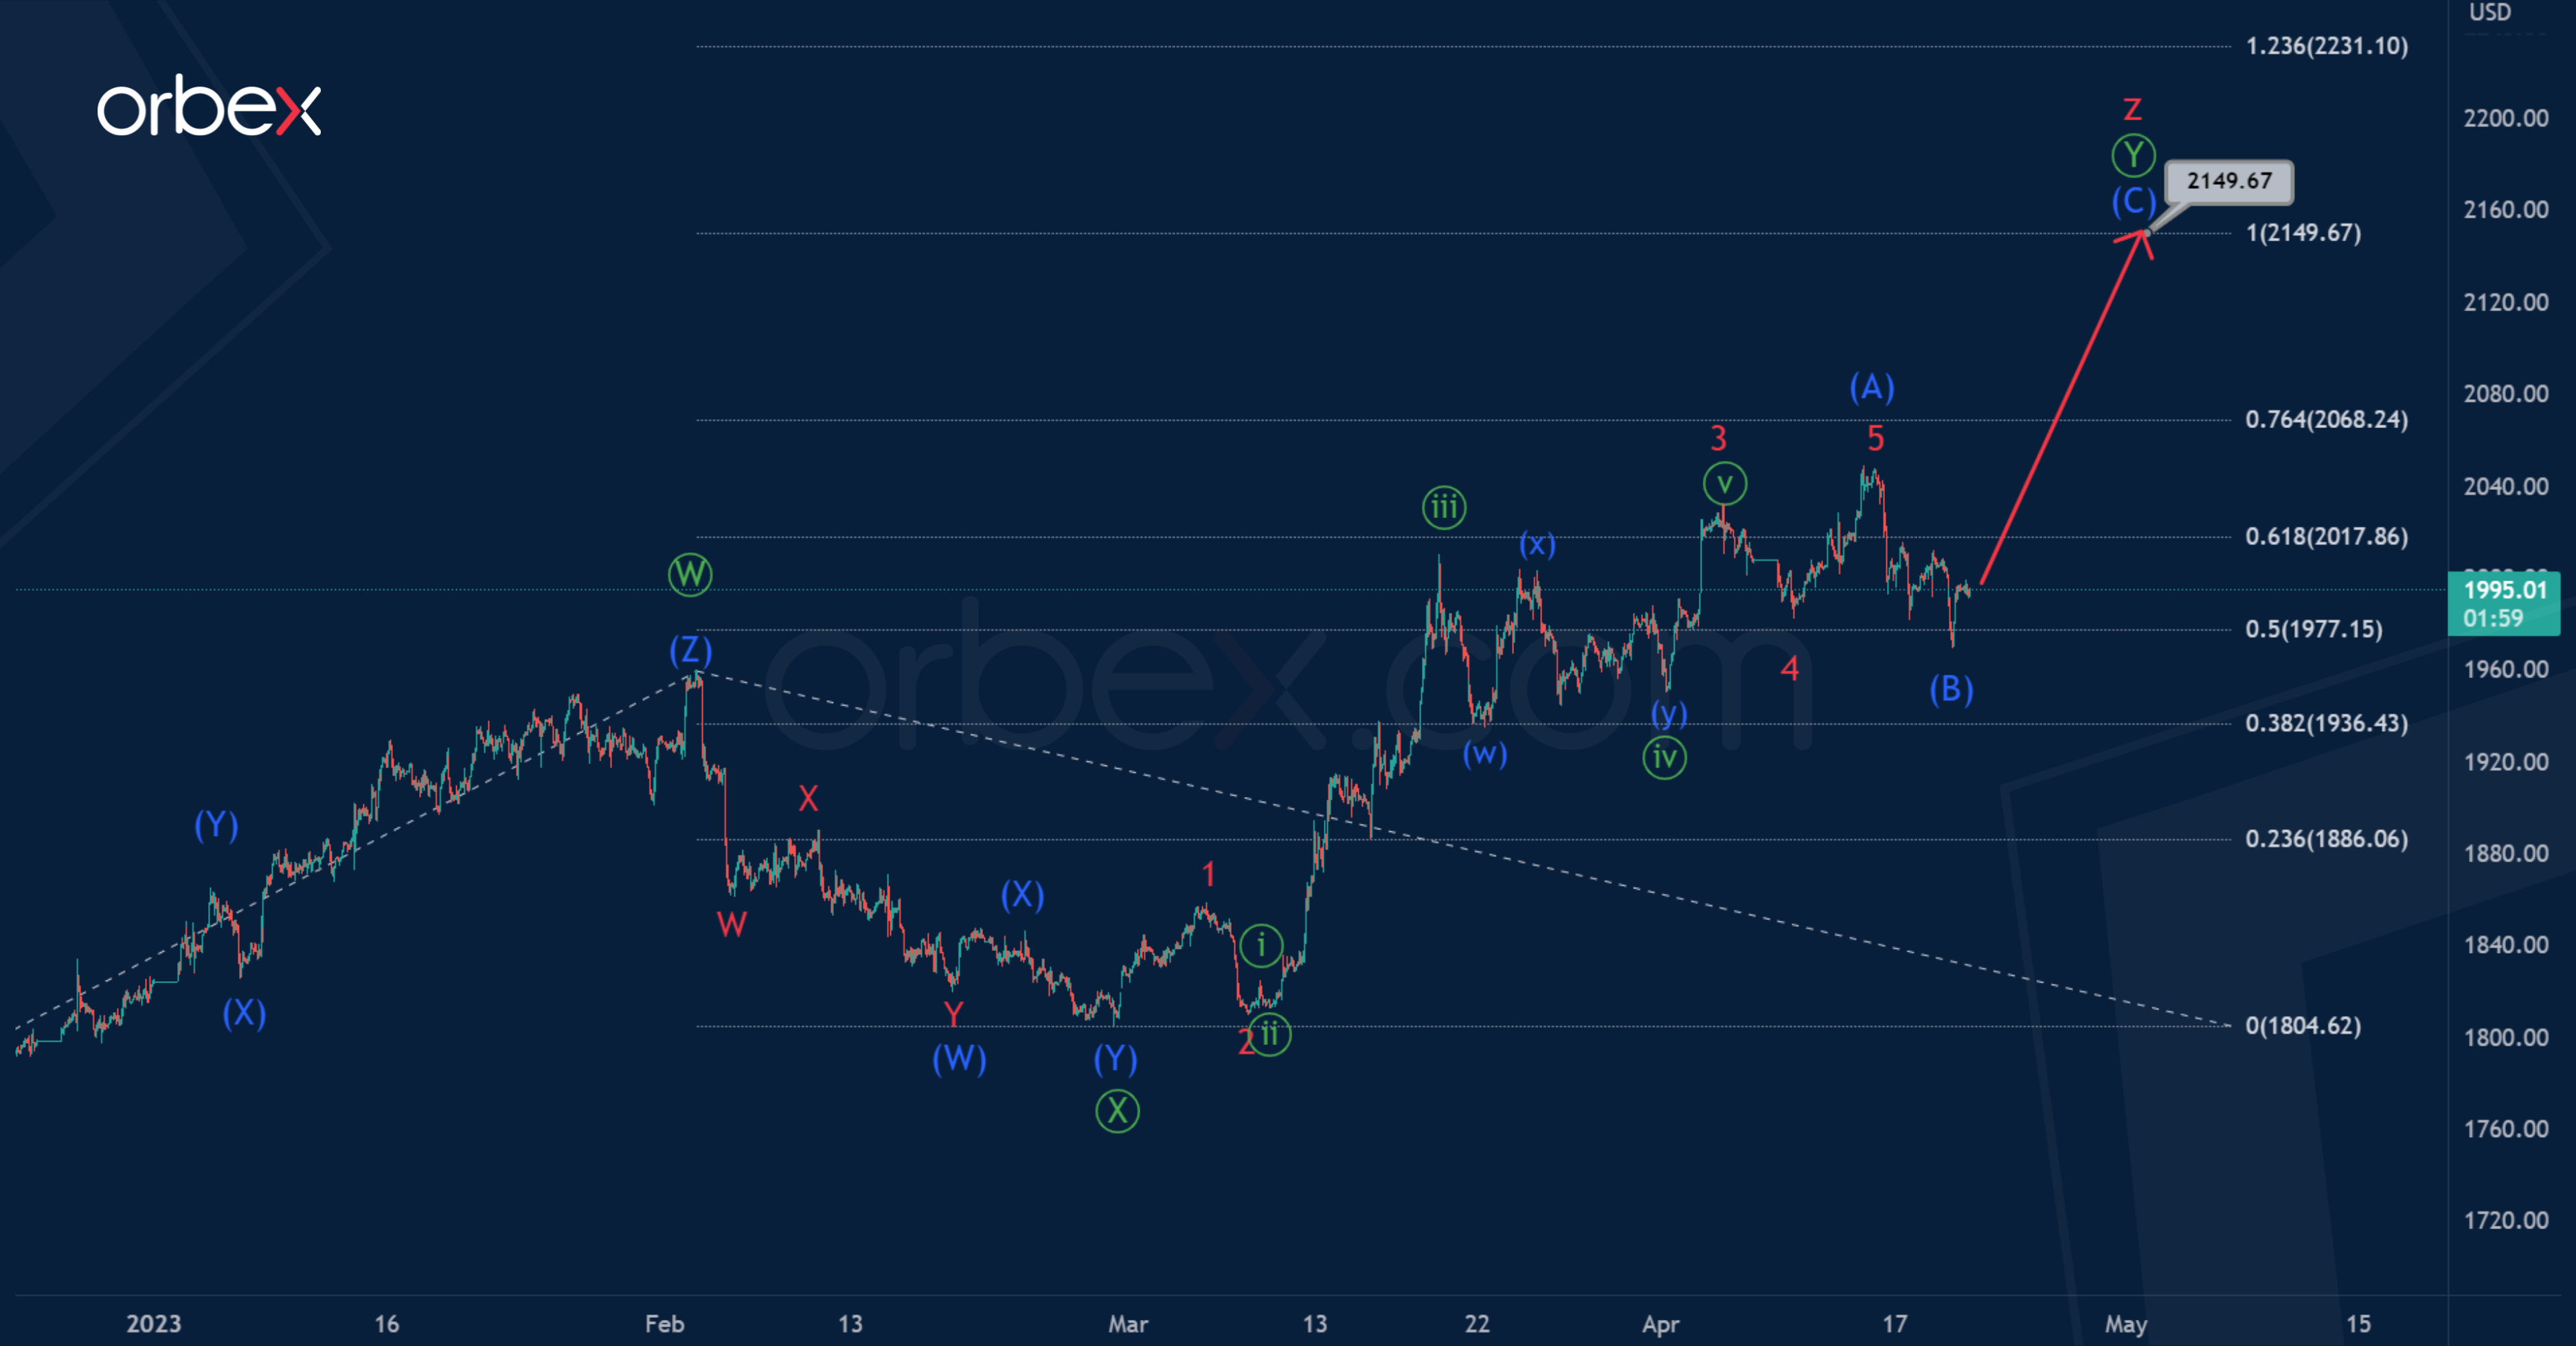
It is assumed that Gold forms a double zigzag, which consists of three main sub-waves Ⓦ-Ⓧ-Ⓨ inside the cycle wave z.
The primary sub-waves Ⓦ-Ⓧ are most likely already formed, and the third sub-wave Ⓨ is in the process of development.
The wave Ⓨ can take a standard zigzag shape. Intermediate waves (A) and (B), impulse and correction, are finished. In the near future, market participants may observe growth in the intermediate impulse (C).
The price may rise to 2149.67. At that level, primary wave Ⓨ will be at 100% of wave Ⓦ.
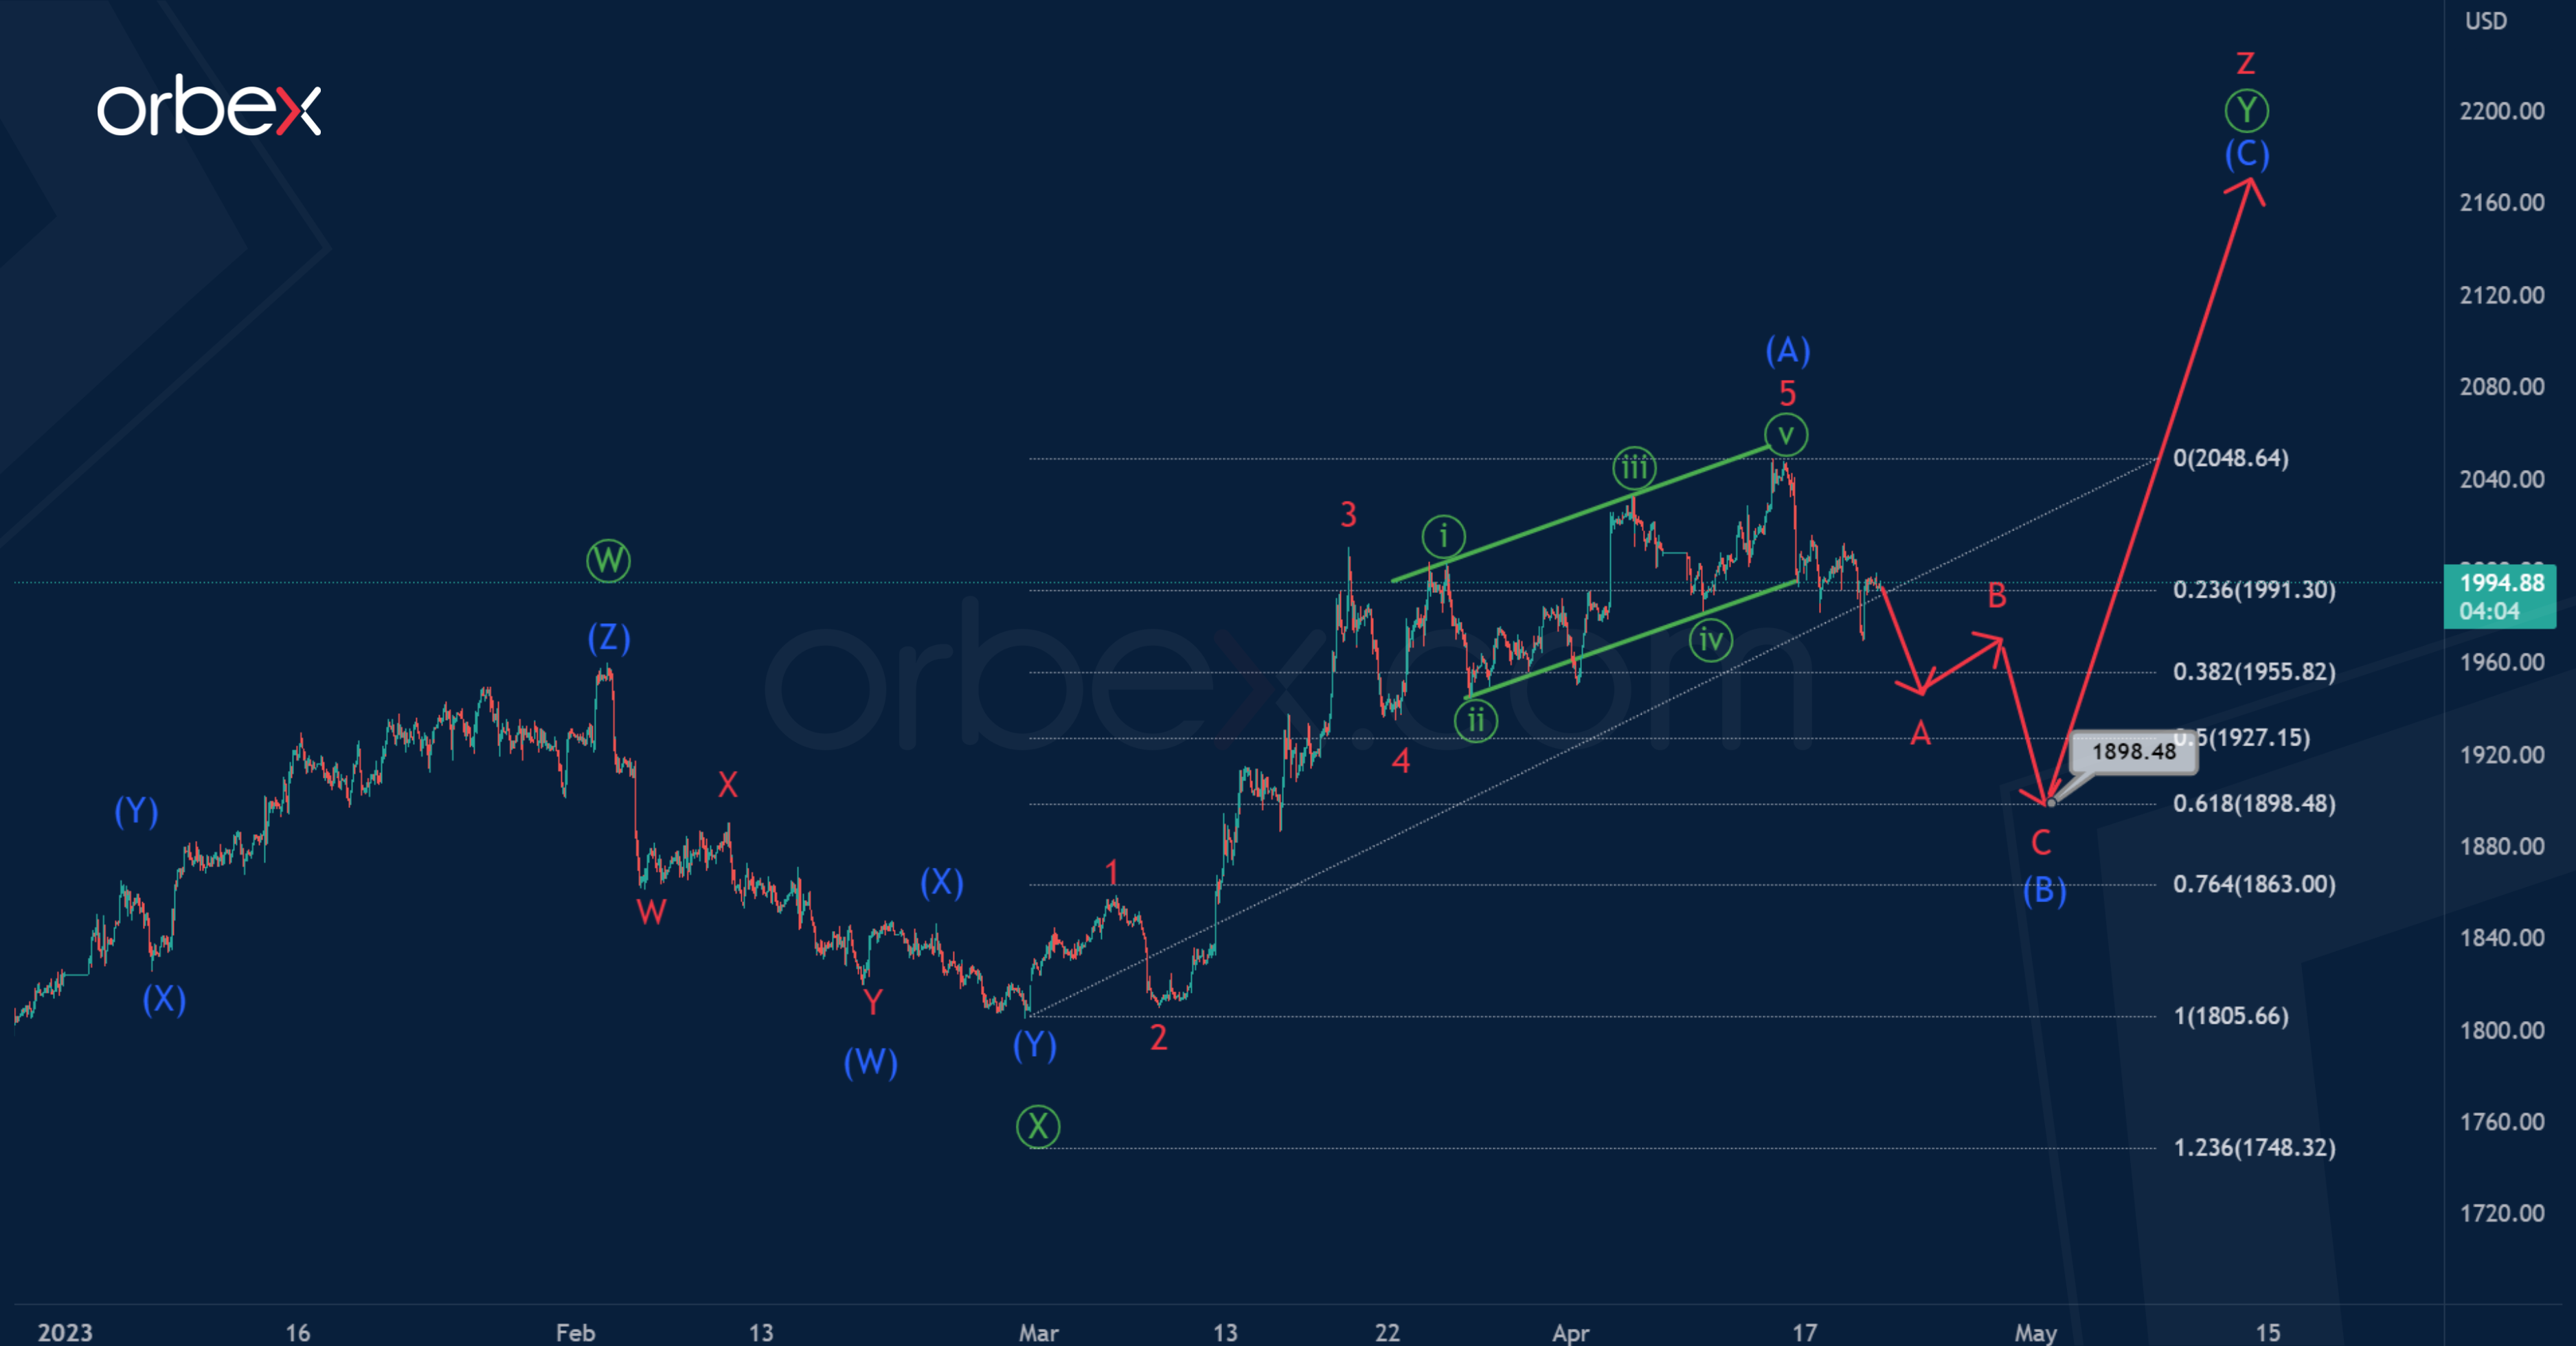
In the second variant, the impulse wave (A) ended not so long ago, its fifth wave is the ending diagonal.
At the moment, it is possible to observe a decrease in the price and the development of an intermediate correction (B). There is a high probability that this correction will take the form of a standard zigzag A-B-C, as shown in the chart.
The final wave (B) is probably near 1898.48. At that level, it will be at 61.8% of impulse (A).
Eurozone posted first monthly trade surplus since Sep 2021
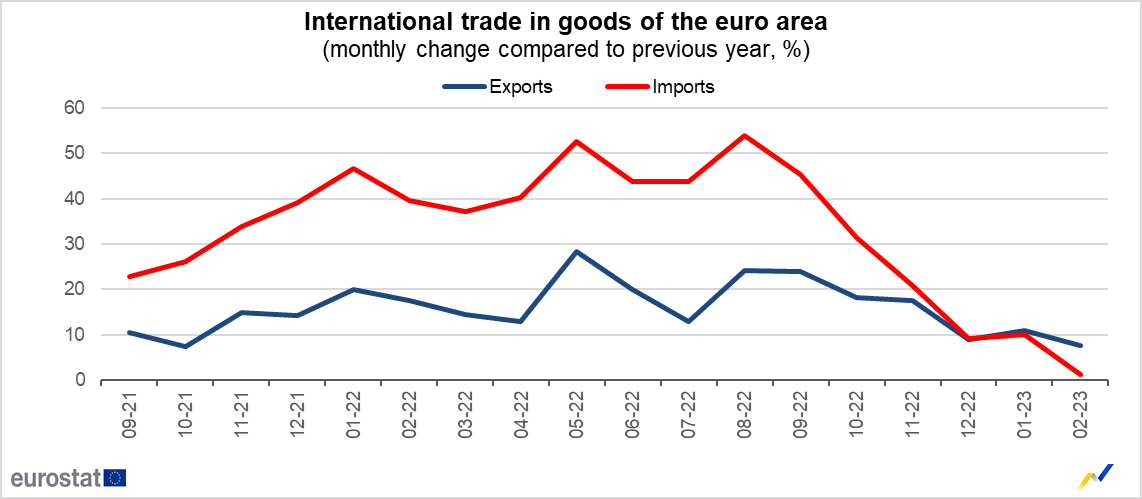
Eurozone goods exports to the rest of the world rose 7.6% yoy in February to EUR 232.7B. Goods imports rose 1.1% yoy ton EUR 228.1B. Trade surplus came in at EUR 4.6B, the first surplus since September 2021. Intra-Eurozone trade rose 8.0% yoy to EUR 224.4B.
In seasonally adjusted term, exports rose 1.2% mom to EUR 243.9B. Imports dropped -3.4% mom to EUR 252.6B. Trade deficit narrowed to EUR -0.1B, versus expectation of EUR -8.5B. Intra-Eurozone trade rose from February's EUR 230.7B to EUR 232.3B.
AUD/USD – Aussie Shrugs as Business Confidence Falls, RBA Review Released
- Australian Business Confidence and Business Conditions fall
- RBA review calls for overhaul of central bank
- Governor Lowe says willing to continue
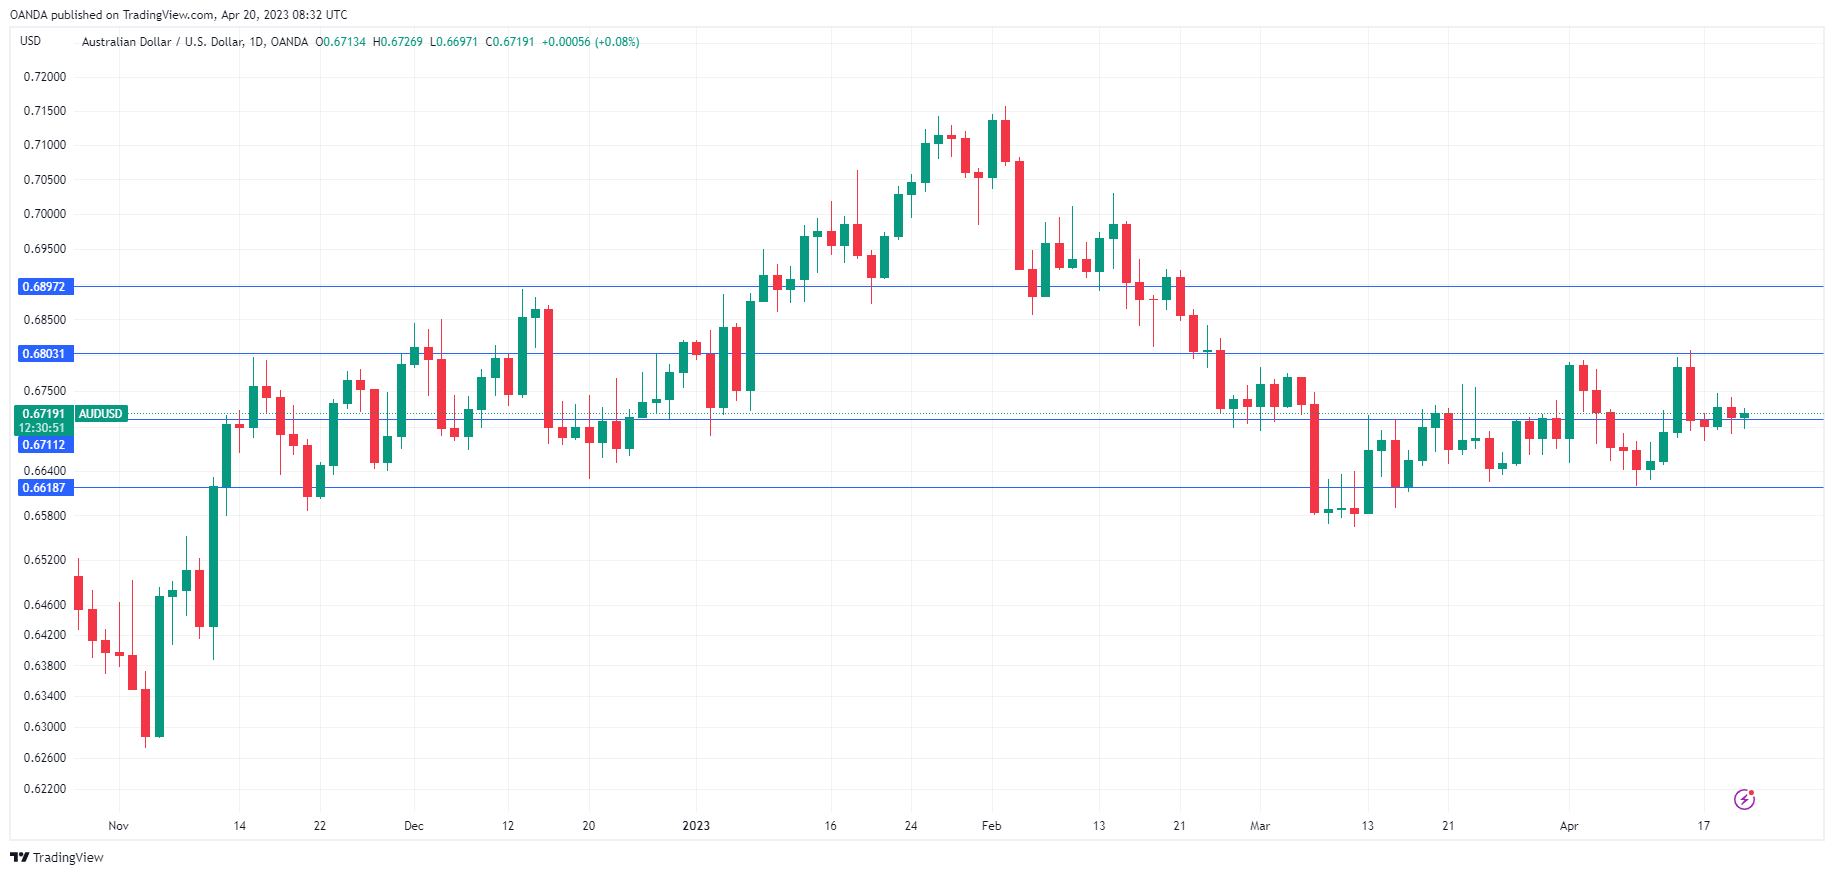
- AUD/USD is almost unchanged, trading at 0.6714
Australian Business confidence declines again
The NAB Business Confidence Index declined for a second straight quarter, falling by 4 pts. This missed the estimate of 2 and follows a Q4 2022 reading of -1. Business Conditions also dropped by 4 pts. The NAB found that businesses remain most concerned about wage growth and continue to report a shortage of workers. The good news was that supply chains have improved and there are expectations that inflation may have peaked.
RBA review calls for major overhaul of central bank
Australian Treasurer Chalmers released the findings of a review of the Reserve Bank of Australia today. The central bank last underwent major changes in the 1990s and the report had some 51 recommendations. The key suggestions include setting up a separate policy board, press conferences after each policy meeting and reducing board meetings from 11 to 8, in order to give households more time to react to rate decisions.
The changes are not expected to affect rate policy and the markets shrugged as the Australian dollar is drifting today. The report did not make any recommendations regarding the future of Governor Lowe, whose mandate expires in September. Lowe welcomed the report’s recommendations and said he would be happy to continue serving if ask to do so by the government.
Lowe has absorbed heavy criticism for the sharp rise in rate hikes after stating in 2020 that rising inflation was transient and the RBA would not raise rates for three years. This forecast was of course way off the mark and the RBA has raised rates some 350 basis points over the past year, which has weighed heavily on households as mortgage payments have soared.
AUD/USD Technical
- There is resistance at 0.6803 and 0.6896
- AUD/USD is testing support at 0.6711. Next, there is support at 0.6018
ECB’s Knot: Sufficiently restrictive is clearly not where we are today
ECB Governing Council member Klaas Knot has expressed concerns about the current high inflation rate, suggesting that the current mildly restrictive monetary policy may not be enough to counter it.
Knot stated, "We are now in what I would call mildly restrictive territory with policy rates but inflation is not mild. Inflation is still much too high."
Knot added that the underlying inflation rate, which has been creeping up towards six per cent, needs a sufficiently restrictive stance to be countered. "Where is sufficiently restrictive, I don't know but clearly not where we are today," he said.
The ECB policymaker also noted that it is too early to discuss a pause in tightening measures. "For a pause, I would really need to see a convincing reversal in underlying inflation dynamics," Knot explained.
AUDUSD Extends Sideways Move Amid Diverging Signals
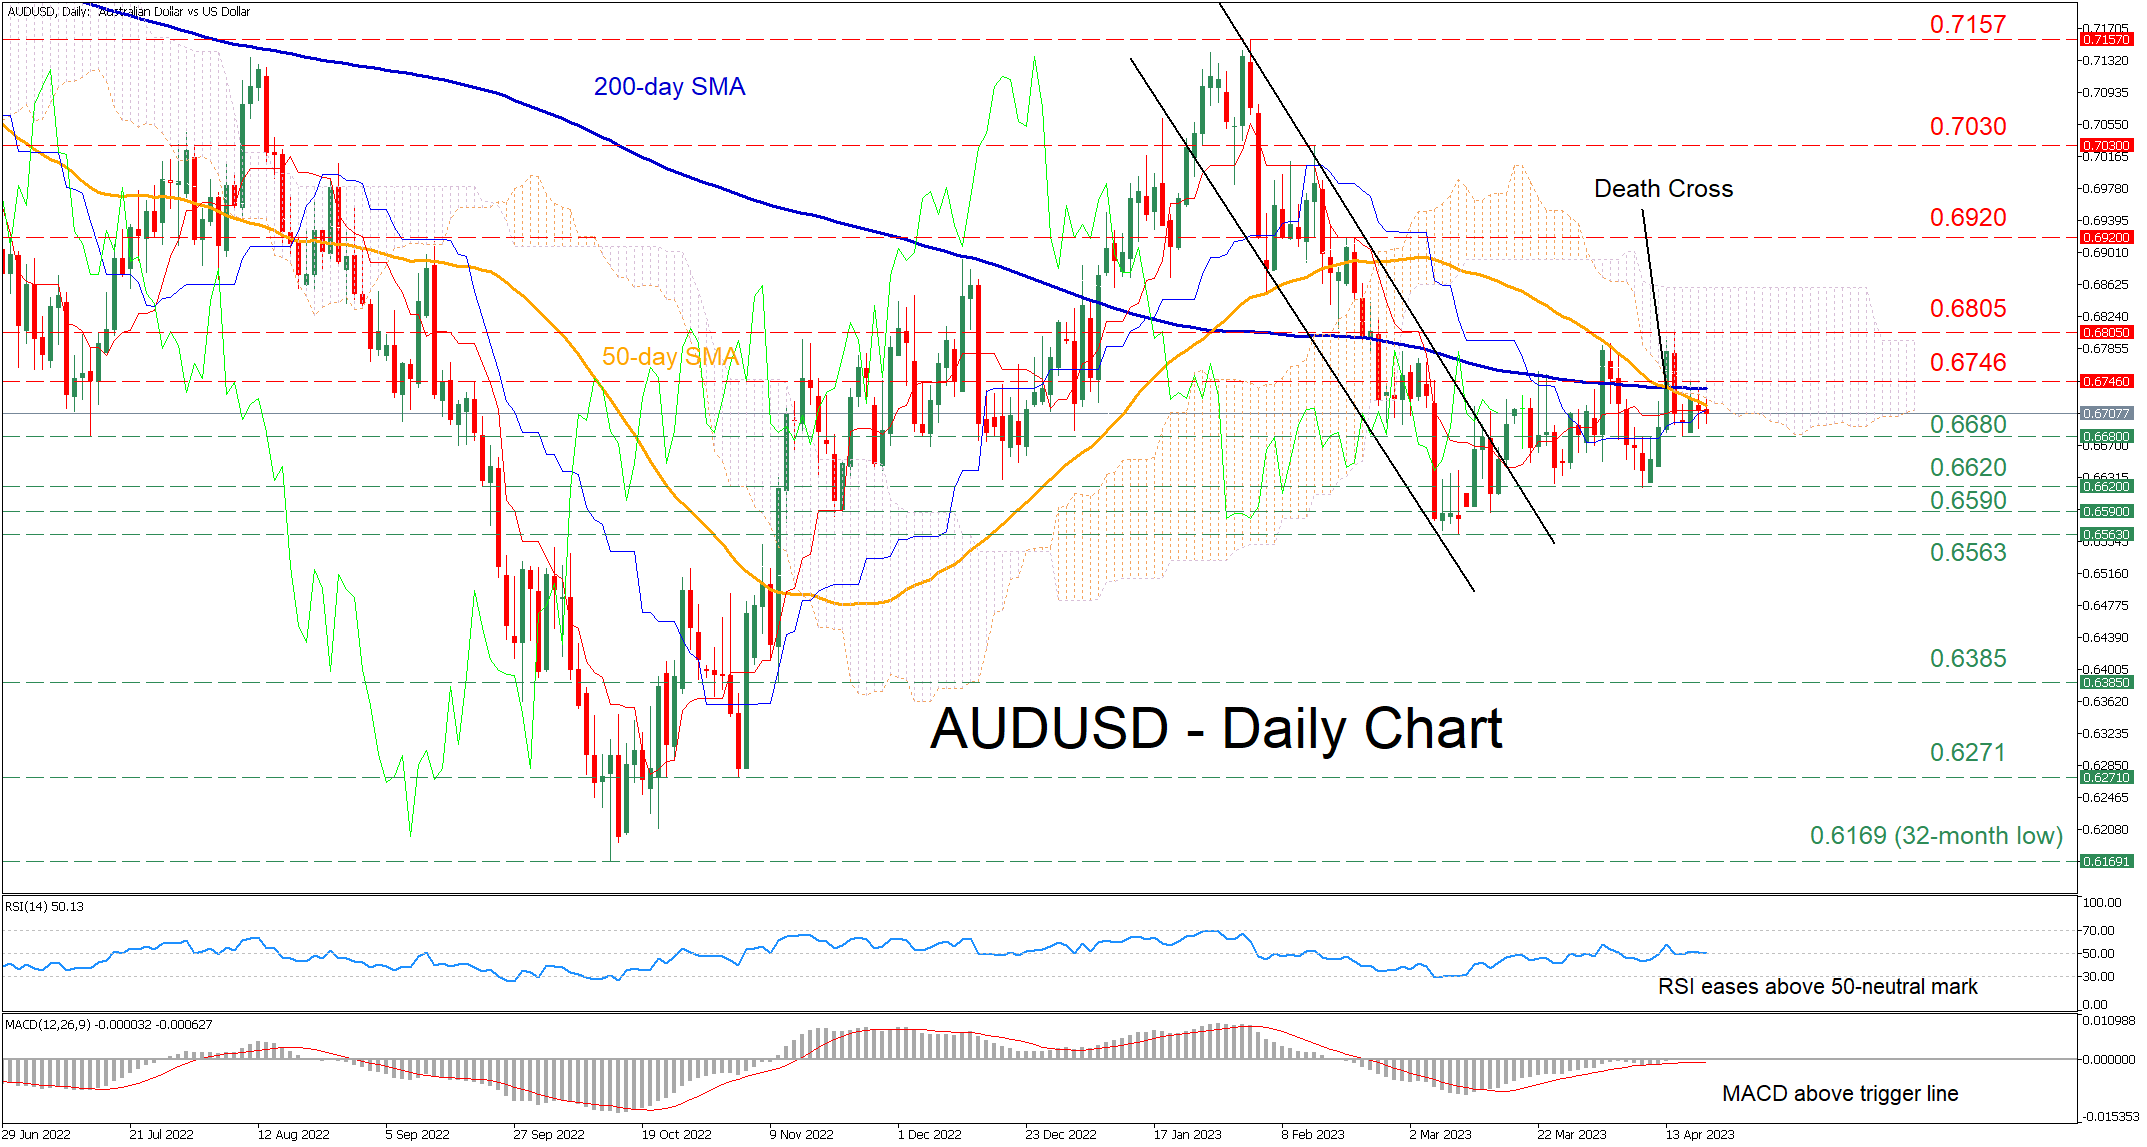
AUDUSD had been trending lower within a downward sloping channel after peaking at 0.7157 in early February. Although the pair managed to break above this bearish pattern, it has been directionless since then, with the recent completion of a death cross between the 50-day simple moving average (SMA) and the 200-day SMA inducing negative pressures.
However, the short-term oscillators are cautiously tilting towards the positive side. The RSI is holding slightly above its 50-neutral mark, while the MACD histogram is battling with the zero mark but remains comfortably above its red signal line.
Should the price move to the upside, the recent resistance of 0.6746, which lies very close to the 200-day SMA could be the first barricade for buyers to conquer. Jumping above that zone, the pair could ascend towards the April high of 0.6805 before 0.6920 gets tested. Failing to halt there, the price might encounter strong resistance at 0.7030.
Alternatively, if the bears manage to push the price lower, 06680 could act as the first line of defense. Sliding beneath that floor, the price may challenge the April low of 0.6620 before the spotlight turns to 0.6590. A dive below the latter could set the stage for the 2023 bottom of 0.6563.
Overall, AUDUSD seems to be in a neutral phase, with the technical indicators providing mixed signals. For the bulls to regain confidence, the pair needs to re-enter the Ichimoku cloud and jump above both its 50- and 200-day SMAs.
Speculators Sold NZD after CPI Data as Traders Don’t See New Hawkish Surprises By RBNZ
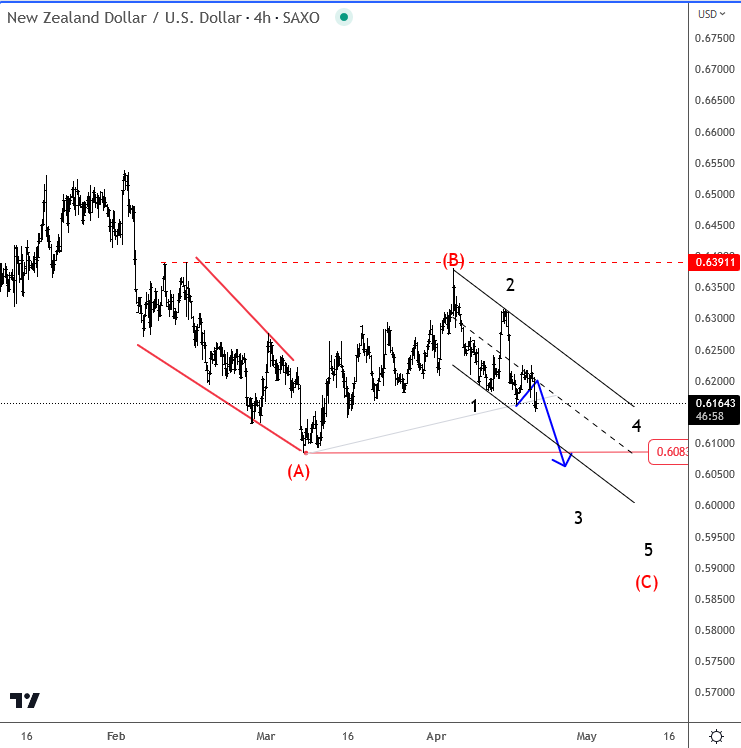
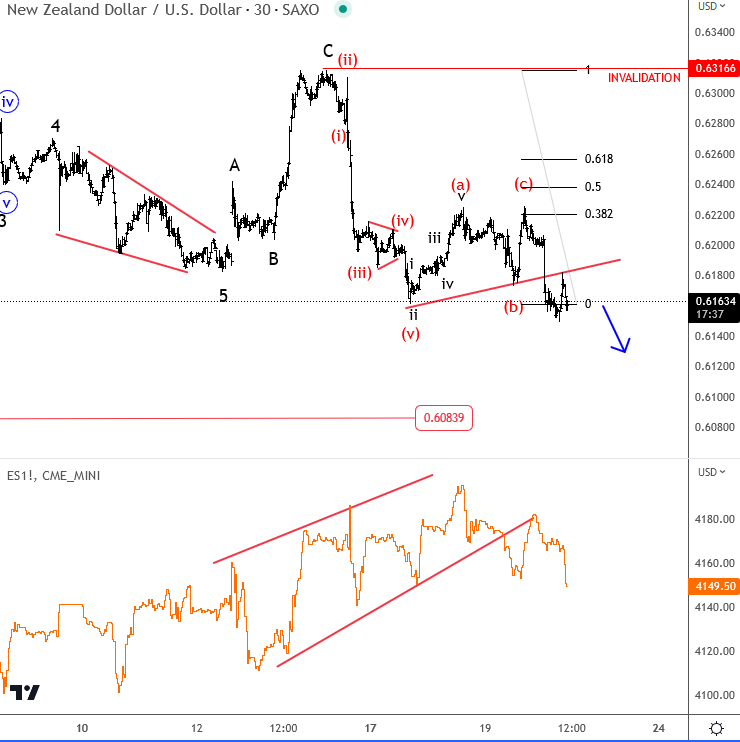
NZD CPI data came out better than expected at down to 1.2% on a quarterly basis from 1.5 forecasts. But the previous reading was 1.4%. So number beat expectations by a lot, thus there is less chance for a new hawkish surprise by RBNZ on their upcoming meetings. As a result, NZD is coming down breaking support after a trendline has been retested as resistance. We see room for 0.6083-0.61, especially if stocks will remain weak. We see SP500 futrues falling out of a wedge.
WTI Oil: Oil Price Falls Further on Stronger Dollar and Demand Concerns
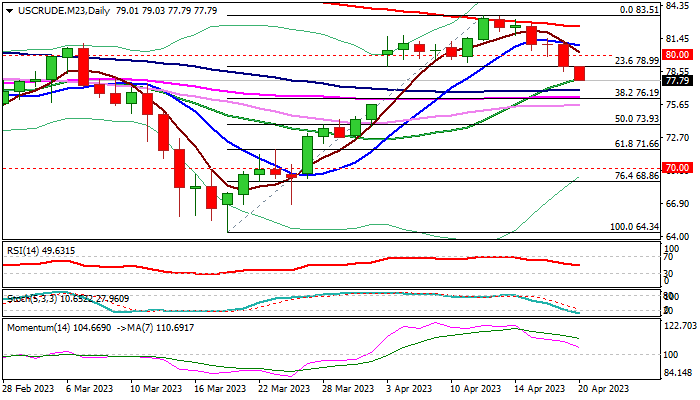
WTI oil price falls further in early Thursday, extending Wednesday’s bearish acceleration (down 2.4% for the day) which has registered a daily close below psychological $80 support.
Fresh weakness broke below next pivot at $79.00 (Fibo 23.6% of $64.34/$83.51/the lowest after Apr 3 gap higher) opening way for deeper pullback from $83.51 (2023 high) where the action was repeatedly capped by falling 200DMA.
Weakening daily studies (14-d momentum in steep decline/5/10DMA bear-cross) support the action, as bears crack 20DMA ($77.91), eyeing key Fibo support at $76.19 (38.2% of $64.34/$83.51).
Overbought stochastic and momentum indicator breaking into negative territory on weekly chart, add to downside risk.
However, bears may pause on oversold conditions on daily chart, with the action to be ideally capped by $79.00 (reverted to resistance) and stronger upticks to stay below $80 to keep fresh bears in play.
Weakening fundamentals on stronger dollar amid expectations for further Fed rate hikes, weigh on oil prices and so far offset positive signals from stronger than expected China’s economic data, while the impact from the latest OPEC+ decision to further reduce output is also fading.
Res: 79.00; 79.60; 80.00; 80.87.
Sup: 76.90; 76.19; 75.69; 73.93.
GBP/JPY Daily Outlook
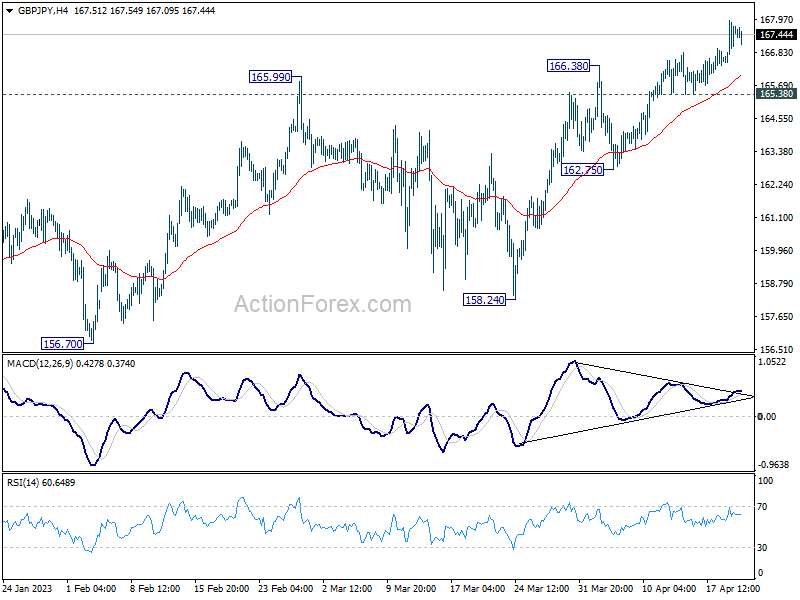
Daily Pivots: (S1) 166.73; (P) 167.35; (R1) 168.21; More...
Intraday bias in GBP/JPY remains on the upside at this point. Current rise should continue to 169.26 resistance first. Break will bring retest of 172.11 high. For now, near term outlook will stay cautiously bullish as long as 165.38 support holds, in case of retreat.
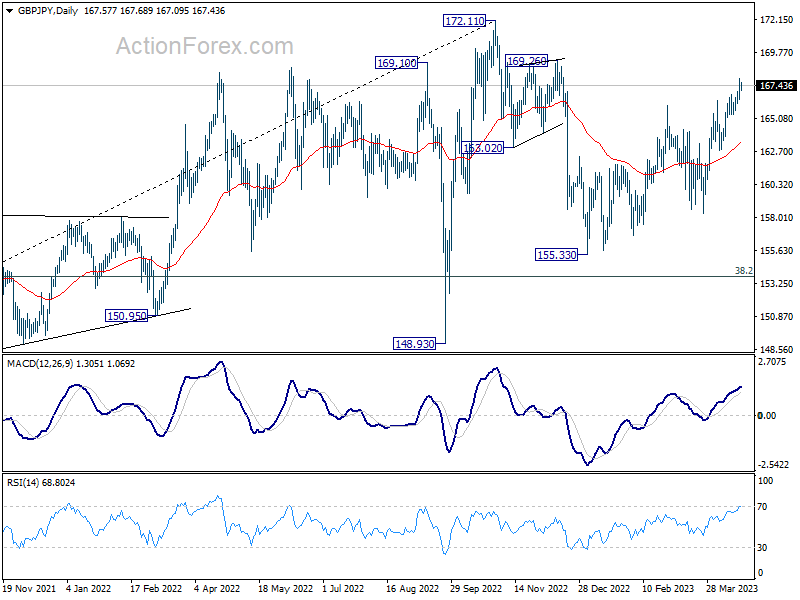
In the bigger picture, as long as 38.2% retracement of 123.94 (2020 low) to 172.11 (2022 high) at 153.70 holds, medium term bullishness is retained. That is, larger up trend from 123.94 (2020 low) is still in progress. Break of 172.11 high to resume such up trend is expected at a later stage.
EUR/JPY Daily Outlook
Daily Pivots: (S1) 147.13; (P) 147.49; (R1) 147.96; More....
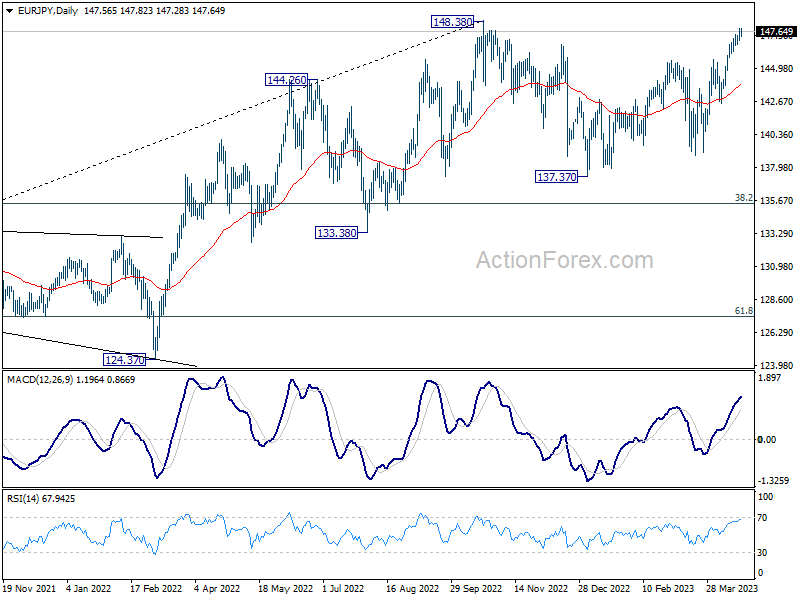
Intraday bias in EUR/JPY remains on the upside for the moment. Current rally should target 148.38 high. Firm break there will resume larger up trend to 149.75 long term resistance. Meanwhile, outlook will stay bullish as long as 145.66 resistance turned support holds, in case of retreat.
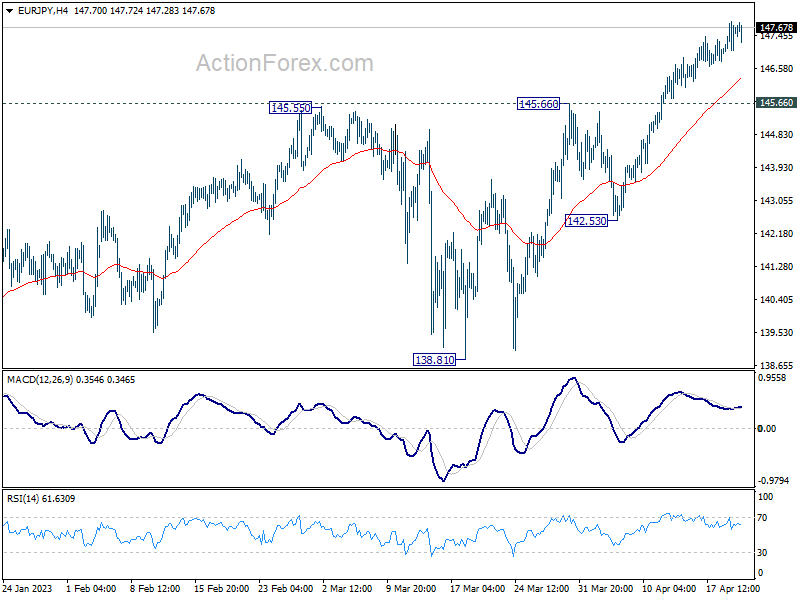
In the bigger picture, as long as 55 W EMA (now at 140.44) holds, larger up trend from 114.42 (2020 low) is still in progress for 149.76 long term resistance. Decisive break there will resume long term up trend. However, sustained break of 55 W EMA will bring deeper fall to 38.2% retracement of 114.42 to 148.38 at 135.40.