

Sample Category Title
Yen Rises on Persistent Inflation, Focus Turns to PMI Data and Canada’s Retail Sales
Japanese Yen rose broadly in today's Asian trading session following the release of CPI data, indicating inflation remains persistently above BoJ's target. While it is still early for BoJ to make any changes to monetary policy, a case for a shift later this year is building. Meanwhile, Dollar and Euro are firmer in relatively quiet trading.
Overall sentiment is slightly risk-off, with Australian Dollar leading other commodity currencies lower. Canadian Dollar is also spiraling down alongside oil prices. Sterling the Swiss franc are currently mixed. Market focus will shift to PMI data from the UK, Eurozone, and the US, as well as Canada's retail sales report.
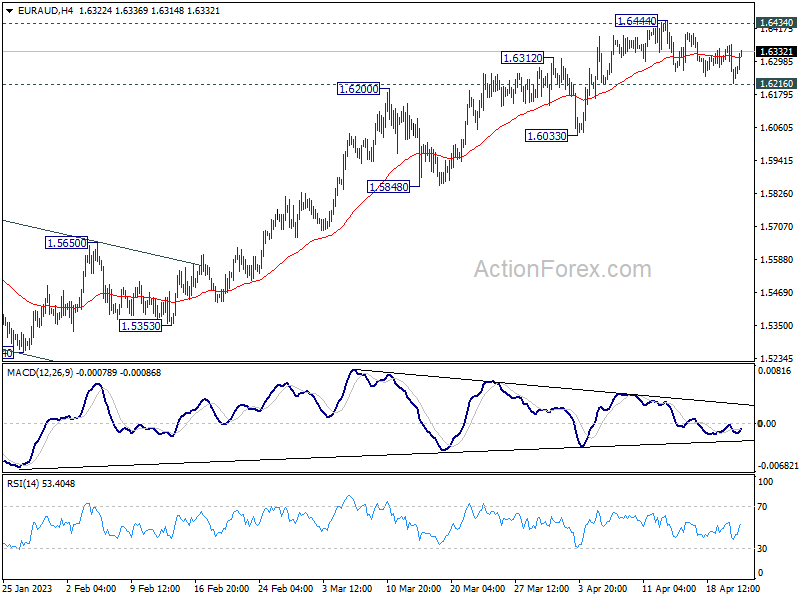
Technically, significant buying emerged in EUR/AUD as it approached a minor support level at 1.6216, keeping the near-term outlook bullish. Focus will return to the 1.6444 temporary top, which coincides with the 1.6434 long-term resistance (2021 high). A decisive break there will add to the case for long-term bullishness in the cross. Simultaneously, AUD/USD could also move in tandem with the Aussie selloff, potentially breaking the 0.6619 support level and reaching 0.6563 low.
In Asia, at the time of writing, Nikkei is down -0.24%. Hong Kong HSI is down -1.09%. China Shanghai SSE is down -1.40%. Singapore Strait Times is down -0.29%. Overnight, DOW dropped -0.33%. S&P 500 dropped -0.60%. NASDAQ dropped -0.80%. 10-year yield dropped -0.057 to 3.545.
Fed's Mester foresees further tightening to ensure downward trajectory of inflation
Cleveland Federal Reserve President Loretta Mester emphasized the need for further tightening in monetary policy to ensure a "sustained downward trajectory" of inflation. She pointed out that "demand is still outpacing supply in both product and labor markets and inflation remains too high."
To tackle the persistent inflation, Mester suggested that monetary policy will need to "move somewhat further into restrictive territory", with fed funds rate "moving above 5%" and "real fed funds rate staying positive for some time". However, she also acknowledged that the tightening journey is closer to its end than the beginning, with future rate decisions being dependent on the economy's performance.
Mester expects the unemployment rate to rise to between 4.5% and 4.75% and inflation to ease to 3.75% this year. She projects that inflation will reach the central bank's 2% target by 2025. In response to an audience question, Mester emphasized the Fed's aim for a "soft landing" and mentioned that she expects slow growth, well below 1%, in the current economic environment.
Fed's Harker: Some additional tightening may be needed
Philadelphia Fed President Patrick Harker has indicated that "some additional tightening may be needed to ensure policy is restrictive enough to support both pillars of our dual mandate." Harker expects that once this point is reached, which he believes should happen this year, the Fed will "hold rates in place and let monetary policy do its work".
Harker also noted that the economy remains strong and inflation is coming down, albeit slowly. He projected that inflation, currently at a 5% annualized rise in the personal consumption expenditures price index, would fall to 3% to 3.5% this year and reach 2% in 2025. The unemployment rate, currently at 3.5%, is expected to move up to around 4.4% this year amid tepid growth.
The bank president acknowledged the impact of last month's financial sector woes on the economy, stating that "it will take some time to evaluate how recent events may impact overall economic activity and inflation." Harker added that he expects to see tighter credit conditions for households and businesses, which may slow economic activity and hiring, but the full extent of this impact is still unclear.
Fed officials highlight the need for further action to tame inflation
Atlanta Fed President Raphael Bostic, Dallas Fed President Lorie Logan, and Fed Governor Michelle Bowman have all expressed concerns over the persistently high inflation rate.
Bostic, speaking on CNBC, said that "one more move should be enough for us to then take a step back and see how our policy is flowing through the economy, to understand the extent to which inflation is returning back to our target." He acknowledged that inflation has been much too high, with Fed having raised interest rates by 4.5 percentage points over the past year in an attempt to bring the economy into better balance.
Lorie Logan emphasized the need for sustained improvement in inflation statistics, an economy evolving as forecast, and a change in the factors underlying inflation, such as the hot labor market and imbalance in supply and demand. She reiterated the concern, stating, "As you surely know, inflation has been much too high."
Bowman also highlighted the importance of the Fed's focus on lowering inflation. She said, "Lately, as you know, the Fed has been focused on lowering inflation, which is essential if we want to support a growing economy and rising incomes." Bowman added, "We clearly need to continue to work to bring inflation down."
BoE Tenreyro: We may already have tightened too much
BoE MPC member Silvana Tenreyro, a known dove, said interest rates have already been raised more than enough.
"The shape of the inflationary shock stemming mostly from the large increase in energy prices, coupled with the long lags with which monetary policy affects the economy, means that the most likely scenario now is that we undershoot the inflation target in the medium term, meaning 2025," Tenreyro said.
"Given policy lags, policy needs to be based on forward looking forecasts and those forecasts at least for the UK are telling us that we may already have tightened too much."
Those who want to keep raising rates she likened to Milton Friedman's "fool in the shower." "When the fool starts the water and it runs cold, he keeps turning the faucet and, eventually, because he's impatient, he gets burned," she said.
Australian PMIs reveal divergence between manufacturing and services, RBA rate hike likely in May
Australia's April PMI Manufacturing has dropped to a 35-month low at 48.1, down from 49.1, while PMI Services jumped to a 10-month high of 52.6, up from 48.6. The PMI Composite also reached a 10-month high at 52.2. The data reveals a growing divergence between the performance of Australia's manufacturing and service sectors.
Warren Hogan, Chief Economic Advisor at Judo Bank, said, "Manufacturing activity remains soft, a reflection of weaker demand for goods and a gradual slowdown in construction activity in Australia. The April flash results for the services sector have bounced strongly, bringing into question the broader economic slowdown."
Hogan dismissed the idea of a recession, stating that the results point to a lift in Australia's economic momentum through mid-2023. However, he noted that the risk to inflation is from excess demand in the economy, putting upward pressure on domestic prices in energy, housing, and labor markets.
With the RBA Board set to meet in early May, Hogan believes the April flash PMI, strong employment outcomes in March, and a resurgence in parts of the housing market all suggest that another 25bp rate hike in May is more likely than not, depending on the March quarter CPI to be released on April 26th.
Japan PMIs: Private sector expands driven by resurgent service economy
Japan's PMI Manufacturing in April slightly rose from 49.2 to 49.5, missing expectations of 49.9. PMI Services experienced a slight drop from 55.0 to 54.9, while PMI Composite fell from 52.9 to 52.5. Despite this, the country's private sector continued to expand solidly at the beginning of Q2, with the service economy's resurgence helping to offset the weak manufacturing sector performance.
Annabel Fiddes, Economics Associate Director at S&P Global Market Intelligence, said, "Inflows of total new business increased at the quickest pace for nearly a year-and-a-half as services companies registered a steep upturn in sales amid reports of stronger demand conditions and improved customer numbers." Fiddes also noted signs of cost pressures easing, with overall input costs rising to the weakest extent in 15 months in April.
Regarding the year-ahead outlook, optimism in the service sector hit a record high in April, but weakened among manufacturers. While service providers anticipate further improvements in demand and operating conditions as the impact of COVID-19 fades, some manufacturers expressed concerns over the economic outlook, rising costs, and component shortages.
Japan's CPI core unchanged at 3.1%, core-core at highest since 1981
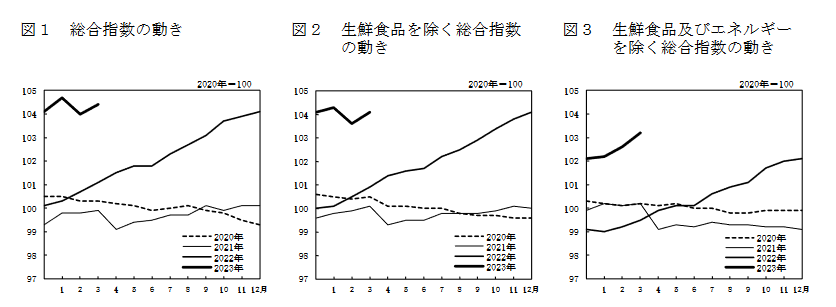
Japan's CPI growth slowed from 3.3% yoy to 3.2% yoy, exceeding the expected 2.6% yoy increase. The CPI core (all items excluding food) remained unchanged at 3.1% yoy, in line with expectations. The CPI core-core (all items excluding food and energy) accelerated from 3.5% yoy to 3.8% yoy, surpassing the anticipated 3.4% yoy figure. This marks the 10th consecutive uptick and the highest level since December 1981.
New BOJ Governor Kazuo Ueda has recently committed to maintaining ultra-loose monetary policy. While no major changes to the bond yield control policy are expected at Ueda's first policy-setting meeting next week, the spreading inflation from energy to the broader economy may keep market expectations alive that BOJ could begin phasing out its massive stimulus later this year. However, this will depend on whether wages increase sustainably and support consumption.
Looking ahead
UK PMIs, as well as Eurozone PMIs are the main focus in European session. Later in the day, Canada will release retail sales while US will also publish PMIs.
EUR/JPY Daily Outlook
Daily Pivots: (S1) 146.91; (P) 147.38; (R1) 147.73; More....
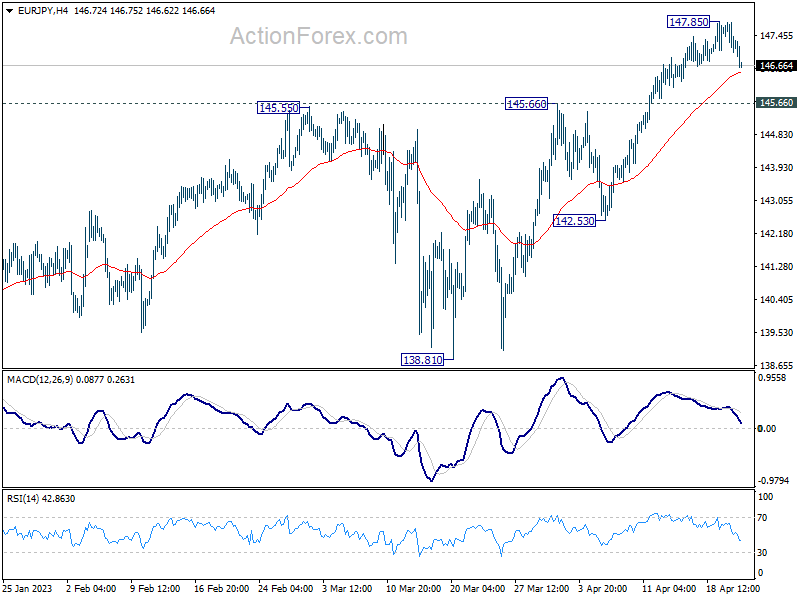
A temporary top is in place at 147.85 in EUR/JPY ahead of 148.38 high. Intraday bias is turned neutral first. Further rally will remain mildly in favor as long as 145.66 resistance turned support holds. Decisive break of 148.38 will resume larger up trend to 149.75 long term resistance. However, firm break of 145.66 will indicate that corrective pattern from 148.38 has started the third leg. Intraday bias will be back on the downside for 142.53 support first and possibly below.
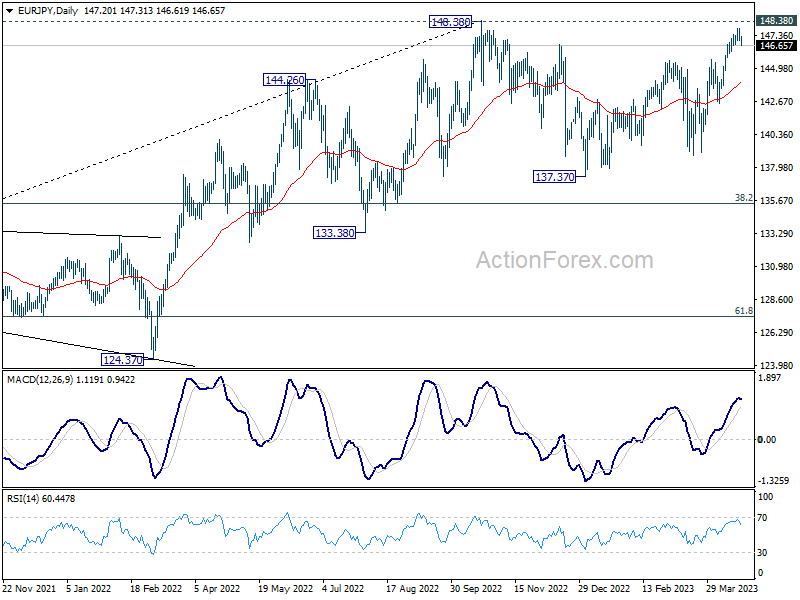
In the bigger picture, as long as 55 W EMA (now at 140.44) holds, larger up trend from 114.42 (2020 low) is still in progress for 149.76 long term resistance. Decisive break there will resume long term up trend. However, sustained break of 55 W EMA will bring deeper fall to 38.2% retracement of 114.42 to 148.38 at 135.40.
Economic Indicators Update
| GMT | Ccy | Events | Actual | Forecast | Previous | Revised |
|---|---|---|---|---|---|---|
| 23:00 | AUD | Manufacturing PMI Apr P | 48.1 | 49.1 | ||
| 23:00 | AUD | Services PMI Apr P | 52.6 | 48.6 | ||
| 23:01 | GBP | GfK Consumer Confidence Apr | -30 | -35 | -36 | |
| 23:30 | JPY | National CPI Y/Y Mar | 3.20% | 2.60% | 3.30% | |
| 23:30 | JPY | National CPI Core Y/Y Mar | 3.10% | 3.10% | 3.10% | |
| 23:30 | JPY | National CPI Core-Core Y/Y Mar | 3.80% | 3.40% | 3.50% | |
| 00:30 | JPY | Manufacturing PMI Apr P | 49.5 | 49.9 | 49.2 | |
| 00:30 | JPY | Services PMI Apr P | 54.9 | 55 | ||
| 06:00 | GBP | Retail Sales M/M Mar | -0.90% | -0.50% | 1.20% | 1.10% |
| 06:00 | GBP | Retail Sales Y/Y Mar | -3.10% | -3.10% | -3.50% | |
| 06:00 | GBP | Retail Sales ex-Fuel M/M Mar | -1% | -0.70% | 1.50% | 1.40% |
| 06:00 | GBP | Retail Sales ex-Fuel Y/Y Mar | -3.20% | -3.10% | -3.30% | -3.00% |
| 07:15 | EUR | France Manufacturing PMI Apr P | 47.5 | 47.3 | ||
| 07:15 | EUR | France Services PMI Apr P | 53.6 | 53.9 | ||
| 07:30 | EUR | Germany Manufacturing PMI Apr P | 45.6 | 44.7 | ||
| 07:30 | EUR | Germany Services PMI Apr P | 53.5 | 53.7 | ||
| 08:00 | EUR | Eurozone Manufacturing PMI Apr P | 48.2 | 47.3 | ||
| 08:00 | EUR | Eurozone Services PMI Apr P | 54.6 | 55 | ||
| 08:30 | GBP | Manufacturing PMI Apr P | 48.8 | 47.9 | ||
| 08:30 | GBP | Services PMI Apr P | 52.9 | 52.9 | ||
| 12:30 | CAD | Retail Sales M/M Feb | -0.60% | 1.40% | ||
| 12:30 | CAD | Retail Sales ex Autos M/M Feb | 0.00% | 0.90% | ||
| 13:45 | USD | Manufacturing PMI Apr P | 49.2 | 49.2 | ||
| 13:45 | USD | Services PMI Apr P | 51.8 | 52.6 |
EUR/JPY Daily Outlook
Daily Pivots: (S1) 146.91; (P) 147.38; (R1) 147.73; More....
A temporary top is in place at 147.85 in EUR/JPY ahead of 148.38 high. Intraday bias is turned neutral first. Further rally will remain mildly in favor as long as 145.66 resistance turned support holds. Decisive break of 148.38 will resume larger up trend to 149.75 long term resistance. However, firm break of 145.66 will indicate that corrective pattern from 148.38 has started the third leg. Intraday bias will be back on the downside for 142.53 support first and possibly below.
In the bigger picture, as long as 55 W EMA (now at 140.44) holds, larger up trend from 114.42 (2020 low) is still in progress for 149.76 long term resistance. Decisive break there will resume long term up trend. However, sustained break of 55 W EMA will bring deeper fall to 38.2% retracement of 114.42 to 148.38 at 135.40.
Japan’s CPI core unchanged at 3.1%, core-core at highest since 1981
Japan's CPI growth slowed from 3.3% yoy to 3.2% yoy, exceeding the expected 2.6% yoy increase. The CPI core (all items excluding food) remained unchanged at 3.1% yoy, in line with expectations. The CPI core-core (all items excluding food and energy) accelerated from 3.5% yoy to 3.8% yoy, surpassing the anticipated 3.4% yoy figure. This marks the 10th consecutive uptick and the highest level since December 1981.
New BOJ Governor Kazuo Ueda has recently committed to maintaining ultra-loose monetary policy. While no major changes to the bond yield control policy are expected at Ueda's first policy-setting meeting next week, the spreading inflation from energy to the broader economy may keep market expectations alive that BOJ could begin phasing out its massive stimulus later this year. However, this will depend on whether wages increase sustainably and support consumption.
Japan PMIs: Private sector expands driven by resurgent service economy
Japan's PMI Manufacturing in April slightly rose from 49.2 to 49.5, missing expectations of 49.9. PMI Services experienced a slight drop from 55.0 to 54.9, while PMI Composite fell from 52.9 to 52.5. Despite this, the country's private sector continued to expand solidly at the beginning of Q2, with the service economy's resurgence helping to offset the weak manufacturing sector performance.
Annabel Fiddes, Economics Associate Director at S&P Global Market Intelligence, said, "Inflows of total new business increased at the quickest pace for nearly a year-and-a-half as services companies registered a steep upturn in sales amid reports of stronger demand conditions and improved customer numbers." Fiddes also noted signs of cost pressures easing, with overall input costs rising to the weakest extent in 15 months in April.
Regarding the year-ahead outlook, optimism in the service sector hit a record high in April, but weakened among manufacturers. While service providers anticipate further improvements in demand and operating conditions as the impact of COVID-19 fades, some manufacturers expressed concerns over the economic outlook, rising costs, and component shortages.
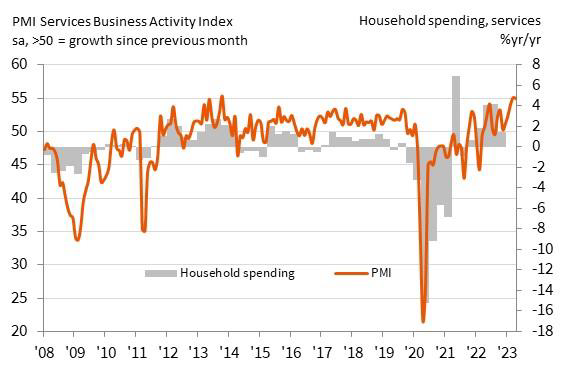
Australian PMIs reveal divergence between manufacturing and services, RBA rate hike likely in May
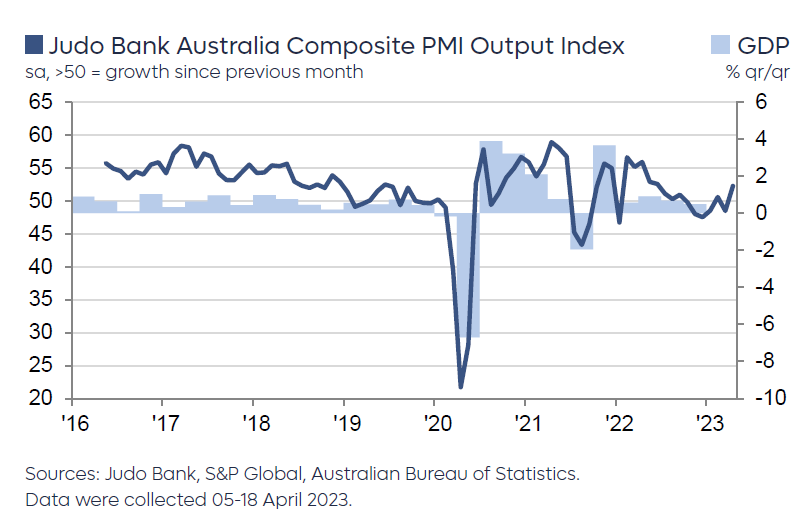
Australia's April PMI Manufacturing has dropped to a 35-month low at 48.1, down from 49.1, while PMI Services jumped to a 10-month high of 52.6, up from 48.6. The PMI Composite also reached a 10-month high at 52.2. The data reveals a growing divergence between the performance of Australia's manufacturing and service sectors.
Warren Hogan, Chief Economic Advisor at Judo Bank, said, "Manufacturing activity remains soft, a reflection of weaker demand for goods and a gradual slowdown in construction activity in Australia. The April flash results for the services sector have bounced strongly, bringing into question the broader economic slowdown."
Hogan dismissed the idea of a recession, stating that the results point to a lift in Australia's economic momentum through mid-2023. However, he noted that the risk to inflation is from excess demand in the economy, putting upward pressure on domestic prices in energy, housing, and labor markets.
With the RBA Board set to meet in early May, Hogan believes the April flash PMI, strong employment outcomes in March, and a resurgence in parts of the housing market all suggest that another 25bp rate hike in May is more likely than not, depending on the March quarter CPI to be released on April 26th.
Technical Outlook and Review
DXY:
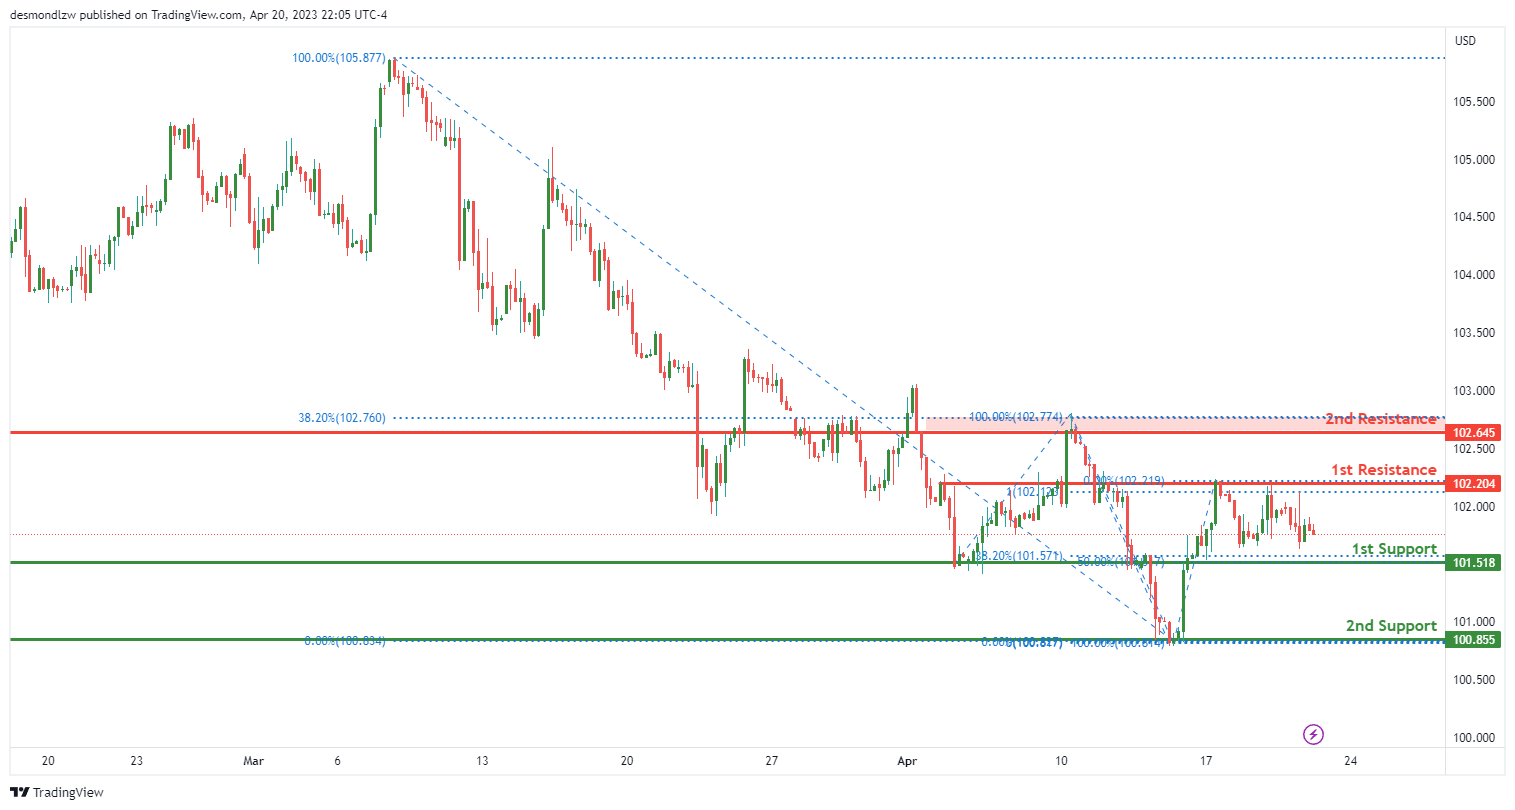
The DXY chart currently shows a neutral momentum overall, which suggests that the price could potentially fluctuate between the 1st resistance and 1st support levels.
The 1st support level for DXY is at 101.51, which is an overlap support and also lines up with the 38.2% Fibonacci retracement level. This level has proven to be a strong support in the past. If the price were to drop from the current level, it could potentially reach this support level.
The 2nd support level is at 100.85, which is a swing low support level. This level has also provided strong support in the past and could potentially act as a target for a further drop in price.
On the resistance side, the 1st resistance level is at 102.20, which is an overlap resistance level and lines up with the 100% Fibonacci projection. This level is key to watch for potential bearish movements.
The 2nd resistance level is at 102.64, which is also an overlap resistance and coincides with the 38.2% Fibonacci retracement level. If the price were to break through this level, it could potentially trigger a stronger bullish acceleration towards the 1st resistance.
EUR/USD:
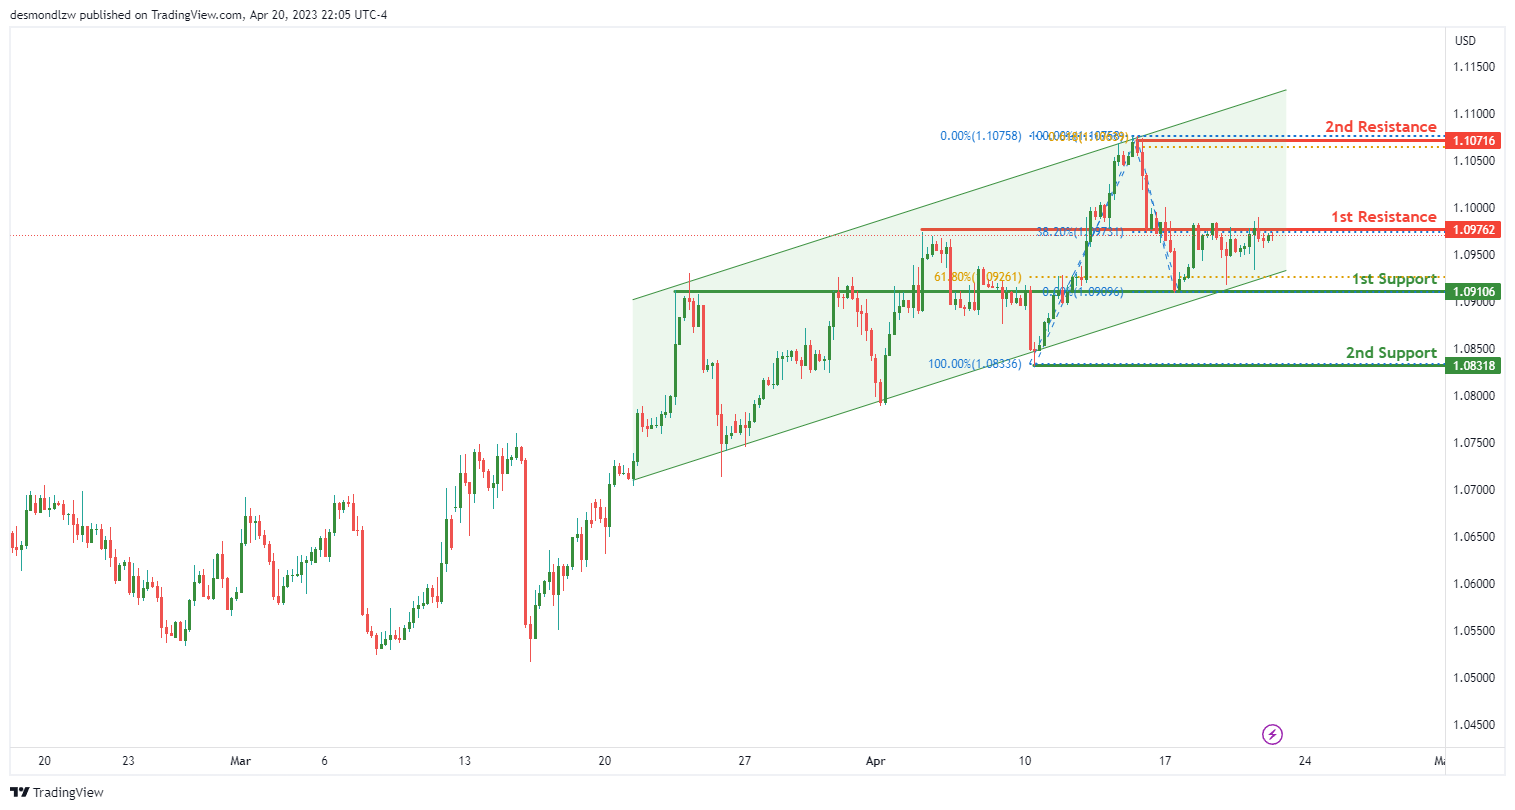
The EUR/USD chart is showing bullish momentum overall, as it is currently within a bullish ascending channel, suggesting that price may continue to rise due to its bullish momentum.
Looking at the support and resistance levels, the 1st support is at 1.0910, which is an overlap support that lines up with a 61.80% Fibonacci retracement. This level has proven to be strong in the past and could potentially act as support for price. If the price were to break below this level, it could drop towards the 2nd support at 1.0831, which is a swing low support.
On the resistance side, the 1st resistance level is at 1.0976, which is an overlap resistance and lines up with a 38.20% Fibonacci retracement. If the price were to break through this resistance level, it could trigger a bullish acceleration towards the 2nd resistance level at 1.1071, which is also an overlap resistance and lines up with a 61.80% Fibonacci projection.
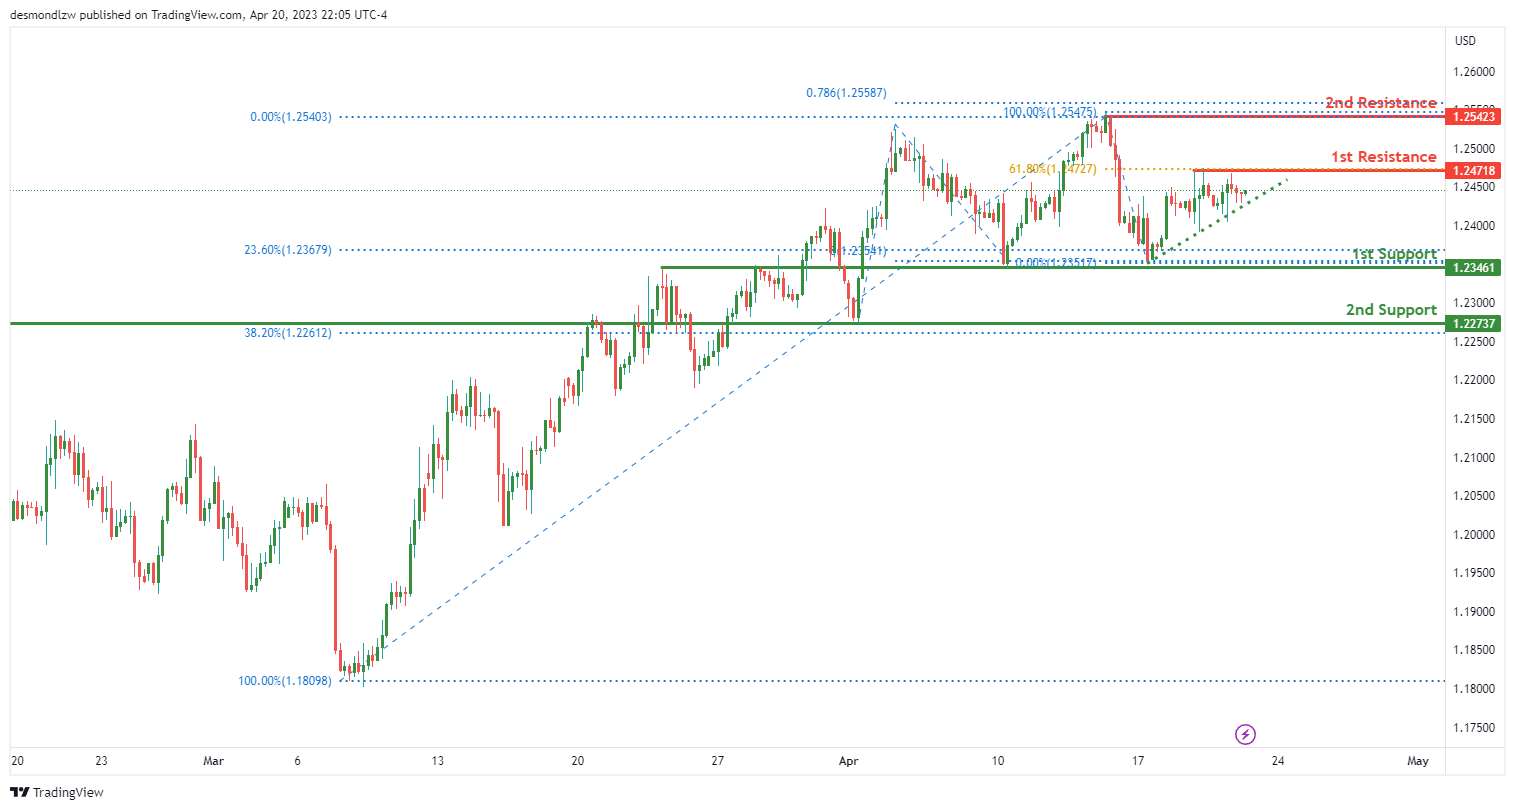
GBP/USD:
The GBP/USD chart is showing strong bullish momentum overall, as price is above a major ascending trend line and on an ascending trend line which acts as support. This suggests further bullish momentum is likely to continue.
Price has the potential to make a bullish break through the 1st resistance and rise towards the 2nd resistance.
On the support side, the 1st support is at 1.2346 which is an overlap support and has a 23.6% Fibonacci retracement lining up with it. This level has the potential to act as strong support if price were to bounce from here. The 2nd support is at 1.2273 which is also an overlap support and has a 38.2% Fibonacci retracement lining up with it.
On the resistance side, the 1st resistance is at 1.2471 which is a multi-swing high resistance level. If price manages to break through this level, it could potentially rise towards the 2nd resistance at 1.2542. This level is a swing high resistance and also lines up with the 78.6% Fibonacci projection.
USD/CHF:
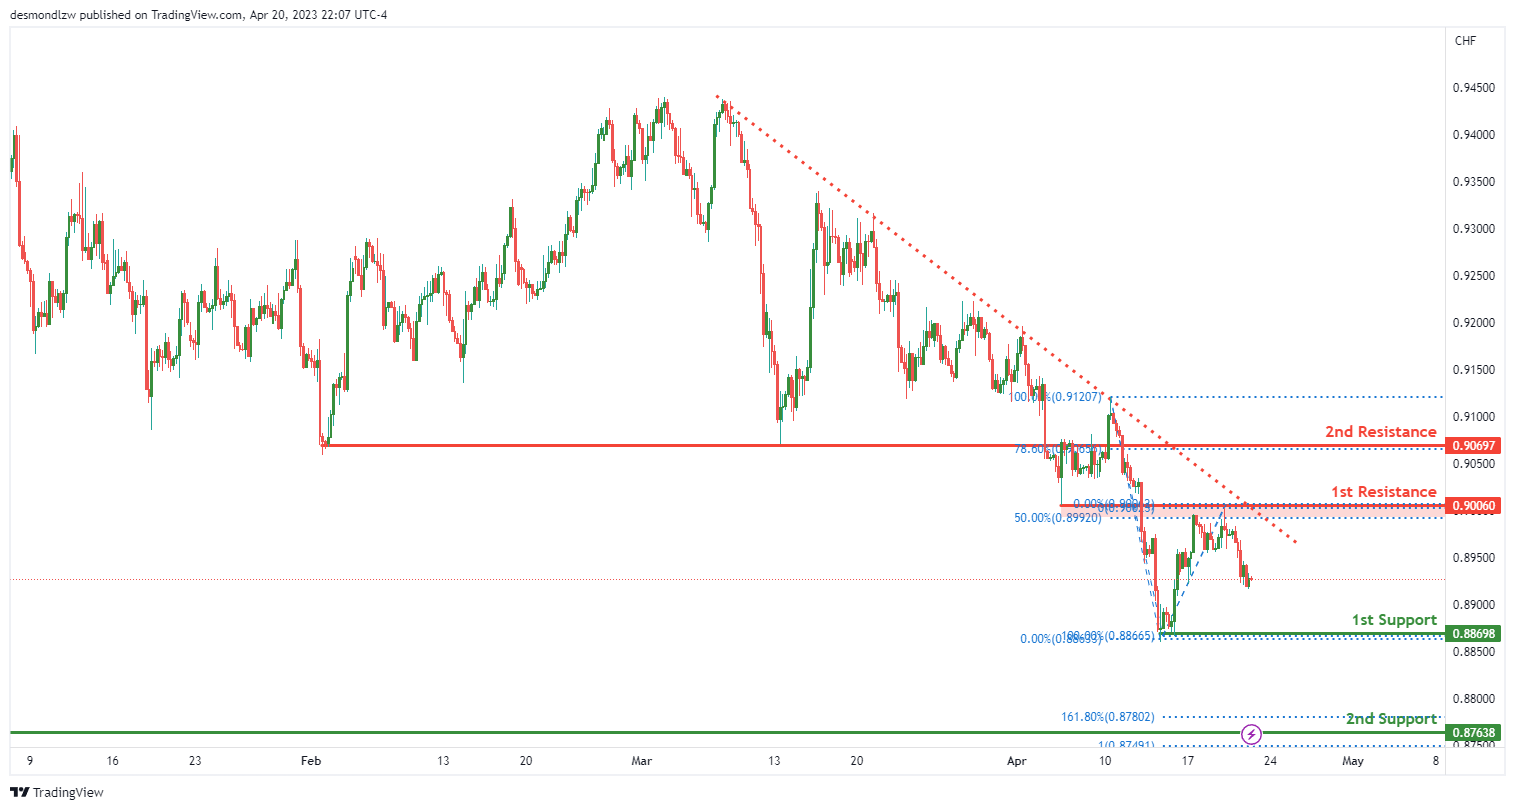
The current price of USD/CHF is below a major descending trend line, which suggests that bearish momentum is likely to continue. Additionally, the price is currently testing a descending trend line that is acting as resistance.
Based on this, it is possible that the price will continue to drop and reach the first support level at 0.8869. This support level is an important multi-swing low support that also lines up with the 23.6% Fibonacci retracement level.
If the price breaks through this support level, the next support level is at 0.8763, which is a significant swing low support and coincides with the 161.8% Fibonacci extension level.
On the other hand, if the price manages to break through the descending trend line resistance, it could potentially rise towards the first resistance level at 0.9006. This level is an overlap resistance and lines up with the 50% Fibonacci retracement level.
If the price manages to break through the first resistance level, the second resistance level is at 0.9069. This level is a pullback resistance and lines up with the 78.6% Fibonacci projection level.
USD/JPY:
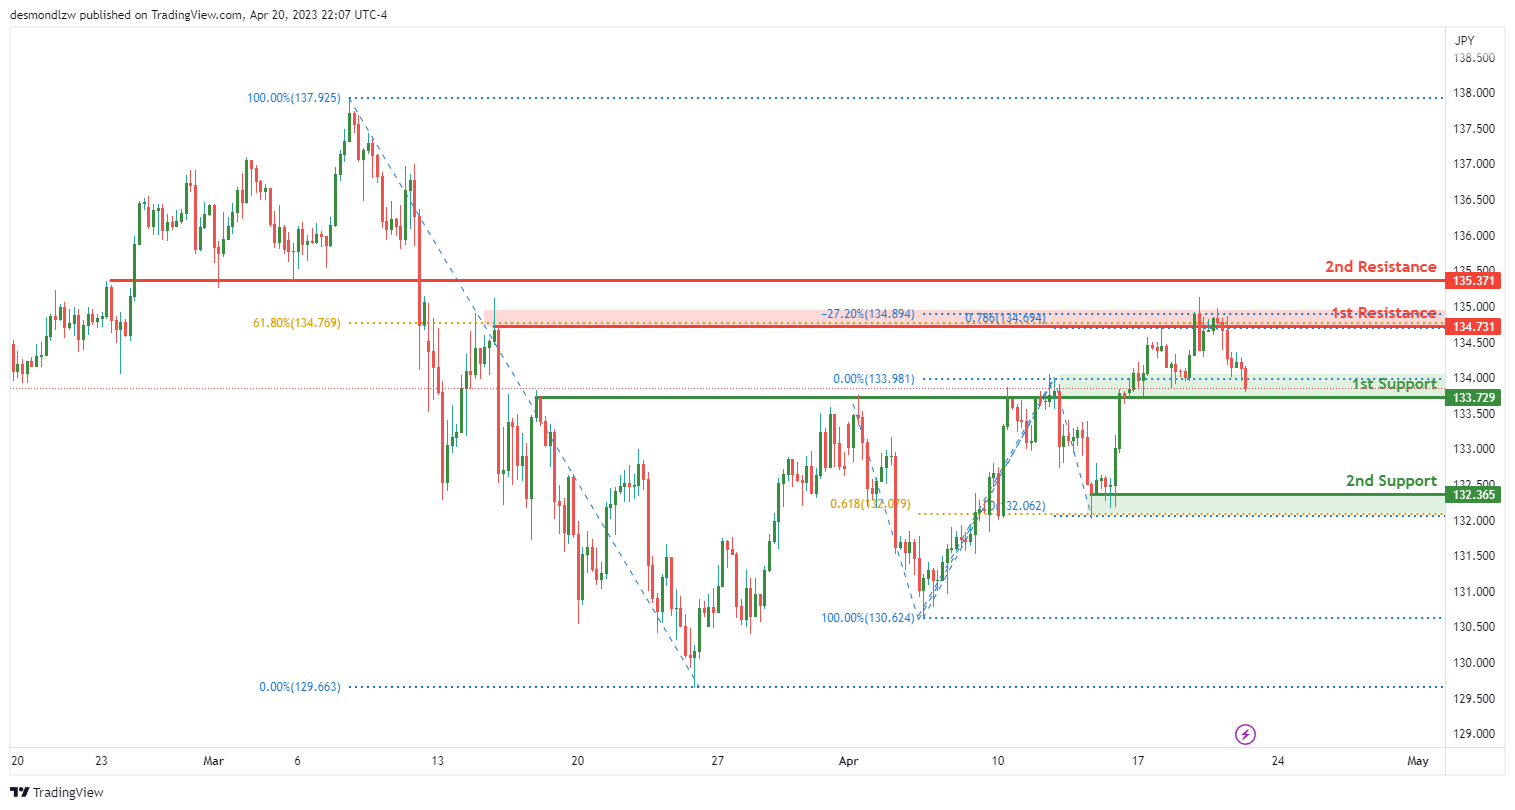
The USD/JPY chart currently shows strong bullish momentum. Prices could potentially bounce off the 1st support level at 133.72 and move towards the 1st resistance level at 134.73.
The 1st support level is an overlap support that coincides with current price, indicating a strong level of buying interest. The 2nd support level is a multi-swing low support that is aligned with the 61.80% Fibonacci projection, further enhancing its importance as a support level.
On the resistance side, the 1st resistance level is a multi-swing high resistance that corresponds with the 61.80% Fibonacci retracement. This resistance level is expected to pose a significant challenge to prices moving upwards. The 2nd resistance level is a pullback resistance that may also act as a hindrance to the bullish momentum.
AUD/USD:
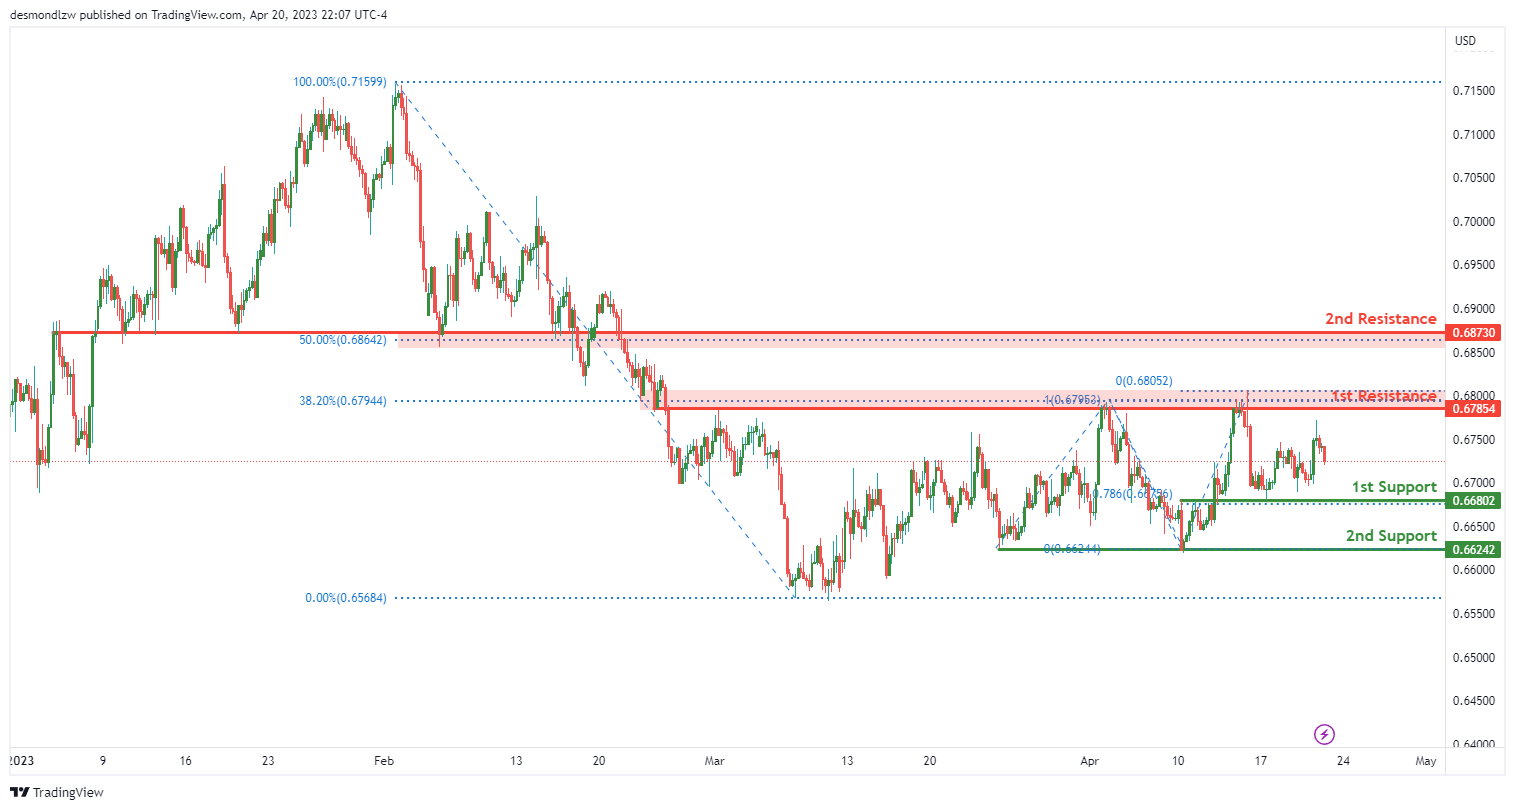
The AUD/USD chart is currently exhibiting strong bearish momentum. Price is below the major descending trend line, which suggests that we may see a continuation of the bearish trend.
There is potential for price to continue its bearish movement towards the 1st support level at 0.6680. This level is a strong overlap support and lines up with the 78.60% Fibonacci projection, making it a good candidate for a potential bounce. If price were to break below this level, the next support level is the 2nd support at 0.6624, which is a multi-swing low support.
On the other hand, if price were to reverse from the 1st support, it could potentially rise to the 1st resistance at 0.6785. This level is a pullback resistance and coincides with the 38.20% Fibonacci retracement. If price were to break above the 1st resistance, the next level to watch out for is the 2nd resistance at 0.6873, which is another pullback resistance and lines up with the 50% Fibonacci retracement.
NZD/USD:
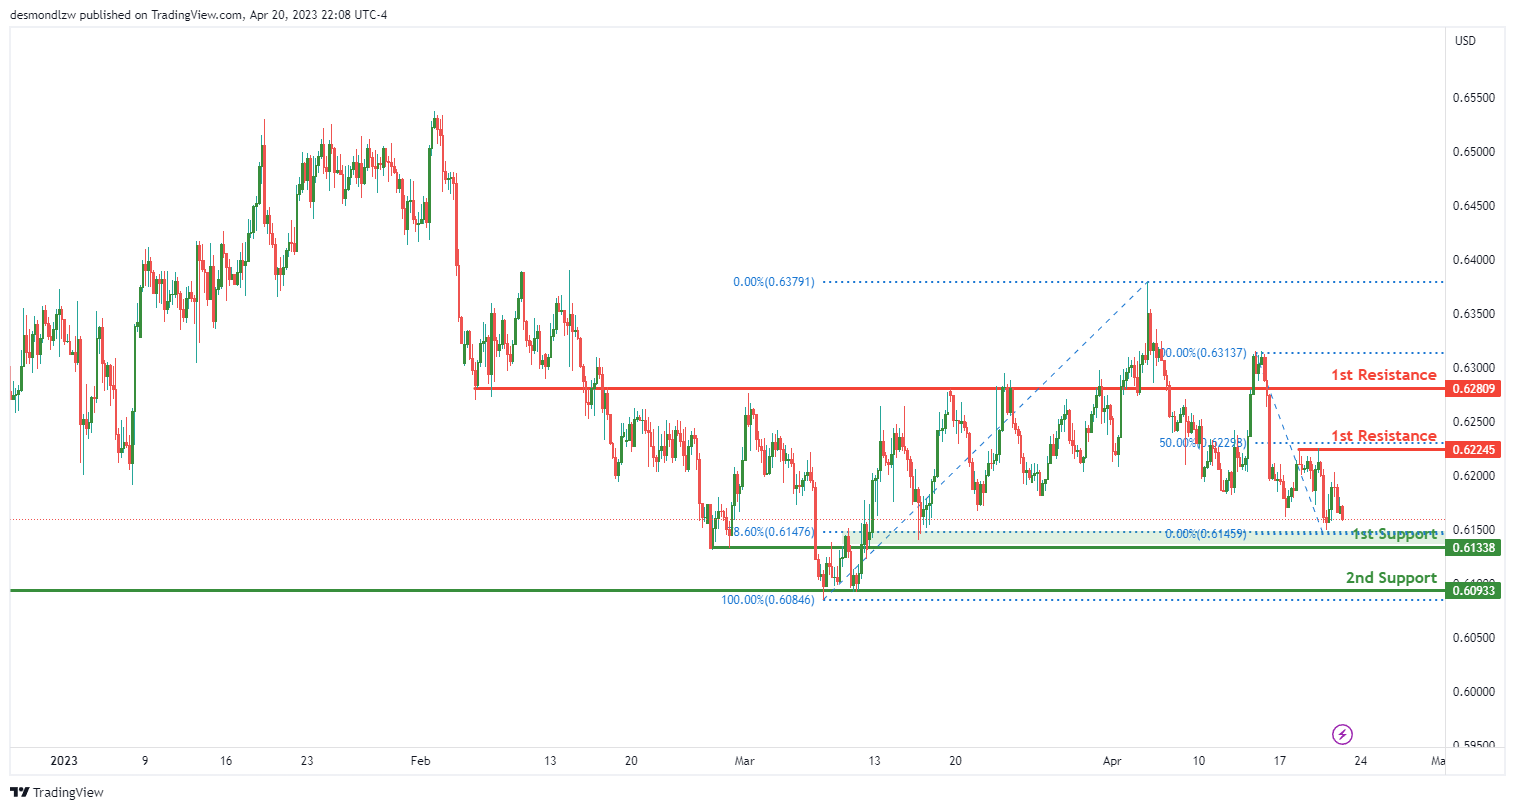
The overall momentum of the NZD/USD chart is bearish, indicating a downward trend. Price could potentially continue to decline towards the 1st support at 0.6133, which is a significant overlap support level and coincides with the 78.60% Fibonacci retracement. A break below this level could push the price further down to the 2nd support at 0.6093, which is also a multi-swing low support.
On the other hand, the 1st resistance at 0.6224 is acting as a pullback resistance and coincides with the 50% Fibonacci retracement. A bullish reversal from this level could push the price up towards the 2nd resistance at 0.6280, which is a significant overlap resistance level.
It’s important to note that the bearish momentum is currently strong, suggesting that the probability of a bearish continuation is high.
USD/CAD:
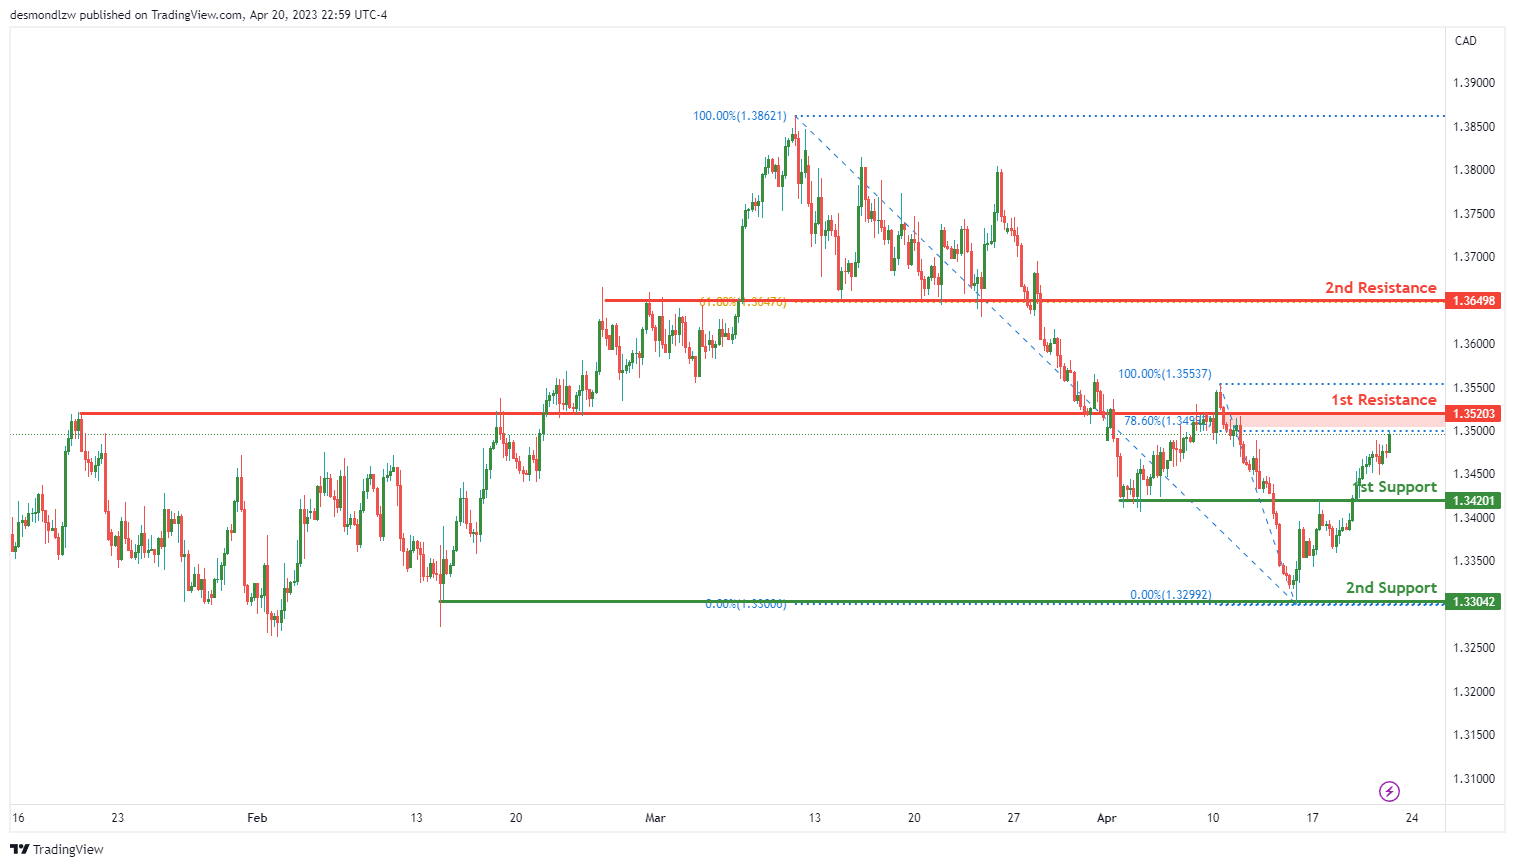
The USD/CAD currency pair is exhibiting strong bearish momentum on its chart, indicating a potential bearish continuation in the near future. The price is expected to react bearishly to the 1st resistance and drop towards the 1st support level.
The 1st support level is situated at 1.3420, which is a crucial pullback support level and coincides with the 78.60% Fibonacci retracement level. The 2nd support level is located at 1.3304, which is a multi-swing low support level.
On the upside, the 1st resistance level is seen at 1.3520, which is an important overlap resistance level and coincides with the 78.60% Fibonacci retracement level. The 2nd resistance level is positioned at 1.3649, which is a pullback resistance level and coincides with the 61.80% Fibonacci retracement level.
DJ30:
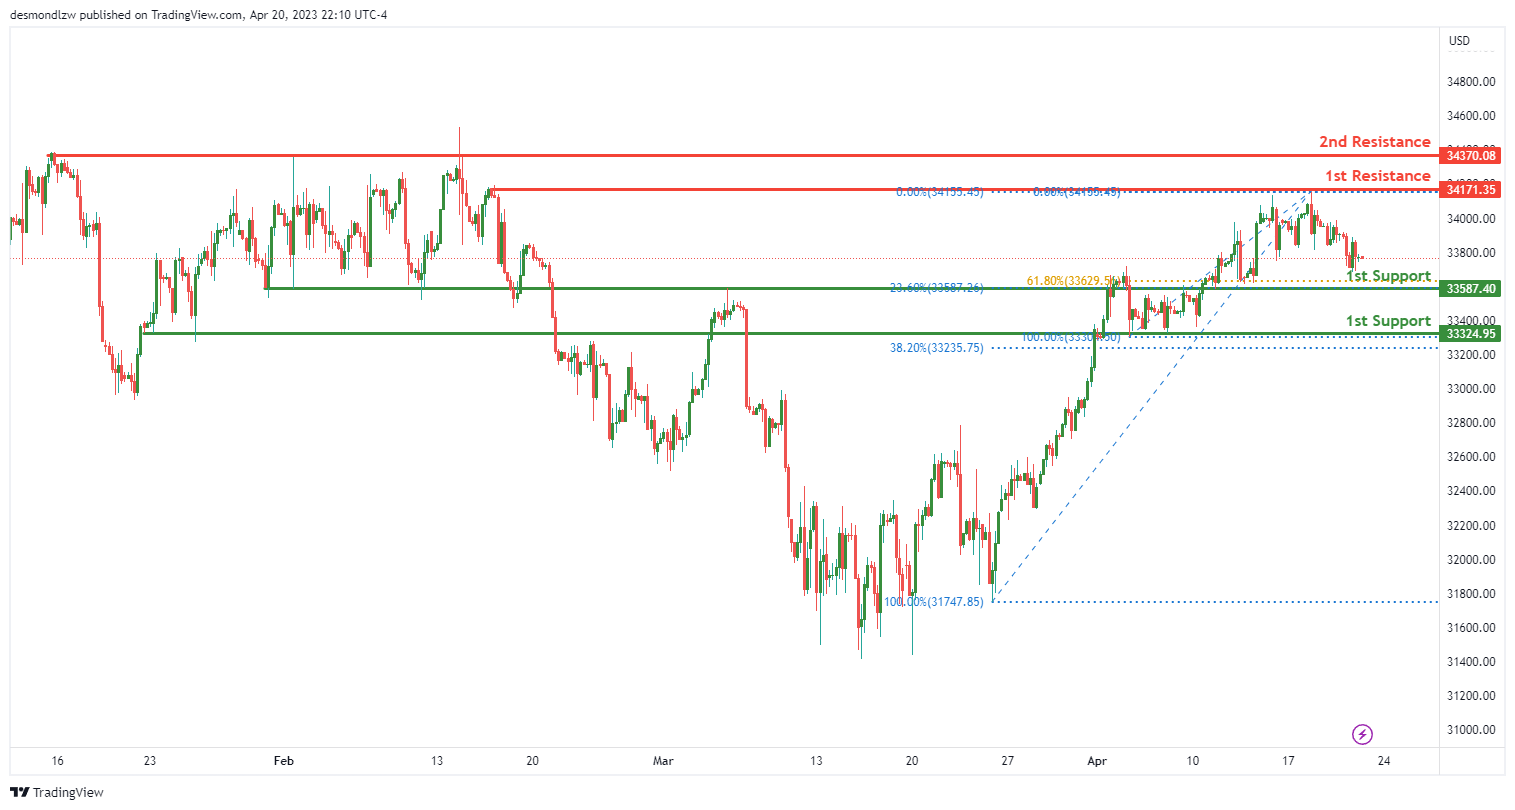
The Dow Jones Industrial Average (DJ30) is showing bullish momentum on the chart, with potential for a bullish bounce off the first support level and a move towards the first resistance level.
The first support level is at 33587.40, which is an overlap support level and the 61.80% Fibonacci retracement level. This level has previously acted as a support, which increases its significance. The second support level at 33324.95 is also an overlap support level and the 38.20% Fibonacci retracement level. A bounce off either of these levels could potentially signal a bullish move.
On the upside, the first resistance level is at 34171.35, which is a multi-swing high resistance level. A break above this level could potentially indicate further bullish momentum. The second resistance level at 34370.08 is also a multi-swing high resistance level, which increases its significance.
GER30:
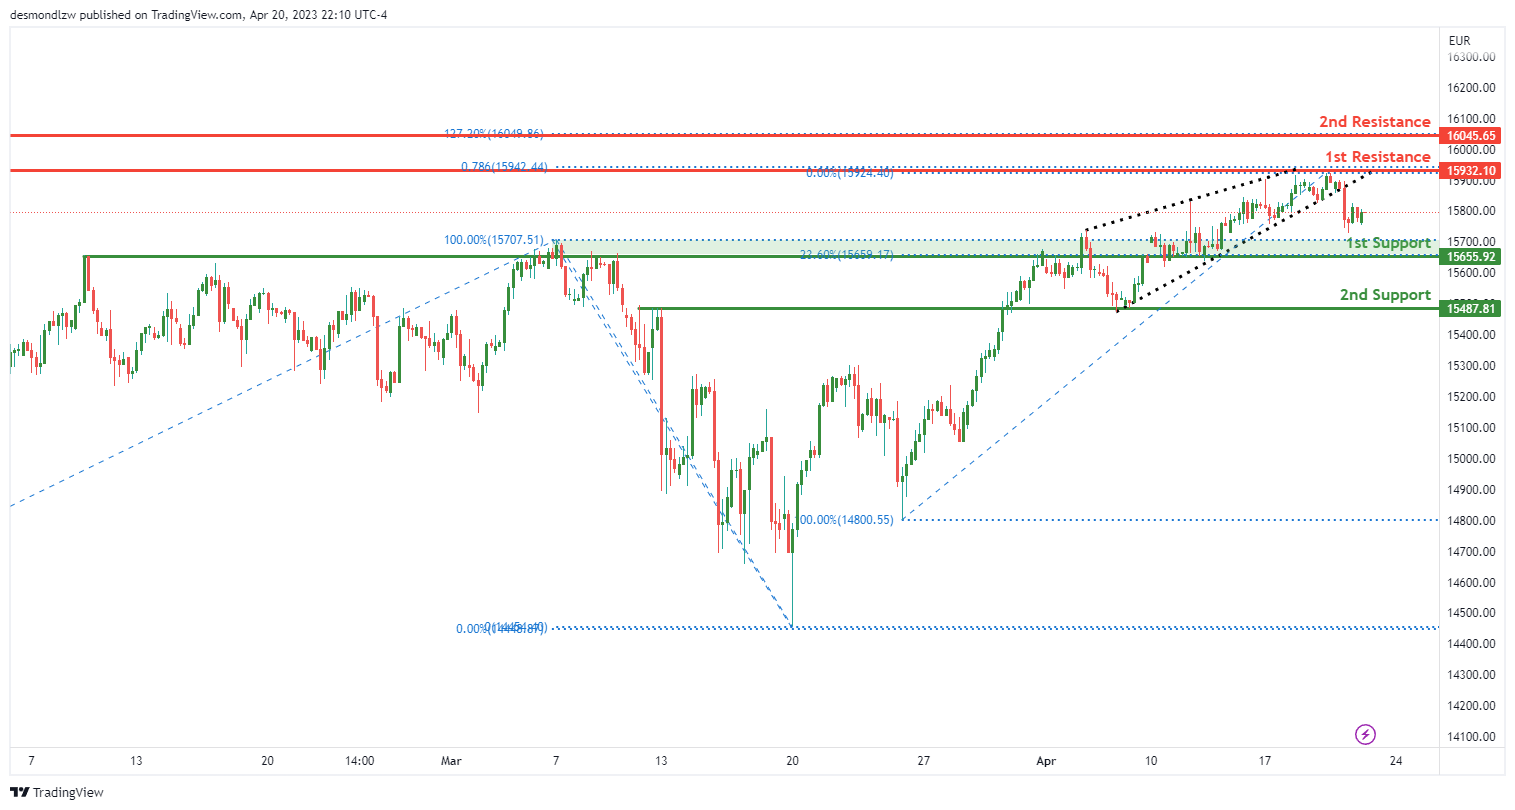
The German DAX (GER30) has been exhibiting bearish momentum on the chart, with a rising wedge pattern that suggests a possible imminent breakout to the downside. With this overall sentiment, the price is expected to continue its bearish trend towards the next support level.
The first support level that the price could potentially reach is at 15655.92, which is an overlap support and also coincides with the 23.60% Fibonacci retracement level. If the price breaks through this level, the next support level to watch out for is at 15487.81, which is another overlap support.
On the other hand, the first resistance level that could potentially hinder the price from going further down is at 15932.10, which is a swing high resistance and coincides with the 78.60% Fibonacci projection level. If the price manages to break through this level, the next resistance level to watch out for is at 16045.65, which is another swing high resistance and coincides with the 127.20% Fibonacci extension level.
BTC/USD:
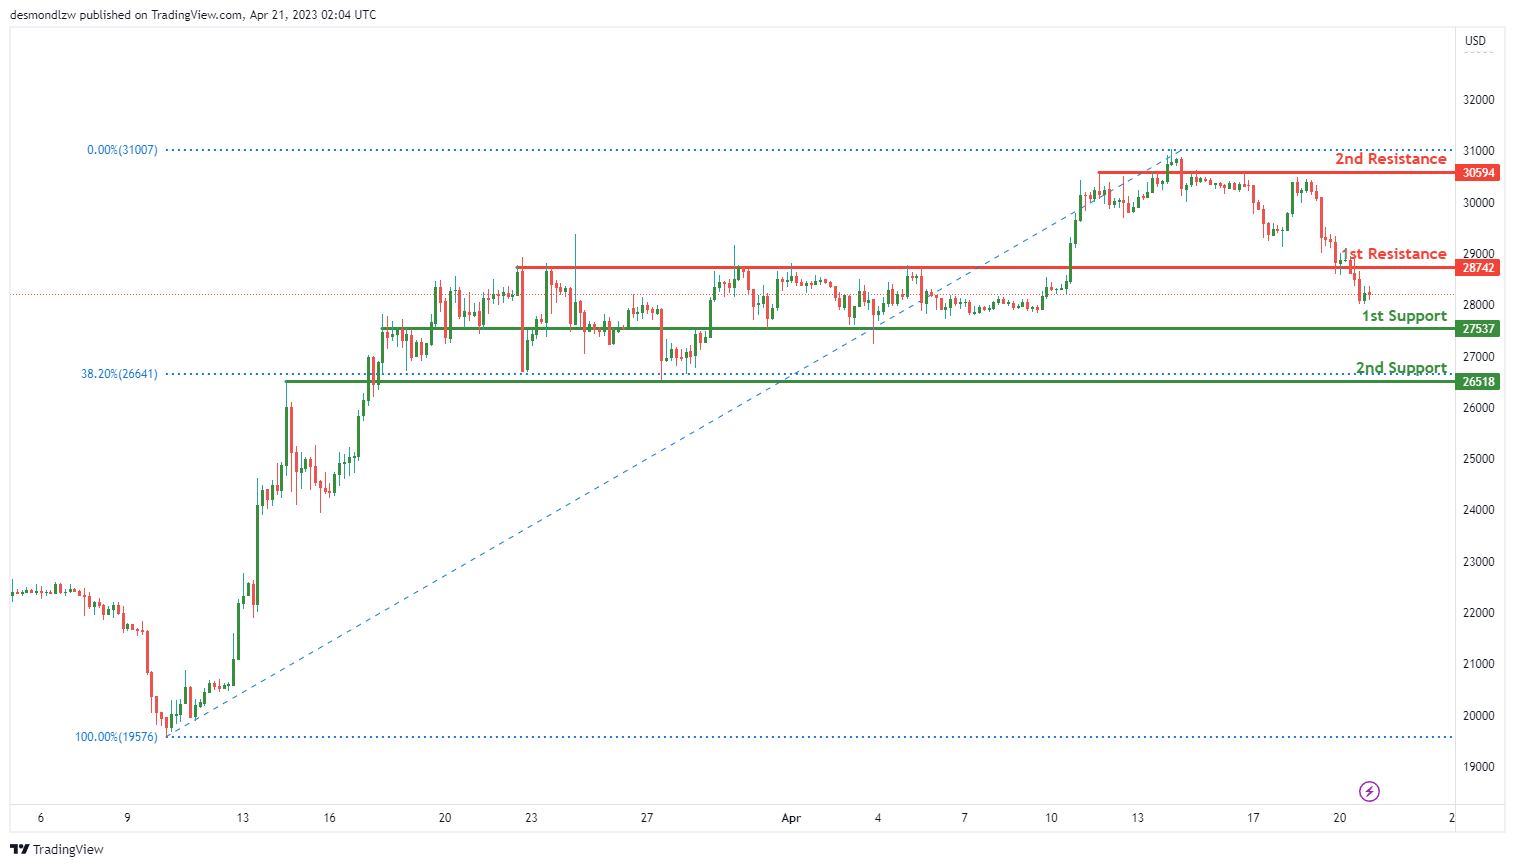
The Bitcoin/USD pair is currently showing bearish momentum, with a potential continuation towards the 1st support level at 27537.
The first support level is a pullback support level, while the second support level at 26518 is an overlap support level, which also corresponds to the 38.20% Fibonacci retracement level. These levels are expected to act as support, as prices continue to move downwards.
On the other hand, the first resistance level at 28742 is a pullback resistance level, while the second resistance level at 30594 is an overlap resistance level. These resistance levels are expected to offer significant resistance to prices as they move upwards.
US500
US500 Bearish Momentum: Possible Breakdown of Key Support Levels
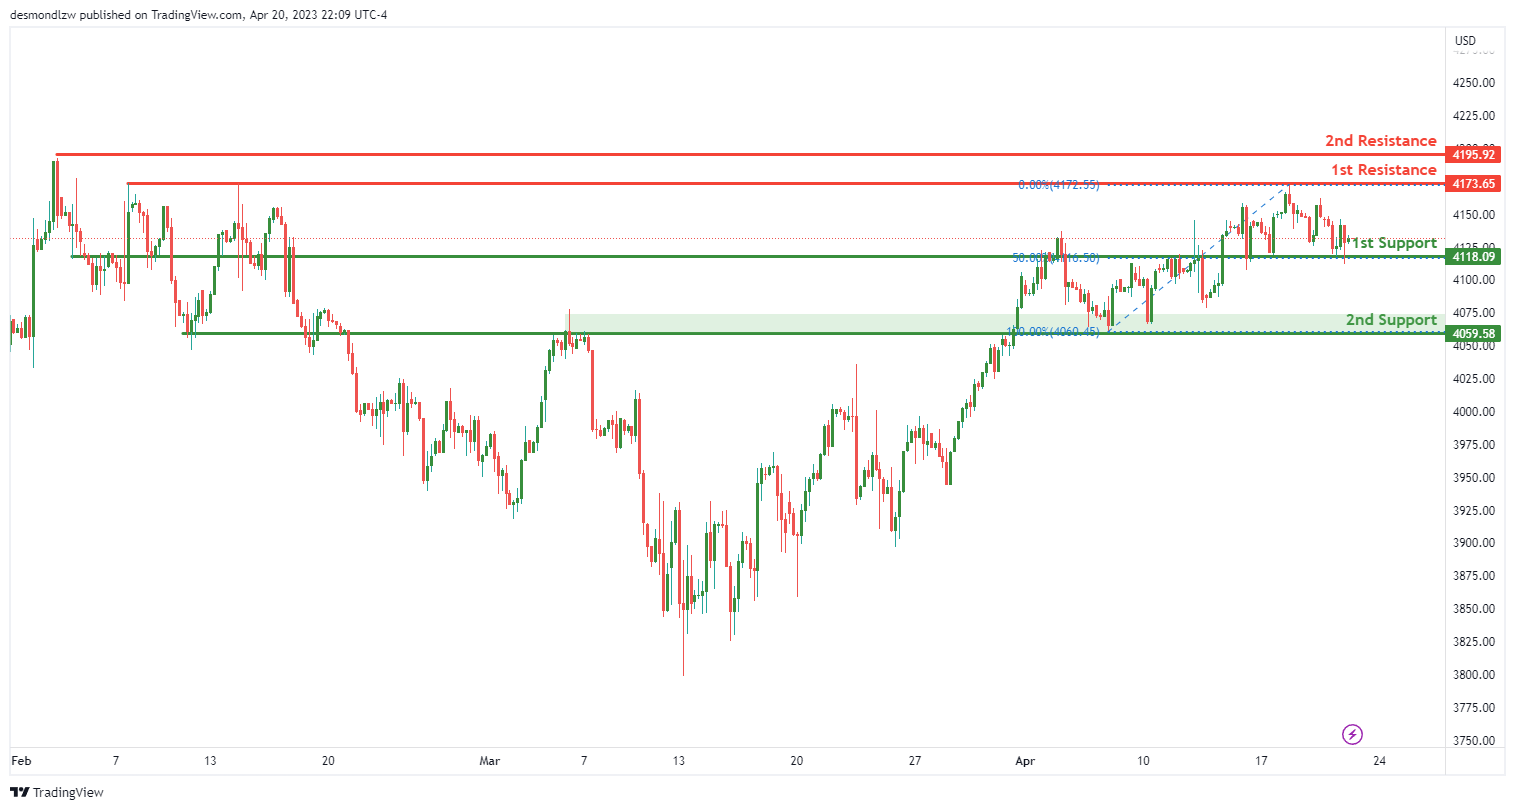
The US500 index has been displaying bearish momentum as it struggles to maintain its position above key support levels. With the price potentially breaking below the 1st support level at 4118.09, traders may anticipate a drop towards the 2nd support level at 4059.58.
Overall, the momentum of the US500 chart is bearish, with prices struggling to maintain support levels. The 1st support level is an overlap support, with a 50% Fibonacci retracement. On the other hand, the 2nd support level is also an overlap support, providing further evidence of a strong support zone.
In terms of resistance, the 1st resistance level is currently at 4173.65, indicating a multi-swing high resistance level. The 2nd resistance level at 4195.92 acts as a swing high resistance, further confirming the bearish momentum of the chart.
If the bearish momentum continues, traders may anticipate a breakdown of key support levels, leading to a potential drop towards the next level of support. Alternatively, if the index manages to maintain its position above support levels and breaks through the resistance levels, a bullish trend may emerge.
ETH/USD:
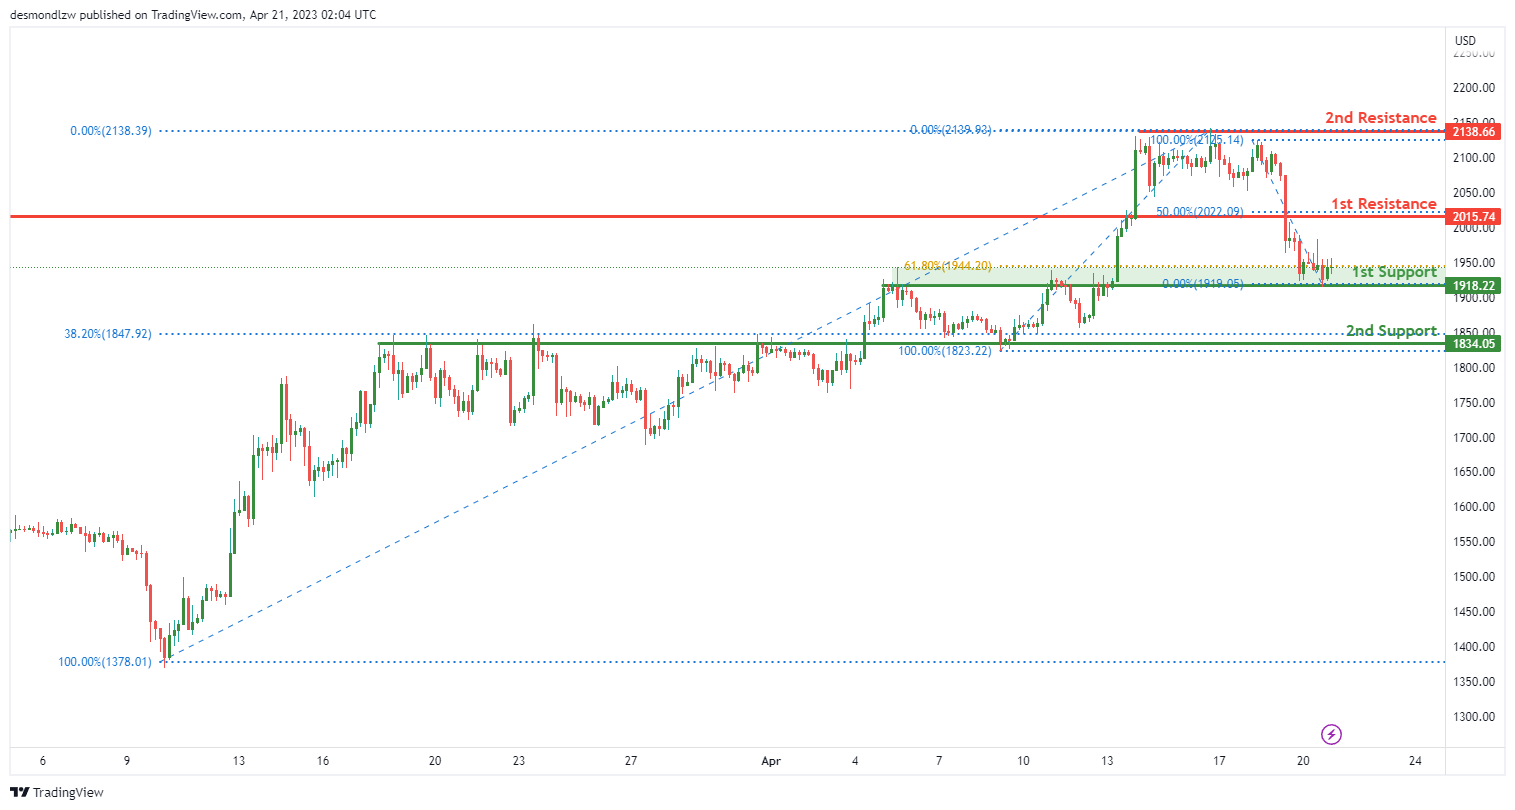
The overall momentum of the ETH/USD chart is bullish. The price could potentially continue to rise towards the first resistance level.
The first support level is at 1918.22, which is an overlap support and a 61.80% Fibonacci retracement level. The second support level is at 1834.05, which is also an overlap support and a 38.20% Fibonacci retracement level.
The first resistance level is at 2015.74, which is a pullback resistance and a 50% Fibonacci retracement level. The second resistance level is at 2138.66, which is a multi-swing high resistance.
Overall, if the bullish momentum continues, we could see the price of ETH/USD rise towards the first resistance level at 2015.74. However, if there is a bearish reversal, the price could potentially drop towards the first support level at 1918.22.
WTI/USD:
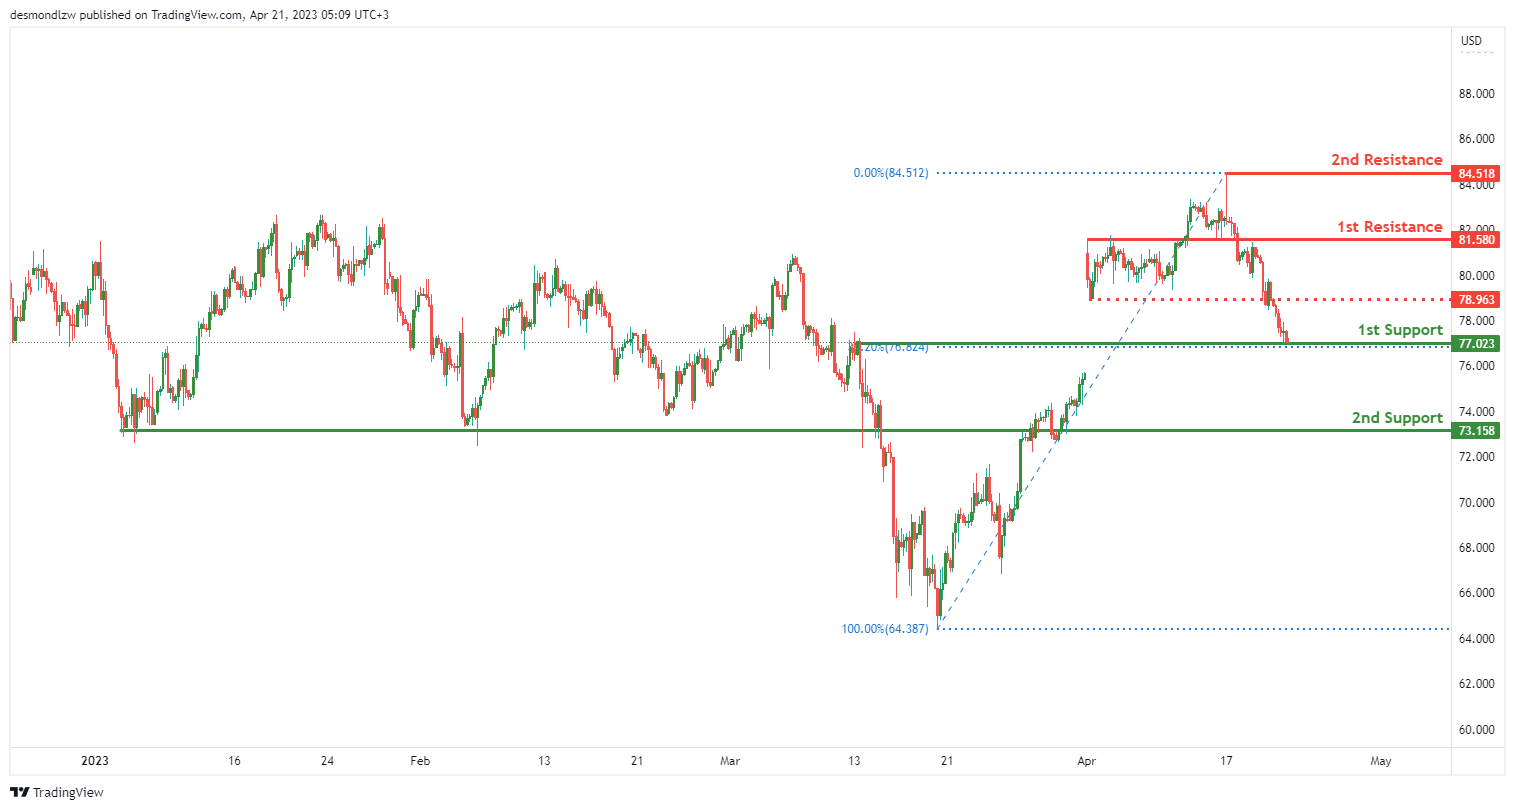
The overall momentum of WTI is bullish. The price is expected to potentially make a bullish bounce off the first support level and head towards the first resistance level.
The first support level is at 77.02, and it is a swing low support. It is also situated at the 38.20% Fibonacci retracement level, which makes it a significant level to watch. The second support level is at 73.15, and it is a pullback support level.
On the resistance side, the first resistance level is at 81.58, and it is an overlap resistance level. It is expected to be a significant level of resistance that could potentially stop the bullish momentum of the price. The second resistance level is at 84.51, and it is a swing high resistance level.
In addition to the above levels, there is also an intermediate resistance level at 78.96, which is a pullback resistance level. This level may act as a minor resistance level that the price may encounter before reaching the first resistance level.
XAU/USD (GOLD):
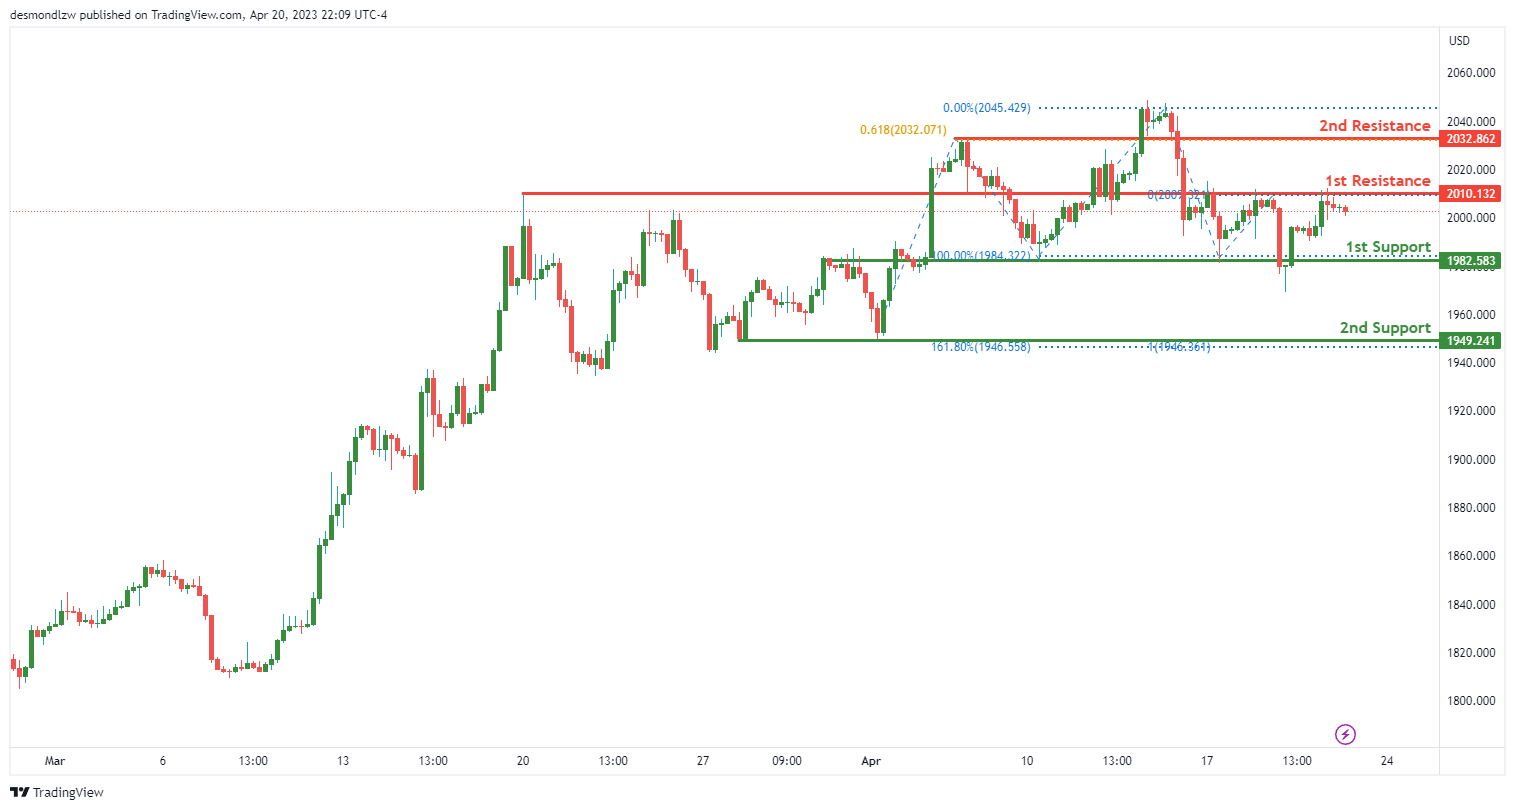
Gold prices are currently experiencing a bearish momentum on the chart. The price could potentially continue its downward movement towards the first support level at 1982.58, which is an overlap support level. If the price breaks below this support level, the next level of support will be the 2nd support at 1949.24, which is a multi-swing low support level and also aligns with the 161.80% Fibonacci Extension level.
On the other hand, the first resistance level is located at 2010.13, which is also an overlap resistance level. If the price manages to break above this resistance level, it could rise towards the second resistance level at 2032.86. This resistance level coincides with a pullback resistance level and the 61.80% Fibonacci projection.
BoE Tenreyro: We may already have tightened too much
BoE Monetary Policy Committee member Silvana Tenreyro, known for her dovish stance, has expressed her belief that interest rates have already been raised more than enough.
Tenreyro stated, "the shape of the inflationary shock stemming mostly from the large increase in energy prices, coupled with the long lags with which monetary policy affects the economy, means that the most likely scenario now is that we undershoot the inflation target in the medium term, meaning 2025."
She emphasized the need for forward-looking forecasts when setting policy, and warned that "we may already have tightened too much" based on UK forecasts.
She likened those advocating for further rate hikes to Milton Friedman's "fool in the shower," explaining, "When the fool starts the water and it runs cold, he keeps turning the faucet and, eventually, because he's impatient, he gets burned."
Fed’s Harker: Some additional tightening may be needed
Philadelphia Fed President Patrick Harker has indicated that "some additional tightening may be needed to ensure policy is restrictive enough to support both pillars of our dual mandate." Harker expects that once this point is reached, which he believes should happen this year, the Fed will "hold rates in place and let monetary policy do its work".
Harker also noted that the economy remains strong and inflation is coming down, albeit slowly. He projected that inflation, currently at a 5% annualized rise in the personal consumption expenditures price index, would fall to 3% to 3.5% this year and reach 2% in 2025. The unemployment rate, currently at 3.5%, is expected to move up to around 4.4% this year amid tepid growth.
The bank president acknowledged the impact of last month's financial sector woes on the economy, stating that "it will take some time to evaluate how recent events may impact overall economic activity and inflation."
Harker added that he expects to see tighter credit conditions for households and businesses, which may slow economic activity and hiring, but the full extent of this impact is still unclear.
Fed officials highlight the need for further action to tame inflation
Atlanta Fed President Raphael Bostic, Dallas Fed President Lorie Logan, and Fed Governor Michelle Bowman have all expressed concerns over the persistently high inflation rate.
Bostic, speaking on CNBC, said that "one more move should be enough for us to then take a step back and see how our policy is flowing through the economy, to understand the extent to which inflation is returning back to our target." He acknowledged that inflation has been much too high, with Fed having raised interest rates by 4.5 percentage points over the past year in an attempt to bring the economy into better balance.
Lorie Logan emphasized the need for sustained improvement in inflation statistics, an economy evolving as forecast, and a change in the factors underlying inflation, such as the hot labor market and imbalance in supply and demand. She reiterated the concern, stating, "As you surely know, inflation has been much too high."
Bowman also highlighted the importance of the Fed's focus on lowering inflation. She said, "Lately, as you know, the Fed has been focused on lowering inflation, which is essential if we want to support a growing economy and rising incomes." Bowman added, "We clearly need to continue to work to bring inflation down."
Fed’s Mester foresees further tightening to ensure downward trajectory of inflation
Cleveland Federal Reserve President Loretta Mester emphasized the need for further tightening in monetary policy to ensure a "sustained downward trajectory" of inflation. She pointed out that "demand is still outpacing supply in both product and labor markets and inflation remains too high."
To tackle the persistent inflation, Mester suggested that monetary policy will need to "move somewhat further into restrictive territory", with fed funds rate "moving above 5%" and "real fed funds rate staying positive for some time". However, she also acknowledged that the tightening journey is closer to its end than the beginning, with future rate decisions being dependent on the economy's performance.
Mester expects the unemployment rate to rise to between 4.5% and 4.75% and inflation to ease to 3.75% this year. She projects that inflation will reach the central bank's 2% target by 2025. In response to an audience question, Mester emphasized the Fed's aim for a "soft landing" and mentioned that she expects slow growth, well below 1%, in the current economic environment.