Sample Category Title
EUR/CHF Daily Outlook
Daily Pivots: (S1) 0.9773; (P) 0.9806; (R1) 0.9824; More...
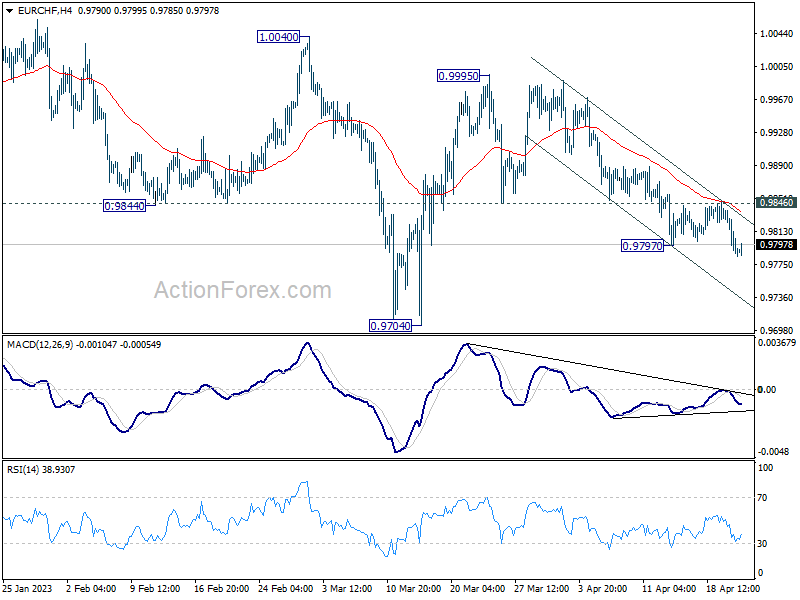
Break of 0.9797 indicates that fall form 0.9995 is resuming. Intraday bias is back on the downside. Current decline is seen as part of the whole corrective pattern from 1.0095. Deeper fall would be seen to 0.9704 support and below. For now, further decline will remain in favor as long as 0.9846 resistance holds, in case of recovery.
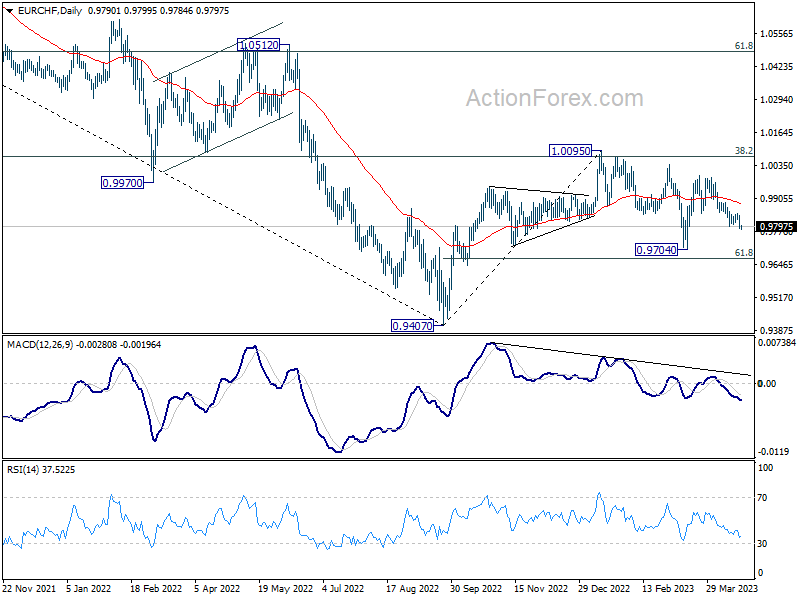
In the bigger picture, prior rejection by 55 W EMA (now at 0.9989) and 38.2% retracement of 1.1149 to 0.9407 at 1.0072 suggests that medium term outlook is staying bearish. That is, down trend from 1.2004 is not completed yet and is in favor to resume through 0.9407 at a later stage. However, decisive break of 1.0095 resistance will raise the chance of bullish trend reversal. Rise from 0.9407 should then target 1.0505 cluster resistance (2020 low at 1.0505, 61.8% retracement of 1.1149 to 0.9407 at 1.1484).
GBP/JPY Daily Outlook
Daily Pivots: (S1) 166.73; (P) 167.35; (R1) 168.21; More...
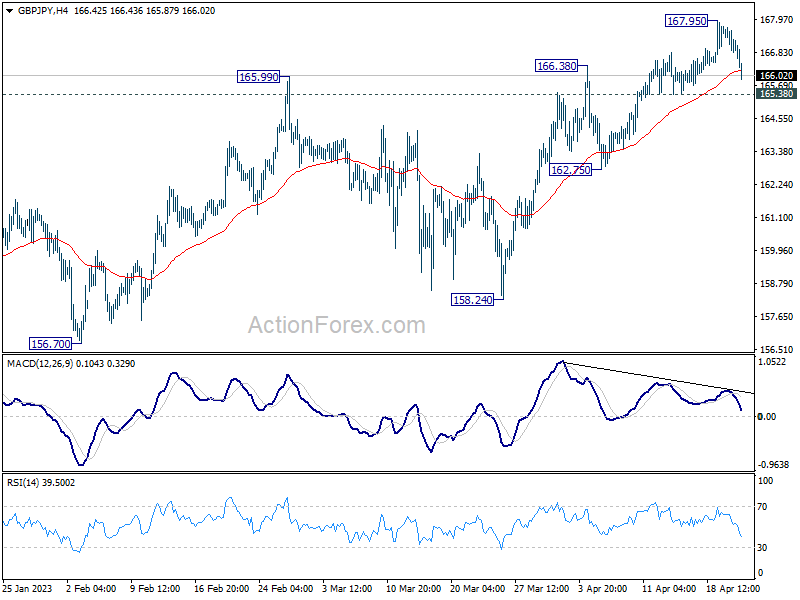
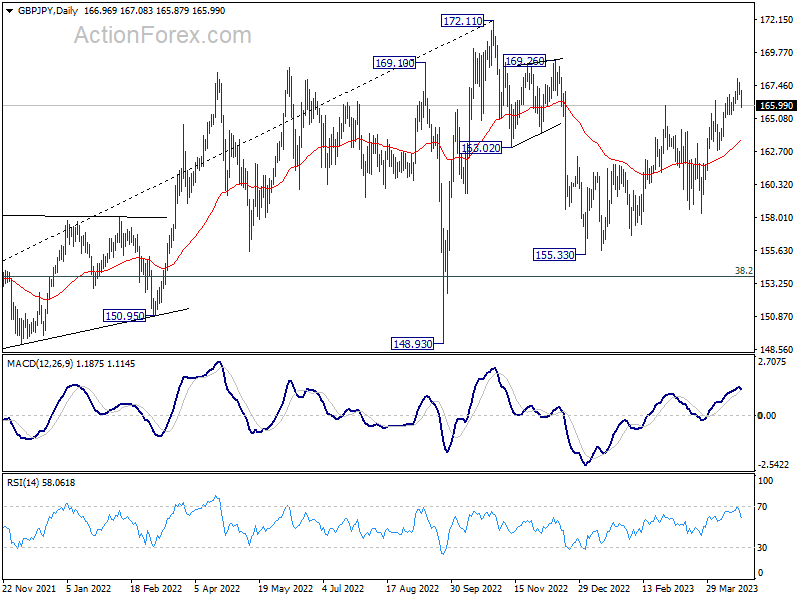
Intraday bias in GBP/JPY is turned neutral with current retreat. Another rise will remain in favor as long as 165.38 minor support holds. On the upside, break of 167.95 will resume the rebound from 155.33 to 169.26 resistance. However, firm break of 165.38 will argue that the corrective pattern from 172.11 is starting another falling leg. Intraday bias will be back on the downside for 162.75 support and below.
In the bigger picture, as long as 38.2% retracement of 123.94 (2020 low) to 172.11 (2022 high) at 153.70 holds, medium term bullishness is retained. That is, larger up trend from 123.94 (2020 low) is still in progress. Break of 172.11 high to resume such up trend is expected at a later stage.
EUR/USD Technical Analysis
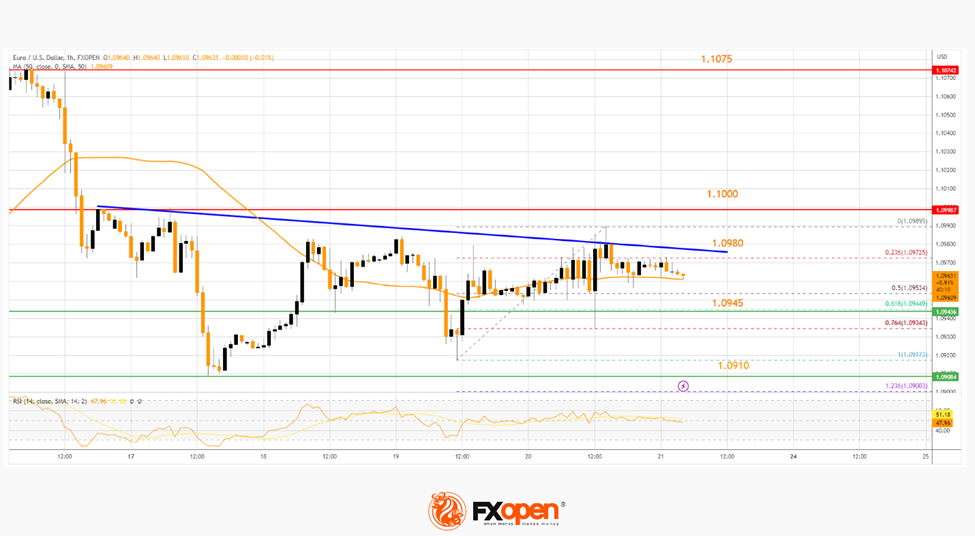
On the hourly chart of EUR/USD at FXOpen, the pair attempted a recovery wave from the 1.0910 zone. The Euro climbed above 1.0945 but it is facing strong resistance near 1.0980 against the US Dollar.
The pair is now consolidating above the 50-hour simple moving average at 1.1000. On the upside, immediate resistance is near a connecting bearish trend line at 1.0980.
The next major resistance is near the 1.1000 level. A break above the 1.1000 resistance zone could spark another strong increase. In the stated case, it could rise toward the 1.1075 resistance.
Conversely, the pair might start another bearish wave from the 1.0980 level. Initial support is near the 50-hour simple moving average. The next major support is near 1.0945. Any more losses might resend the pair toward the 1.0910 support in the near term.
AUD/USD and NZD/USD At Risk of More Losses
AUD/USD started a fresh decline from the 0.6770 resistance zone. NZD/USD is also moving lower and might decline below the 0.6150 support.
Important Takeaways for AUD/USD and NZD/USD
- The Aussie Dollar started a fresh decline below the 0.6740 support against the US Dollar.
- There is a key bullish trend line forming with support at 0.6715 on the hourly chart of AUD/USD at FXOpen.
- NZD/USD failed to clear the 0.6220 resistance zone and reacted to the downside.
- There is a major bearish trend line forming with resistance near 0.6180 on the hourly chart of NZD/USD at FXOpen.
AUD/USD Technical Analysis
On the hourly chart of AUD/USD at FXOpen, the pair faced rejection near 0.6770. The Aussie dollar started a fresh decline and traded below the 0.6740 support against the US Dollar.
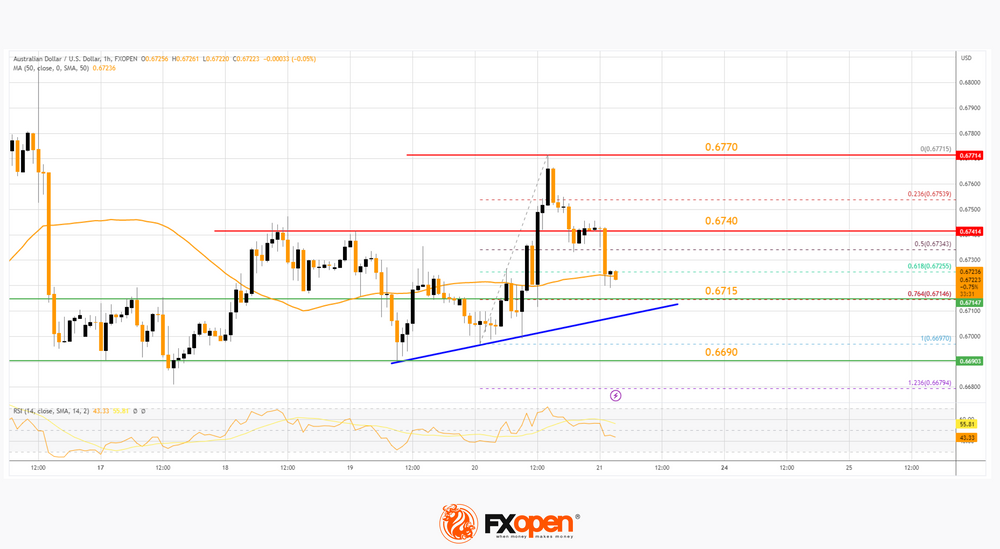
There was a move below the 61.8% Fib retracement level of the upward move from the 0.6697 swing low to the 0.6771 high. It is now trading below the 50-hour simple moving average. It seems like there is a major support waiting near a key bullish trend line with support at 0.6715.
The trend line coincides with the 76.4% Fib retracement level of the upward move from the 0.6697 swing low to the 0.6771 high. If there is a downside break below the trend line, the pair could decline toward 0.6690.
The next support could be the 0.6660 level, below which the bears could aim for a test of the 0.6600 zone in the coming days.
On the upside, the AUD/USD pair is facing resistance near the 0.6740 level. The next major resistance is near the 0.6770 level. A close above the 0.6770 level could start another steady increase in the near term. The next major resistance could be 0.6850.
NZD/USD Technical Analysis
On the hourly chart of NZD/USD at FXOpen, the pair also started a fresh decline after it failed to clear the 0.6220 resistance. The New Zealand dollar dipped below 0.6180 to move into a bearish zone against the US Dollar.
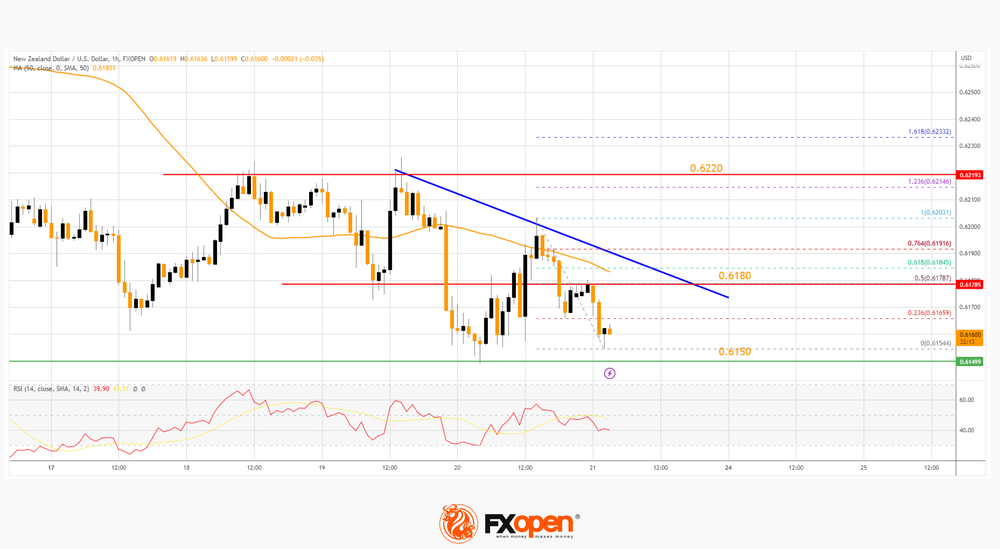
The pair tested the 0.6150 support zone and is currently consolidating losses. On the upside, an initial resistance is near the 50-hour simple moving average at 0.6150.
There is also a major bearish trend line forming with resistance near 0.6180. The trend line coincides with the 50% Fib retracement level of the downward move from the 0.6203 swing high to the 0.6154 low.
The next major resistance is near the 0.6220 level. A clear move above the 0.6220 level might even push the pair toward the 0.6265 level. Any more gains might open the doors for a move toward the 0.6300 resistance zone in the coming days.
If not, the pair could resume its decline. Immediate support is near the 0.6150 level. The next support could be the 0.6120 zone. If there is a downside break below the 0.6120 support, the pair could gain bearish momentum.
In the stated case, the pair may perhaps decline toward the 0.6080 support level. Any more losses could set the pace for a test of the 0.6050 level.
BoJ May Start to Give More Hints on Policy Normalization
- Japan sticky inflation (excluding fresh food & energy) continued to increase for 10 consecutive months.
- Flash manufacturing PMI for April has shown signs of bottoming out from contraction.
- AUD/JPY reversed from key medium-term resistance at 90.70.
Market participants in the financial markets will turn their focus to the Bank of Japan’s monetary policy decision outcome next week on Friday, 28 April under the helm of a new Governor, Kazuo Ueda.
Why is it important?
During a decade-long tenure of the prior Governor Haruhiko Kuroda, BoJ has changed the course of the financial markets by the unleash of close to US$3.4 trillion worth of liquidity into the global financial system under the ambitious expansionary “Abenomics” program to combat the risk of global deflation triggered by the aftermath of the Great Financial Crisis of 2008.
Right now, the world is facing a sticky heightened inflationary situation where developed nations’ central bankers have started to ramp up interest rates hike and reverse their respective Quantitative Easing programs since early 2022. The remaining laggard among them is BoJ which still maintained a negative policy interest rate at -0.10%.
Hence, a slight change in monetary policy from ultra-easy to normalization under new BoJ Governor Ueda is likely to see significant funds flow reversal back into Japan as Japanese investors have accumulated a mountain of offshore investments that amounted to more than two-thirds of Japan’s GDP due to the” Yield Curve Control” (YCC) program enacted in 2016 to put a cap on the yield of the 10-year Japanese Government Bond (JGB).
If such a scenario happens, it can send shockwaves and a dominoes effect in the global financial markets where fixed income yields in the US and Europe may spike up and an increased risk of capital flight out of emerging markets.
Maintaining dovish monetary guidance over local economic realities
Since the last “monetary policy shock teaser” from BoJ in December 2022 where it widened the band of its YCC program to allow the yield of the 10-year JGB to move by 50 basis points from 25 basis points on either side of the 0% target, and market participants took such a move as a precursor to an end of ultra-easy monetary policy in Japan and started to increase bullish and bearish bets on JPY and JGB respectively.
Since taking over the helm at BoJ in early April, Ueda has started to tone down the speed of BoJ’s monetary policy normalization and gave clear guidance during the Spring IMF meeting that BoJ is likely to maintain its ultra-low interest rate at this juncture; indicating no rush to implement a policy change.
However, the latest local economic data do not seem to support the continuation of ultra-easy monetary policy for Japan. Even though the headline inflation rate for March dipped to 3.2% year-on-year from February’s print of 3.3%, 2 consecutive months of growth declined from January’s 4.3% but implied sticky inflation as measured by excluding fresh food and energy (core core inflation rate) continued to climb to 3.8% year-on-year in March from 3.5% in February, ten consecutive months of expansion to hover close to a four-decade high.
In addition, manufacturing activities have started to show signs of bottoming out from contraction; the April flash Jibun Bank Manufacturing PMI increased to 49.5 from a final reading of 49.2 in March, indicating its highest reading since October 2022.
Hence, with inflation staying above BoJ’s target of 2% for a year and manufacturing activities have started to improve, BoJ may start to give an implicit heads-up on laying the groundwork for the normalization of its ultra-easing policy in the coming meeting next Friday with hints coming from the latest inflationary and growth data projections in its economic quarterly outlook report to be released on the same day as well as Ueda’s press conference.
AUD/JPY Technical Analysis – Retreated from key medium-term resistance ahead of BoJ
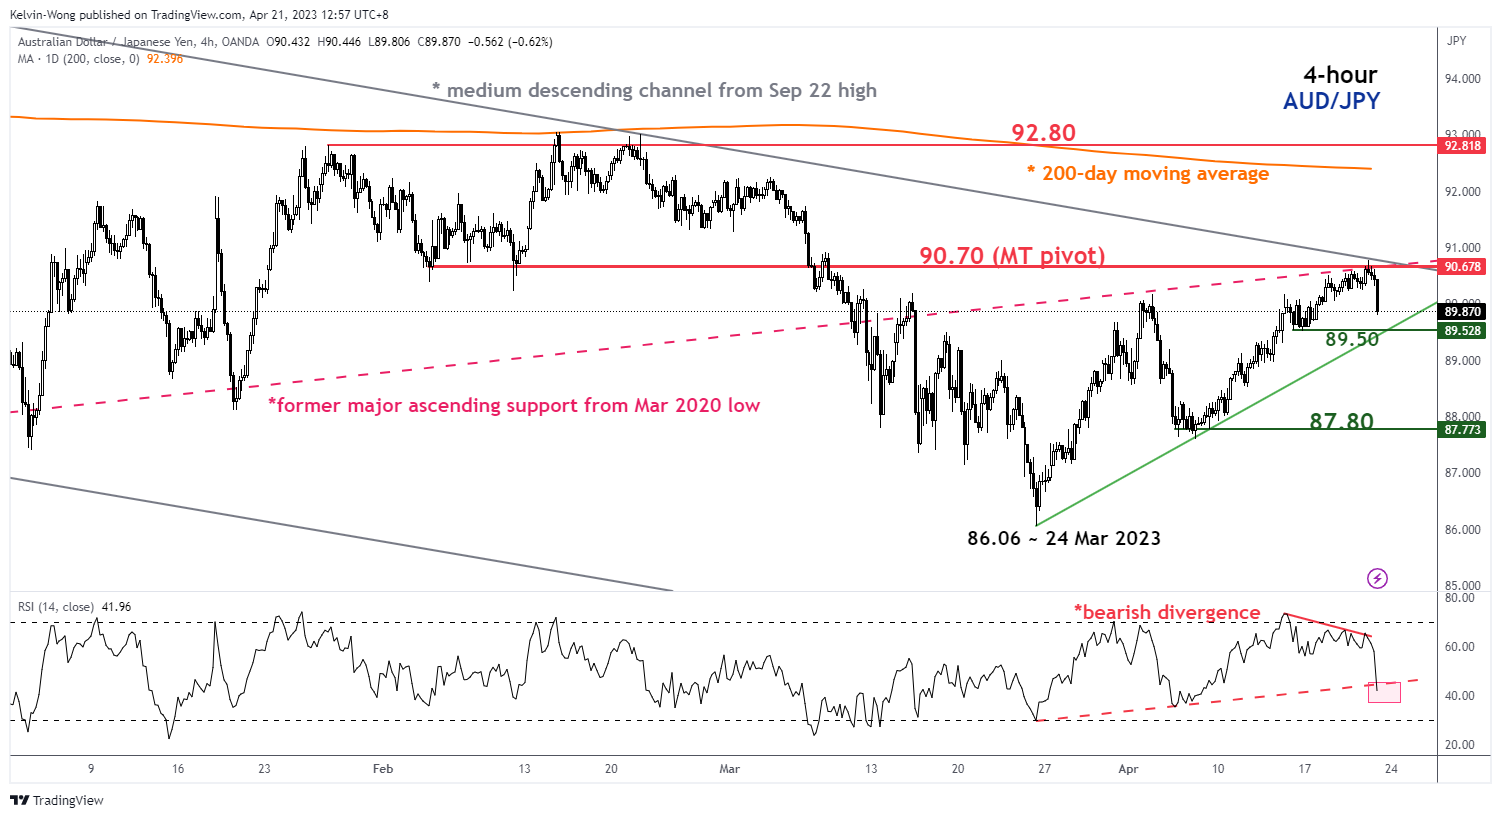
Source: TradingView as of 20 Apr 2023 (click to enlarge chart)
The AUD/JPY cross rate has staged a negative reversal from its 90.70 key medium-term pivotal resistance today with several bearish elements. Hence, the latest price actions suggest there is an increased risk that the recent 470 pips rally from its 24 March 2023 low of 86.06 is likely to be considered as a minor corrective rebound (dead cat bounce) within a medium-term downtrend phase in place since September 2022 high of 98.69.
In addition, short-term downside momentum has resurfaced as indicated by the 4-hour RSI oscillator where it is now breaking below key corresponding support at the 44% level after a prior bearish divergence seen at its overbought region.
A break below 89.50 immediate support may expose the next support at 87.80. However, a clearance with a 4-hour close above 90.70 negates the bearish tone for a squeeze up towards the next resistance at 92.80 (swing high areas of 26 January/15/22 February 2022 & close to the key 200-day moving average).
Bitcoin (BTCUSD) At Possible Support Area
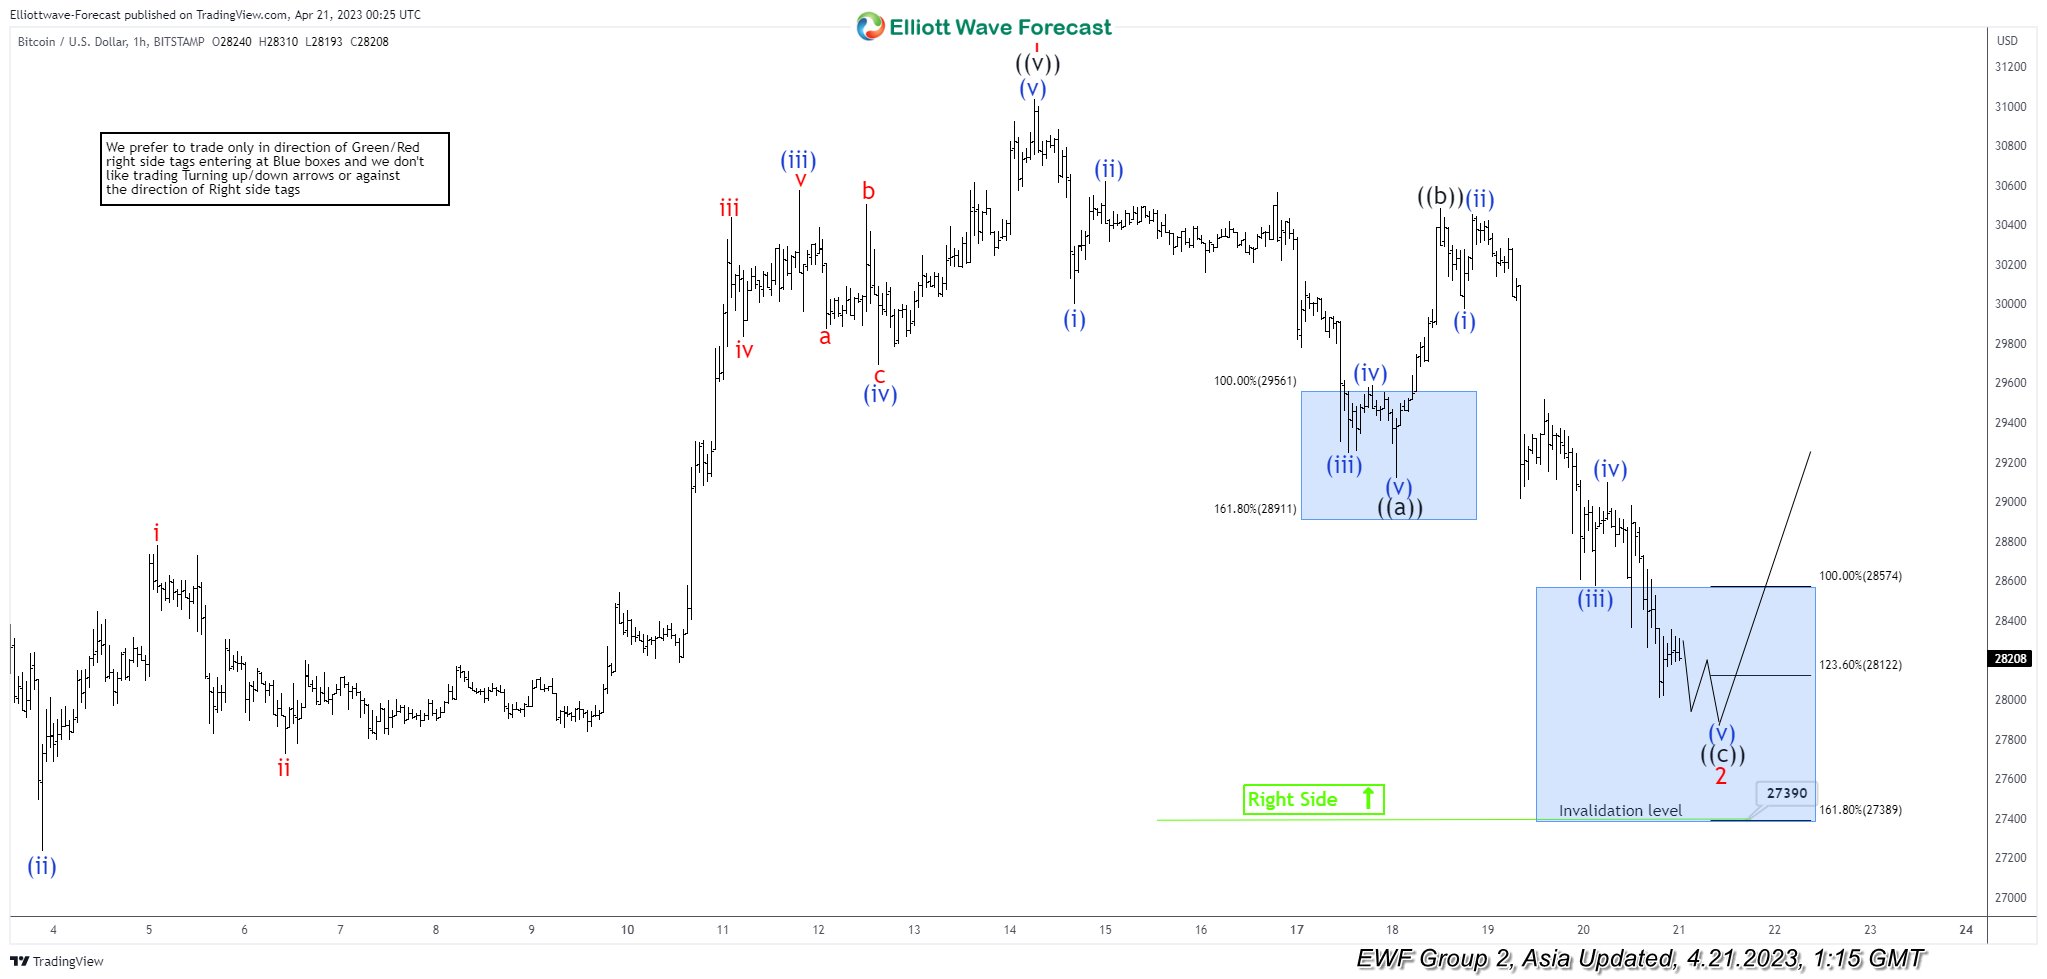
Bitcoin cycle from 3.10.2023 low has ended with wave 1 at 31035. Internal subdivision of wave 1 unfolded as a 5 waves impulse. Wave ((i)) ended at 20874 and pullback in wave ((ii)) ended at 19893. The crypto-currency extends higher in wave ((iii)) towards 29380 and pullback in wave ((iv)) ended at 26541. Final leg wave ((v)) ended at 31035 which completed wave 1 in higher degree. Pullback in wave 2 is in progress to correct cycle from 3.10.2023 low, but it’s near complete.
Internal subdivision of wave 2 is unfolding as a zigzag Elliott Wave structure. Down from wave 1, wave (i) ended at 30001 and wave (ii) ended at 30620. Wave (iii) ended at 29247 and wave (iv) ended at 29590. Final leg wave (v) ended at 29122 which completed wave ((a)). Rally in wave ((b)) ended at 30483. Bitcoin then extended lower in wave ((c)) and it has already reached the extreme area from 04.14.2023 high at 27390 – 28574. This area is measured from 100% – 161.8% Fibonacci extension of wave ((a)).Near term, while above 27390 (1.618 Fibonacci extension level), expect the crypto currency to extend higher or rally in 3 waves at least.
BTCUSD 60 Minute Elliott Wave Chart
BTCUSD Elliott Wave Video
https://www.youtube.com/watch?v=NGpQaoA6TJA
S&P 500 Grinds Major Resistance
NZD/USD tests support
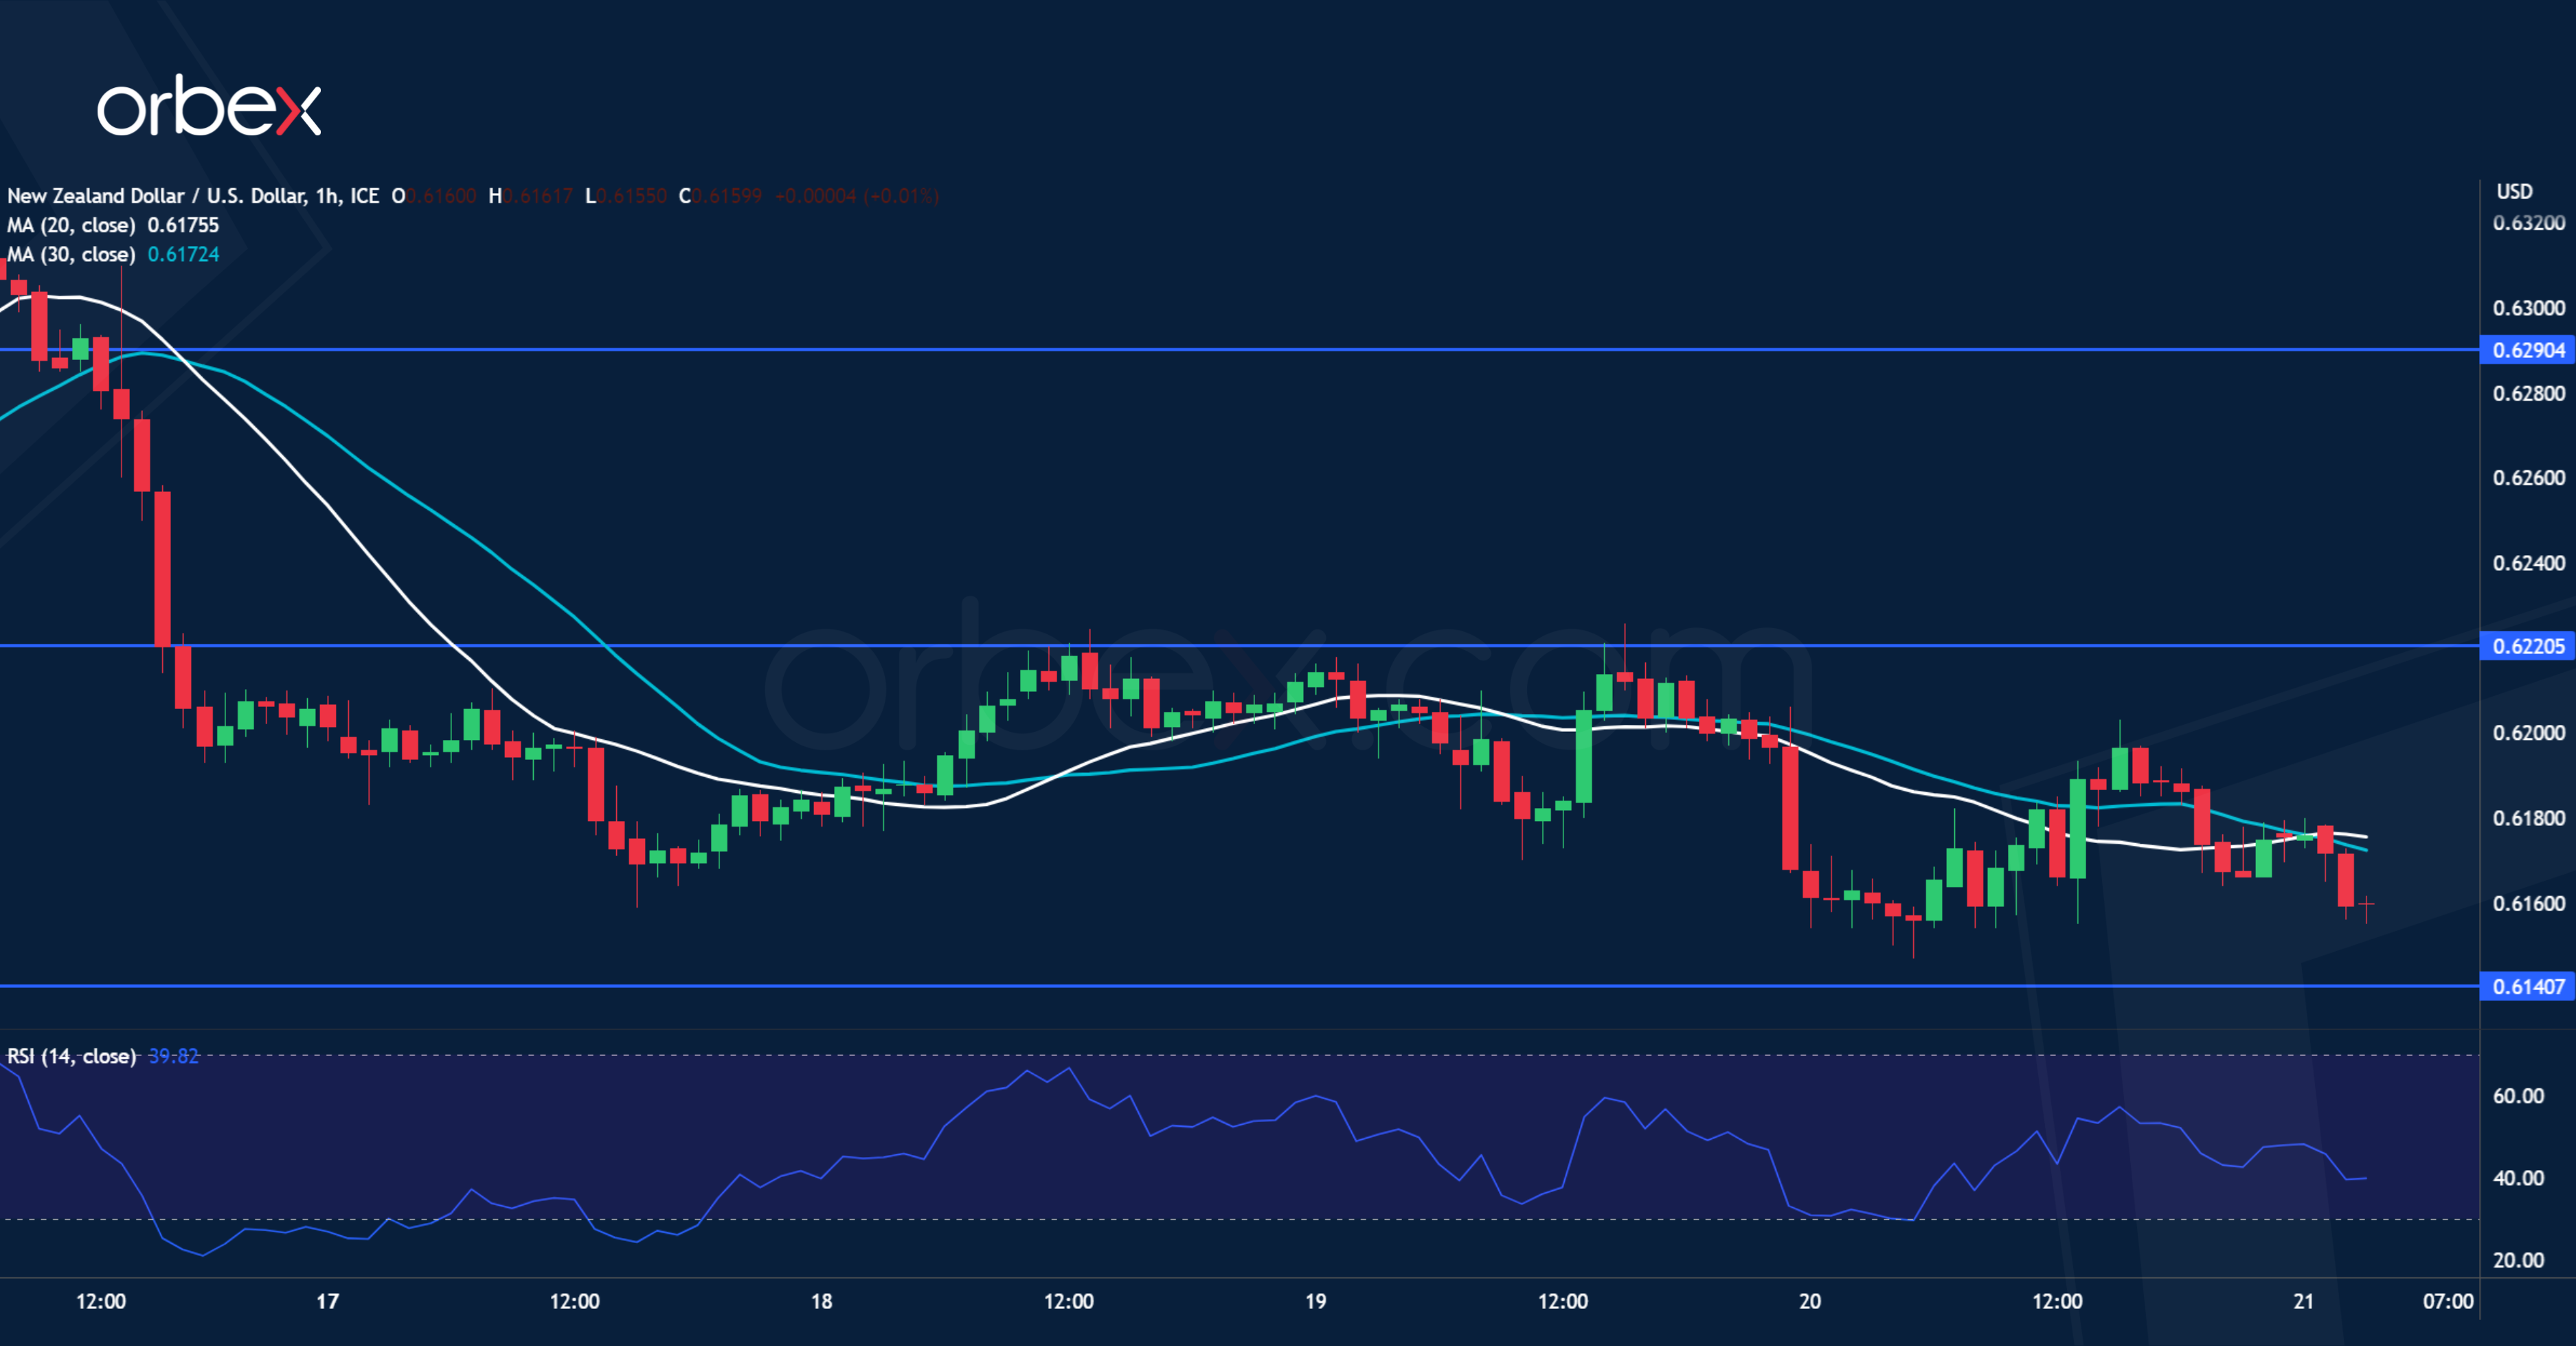
The New Zealand dollar fell after the Q1 data showed a clear slowdown in inflation. The pair is struggling to preserve its gains from the March rally with a drop below the base of the recent surge at 0.6180 suggesting that the path of least resistance might be down. A limited rebound came to a halt at 0.6220, turning it into a fresh supply zone. The bulls’ failure to push back would make the kiwi vulnerable to a broader sell-off. A break below 0.6150 may attract momentum sellers and send the pair past the March low of 0.6090.
USD/CHF struggles for bids
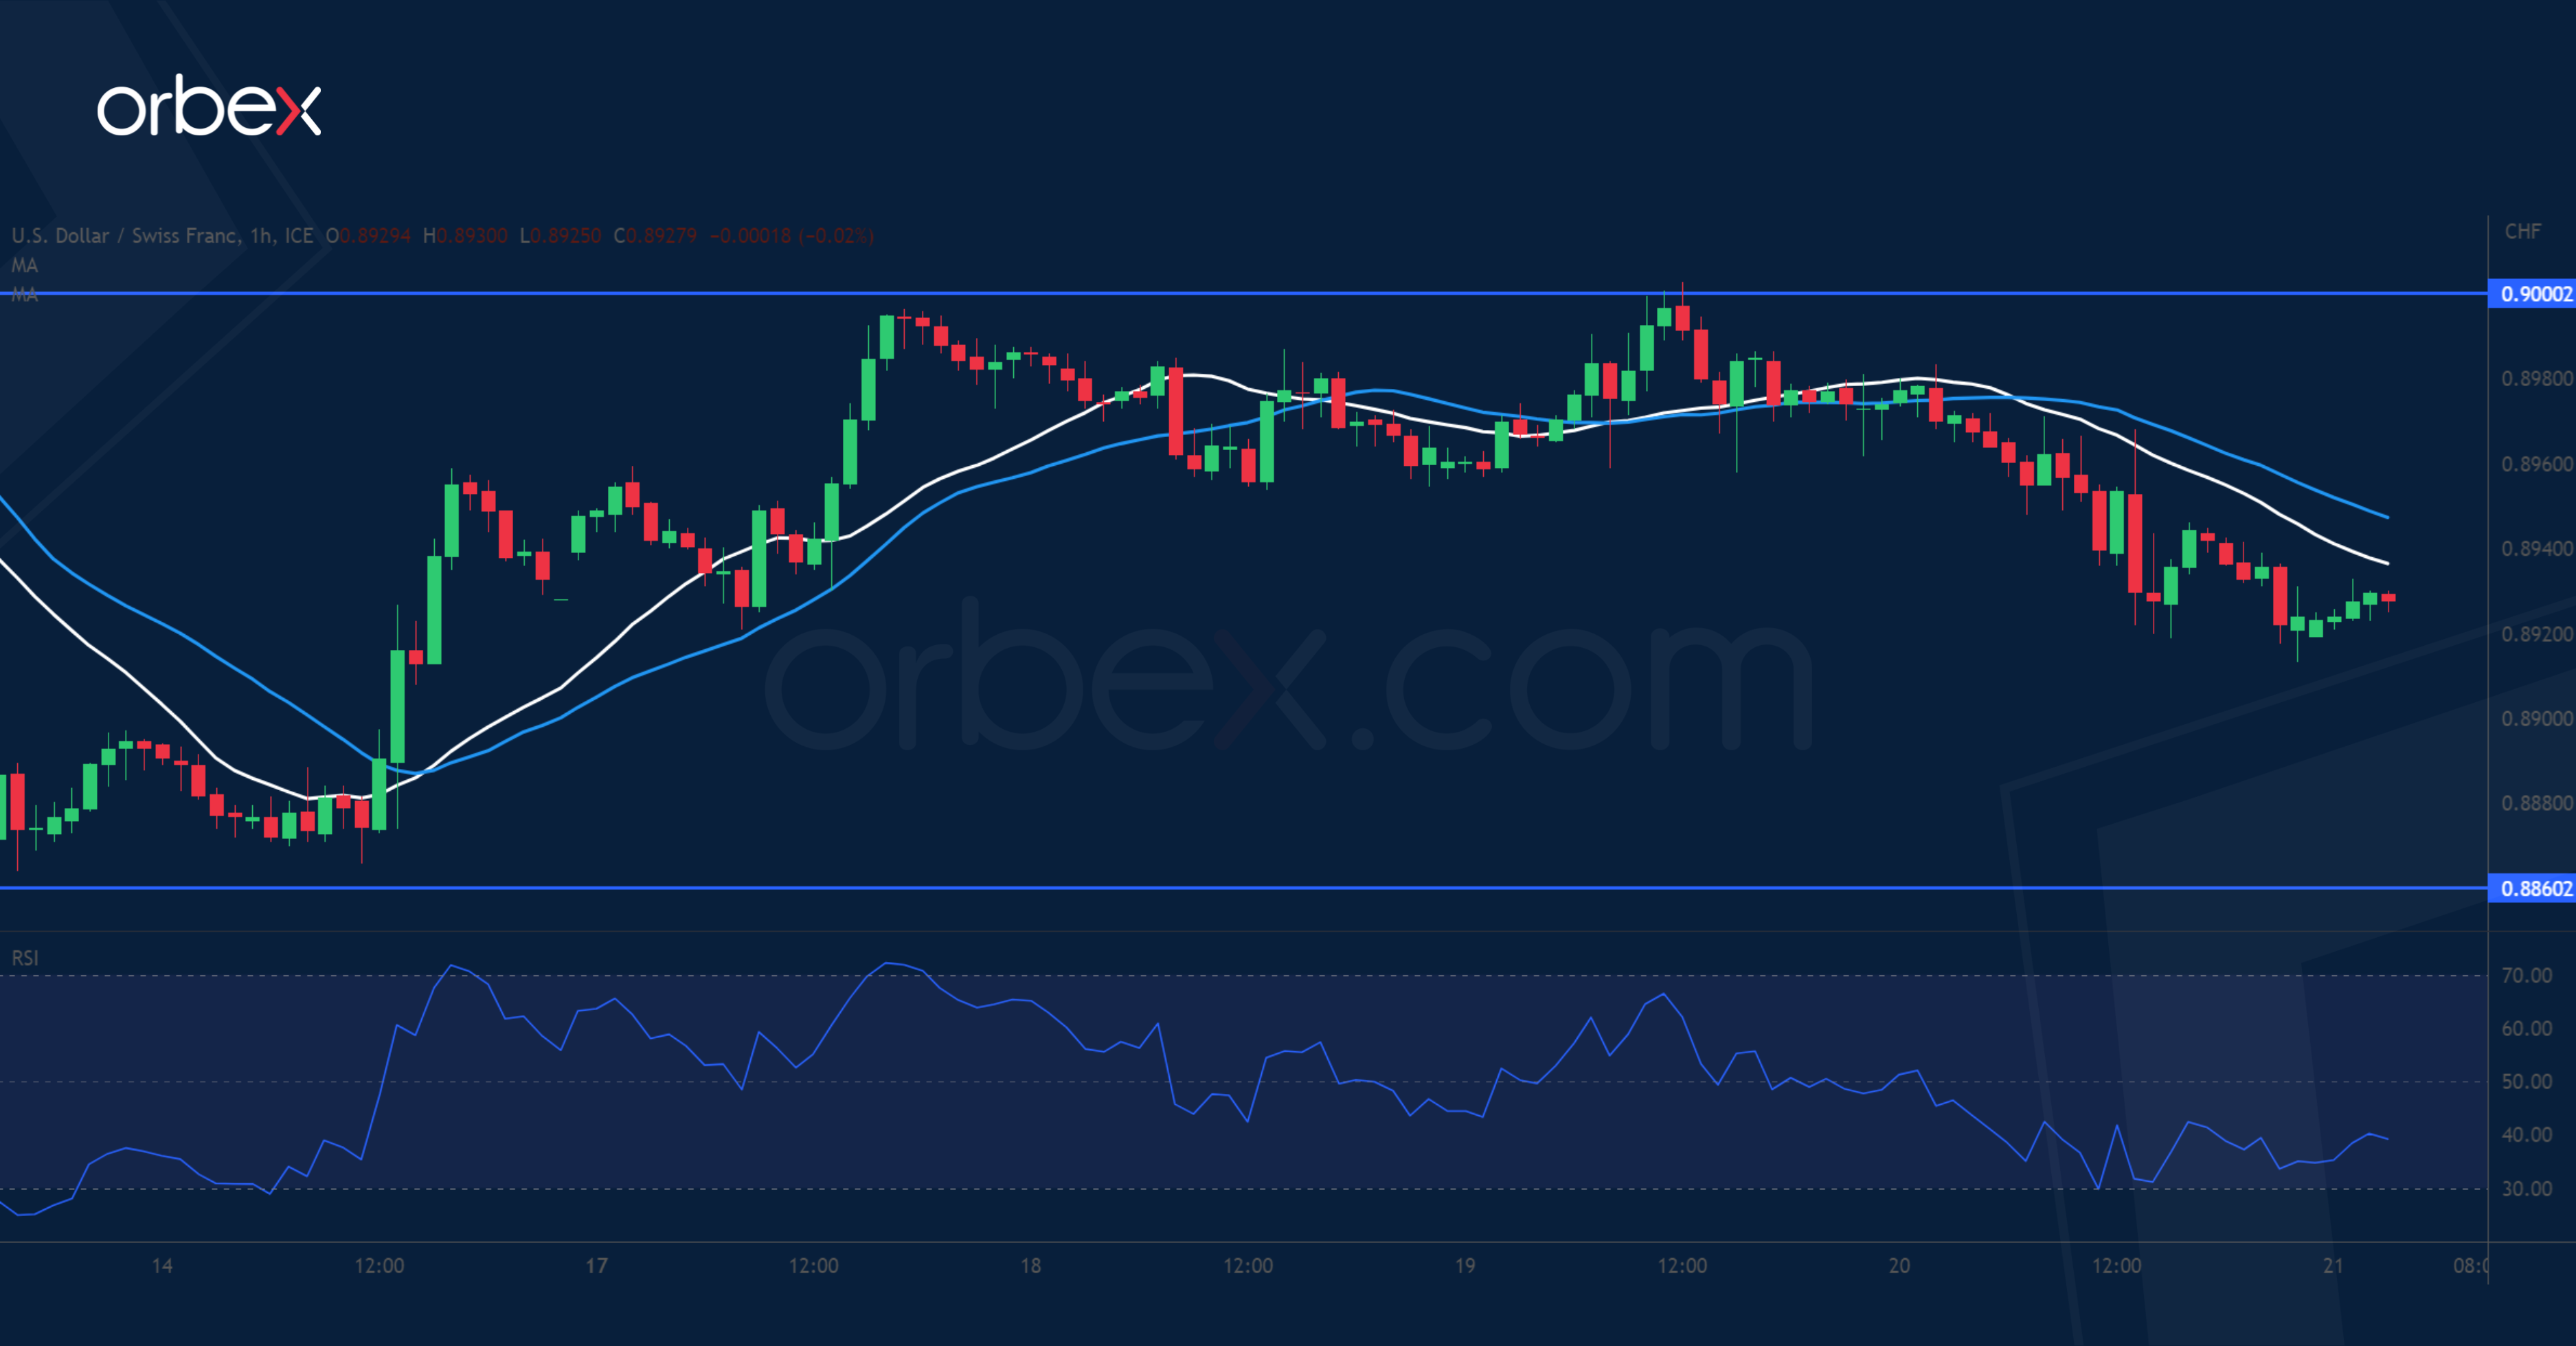
The US dollar fell as rising jobless claims rekindled recession worries. This week’s rebound has struggled to conserve its momentum with the price turning lower at the psychological level of 0.9000. Medium-term sentiment has become downbeat following the breach of the daily support at 0.9080 and the bears are likely to sell into strength at rebounds. A fall below 0.8920 would reaffirm weakness and expose the greenback to another leg of decline past 0.8860 then towards January 2021’s lows around 0.8780.
US 500 seeks support
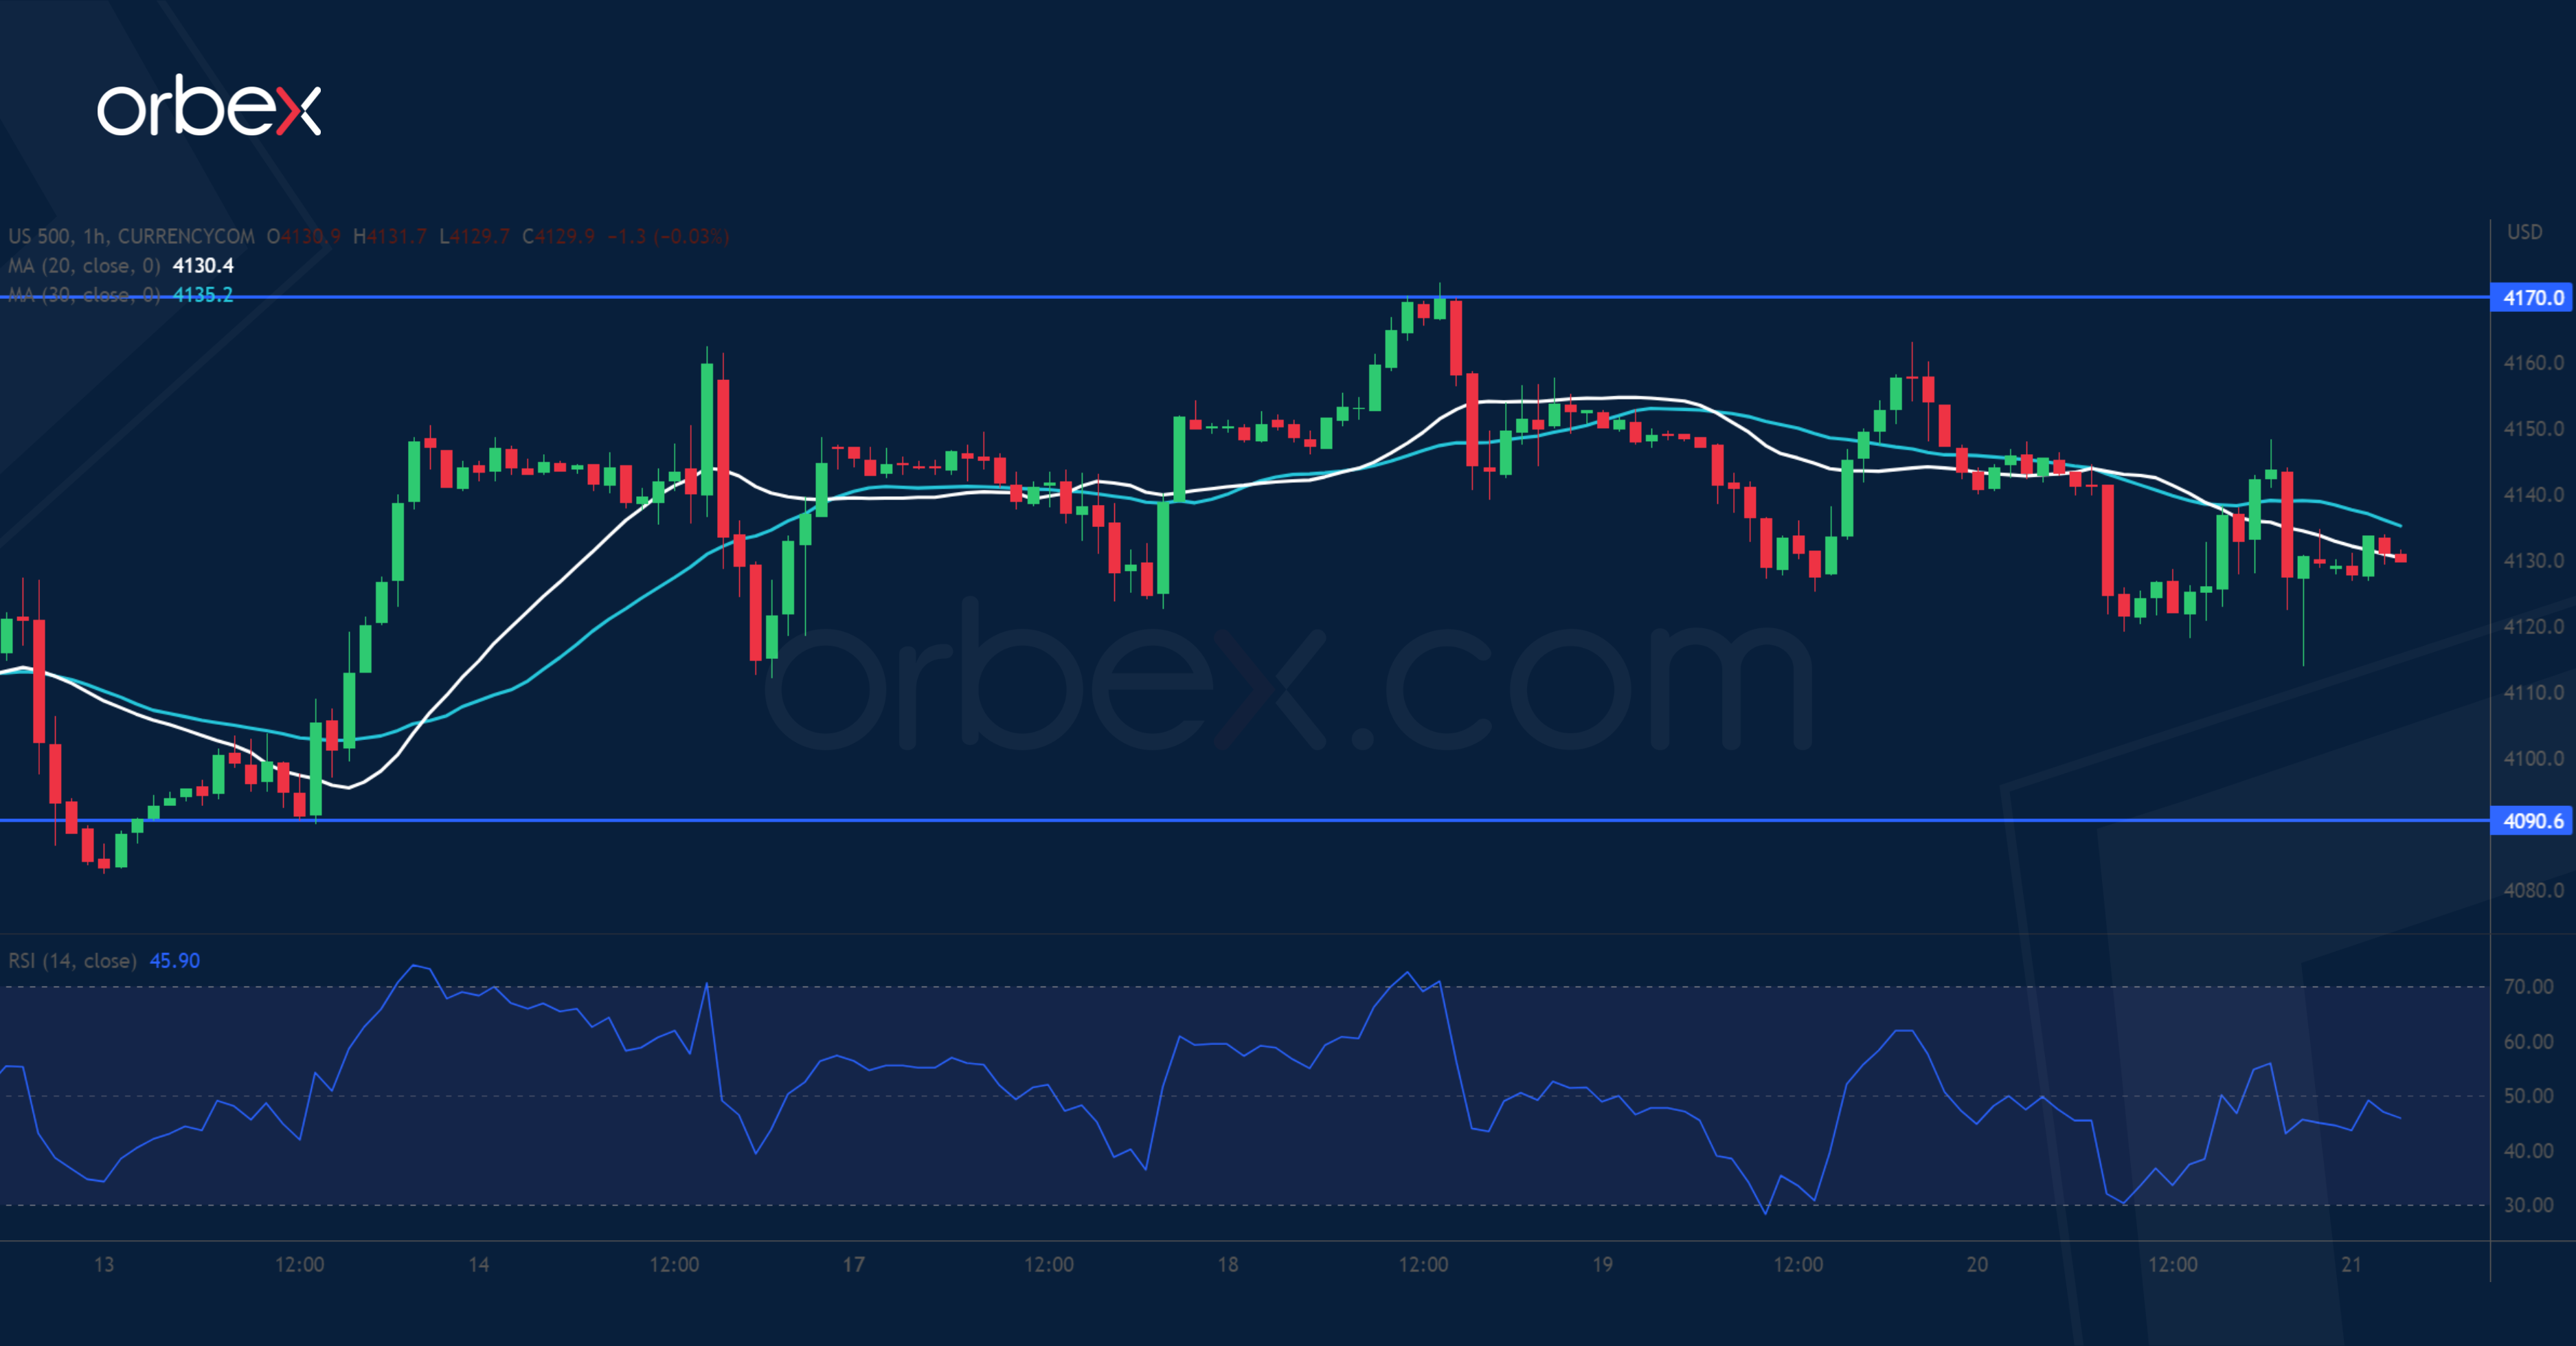
The S&P 500 edged lower, dragged by Tesla’s earnings miss. The price is grinding a key supply zone 4170- 4190 near this year’s peak. The choppy price action is a sign of hesitation as the bulls take some chips off the table. On the opposite side, offers could be expected from those looking to sell high and an initial break below 4125 may have given them an edge. 4090 on the 20-day SMA is a key level to keep the rally intact in the short-term and its breach may trigger a correction towards the psychological level of 4000.
The Dollar Still Looks Fragile
Markets
Recent hawkish repositioning yesterday did run into resistance. The US 2-y and 10-y yield failed to overcome resistance at 4.26% and 3.64% respectively. 3% also proved a too high bar for the German 2-y yield. The correction in yields already started in Europe and accelerated in the US. US jobless claims rose more than expected (245k) and the Philly Fed business outlook unexpectedly declined, supporting a rebound in bonds. In a steepening move, US yields ceded between 10.1 bps (2-y) and 4.6 bps (30-y). Most Fed governors (Mester, Bostic, Harker) ‘implicitly’ supported the case for the Fed hiking by 25 bps in May and then taking a pause to assess the potential tightening of monetary conditions (Mester). German yields eased between 7.3 bps (2-y) and 4.7 bps (30-y). The minutes of the March ECB meeting showed that a big majority supported a 50 bps step at that time. The ECB will keep a close eye at financial stability issues but the focus remains on inflation at the upcoming meeting(s). The decline in yields didn’t help equities. US indices lost between 0.33% (Dow) and -0.8% Nasdaq. The combination of lower yields and a mild equity correction still translated into a modest loss for the dollar. DXY closed near 101.84. EUR/USD finished the day at 1.097. USD/JPY eased from the high to the low 134 area. Oil also declined further (close $81.1) p/b).
Asian equities this morning join the risk-off correction on WS yesterday with most indices losing between 0.3% and 1.5%. US yields are declining marginally further (1.0-1.5 bps). The dollar shows no clear directional trend (DXY 101.85; USD/JPY 133.85; EUR/USD 1.096). Later today, the market focus will be on the PMI releases. The EMU composite index is expected unchanged at 53.7. We assume that only a big surprise will have an impact on the ECB assessment. The focus is on the April CPI data and the Lending survey to be published ahead of May meeting. The US composite PMI is expected at 51.2 from 52.3. In the wake of the financial turmoil and given the Fed focus on financial conditions, the market could be more sensitive to a negative surprise in US PMI’s. So, yields might ease a bit further going into the weekend. The dollar still looks fragile. In a ST perspective EUR//USD 1.0909 marks this week’s low with 1.0831 first important support. The topside of the ST range stands at 1.1076. After stronger/higher than expected labour data and inflation this week, UK retail sales printed on the soft side of expectations (sales ex-auto fuels 1.0% M/M). Sterling is losing marginally in a first reaction (EUR/GBP 0.882).
News and views
Japanese inflation came in higher than expected in March. Headline prices rose 3.2% y/y, (3.3% in February) amid government subsidies for utilities bills. If it weren’t for the measures, inflation would be about 4.3%. Excluding energy, inflation topped a 3% estimate to come in at 3.1% y/y (same as in February). Stripping the index down to a standard core gauge (ex. energy and food), inflation accelerated from 3.5% to 3.8% (vs 3.6% expected), the fastest since end 1981. The data come ahead of a Bank of Japan policy meeting next week. It’s the first one with the new governor Ueda at the helm. Today’s data pressures the BoJ’s ultra-easy policy stance. Bloomberg, citing sources, reported earlier this week that officials are wary of scrapping yield curve control so soon after the financial turmoil clouded the outlook. But they did add that the final policy decision will be made after assessing economic data and developments in financial markets up until the last moment. Japanese yields remain stoic, with moves confined between a tight -0.8 and +0.8 bps range. The yen appreciates a tad with USD/JPY easing from 134.24 at the open to 133.87 currently. EUR/JPY falls to 146.72 after having rallied almost 5 big figures since early April.
UK consumer confidence rebounded by more than expected in April. The GfK index rose from -36 to -30 (-35 expected). It’s the highest reading since February last year and a recovery for a third month straight. The series hit an all-time low in September 2022 (-49) in the midst of the cost-of-living crisis. While there’s still some way to go – confidence is barely better than just shortly after the start of the pandemic – Joe Staton at GfK said that especially the 8 point surge in consumer’s 12 month personal finance prospects is a dramatic change. It suggests that household finances are stronger and withstanding double-digit inflation better than thought. The assessment for the economy the year ahead also improved (-34 from -40) as did the view on buying major purchases (from -33 to -28).
Focus Increase on the US Debt Ceiling
Market movers today
PMI figures will draw markets' attention today. In the euro area, services will probably remain the main growth (and inflation) driver for now, but it will be interesting to see whether manufacturing finally shows some positive spill-over effects from the Chinese re-opening. US PMIs will shed some light on economic activity after a blurry March picture.
We also have several potential Moody's and S&P sovereign debt ratings coming out for Ireland, France and Italy among others. We expect an upgrade of Ireland.
The 60 second overview
The confrontation between US and China continues as US President Biden will try to limit US investments in several key parts of the Chinese economy.
Yesterday, we had a string of comments from various Federal Reserve officials stating the need for bringing down inflation; more tightening could be needed and thus pushing Fed funds above 5%. However, some also argued for prudence and the need to monitor the credit tightening from banks as well. Hence, this indicates that we are getting closer to the end of the tightening cycle.
US Treasury yields declined on the back of weaker US data and negative sentiment in the equity market and the comments from the Federal Reserve could not change this.
There is increasing focus on the debt ceiling after the lower than expected tax payments indicating that the Treasury may run out of money already in June as discussed in our note from yesterday, Research US - X-date looms closer as 'Tax Day' disappoints, 20 April. If we go back to 2011 during the debt ceiling "crunch" in July 2011 and until Mid-august, when the US Treasury was expected to "run out of money", 10Y US Treasury yields fell from 3% to 2.05%, while Bunds rallied some 70bp and the Bund spread widened from 45bp to 70bp. Hence, the debt ceiling debacle will not only have impact on US Treasuries but also a big impact of European government bond yields.
We have also had a string of comments from ECB officials regarding the need for tighter monetary policy among others Lagarde saying that there is "a little way to go on that path". There will be more speeches today from various ECB officials.
Equities: Global equities lower yesterday with consumer staples, utilities, and industrials higher. Hence, not a classic sector rotation but at the end of the day it was a defensive turn and risk-off tone dominating with VIX ticking higher. Many Fed speakers yesterday combined with a busy reporting schedule and eye-catching macro numbers did not make it easy for investors to find out which way to lean. In US Dow -0.3%, S&P 500 -0.6%, Nasdaq -0.8% and Russell 2000 -0.5%. Asian stocks are lower this morning and to a large extent matching the moves we saw on Wall Street yesterday. US and European futures are mixed this morning.
FI: US Treasury yields declined on the back of weaker US data and negative sentiment in the equity market and moderate hawkish comments from the Federal Reserve could not change this.
FX: US yields fell yesterday as macro data disappointed, but EUR/USD remains in consolidation around 1.0950. Japanese core inflation surprised to the upside during the night and we continue to expect the BoJ to phase out YCC in either June or July. Next round of QT from the Riksbank is on the cards today, but thus the FX impact of previous auctions has been muted.
Credit: Secondary credit spreads moved decisively higher yesterday, with iTraxx Xover widening almost 11bp and Main 2.3bp. The spread between Sr financials and iTraxx Main widened for the first day since early April, indicating slightly rising concern about the banking sector.
Nordic macro
Today, the Riksbank will sell SEK750m +/-750m each of SGB1061 (Nov-29) and SGB1056 (Jun-32). Note that the Riksbank has increased the tolerance interval for the volumes to +/-750m in each bond (previously +/-375m). This increases the flexibility for the Riksbank and as we interpret it, mean that they can abstain from selling any bonds if they do not find bids attractive enough. That said, we would expect to see good demand for the two SGBs up for sale today.
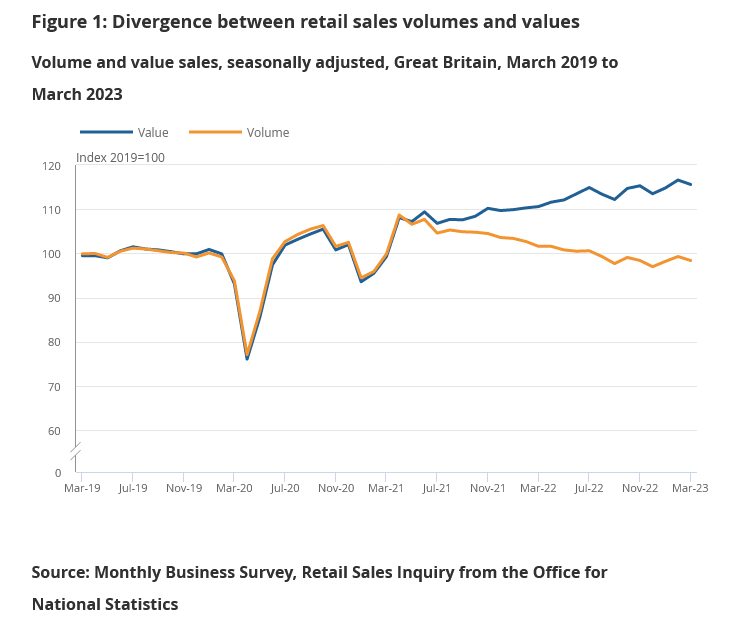
UK retail sales volume down -0.9% mom in Mar, value down -0.9% mom
In volume term, UK retail sales fell -0.9% mom in March, below expectation of -0.5% mom. Ex-fuel sales declined -1.0% mom, below expectation of -0.7% mom. For the year, retail sales was down -3.1% yoy while ex-fuel sales was down -3.2% yoy, versus expectation of -3.1% for both.
In value term, retail sales was down -0.9% mom and up 4.5% yoy. Ex-fuel sales was down -0.6% mom and up 6.0% yoy.