Sample Category Title
Manufacturing Woes Continue as Services Become Increasingly Optimistic
Another mixed day of trade in stock markets on Friday as UK consumers become increasingly less pessimistic but spend less and global manufacturing slumps further.
UK consumers less pessimistic but spending slips in March
Economic data on the UK consumer has been a mixed bag on the face of it this morning but a deeper dive into the figures suggest there’s a little more cause for optimism than the headline numbers suggest.
The most obvious reason for this is that an abundance of rainfall weighed on retail sales last month, as is often the case, depressing the number in a manner you wouldn’t expect to be repeated as we move through spring and into the summer (I say that hopefully from London).
The GfK consumer confidence survey, while still deeply negative, rebounded more than expected this month continuing the trend of improving sentiment since the Autumn. The economy avoiding recession and being in a better position now than anyone expected naturally helps this.
What’s more, the survey highlights two things. Firstly, UK consumers are a pessimistic bunch and secondly, their spending doesn’t necessarily reflect this. That said, the squeeze on household finances remains severe and despite wage growth remaining strong, inflation remains much higher which will continue to weigh on spending.
Can services continue to perform strongly amid increased pressure on budgets?
Strong services and weak manufacturing activity remains the overwhelming trend in the PMI surveys this morning and that is evident from Europe to Japan and Australia. Global trade is suffering but the services sector remains incredibly resilient for now. The question now is whether the darkening global outlook will catch up to services or whether the sector – which in most of these countries accounts for comfortably the largest part of the economy – can power a soft landing and eventually a strong recovery.
That looks overly optimistic at this stage but it may complicate the jobs of policymakers that will be concerned about the implications for inflation and interest rates and if the latter rise further and stay high, it will eventually catch up with the economy and spending overall. Tighter credit conditions on the back of last month’s mini-banking crisis will also complicate things over the remainder of the year and likely weigh on services activity.
ECB officials highlight persistent core inflation, emphasize data-dependent approach
ECB Vice President Luis de Guindos recently highlighted the persistence of core inflation, stating that it may be more persistent than markets anticipated. He emphasized that "core inflation remains very sticky," and while he believes it will eventually come down, the starting point is very high.
De Guindos also stressed that ECB will continue to communicate monetary policy on a meeting-by-meeting basis, with a data-dependent approach, rather than shifting to a forward-guidance strategy for several months. He added, "I believe that the current approach will be maintained for a few months until the evolution of inflation and the effects of our measures become clearer."
In a separate statement, ECB Governing Council member Ignazio Visco echoed de Guindos' concerns regarding stubborn core inflation. He emphasized the need for caution when setting policy, recommending that decisions be made on a meeting-by-meeting basis.
European Parliament Passes a Law on Cryptocurrencies
On Thursday, MEPs voted 529 to 29 with 14 abstentions to approve Markets in Crypto-assets (MiCA), a law that creates a regulatory framework for the circulation of cryptocurrencies. On the one hand, regulation can help the wider adoption of cryptocurrencies. On the other hand, how much can end users like it if the law allows tracking transfers in cryptocurrencies and blocking suspicious transactions?
The real impact of the law will be judged later — whether it will control or protect users. In the meantime, their attention is more focused on the bearish dynamics of BTCUSD around the psychological level of USD 30k — we have been talking about this since last Wednesday.
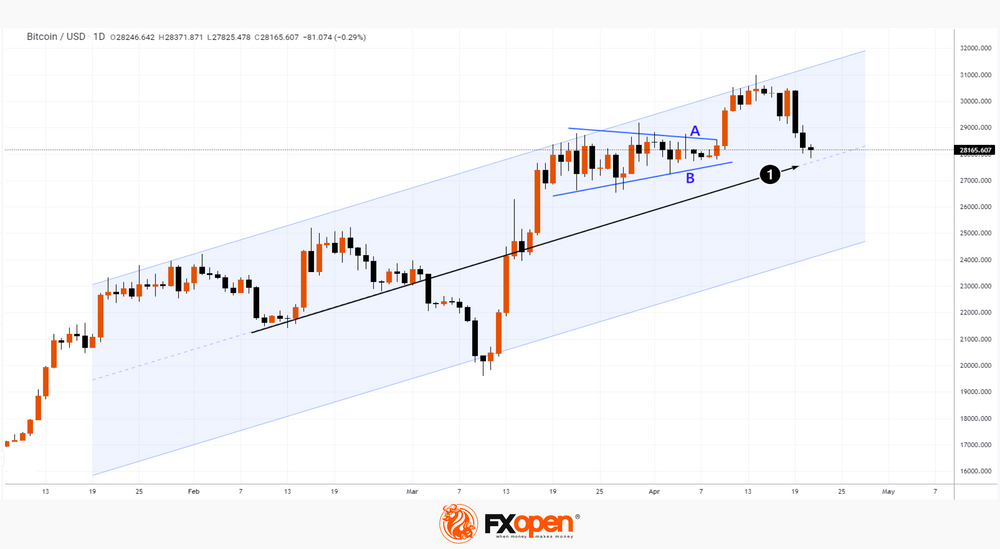
The BTCUSD rate fell to the median line (1) of the ascending channel, which has been relevant since the beginning of the year, so the bitcoin quote can find support here. However, arguing about the position of the current price relative to the A-B triangle, which testified to the temporary balance of supply and demand, one can come to negative conclusions. After all, if we evaluate the rally on April 10-11 as an imbalance in favor of demand forces, then the latest price action indicates that the imbalance occurred in the wrong direction. And where the bulls did not succeed, the bears can.
Inflation in Japan Stabilizing
High inflation is not such a big problem for Japan as it is for, for instance, the US and the UK. Although the sharp jump in the Core CPI in Japan two months ago to 4.1% in annual terms caused alarm, the data published this morning (although it testified to an unusually high level of inflation for Japan) generally reduced the degree of alarm:
- Core CPI (today): 3.1%: (expected 3.1%).
- Core CPI (a month ago): 3.1%.
- Core CPI (a year ago): 0.8%.
As a result of published data on inflation, the yen strengthened in the morning. The demand for the Japanese currency is also facilitated by the following facts:
- the banking crisis has practically not affected the banks of Japan;
- oil prices are adjusting after the decision to limit OPEC+ production (oil is an important import product to Japan);
- disappointing first-quarter financials from some companies in the US. Foreign investors poured almost $12 billion into Japanese equities last week, their largest investment since at least January 2018, according to Reuters.
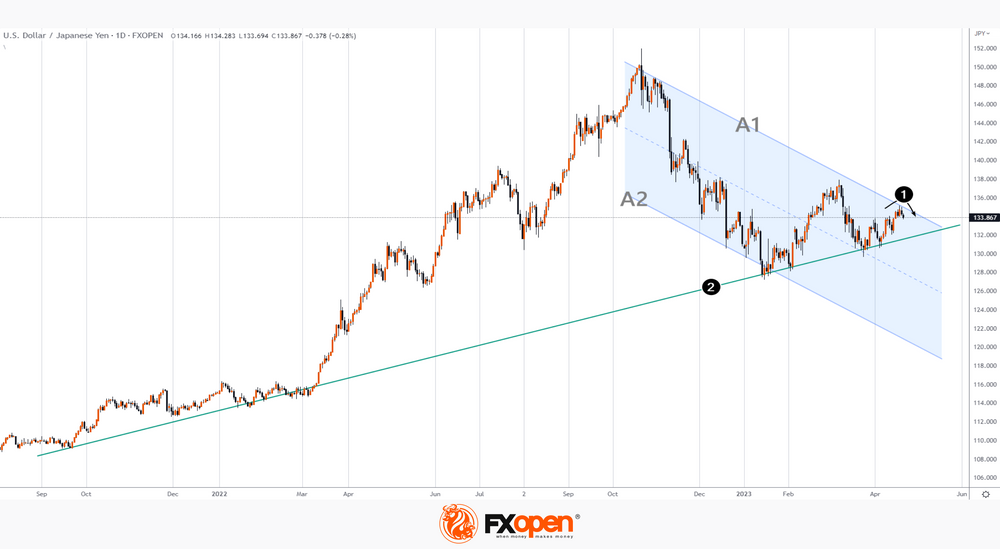
The daily chart shows that the USDJPY rate is forming a reversal (1) from the upper border of the descending channel A1-A2, as a result of which the price may again test the long-term trend line (2). More frequent attempts to touch this line may indicate that the bears' attempts to break through it are becoming more and more persistent.
Bitcoin and Ether Erase Recent Momentum
Market Picture
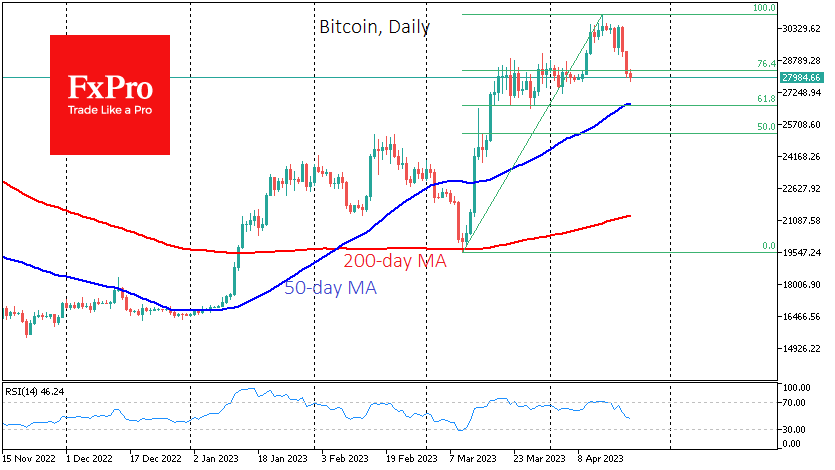
Bitcoin fell to $28K on Thursday, losing 2.8% in the last 24 hours. The crypto market is shrinking roughly at the same rate, losing 2.5% to $1.19 trillion.
Bitcoin has completely wiped out the gains since 9th April and gave up 23.6% of the rally from the March lows. It is worth bracing for a more typical pullback of 38.2% from the rally to the 50-day average, near $26.7K. Such a drop promises to fray the nerves of crypto enthusiasts. A break below that level could quickly take the price to $25.6K – the all-important 200-week moving average, the capture of which allowed the bull market to be declared resurgent in March.
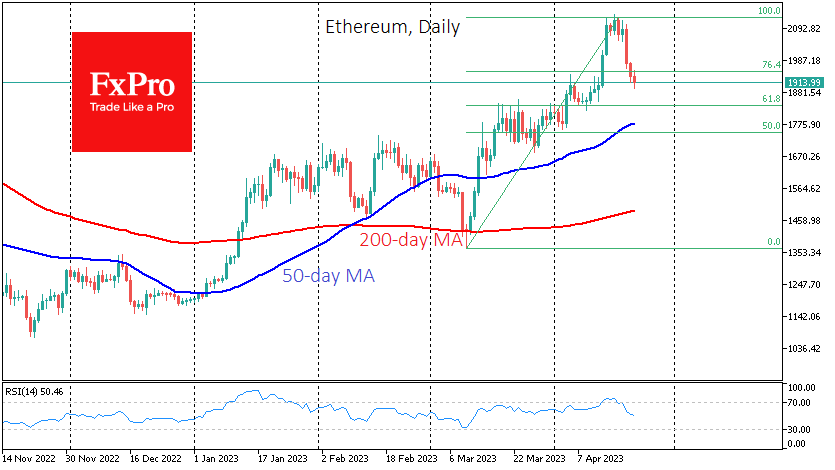
Similarly, the Ethereum exchange rate returned to $1915 when the rally began on the 13th. Significant support is seen in the $1840-1850 area, where the lows of 9th April and the Fibonacci retracement are concentrated.
As a result of another recalculation, bitcoin’s mining difficulty rose 1.72% to 48.71T. Over the past seven days, the average hash rate hit a record high of 356 EH/s, showing that miners are increasing their processing power.
News background
The EU has agreed to regulate cryptocurrencies. The EU Parliament has voted for the MiCA draft law, which supplies comprehensive industry regulation. Market participants will no longer have to navigate 27 different national regulatory laws, notes Chainalysis.
Société Générale-Forge (SG-Forge), a unit of French banking giant Société Générale, has launched an Ethereum-based EUR CoinVertible stablecoin pegged to the euro.
Somebody moved 6,071 BTCs after nine years of hibernation, the Whale Alert service detected on 19th April. After a large tranche, 3999 BTCs were returned to the original wallet. One Telegram channel suggested that the original Mt. Gox exchange owner and Ripple creator Jed McCaleb could be behind the transactions.
USDCAD Rebounds Strongly from April Lows
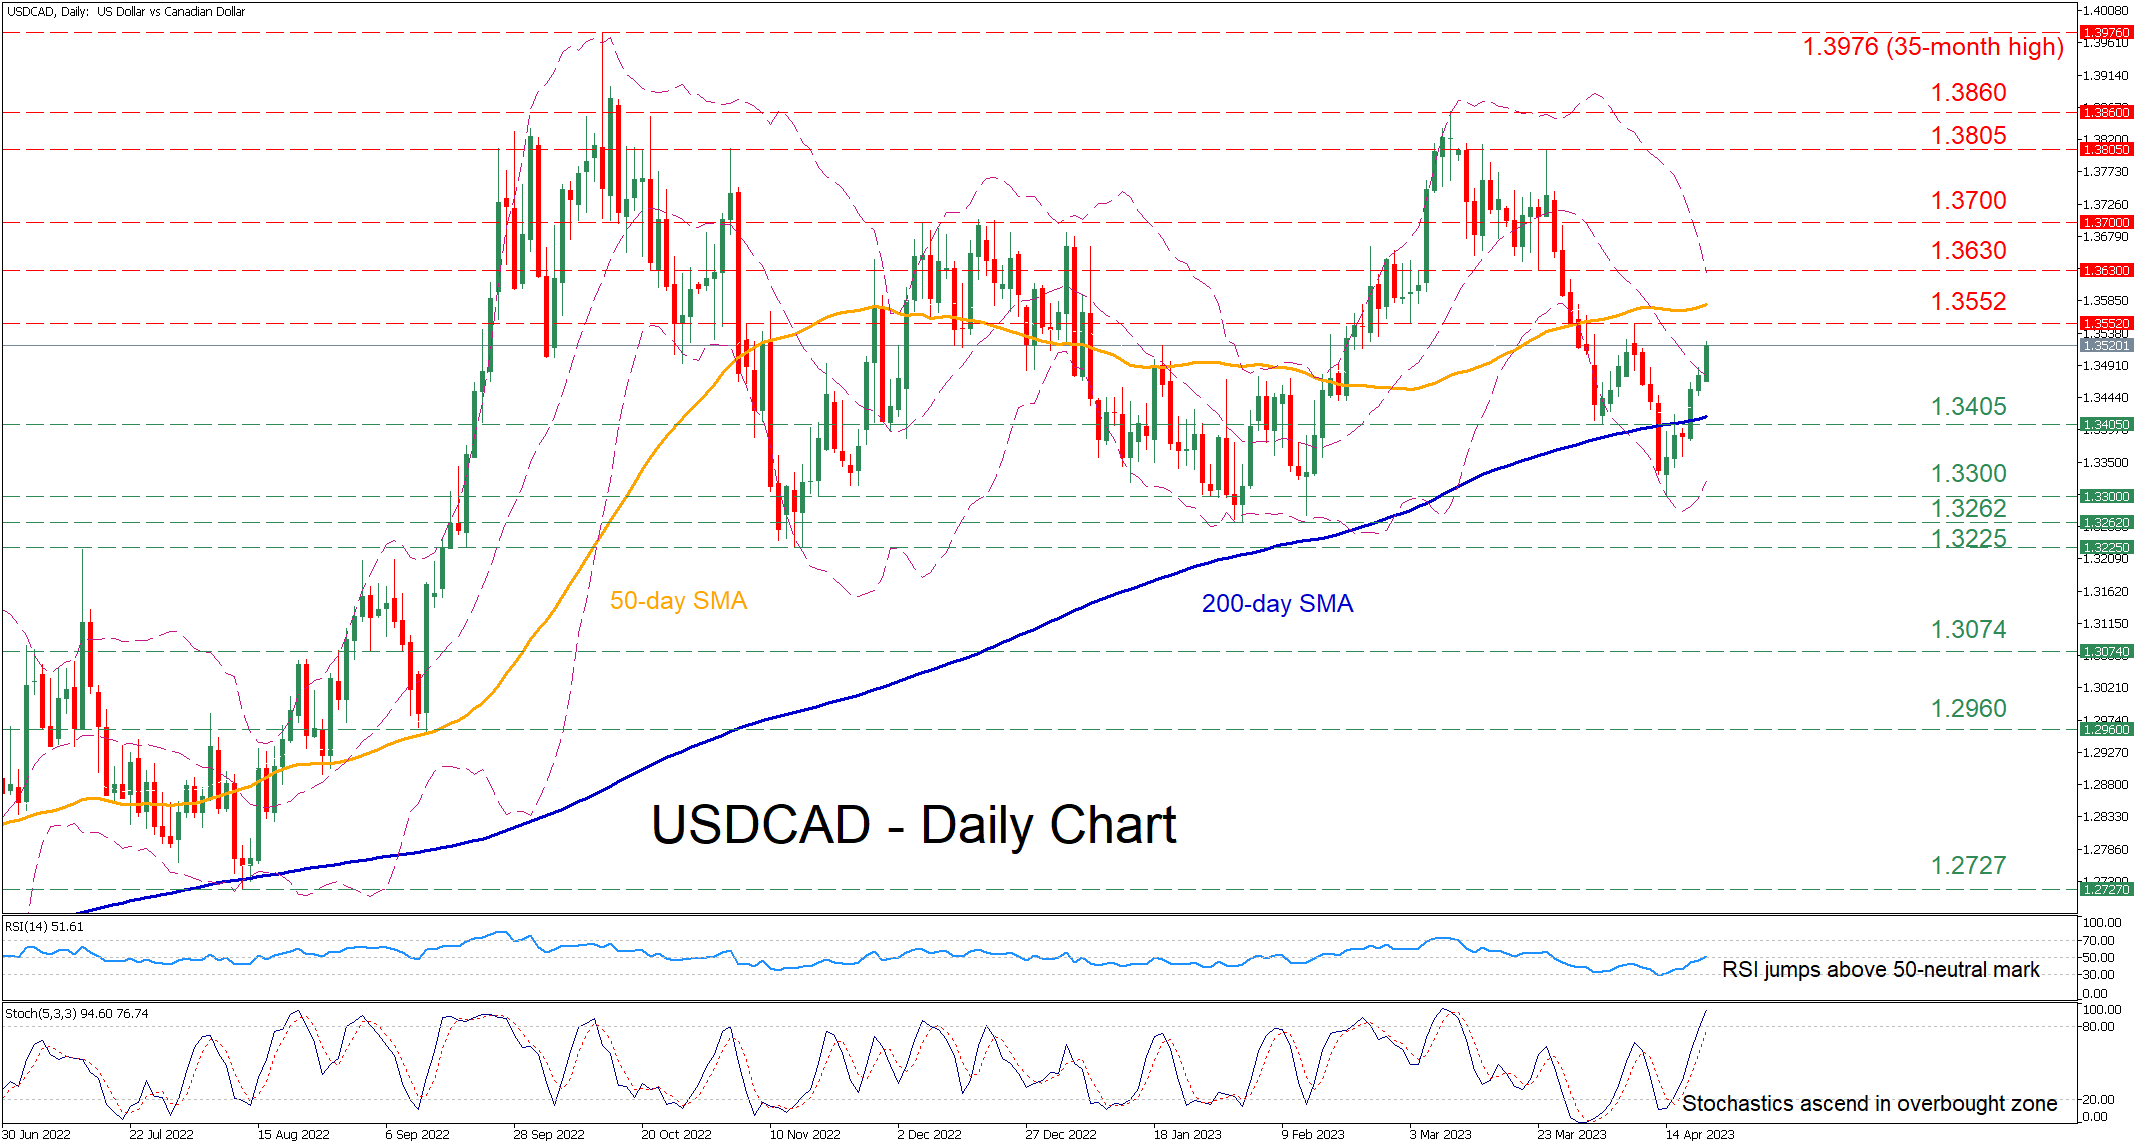
USDCAD had been trending lower after peaking at the 2023 high of 1.3860 in mid-March. However, the pair managed to halt its decline and has been gaining significant ground in the past few daily sessions, jumping above the 200-day simple moving average (SMA).
The momentum indicators currently suggest that bullish forces are intensifying. Specifically, the RSI crossed above its 50-neutral mark, while the stochastic oscillator is ascending in the overbought zone.
Should the rebound resume, initial resistance could be met at the 1.3552 barrier. Violating that region, the price could challenge the March support of 1.3630, which could serve as resistance in the future. Further advances could then cease at the 1.3700 psychological mark that held strong in December 2022.
To the downside, bearish actions could send the price to test the April support of 1.3405, which lies close to the 200-day SMA. If that floor collapses, the April low of 1.3300 might curb the pair’s retreat. Even lower, the 2023 bottom of 1.3262 could provide downside protection.
In brief, USDCAD seems to have temporarily paused its selloff as technical indicators have tilted to the bullish side. Hence, for the rebound to strengthen the pair needs to initially conquer the 50-day SMA, currently around the 1.3580 handle.
WTI Oil Futures on a Slippery Slope Again
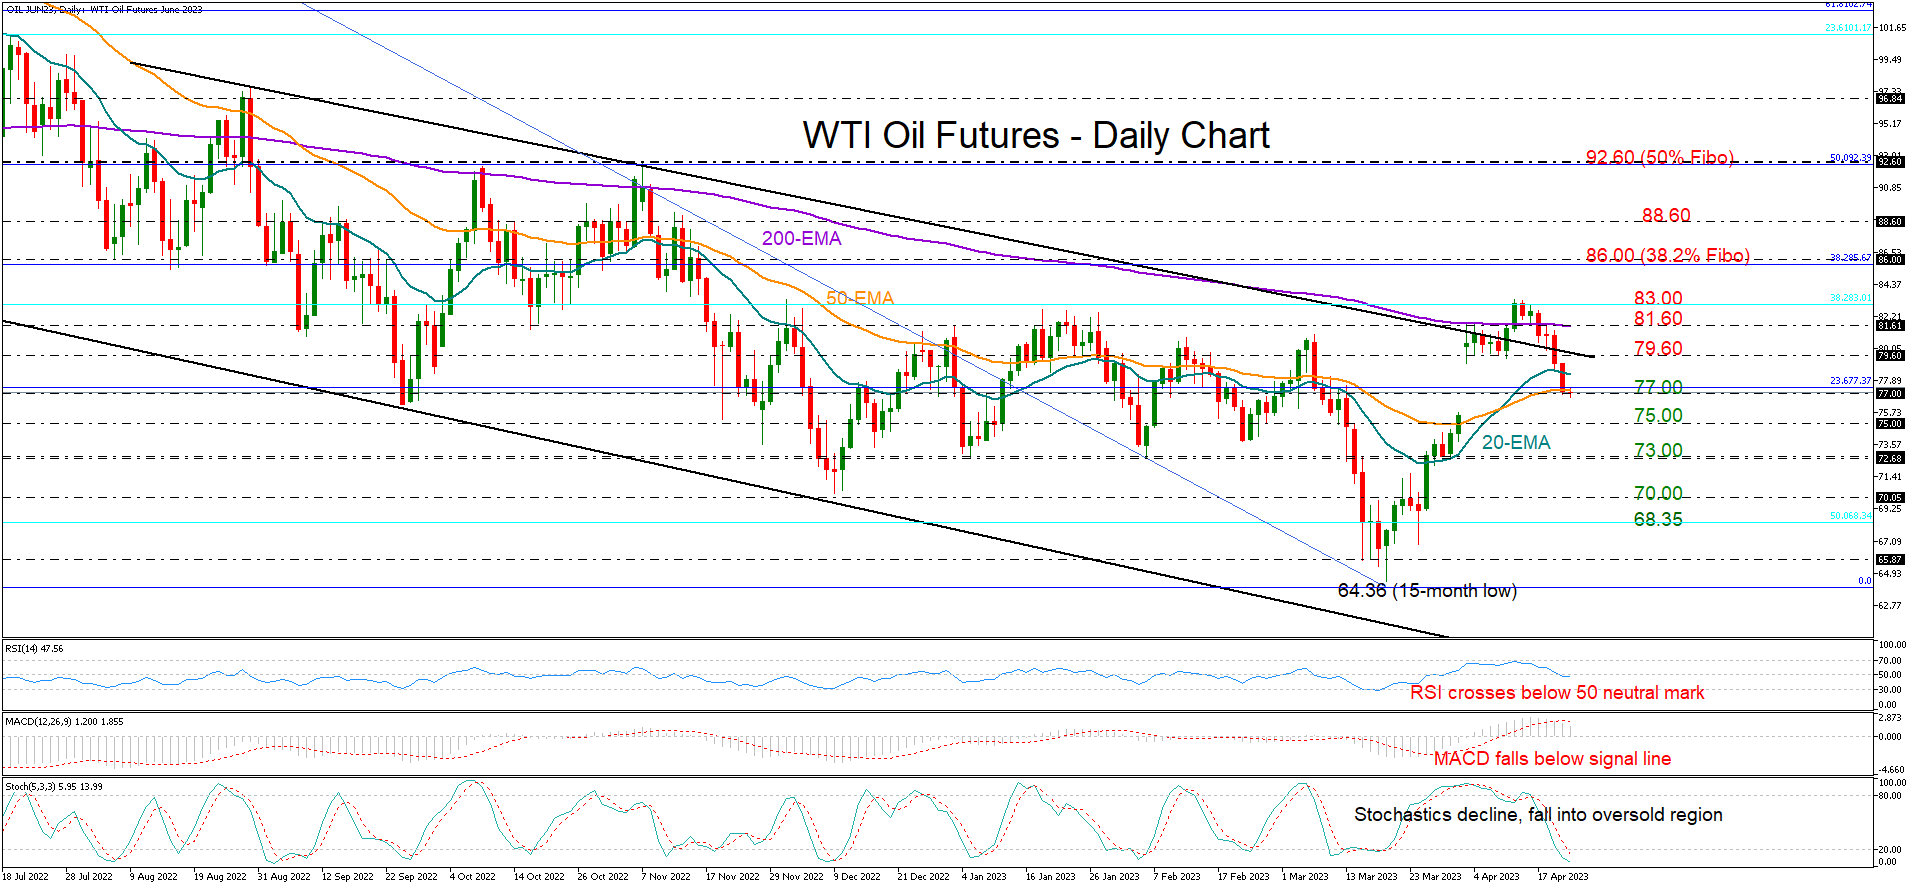
WTI oil futures returned to losses after a whopping continuous 24% rally during the previous four weeks, which lifted the price up to an almost five-month high of 83.37.
Disappointingly, the price has reversed its bullish channel breakout and is currently at risk of another bearish correction beneath the 77.00 number and its 20- and 50-day exponential moving averages (EMAs).
The technical indicators are showing warning signs. Specifically, the RSI has stepped into the bearish area below 50 and the MACD is decelerating below its red signal line, flagging more price weakness ahead. Meanwhile, the negative trajectory in the Stochastic oscillator is favoring the bears as well, though the indicator has already entered the oversold region below 20, suggesting the sell-off may soon find support.
If the bearish scenario materializes, with the price closing below the 77.00 mark, the 75.00 psychological mark may immediately come to the rescue. Otherwise, the decline may intensify towards the key 73.00 region, which is the base of the broad range. Additional losses from here could take a breather somewhere between 70.00 and 68.35, with the latter representing the 50% Fibonacci retracement number of the 2020-2022 uptrend.
On the upside, a step above the 50-day EMA and the 23.6% Fibonacci retracement of the 120.87-64.36 downtrend at 77.35 would shift the focus back to the 79.60-81.60 region formed by the channel’s upper boundary and the 200-day EMA. Yet, only a decisive extension above the crucial 83.00 resistance area, which has been keeping the market in a flat trajectory since the end of December, would bring the bullish outlook back into play. If that happens, the price may advance towards the 86.00 barrier, while higher, the 88.60 zone could be the next hurdle.
To sum up, WTI oil futures may experience more selling in the coming sessions if the price closes below 77.00, with support likely emerging around 75.00. For the bulls to take charge, the market needs a sustainable recovery above the 83.00 ceiling.
XAG/USD: Bulls May Send the Market to 27.927
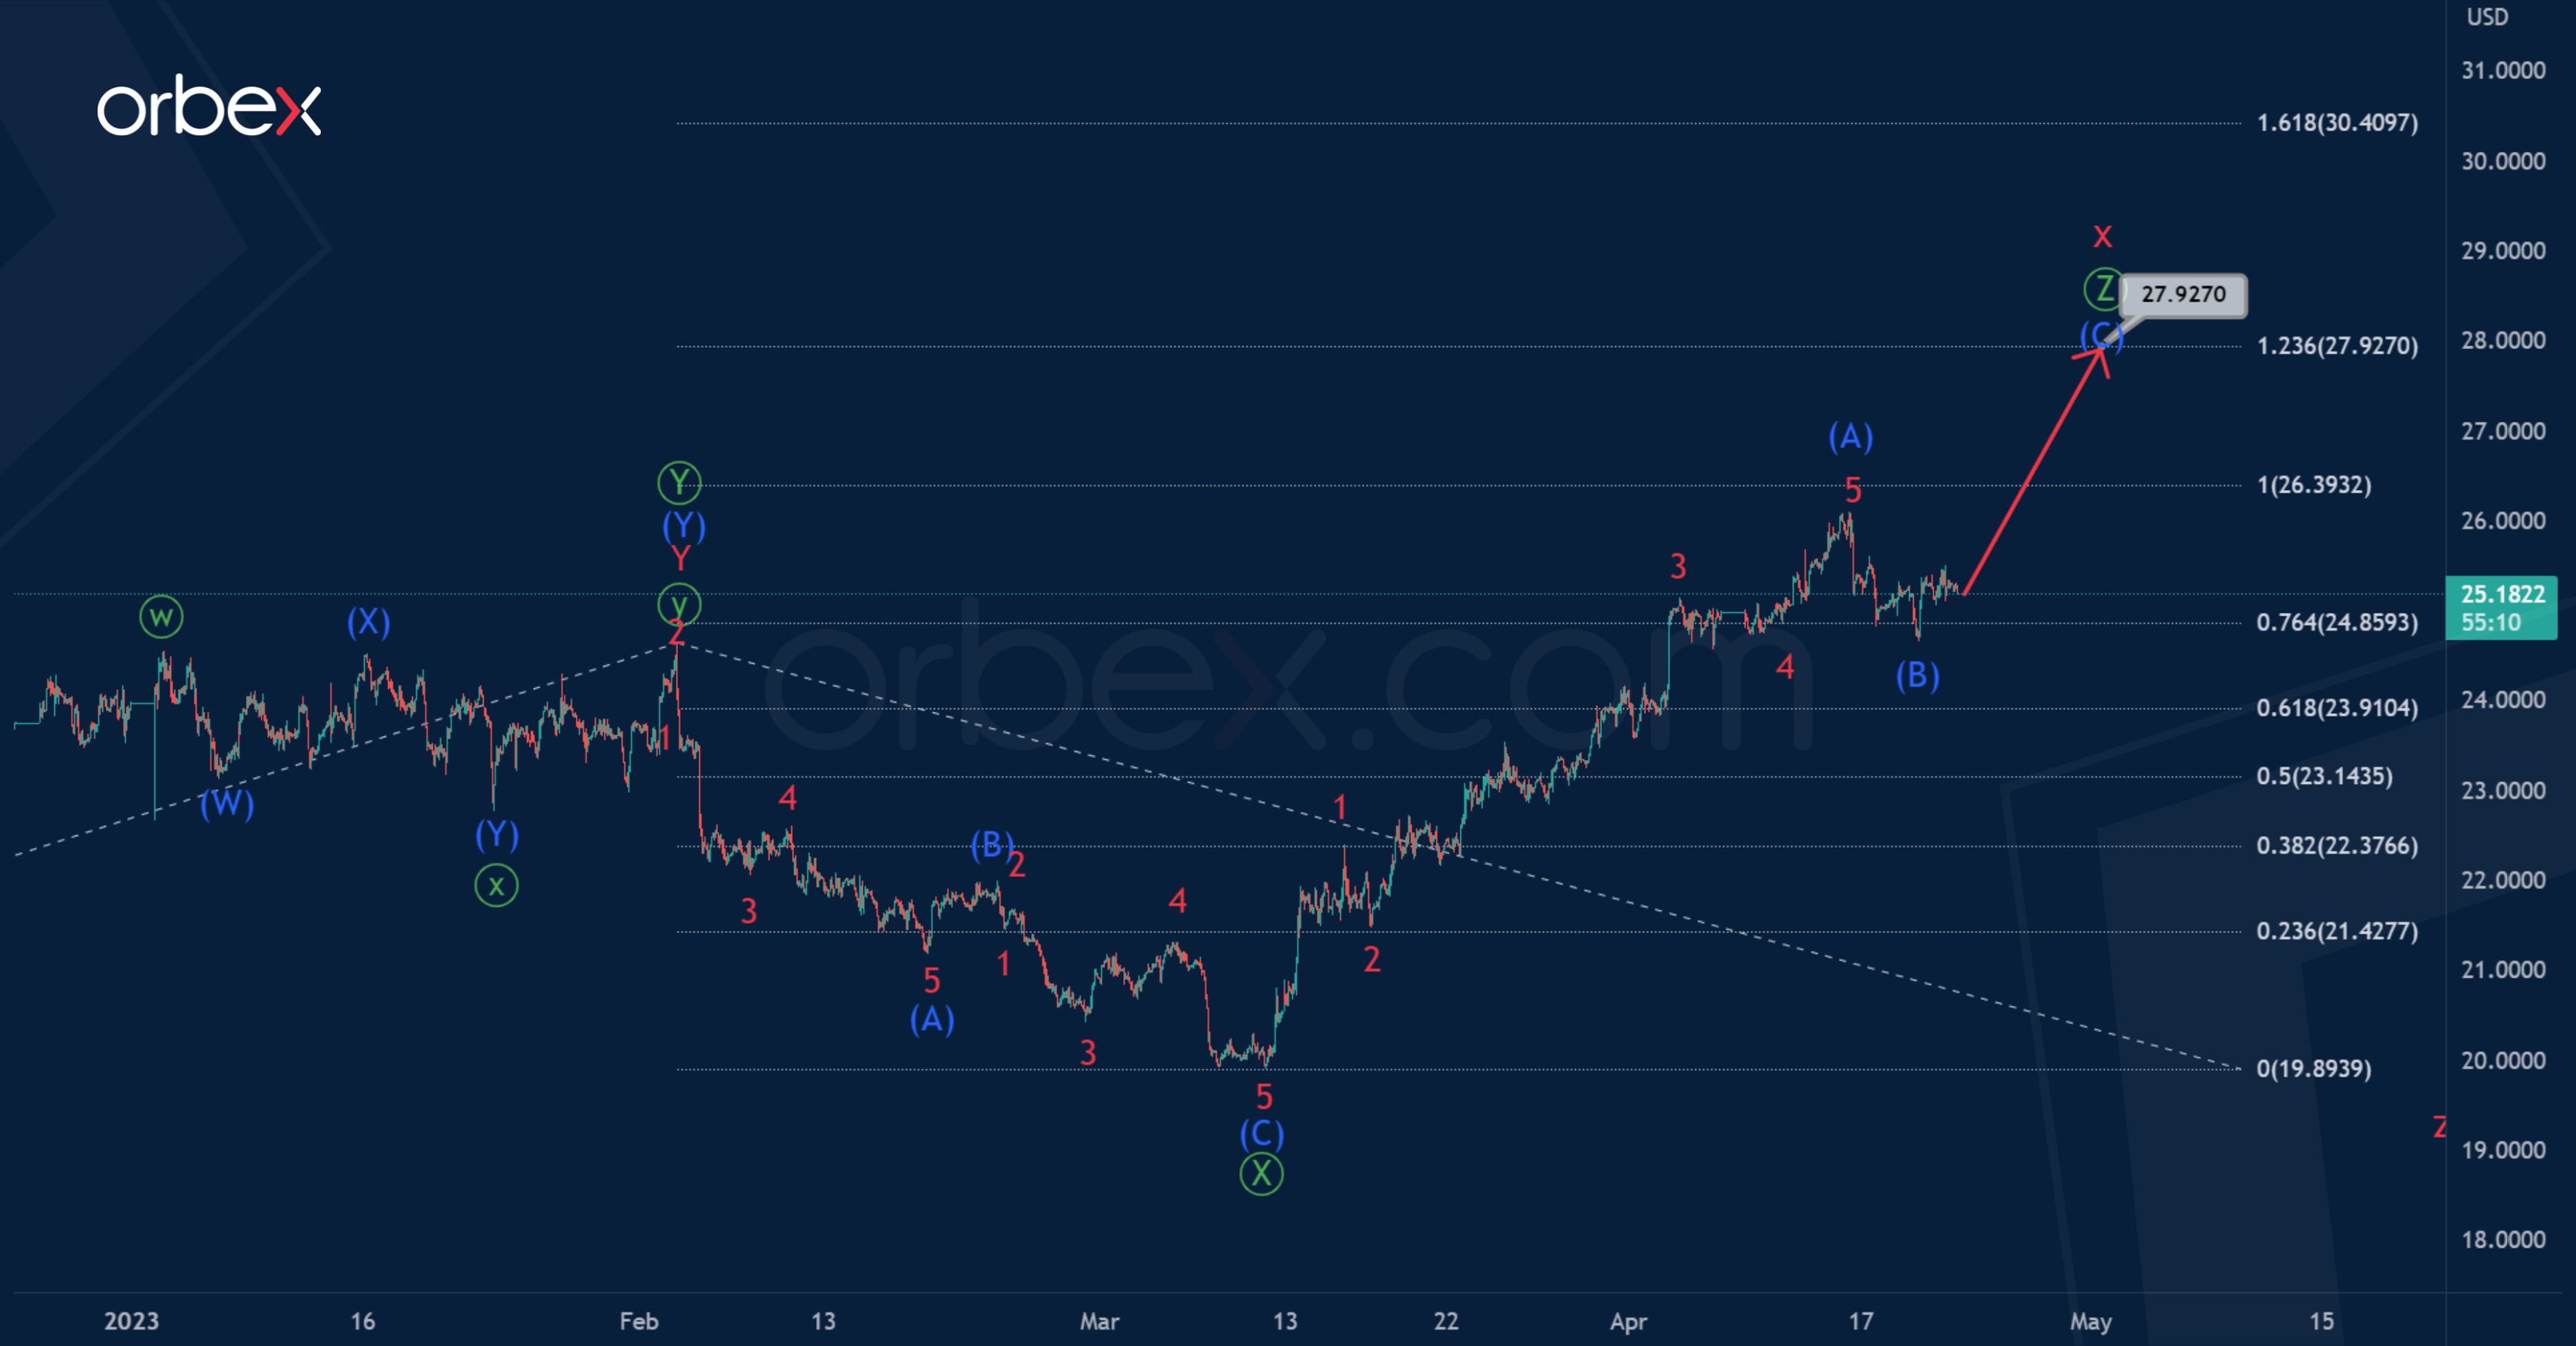
In the long term, Silver is most likely moving inside a corrective trend consisting of cycle waves w-x-y-x-z.
On the 1H timeframe, we see the structure of the second intervening wave x, which may soon be completed, taking the form of a triple zigzag of the primary degree Ⓦ-Ⓧ-Ⓨ-Ⓧ-Ⓩ
By the middle of last month, the bears have finished primary intervening wave Ⓧ, it has the shape of zigzag (A)-(B)-(C).
At the moment, the price may be in the primary wave Ⓩ. Perhaps this wave will be a standard zigzag, where the impulse and correction have already been completed. In the near future, growth is expected in (C) to 27.927.
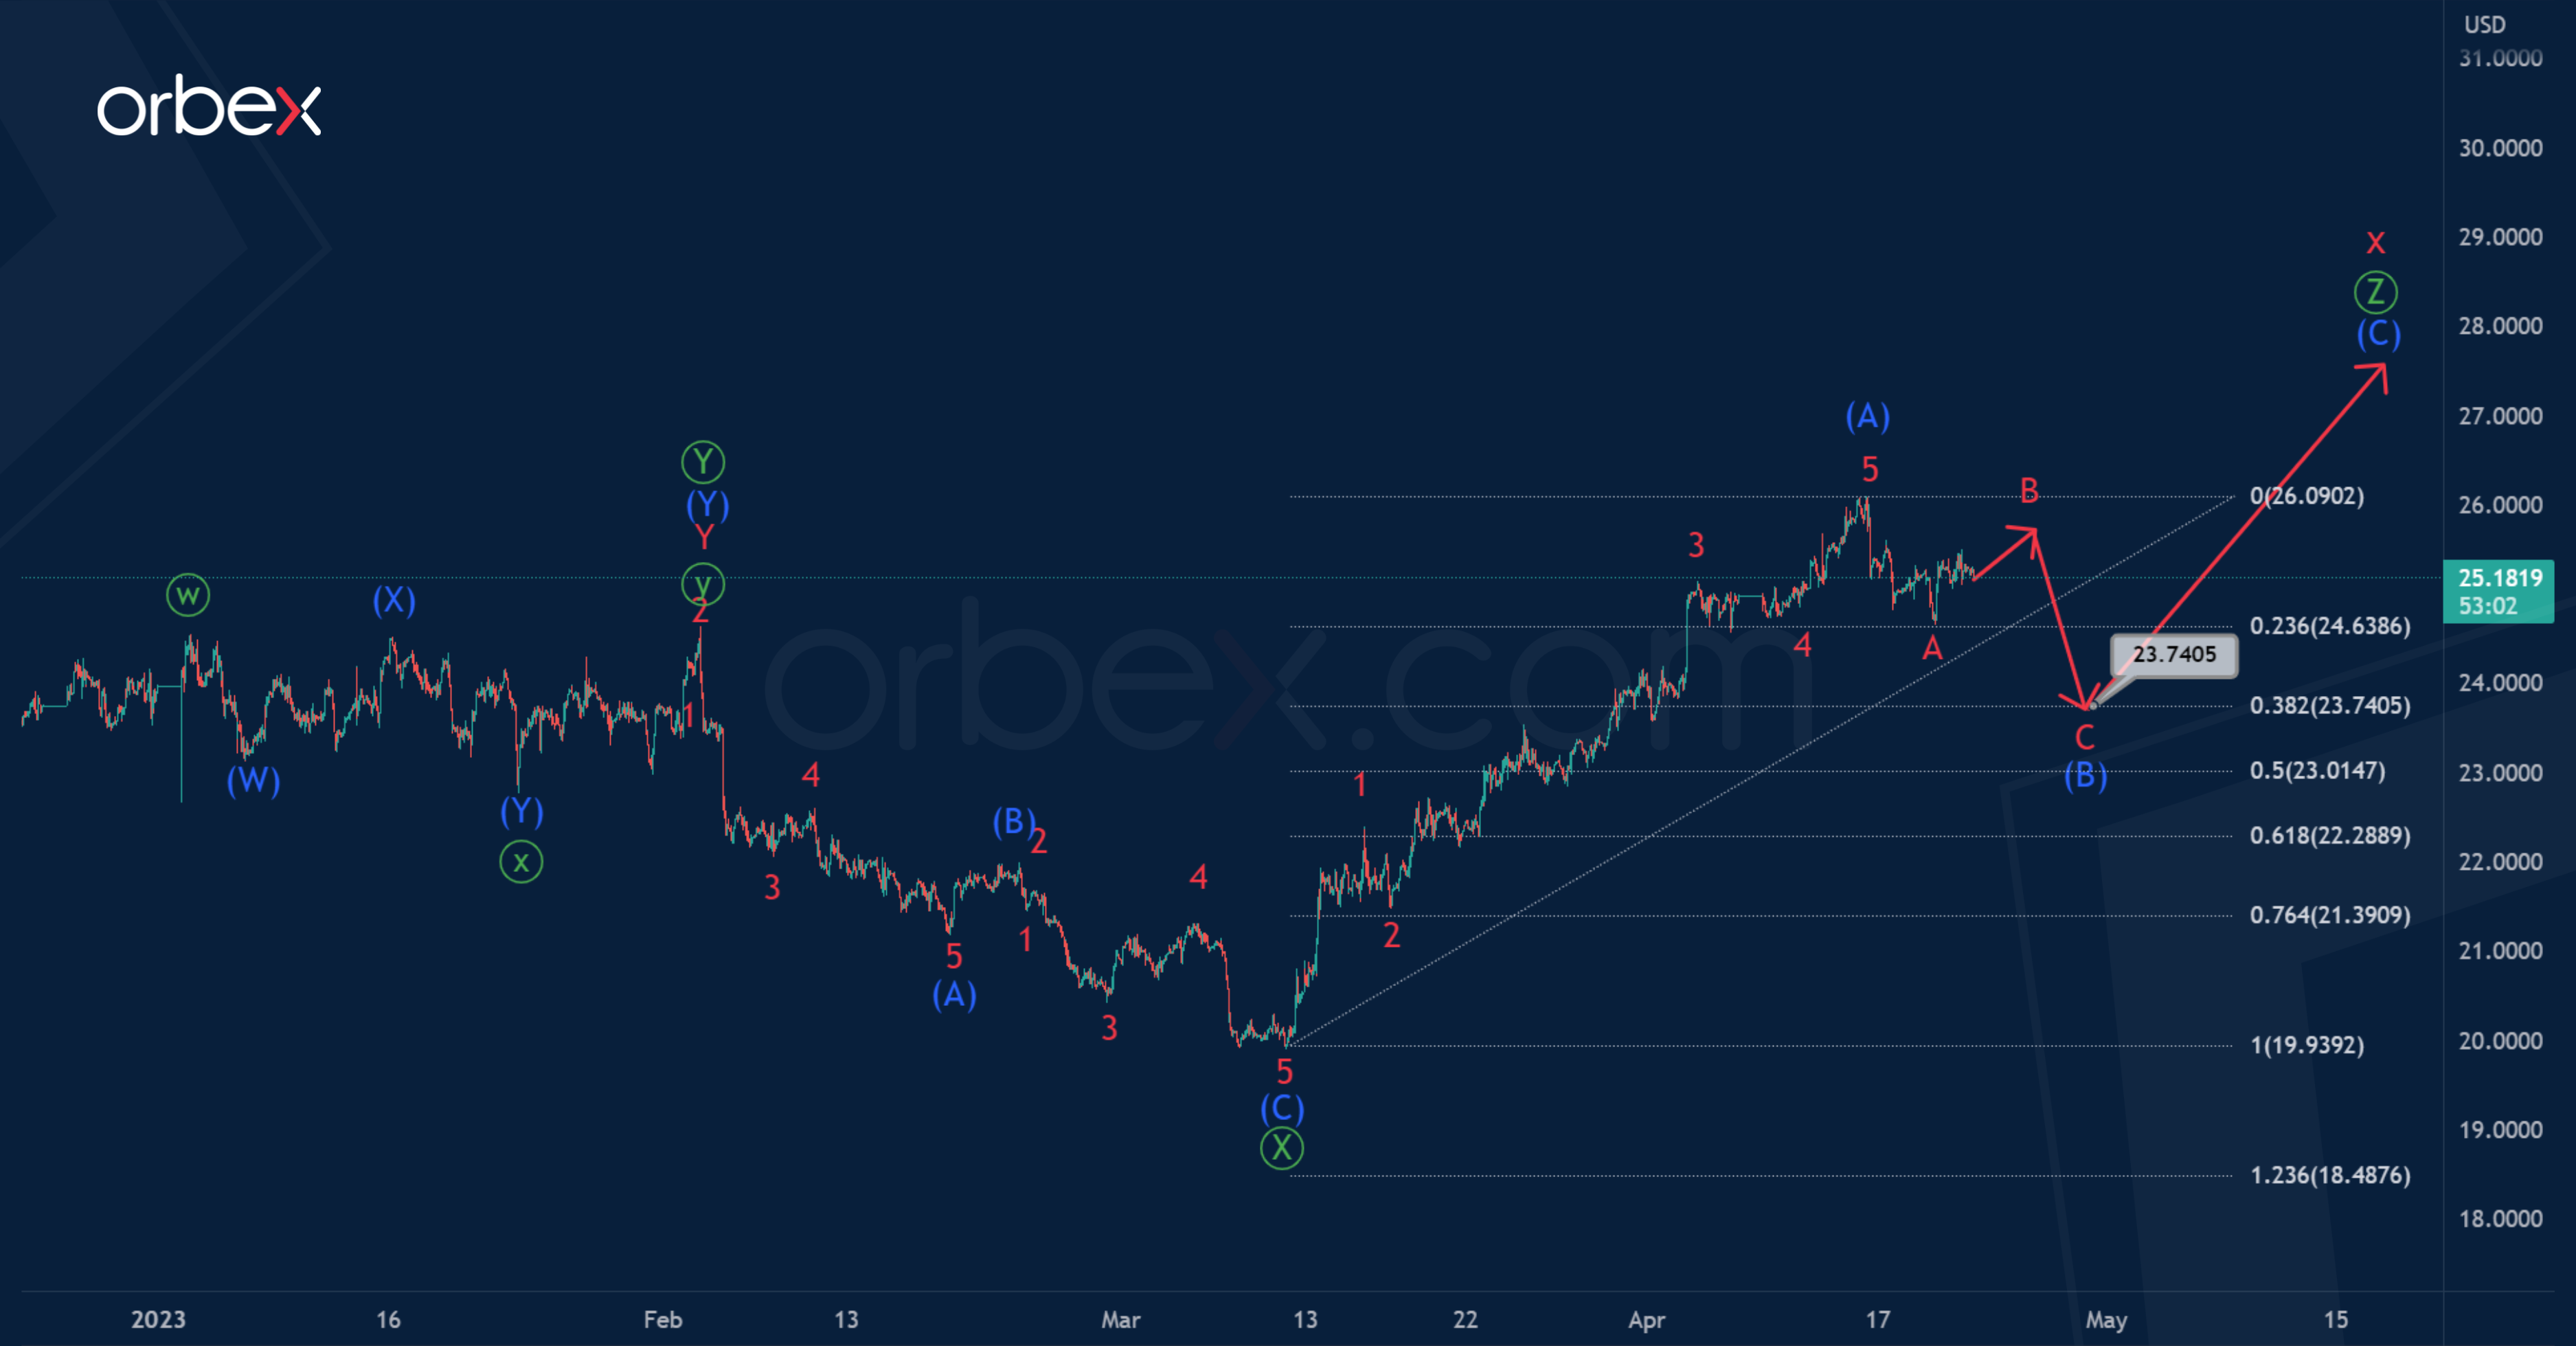
Alternatively, it is assumed that the intermediate correction (B) has not yet been completed. There is a possibility that it will take the form of a minor zigzag A-B-C.
Only the first impulse wave A looks completed, a slight rise in the second part of correction B is possible in the near future, after which a decrease is expected in the final impulse C.
It is assumed that the intermediate correction (B) will be at 38.2% of impulse (A), and will end near 23.740.
AUD/USD: Aussie Dollar Accelerates Lower on Soured Risk Mode
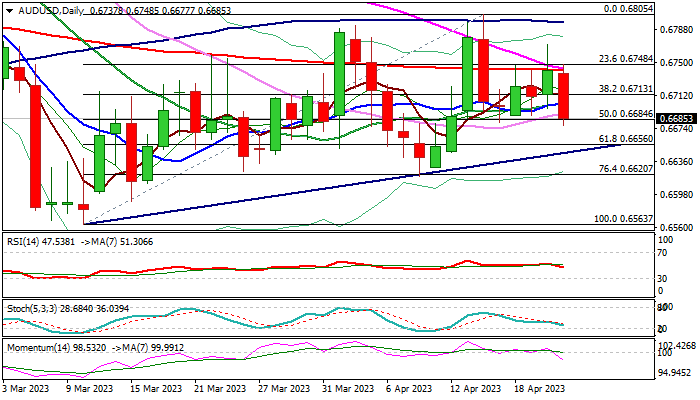
Australian dollar fell around 0.9% in Asia / early Europe on Friday, deflated by fading risk appetite as US recession fears grow.
The US dollar also regained traction on rising bets for another Fed rate hike in May, despite softer economic data, adding pressure on Aussie dollar.
Fresh weakness emerges after a multiple failure to clearly break above 200DMA (0.6741), with formation of bull-trap and 55/200DMA bear-cross, contributing to negative signals.
In addition, repeated rejections at the base of thick falling daily Ichimoku cloud warn that recovery leg from 0.6563 (2023 low posted on Mar 10) lacks strength to resume.
Daily technical studies are turning to bearish mode as 14-d momentum broke into negative territory, south-heading RSI moved below neutrality zone and thickening descending daily cloud adds pressure.
Fresh bears so far retraced over 50% of 0.6563/0.6805 recovery and eye pivotal supports at 0.6656/44 (Fibo 61.8% / bull-trendline connecting 0.6563 and 0.6619 lows), guarding key 0.6620 level (Apr 10 trough / Fibo 76.4%) loss of which will confirm a double-top (0.6793/0.6805) and risk retest of 0.6563 low.
US Apr PMI data, due later today, will be in focus for fresh signals.
Res: 0.6702; 0.6731; 0.6741; 0.6771.
Sup: 0.6644; 0.6620; 0.6600; 0.6563.
Crude Coming Down to Fill the Gap, Supporting USD/CAD Rally Towards 1.3555
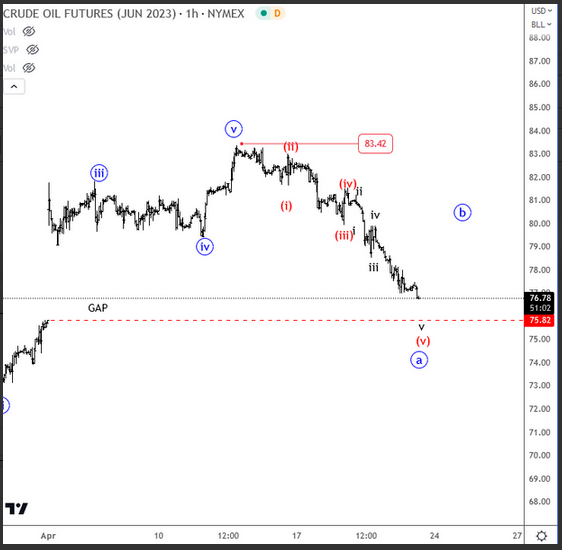
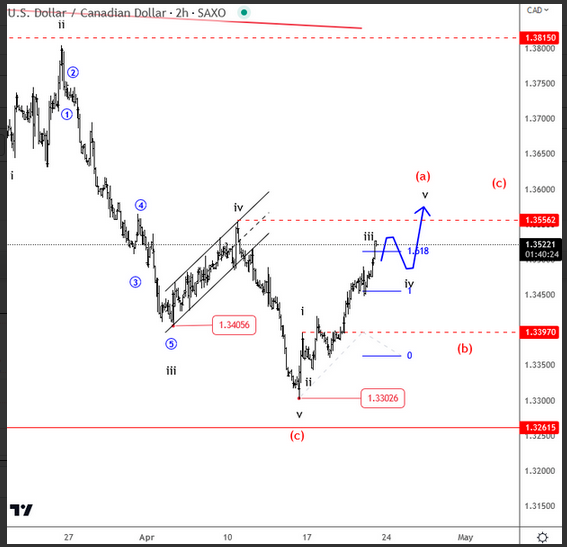
Crude oil is coming down, trying to fill that gap now from early April when Opec decide to cut production to stabilize prices. However, these gaps were expected to be filled at some point so it's not a surprise that price is coming down. But what's important is that once they are filled price can reverse. In our case that can cause a rally up into wave b, for a three-wave recovery minimum, before another leg down "c" shows up. At the same time, it's not a surprise to see USDCAD coming higher, since we know that CRUDE and CAD are positively correlated. USDCAD is seen in impulsive recovery, targeting 1.3555.