

Sample Category Title
Canada’s Slowly Approaching Economic Slowdown
Summary
- Canada's economy has made a solid start to 2023, with sturdy employment gains over the last six months and monthly GDP figures pointing to respectable growth in the first quarter. However, the cumulative effects of past monetary tightening and lower energy prices should, together, weigh on consumer and business activity going forward. We forecast 1.0% GDP growth in 2023, down from 3.4% in 2022.
- A slowing in Canadian inflation is a silver lining, with a drop in energy prices driving headline inflation lower and core inflation trends also showing a perceptible slowing. That said, the underlying pace of inflation of around 3.25%-3.50% during the past three months is likely still uncomfortably high for central bank policymakers. That discomfort was reflected in the Bank of Canada's April monetary policy announcement. The BoC held its policy rate at 4.50%, but repeated that it was prepared to raise rates further if needed.
- Our base case is for no further rate hikes and, as growth and inflation slows, for rate cuts to begin in Q4-2023 with a cumulative 50 bps of easing. That easing in policy should also see the Canadian dollar underperform, remaining broadly steady against a soft U.S. dollar. The most significant risk to our outlook is that core inflation fails to slow below a 3% pace. In that scenario, rate cuts could get pushed back to 2024, and the Canadian dollar would likely be stronger than we currently forecast.
A Solid Start to 2023, But Slower Growth Still Ahead
We have, for some time, been anticipating a slowdown in Canada's economy in 2023, given an accumulation of headwinds through late last year. While we still believe that slowdown will be forthcoming, the economy has proved surprisingly resilient at the beginning of 2023. To be clear, we don't think the Canada's economy has been suprising or strong enough to prompt further Bank of Canada (BoC) rate hikes. However, depending on how quickly (or not) any growth slowdown transpires, it is possible that BoC easing begins later than our current forecast for initial rate cuts starting in Q4-2023.
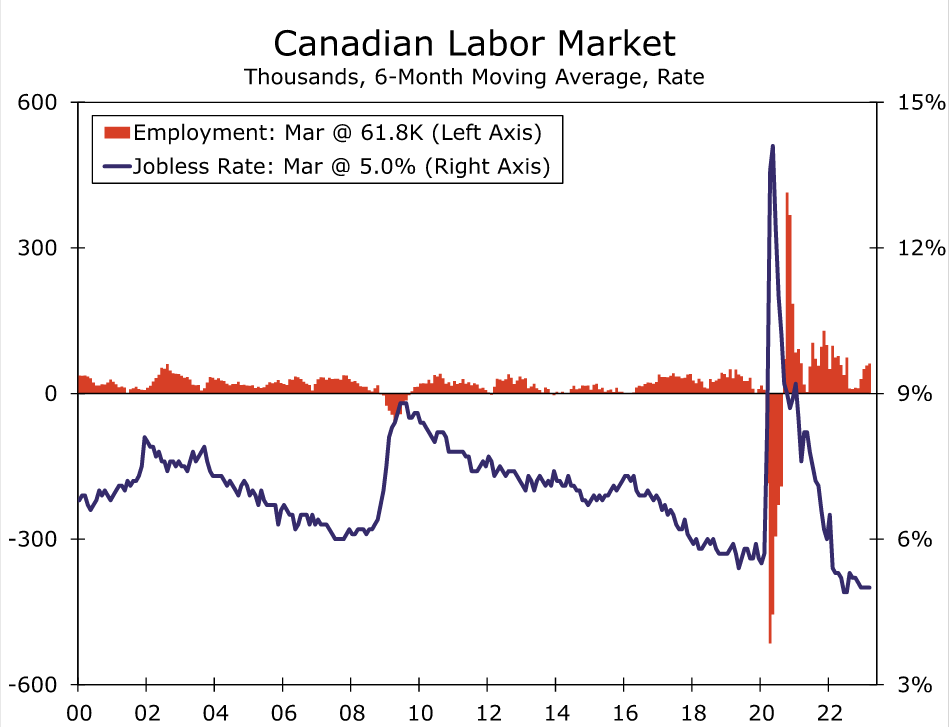
Perhaps the most notable area of strength over the past several months has been the Canadian labor market. Employment rose by 34,700 in March, reflecting an 18,800 gain in full-time jobs and a 15,900 gain in part-time jobs. The March increase comes after a run of solid job gains, such that the monthly employment increase has averaged 61,800 over the past six months. The unemployment rate remained low in March at 5.0%, although hourly wage growth for permanent employees did ease a little to 5.2% year-over-year.
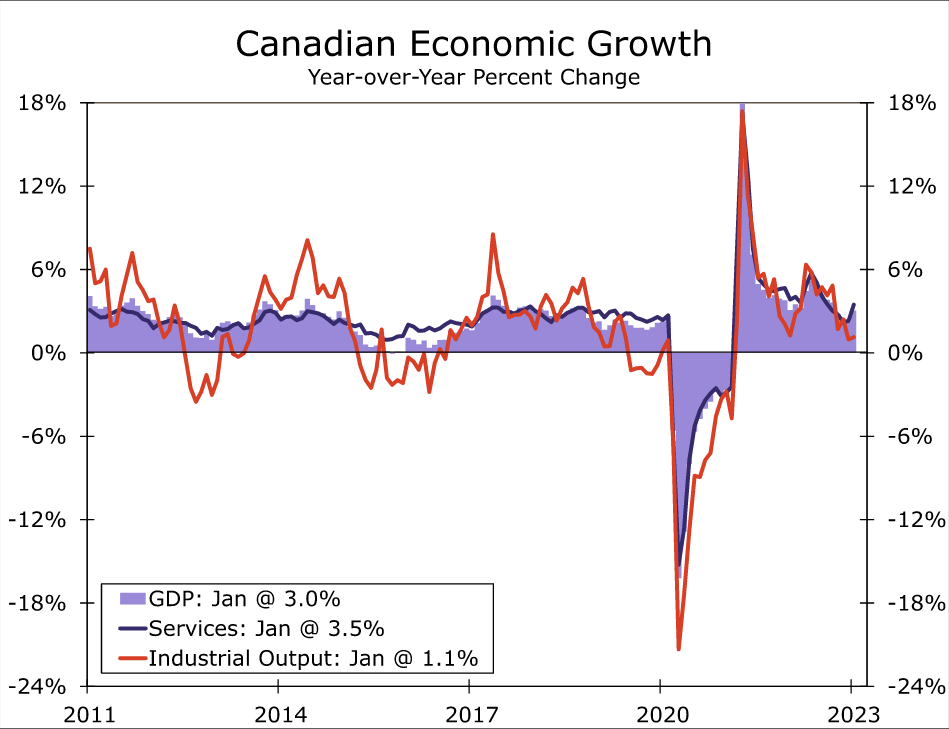
It is not just the labor market that has shown solid trends in early 2023. Canada's January GDP also rose 0.5% month-over-month, a bit more than the consensus forecast, as both services activity (+0.6%) and industrial output (+0.4%) rose. In that same release, Statistics Canada said its advance estimate is for GDP to rise another 0.3% in February. If realized, that would leave Canadian GDP for the January-February period up 0.7% over its Q4 average and, as a result, we have lifted our GDP growth forecast for the first quarter as a whole.
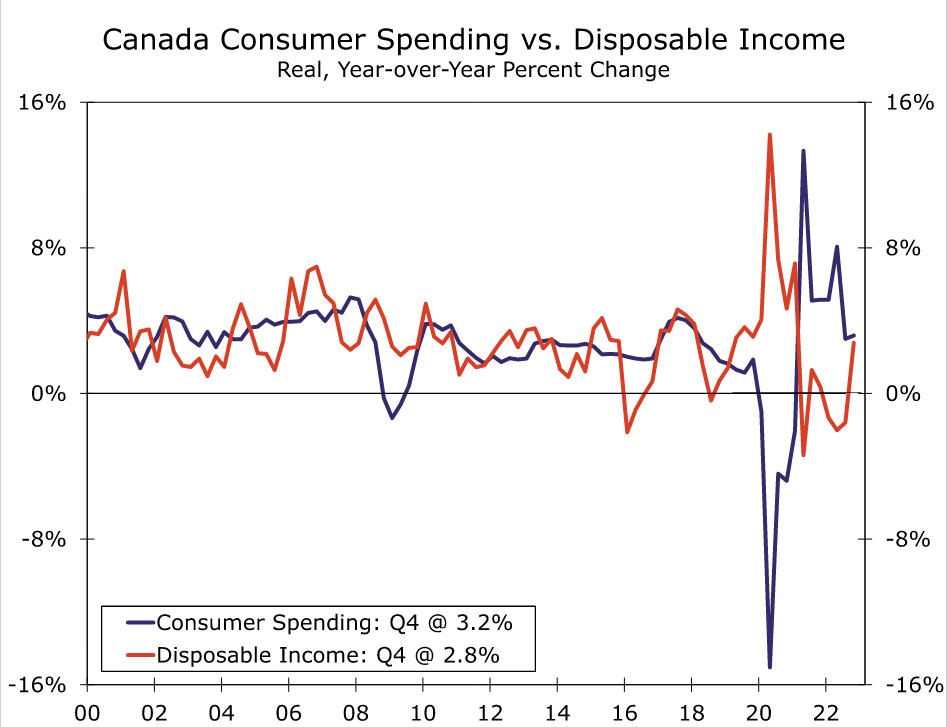
Finally, there was also some favorable news with respect to consumer fundamentals from the Q4 GDP report, as household disposable income rose 3.0% quarter-over-quarter and the household saving rate rose to 6.0% from 5.0% in Q3. To be sure, the gain in disposable income was due in part to one-off factors, including a Goods and Services Tax credit top-up and an increase in Old Age Security payments. That said, even allowing for inflation, real disposable income growth turned positive in Q4-2022 with a gain of 2.8% year-over-year, likely contributing to some resilience seen in the economy early this year.
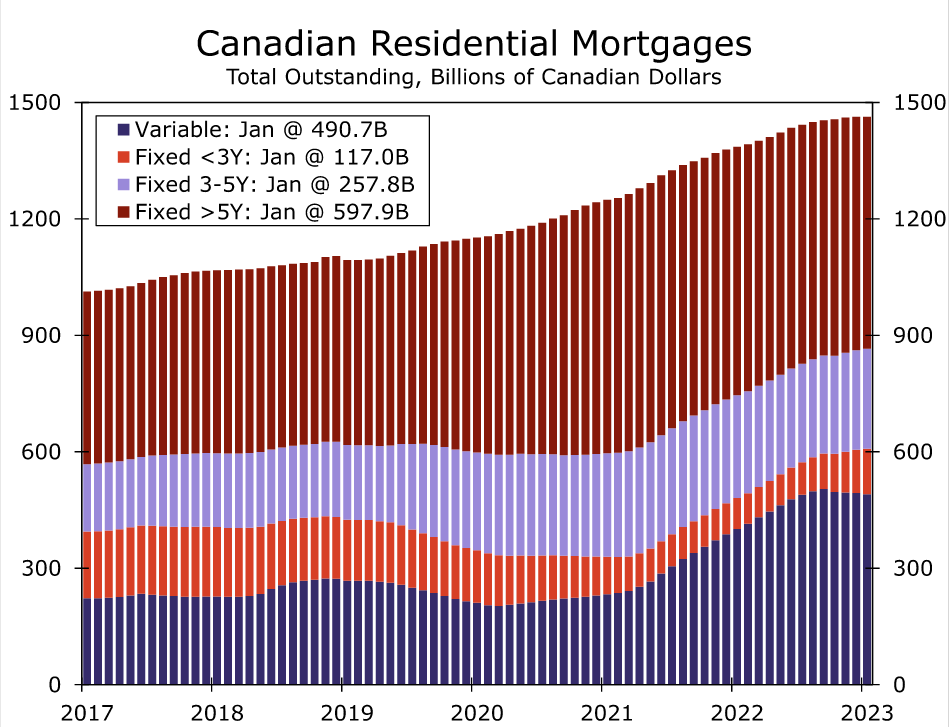
However, while Canada's economic resilience in early 2023 has been—for us—a pleasant surprise, we still believe a slowdown is approaching. We see several factors as likely to weigh on activity as the year progresses, though chief among these are cumulative rate hikes and monetary tightening from the Bank of Canada. Since the start of 2022, when the Bank of Canada's policy rate was just 0.25%, the Bank of Canada has hiked rates by 425 bps, reaching 4.50% by the time of the January 2023 meeting, a level it has remained at since. The impact of these interest rate increases have yet to be fully felt, although they are still working their way through (and relatively quickly we think) the economy. Variable rate mortgages became very popular in Canada during the pandemic, a period when policy interest rates were at record lows. Thus, even given some waning in demand recently, variable rate mortgages remain a sizable portion of housing loans and were still some 33.5% of outstanding residential mortgages as of January 2023.
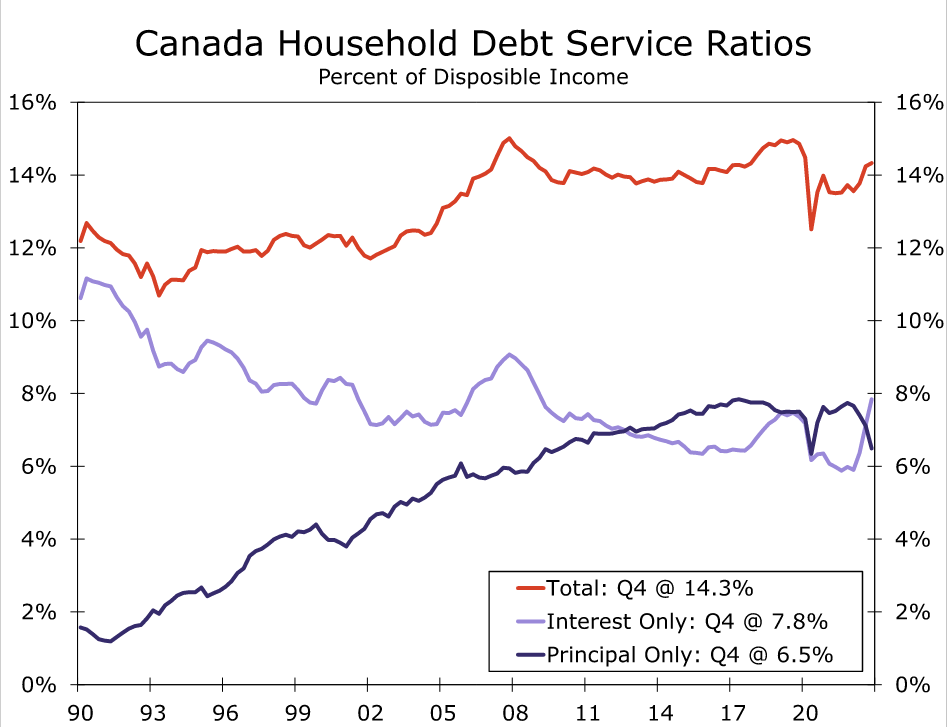
This sizable proportion of variable rate mortgages means interest costs for Canadian households have also risen relatively quickly. Interest costs rose to 7.8% of disposable income by Q4-2022 from just 5.9% at the beginning of last year, meaning that even with some offsetting decline in principal payments, the total debt service ratio for Canadian households has risen to 14.3% of disposable income.
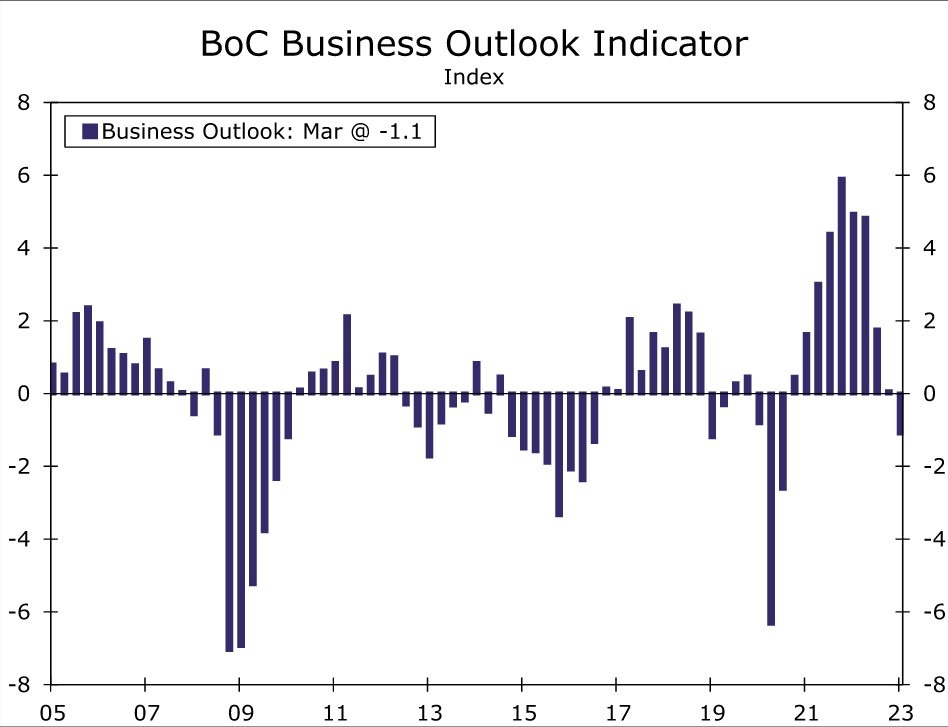
It is not just Canadian households that face a more challenging outlook. In the BoC's Q1 Business Outlook Survey, firms indicated for the fifth quarter in a row that they expected a decline in future sales. On the energy front, oil and natural gas prices are both well below their 2022 peaks, also diminishing the business outlook to some extent. In terms of investment spending, business fixed investment fell 1.4% quarter-over-quarter in Q4, which was the third straight quarterly decline. Against the backdrop of Canada's mixed economic outlook, the BoC's Q1 Business Outlook Indicator fell to -1.1, the first time that indicator has dropped into negative territory since Q3-2020 during the height of the pandemic. Overall, although the relatively solid signals for Q1 economic activity recently prompted us to lift our 2023 full year GDP forecast for Canada to 1.0%, that would still be much slower than the 3.4% GDP growth seen in 2022.
Slowing Canadian Inflation is a Silver Lining
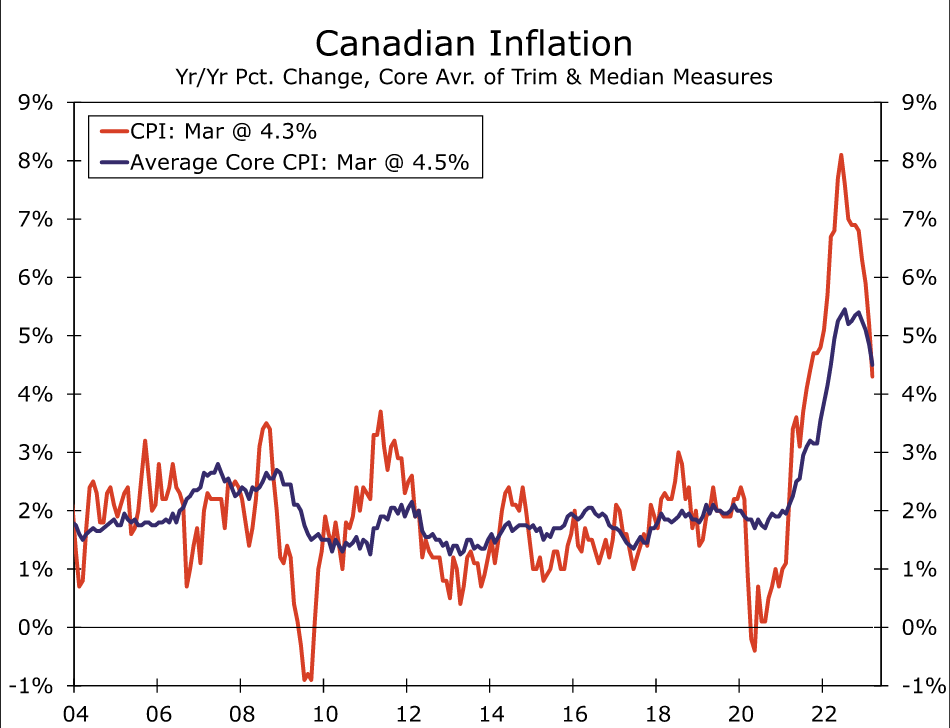
In addition to an approaching slowdown in economic growth, the other key trend within the Canadian economy that has already been evident for some months is receding inflation. The latest news on the price front came earlier this week as the March CPI slowed to 4.3% year-over-year, down from a peak of 8.1% in June last year. Lower energy prices have been an important driver of slower inflation trends. Perhaps even more significant than slower headline inflation is a perceptible slowing in underlying inflation trends, as reflected in the Bank of Canada's core inflation measures. The March trimmed mean CPI slowed to 4.4% and the weighted median CPI slowed to 4.6%, while on a three-month annualized basis those core inflation measures are running at around a 3.25%-3.50% pace. Overall, there is both good and bad news in the recent inflation figures, in that the slowing trend is clearly encouraging, but inflation is still high enough to be uncomfortable for central bank policymakers.
That discomfort was reflected in the Bank of Canada's April monetary policy announcement at which it held its policy rate steady at 4.50%. The BoC said it “continues to assess whether monetary policy is sufficiently restrictive to relieve price pressures and remains prepared to raise the policy rate further if needed to return inflation to the 2% target”. With respect to the CPI outlook, the BoC said its expects inflation to fall quickly to around 3% in the middle of this year, but “getting inflation the rest of the way back to 2% could prove to be more difficult because inflation expectations are coming down slowly, service price inflation and wage growth remain elevated, and corporate pricing behaviour has yet to normalize." In his post meeting press conference and subsequent comments, Boc Governor Macklem also said policy rate cuts this year do not look like the most likely scenario, and that it is too early for the central bank to consider rate cuts.
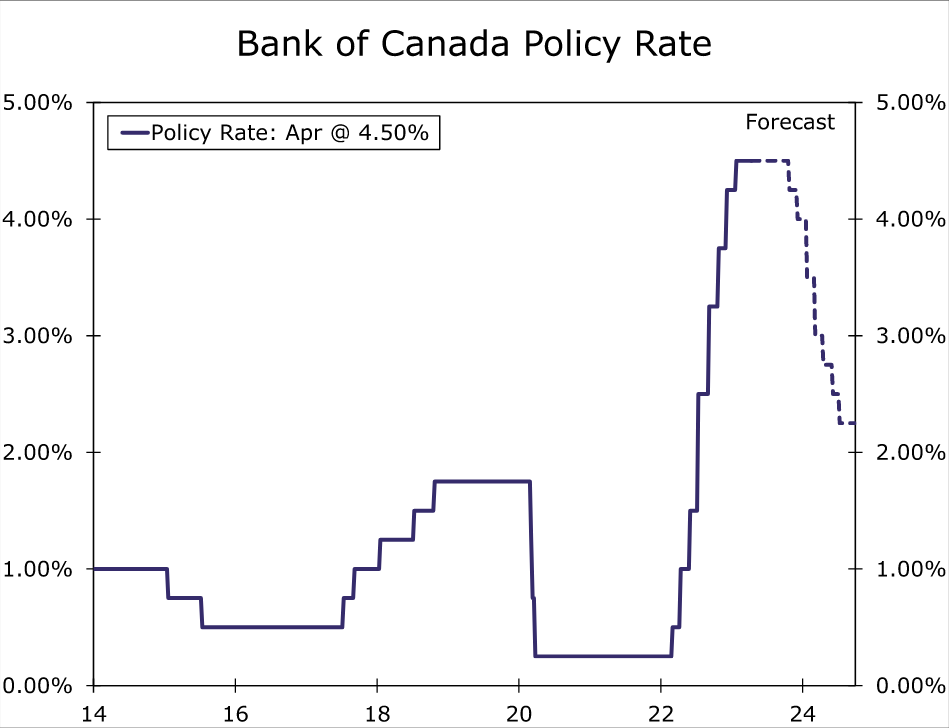
In terms of our outlook for Bank of Canada monetary policy, we do not forecast any further rate increases. Even though the Bank of Canada has signaled it is prepared to tighten further, we remain comfortable with our view, especially in the context of slower growth and inflation trends. Our outlook for Bank of Canada monetary policy also envisages monetary policy easing beginning in Q4-2023 with a cumulative 50 bps of rate cuts, with further easing anticipated in 2024. That easing is predicated upon, or in other words would require, the growth slowdown we forecast, as well as some further declaration in core inflation trends to below a 3% pace. Our BoC policy outlook is a more aggressive view than implied by market pricing, which currently sees only a moderate 14 bps of rate cuts by the end of this year, and also a reason we expect the Canadian dollar to be an underperfomer among to G10 currencies over the medium-term. Indeed, we forecast little change in the Canadian dollar versus a broadly soft greenback through the end of 2023 and through until mid-2024. We acknowledge that the more relevant risk to our Bank of Canada outlook would be later central bank rate cuts than we currently forecast, with BoC easing potentially not beginning until 2024. Whether such a delay occurs will largely hinge on whether underlying inflation trends remain stubbornly persistent and core inflation trends remain stubbornly above 3%. We will be monitoring Canada's CPI outcomes even more closely than usual in the months ahead. If core inflation fails to slow meaningfully, clearly rate cuts could be delayed until next year, in which case the risk is for a stronger Canadian dollar than we currently forecast.
RBA Review Represents Significant Progress Although Some Challenges Remain
The Reserve Bank Review recommends extensive constructive changes but issues around the dual mandate; communication; and the structure of the Monetary Policy Board contain challenges.
The much anticipated Review of the Reserve Bank has recommended sweeping changes to the operation and structure of the Bank.
There are some very significant improvements to the operating model for the Reserve Bank that are recommended in the Review.
These include establishing separate Boards to cover monetary policy and corporate governance; removing the ability of the Treasurer to override RBA decisions; removing the RBA’s ability to directly control bank lending decisions; ensuring the Treasury secretary sits on the Board in a non-political capacity; and calling for more clarity around the way the Council of Financial Regulators operates, particularly with respect to macroprudential policy.
Separating the Board responsibilities between governance and monetary policy highlights the importance to the nation of a well researched approach to setting interest rates.
The Review recommends a tightening of the wording around the Bank’s key policy objectives and gives equal weighting to inflation and full employment.
It has appropriately recommended that the wording around inflation – “on average over the cycle” should be tightened to set a specific objective path back to the middle of the 2–3% target range.
It must be noted that the Bank already sets out that path in its forecast tables in the quarterly Statement on Monetary Policy (SOMP).
For example, in the February SOMP the target timing is clearly set out as June 2025.
The new arrangements are likely to ensure that the Board is forced to defend that timing. Certainly the current timing seems to be a less ambitious objective than other central banks who are planning to reach their targets earlier. Defending a less ambitious target will be a welcome discipline under the new arrangements.
The Governor’s defence, and part of his justification that rates in Australia do not need to go as high as in comparable systems such as US; Canada; and New Zealand, is that he is more mindful of protecting the employment gains over the last year. That is an indirect way of noting the dual mandate around inflation and employment.
But that approach of “protecting the employment gains where possible” is likely to be tightened significantly under the recommended arrangements. Under the Review an explanation of the expected path back to full employment will be required.
That raises a number of issues – firstly, the point definition of the full employment rate and secondly the well understood challenge in policy of having only one instrument (the cash rate) and two quantitative objectives – inflation and full employment.
Inflation targeting evolved from the empirical observation that economies which attained stable inflation were able to operate closer to maximum capacity – indirectly achieving the full employment goal without having to adopt a quantitative employment target at the first stage. No doubt the Bank’s forecasts are likely to indicate that achieving the inflation target will eventually allow the achievement of full employment in the steady state but the path of the unemployment rate in the near term will be difficult to balance as the Bank pursues its specific inflation target.
It is proposed that Board meetings be cut back from eleven per year to eight and every Board meeting is followed by a press conference.
If the objective is to improve communication and the understanding of the monetary policy process this is not an unambiguous improvement. While the press conference will allow the direct questions along the lines of what we observe at the FOMC press conferences, which is an advantage, the trade off will be that we will only receive eight Board Minutes per year. The Board Minutes have become a rich source of information allowing an understanding of the evolution of policy. Receiving those Minutes on a less frequent basis will be a disappointment. But there is certainly merit in the observation in the Review that fewer meetings will allow more time to respond to developments.
The structure of the Monetary Policy Board is proposed as nine members, including the Governor; the Deputy Governor; and the Secretary of the Treasury. Other Board members will be selected on the basis of their understanding of various aspects of the decision process including macro economics; financial markets; the labour market; wages/inflation; industry policy and fiscal policy.
It is planned that these members will be much more closely linked in with the Reserve Bank, spending, on average, around one day per week, at the Bank, while still retaining their current employment. If that one day guideline is to be a condition of membership it will probably preclude the CEO’s who have held Board positions in the past given the demands on their time. It will also exclude anyone practising in the financial system, given obvious conflicts; and may lean heavily on those people such as academics and retirees who are not conflicted and can find the necessary time to spend at the Bank. That will have the obvious disadvantage of not being able to bring people with current relevant practical experience to the table.
The model has a huge advantage in that the impressive research resources of the Bank’s staff will have much more direct access to Board members. This is emphasised in the Review where specialist advisory committees including staff are proposed. With the Bank’s two representatives on the Board likely to find their influence being diluted relative to the current arrangements it is critical that the Australian people continue to get the best use of the Bank’s impressive research resources for the policy process.
It will be very important to get a balanced make up of the Monetary Policy Board. The record of the so called “Shadow Monetary Policy Committee” which seemed to consistently adopt a hawkish bias serves as an important warning around the risks of biasing a committee too far towards one particular group such as academics.
With the decision process in the Monetary Policy Board now being subject to a vote it is disappointing that dissenting voters do not have the responsibility to set out the reasons for their dissent. That is a time honoured practice at the FOMC and provides additional insights into the decision making process. Under the current proposal only the “unattributed” vote count will be reported. Independent Board members will have the flexibility to speak out and the responsibility to make at least one speech per year. This arrangement seems somewhat haphazard and would be better handled with dissenting reports being required.
The Review recommends a closer alignment between fiscal and monetary policy. We expect that will be welcomed at the Bank.
A recent study by respected modeller Chris Murphy at the ANU calculated that inflation, which printed 7.8% in 2022, would have been 3 ppt’s lower if fiscal and monetary policy had not been excessively expansionary over the COVID period. He attributed 2.4 ppt’s to fiscal policy and, only, 0.6 ppt’s to monetary policy. This example, while extreme, highlights the challenges faced by the Bank in achieving its targets when other policy instruments are operating in a different direction.
USD/JPY Turns Green Above 133.50, Dips Supported
Key Highlights
- USD/JPY climbed above 134.50 before sellers appeared.
- A key bullish trend line is forming with support near 133.50 on the 4-hour chart.
- Crude oil price slowly moved lower below the $78.80 support.
- The US Manufacturing PMI could decline from 49.2 to 49.0 in April 2023.
USD/JPY Technical Analysis
The US Dollar gained pace after it broke the 133.50 resistance against the Japanese Yen. USD/JPY climbed above the 134.20 and 134.50 levels.
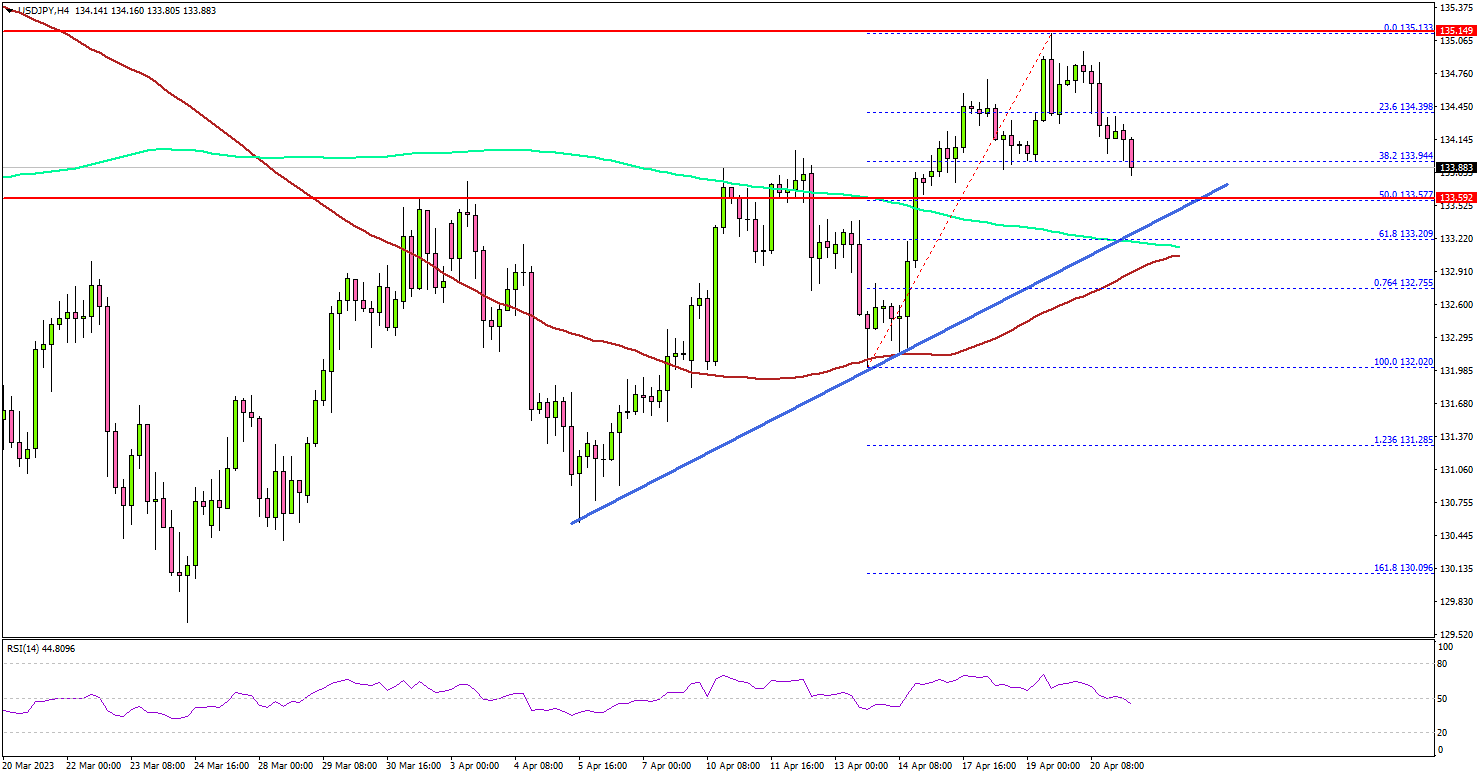
Looking at the 4-hour chart, the pair traded as high as 135.13. Recently, it started a downside correction below the 134.50 level. There was a break below the 23.6% Fib retracement level of the upward move from the 132.02 swing low to the 135.13 high.
On the downside, there is a major support forming near 133.55. There is also a key bullish trend line forming with support near 133.50 on the same chart.
The trend line is near the 50% Fib retracement level of the upward move from the 132.02 swing low to the 135.13 high. A break below the trend line might call for a test of the 200 simple moving average (green, 4 hours) or the 100 simple moving average (red, 4 hours).
Any more losses might send USD/JPY toward the 132.00 support. On the upside, the pair is facing resistance near the 134.80 level.
The next key resistance is near the 135.20 zone. A clear move above the 135.20 resistance might send the pair toward the 135.80 zone. Any more gains might send the pair toward 136.20.
Looking at crude oil prices, there was a steady decline and the bears were able to push the price below the $78.80 support.
Economic Releases
- Germany’s Manufacturing PMI for April 2023 - Forecast 45.7, versus 44.7 previous.
- Germany’s Services PMI for April 2023 - Forecast 53.3, versus 53.7 previous.
- Euro Zone Manufacturing PMI for April 2023 – Forecast 48.0, versus 47.3 previous.
- Euro Zone Services PMI for April 2023 – Forecast 54.5, versus 55.0 previous.
- UK Manufacturing PMI for April 2023 – Forecast 48.5, versus 47.9 previous.
- UK Services PMI for April 2023 – Forecast 52.9, versus 52.9 previous.
- US Manufacturing PMI for April 2023 – Forecast 49.0, versus 49.2 previous.
- US Services PMI for April 2023 – Forecast 51.2, versus 52.6 previous.
Yen Awaits Japan’s Inflation as BoJ Meeting Approaches
Investors will be exploring Japan’s CPI inflation report during Friday’s Asian session in order to get clarity on whether inflation is persisting enough to provoke a tweak in the super accommodative monetary policy. Forecasts are for steady growth after February’s downturn from multi-decade highs, though investors will be on alert for any surprises, which could signal changes in monetary guidance, generating fresh volatility in the yen.
BoJ to stay on course but not for long
Headline inflation rose at its fastest pace since the end of 1990 in January, while the core measure, which excludes food and energy prices, hit the highest since the 1980s, fueling speculation that the Bank of Japan (BoJ) could soon end its ultra-easy monetary strategy. Despite investors debating over a potential hawkish policy tweak, the BoJ has been bravely dialling down expectations for a hawkish rotation even if its major counterparts are well ahead in the tightening cycle.
The departure of former BoJ governor Haruhiko Kuroda, who was the first to kick off the aggressive monetary easing strategy a decade ago, did not alter the central bank’s language. Instead, his successor Kazuo Ueda affirmed that current ultra-easy settings are appropriate in the meantime as a sustained achievement of the 2.0% inflation target has yet to be achieved. Neither has nominal wage growth climbed sustainably above 3.0% as the central bank desires, although spring wage talks with unions and businesses promised increases of around 5.0% from April onwards, with real wage growth remaining negative at -2.2% y/y at the moment.
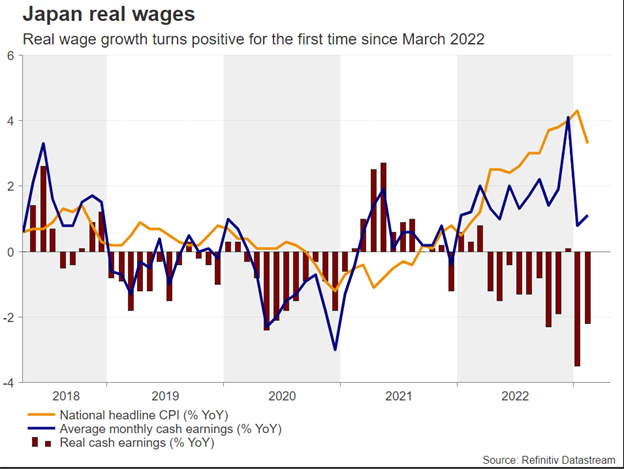
As a result, market pricing for a rate hike at next week’s policy meeting and till September remains zero. On the other hand, commentary on the controversial yield curve control, which aims to keep the 10-year bond yield around 0.5%, has been more ambiguous, with polls showing that scrapping yield curve control is the second most popular choice among investors after a tweak in policy guidance.
That probably comes as evidence from previous months showed that even under massive policy easing domestically in Japan, yields can still go higher if foreign central banks are raising rates. Perhaps it’s a tool worth keeping for now as GDP growth figures are not that great in Japan and global recession risks loom. However, with major peers such as the Fed unwilling to reverse monetary policy in the face of inflation, the BoJ may have a tough time in sustaining the cap through massive bond buying, with the domestic currency also suffering from negative side effects.
CPI inflation
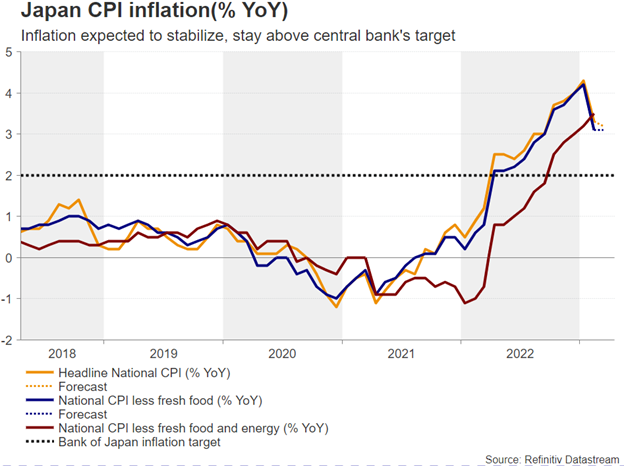
On Friday it would be interesting to see if Japan’s headline CPI inflation inched lower to 3.2% y/y from 3.3% previously and 4.3% y/y in February without the central bank’s aid as forecasts suggest. The core measure, which excludes volatile food and energy prices, is expected to stabilize at 3.1% y/y. If that proves to be the case or the figures head lower, pressure for a policy change may soften. Alternatively, a new inflation upturn before businesses raise wages as pledged could increase criticism on the current accommodative settings during the April 28 gathering.
USD/JPY
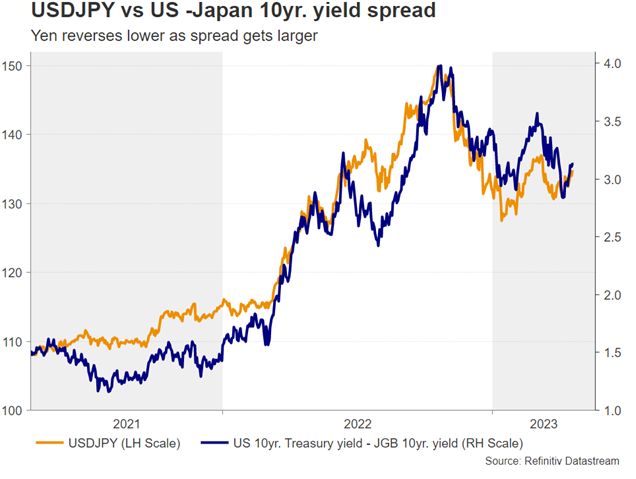
As regards the market reaction, a notable upside deviation from forecasts could help the yen regain some lost ground. Looking at USD/JPY, the 200-day simple moving average (SMA) could immediately come under the spotlight at 133.75. Breaking that base, the price may pause near 132.80 before heading for the key support trendline seen at 131.80.
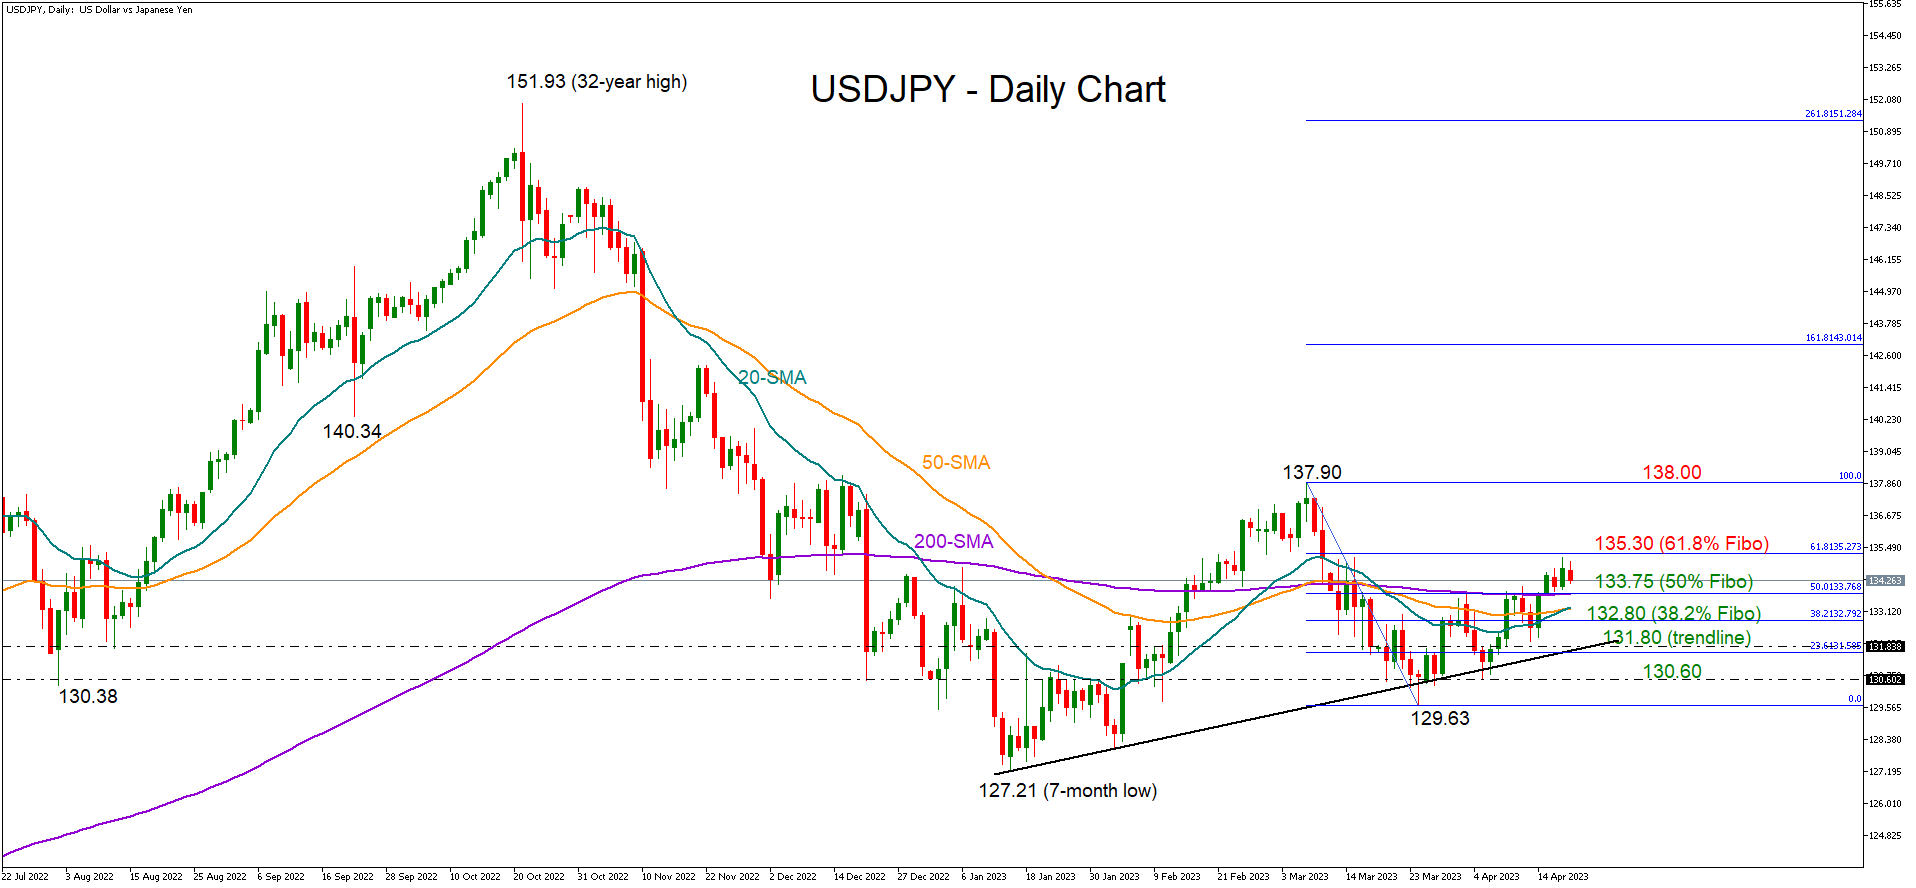
Alternatively, weaker-than-expected readings may back “Abenomics” policies, which many members of the ruling LDP party are still endorsing. The spread between the 10-year US and Japan government bond yields could maintain its latest upturn, helping the dollar to breach the 135.30 resistance and rally towards the March high of 137.90.
USD/JPY: Weaker Near Term Tone on Downbeat US Data
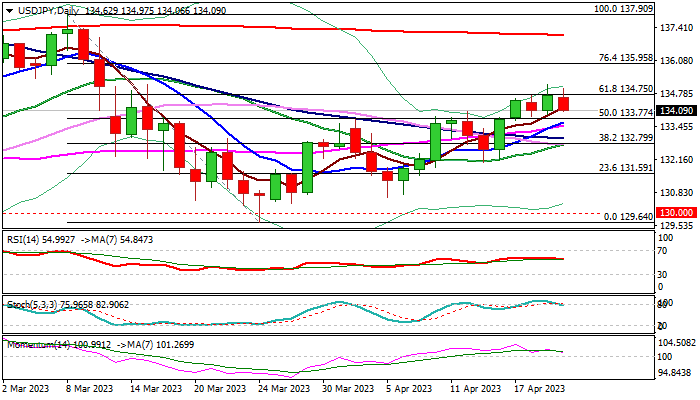
The USDJPY started to lose traction after repeated failure to clearly break through pivotal Fibo resistance at 134.75 (61.8% of 137.90/129.64 descend).
Fresh weakness was sparked by stronger than expected rise in US weekly jobless claims and significantly weaker Philly Fed reports in April, which add to already gloomy outlook. The price returned into thick daily Ichimoku cloud (cloud top lays at 134.45) but remains within a congestion which extends into fourth straight day, keeping intact larger bulls off 129.64 (Mar 24 low).
Daily studies show stochastic emerging from overbought territory and fading bullish momentum, generating initial signals of pullback, which sees a minimum requirement for confirmation on break of 133.70 zone (congestion base, reinforced by rising 10DMA).
Loss of 133.70 supports is also needed to signal a bull-trap above 134.75 Fibo level and open way for deeper pullback which will be seen as a healthy correction while extended dips hold above daily cloud base (132.56). Otherwise, near-term action would be paused for extended consolidation before bulls resume, with sustained break of 134.75/135.13 pivots (Fibo / Apr 19 high to spark fresh acceleration higher.
Res: 134.45; 134.75; 135.13; 135.95.
Sup: 133.70; 132.99; 132.56; 132.58.
Sunset Market Commentary
Markets
Today’s ECB March meeting minutes gave a glimpse into the central bank’s analysis of the financial turbulence in the wake of the Silicon Valley Bank collapse. Delivering on the pre-announced 50 bps hike was important to instill confidence and avoid creating further uncertainty in financial markets, MPC members agreed. The ECB acknowledged the risk of a potential banking crisis. But given that the next policy meeting wasn’t scheduled before May, the governing council would have time to asses the effect of any potential tightening in financing conditions on inflation dynamics in between. In general though, it was agreed that while keeping a close eye on financial stability was important, price stability (i.e. bringing inflation back to target) should be reiterated as being the primary objective and more tightening would follow if the March projections materialize. Members also said that the message should be conveyed that if the market turmoil hadn’t occurred, the council would have put forward more (unconditional) rate hikes. With the benefit of hindsight, it looks that the ECB was right not to get carried away by the banking turmoil. As the dust settled, several governors in the meantime stressed the need for further tightening with most of them explicitly keeping the option of either a 25 of 50 bps rate hike firmly on the table. Dutch governor Klaas Knot was the latest today to do so. He said that the ECB may need to raise interest rates in June and July following a May rate hike. In a (in our view too) conservative scenario of a 25 bps May hike, that would bring the deposit rate to 3.75%. “It’s too early to talk about a pause”, he said. That’s an option only when underlying inflation has shown a convincing reversal. Talking about the size, he said April inflation data is going to be key. This is scheduled for release two days before the May 4 policy meeting, together with other crucial input coming from the Bank Lending Survey. ECB president Lagarde in a speech today added to the debate, saying that “there’s still a little way to go on the path”, citing too high inflation compared to the 2% target.
In other news, US data today undershot expectations. US weekly jobless claims came in at 245k, slightly more than the 240k expected. The Philly Fed business outlook however missed a -19.3 consensus considerably. The indicator fell from -23.2 to -31.3, mainly driven by a drop in prices paid (from 23.5 to 8.2). The other components and the six month ahead gauge improved, though remained in contraction territory. Core bond yields nevertheless extended an earlier decline after the release. US yields ease between 4.2-7.4 bps with the front outperforming. German yields in a similar curve shift decline 3.2-5.6 bps. The dollar is trading with a minor disadvantage against most peers, including the euro. EUR/USD ekes out a tiny gain but remains sub 1.10. The trade-weighted index eases marginally to 101.82. Sterling is going nowhere. EUR/GBP keeps steady above 0.88 with a triangle slowly but steadily closing as it awaits the next UK data (retail sales tomorrow). Stocks in Europe and the US loses about half a percent or more.
News & Views
Belgian consumer confidence rose from -9 to -6 in April, the highest level since February 2022 and slightly above its long-term average. Consumers expressed slightly more optimism about expected macroeconomic developments in Belgium (-15 from -16) and, to a greater extent, have revised downwards their fears of a rise in unemployment over the next twelve months (14 from 19). On a personal level, households are more confident about their future financial situation (6 from 4) and have increased their saving intentions (-6 from -9). April Belgian business confidence will be released next week Monday April 24.
The Belgian National Accounts Institute (NAI) released data of government deficit and public debt in the context of the excessive deficit procedure. For 2022, the general government budget balance was -3.9% of GDP, compared with -5.5% in 2021. The improvement in the budget balance was attributable to the strong economic recovery in the wake of the pandemic. Pandemic-related expenditure meanwhile dropped sharply after 2020 (€19.4bn in 2020 vs €2.7bn in 2022). Part of this support has nevertheless been replaced by measures to counter rising energy prices (€5.9bn). Public debt (as per the Maastricht definition) amounted to 105.1% of GDP at the end of 2022. This represents a contraction of 4.0 percentage points of GDP compared to 2021. The favorable development of the debt ratio in 2022 was entirely attributable to strong nominal GDP growth.
Can USD Reverse in April?
As we move away from the bank crisis and de-dollarization concerns, a significant question on the minds of many traders is whether the US Dollar will experience a corrective rebound from its current position. This is a crucial question because it will set a precedent for predicting the price action of various commodities, particularly gold. To answer this question, let's examine the current price action on the charts and determine whether the US Dollar will strengthen in April after several weeks of bearish momentum.
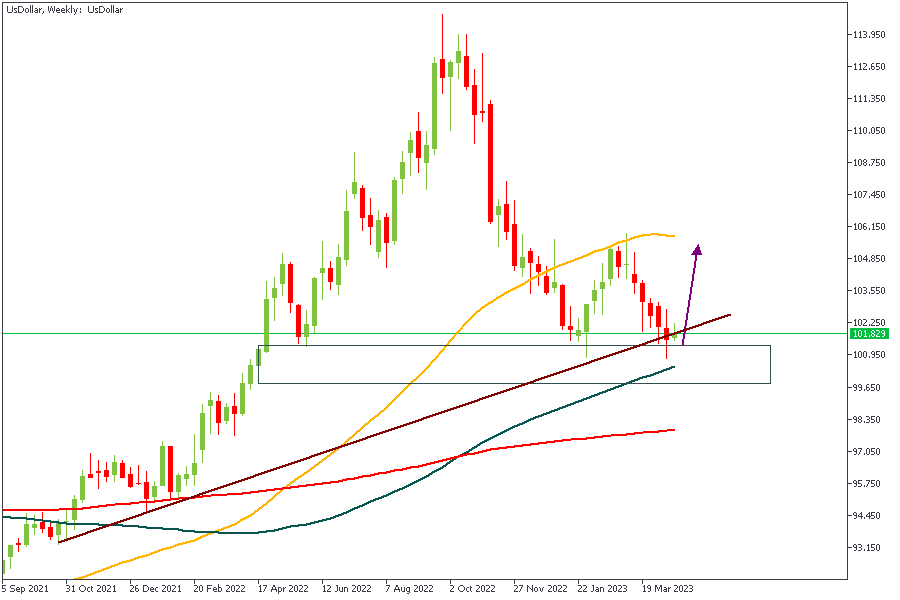
US DOLLAR - Weekly Timeframe
The US Dollar chart on the weekly timeframe shows the price currently around a key rally-base-rally demand zone with a confluence of trendline support, the 100-Period Moving Average, and a bullish array from the moving average positions. This confirms, to a large extent, the bullish sentiment and the expectation of a reversal from the Dollar in April.
Analysts’ Expectations:
- Direction: Bullish
- Target: 103.933
- Invalidation: 99.629
EURUSD - Weekly Timeframe
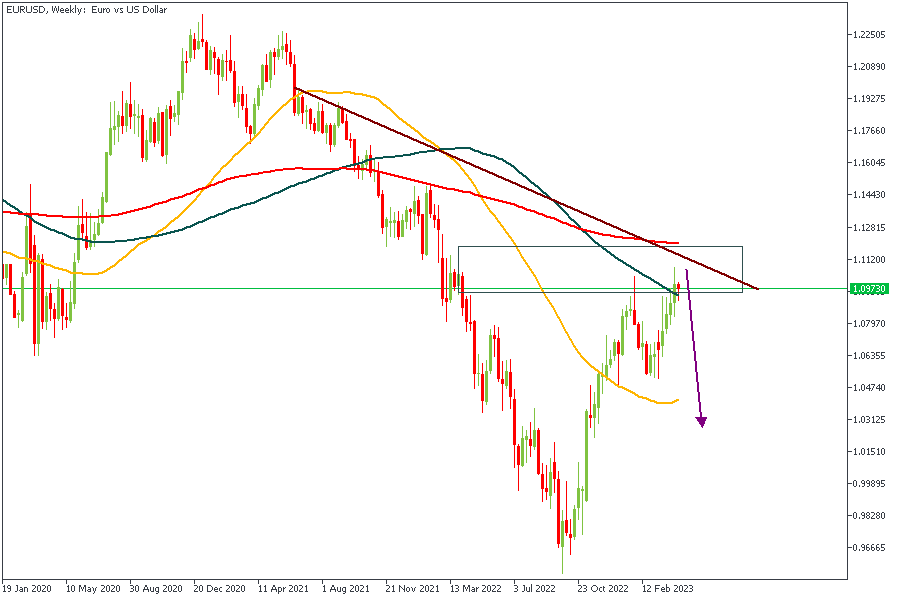
EURUSD has reached an important drop-base-drop supply zone on the weekly timeframe. A resistance trendline intersects this supply zone and the 100-Period Moving Average. Considering the manner of arrangement of the Moving Averages and the 88% of the Fibonacci retracement, we will likely see a big bearish movement away from the supply zone.
Analysts’ Expectations:
- Direction: Bearish
- Target: 1.07088
- Invalidation: 1.11839
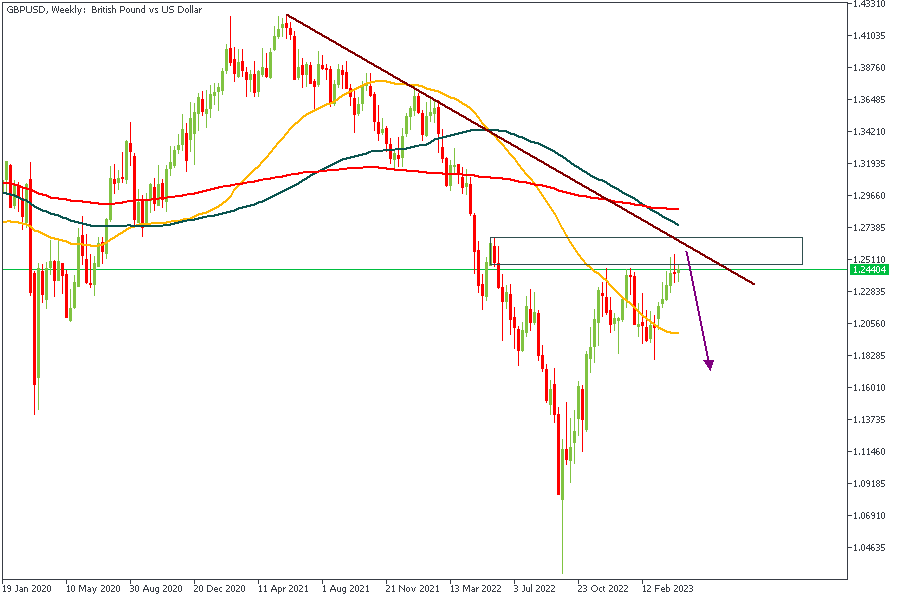
GBPUSD - Weekly Timeframe
Similar to the EURUSD scenario, we find GBPUSD playing out within a rally-base-drop supply zone with the trendline intersection. The 100-Period Moving Average is also within close reach of the current price spot, which could contribute to the bearish movement as a resistance level.
Analysts’ Expectations:
- Direction: Bearish
- Target: 1.21033
- Invalidation: 1.26882
USDCAD - Weekly Timeframe
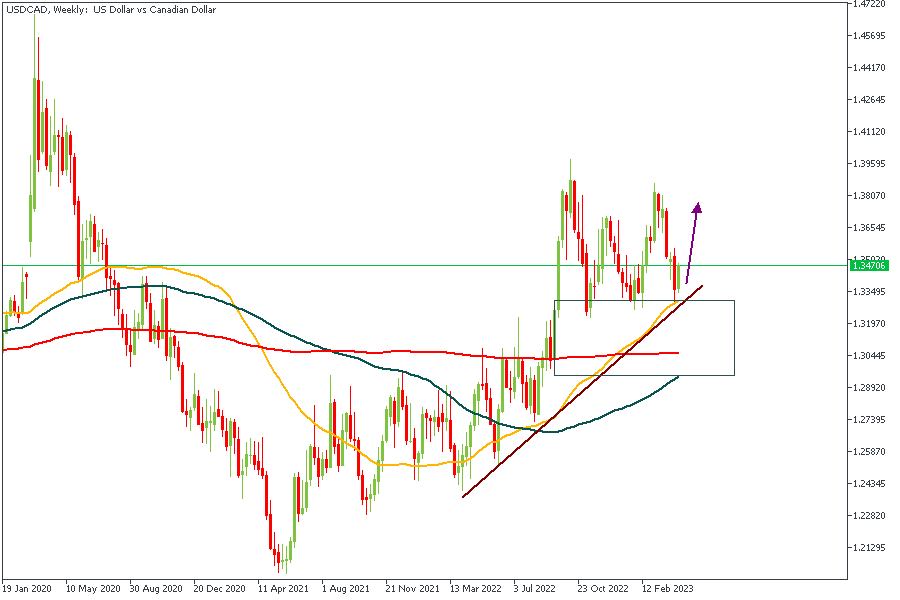
If the US Dollar truly plays out stronger, it would lead to a bullish price action here on the weekly timeframe of USDCAD. As a result, we need to check for factors that may contribute to the bullish outcome. First, the rally-base-rally demand zone and the 50-Period Moving Average serve as the initial confirmation. At the same time, the trendline support and the 76% of the Fibonacci retracement tool can be considered secondary confirmation factors. Overall, the bullish sentiment seems valid beyond any doubt.
Analysts’ Expectations:
- Direction: Bullish
- Target: 1.38227
- Invalidation: 1.29965
CONCLUSION
The trading of CFDs comes at a risk. Thus, to succeed, you have to manage risks properly. To avoid costly mistakes while you look to trade these opportunities, be sure to do your due diligence and manage your risk appropriately.
LTCUSD Technical Analysis: Bearish Engulfing Pattern Is Below $103.38
Bulls couldn't keep control of the market last week, and after touching a high of $103.38 on 18 April, the price declined against the US Dollar, touching a low of $89.06 today in the early Asian trading session.
There is a bearish engulfing pattern below the $103.38 handle on the H1 timeframe. It signifies the end of a bullish phase and the start of a bearish phase in the market.
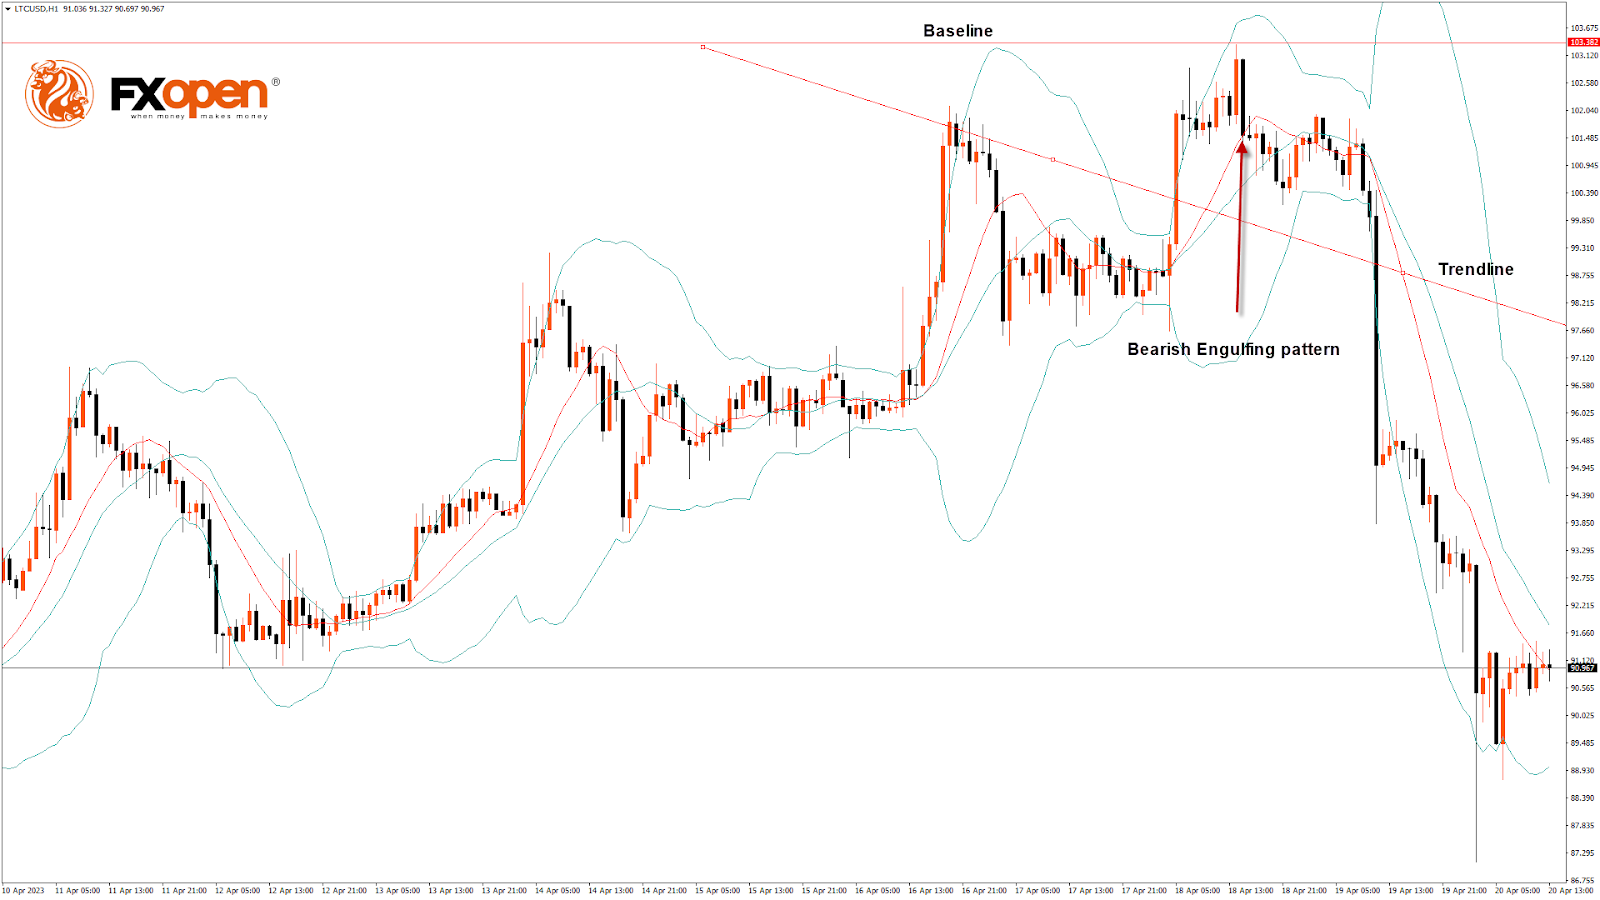
The MACD has crossed down its moving average in the daily timeframe. Also, Litecoin is trading below its 100-hour simple moving average, 200-hour exponential moving average, and pivot level of $91.04.
The relative strength index is at 30.14, indicating very weak demand for Litecoin and the continuation of the selling pressure in the markets.
Litecoin remains below all of the moving averages, which are giving a bearish signal at current market levels of $90.37.
The STOCHRSI is signaling overbought market conditions, which means that the price is expected to decline in the short term.
The short-term outlook for Litecoin has turned strongly bearish.
- All technical indicators a bearish
- Litecoin bearish reversal is seen below the $103.38 level.
- The RSI is bearish.
- The average true range indicates low market volatility.
Litecoin Bearish Reversal Is Seen Below $103.38
Litecoin continues to move down after falling below the $95 handle, with further support levels located at $88 and $85.
20- and 50-day adaptive moving averages formed a bearish reversal pattern.
LTCUSD is about to break its classic support level of 90.10 and Fibonacci support level of 90.80, after which the path towards $85 will get cleared.
Litecoin faces resistance at $93.58, which is a 3-10 daily MACD, and at $95.36, at which the price crosses the 9-day moving average.
The Week Ahead
Litecoin has entered a consolidation zone, and a further break below the $90 barrier is expected.
Most technical indicators are signaling a bearish sentiment in the market.
Litecoin should stay above the important support level of $87.03, which is a 38.2% retracement from a 4-week low, and at $85.44, which is a 50% retracement from 13-week High/Low.
The short-term outlook for Litecoin has turned strongly bearish, the medium-term outlook is bearish, and the long-term outlook is neutral at present market conditions.
The weekly projection is $85, with a consolidation zone of $88.
ETHUSD Technical Analysis: Three Inside Down Pattern Is Below $2,140
Bulls couldn't keep control of the market, and after touching a high of $2,140 on 16 April, the ETH/USD pair declined, touching a low of $1,923 today in the early Asian trading session.
ETHUSD is under bearish pressure after falling below the $2,000 psychological support level as the global investor sentiment appears weak after the Shanghai upgrade.
The three inside down pattern is below the $2,140 handle on the H1 timeframe. It's a bearish pattern, which signifies the end of a bullish phase. Also, there is a bearish harami pattern in the H2 timeframe.
ETH is back under the pivot point, indicating the bearish pressure in the market.
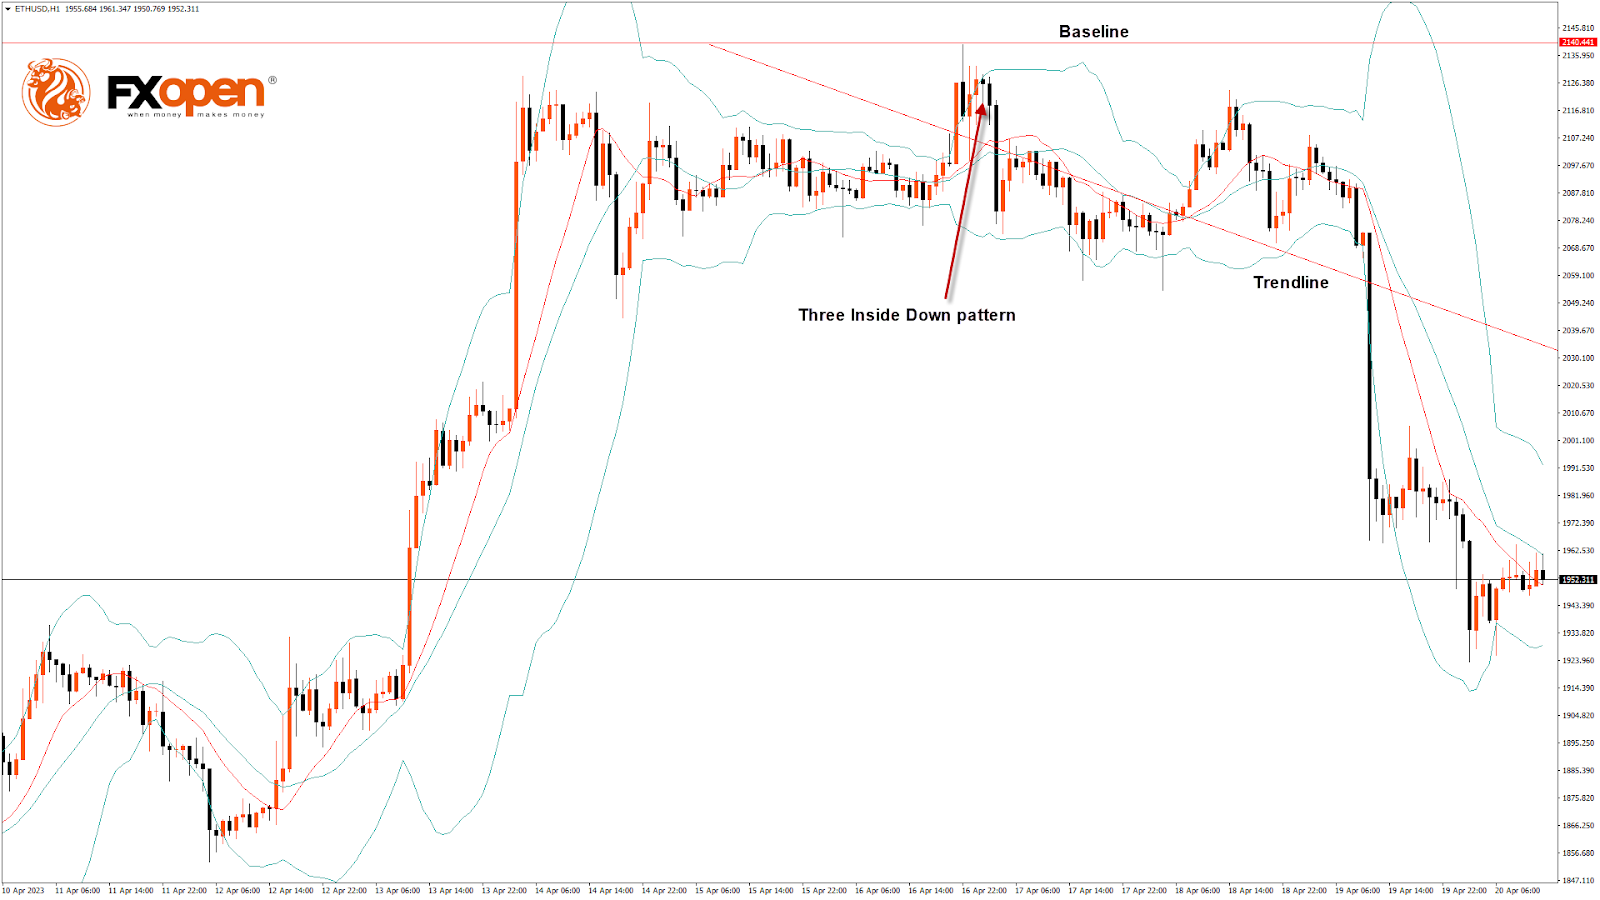
The relative strength index is at 37.74, indicating very weak demand for Ether and a continuation of the selling pressure in the market.
The STOCHRSI is giving an overbought signal, meaning that the price is expected to decline in the short-term range.
We also detected the formation of the bearish harami pattern in both the 30-minute and 1-hour timeframe.
Most of the technical indicators are bearish. Most moving averages are bearish at the current market level of $1,944.
ETH is now trading below the 100-hour simple and 200-hour exponential moving averages.
- ETH bearish reversal is seen below the $2,140 mark.
- The short-term range is expected to be strongly bearish.
- The average true range indicates low market volatility.
ETH Bearish Reversal Is Below $2,140
On the daily chart, ETH is trading just below its pivot level of $1,955 and is moving into a very strong bearish channel. The price is about to break its classic support level of $1,939 and has already broken its Fibonacci resistance level of $1,951; further supports are $1,910 and $1,850.
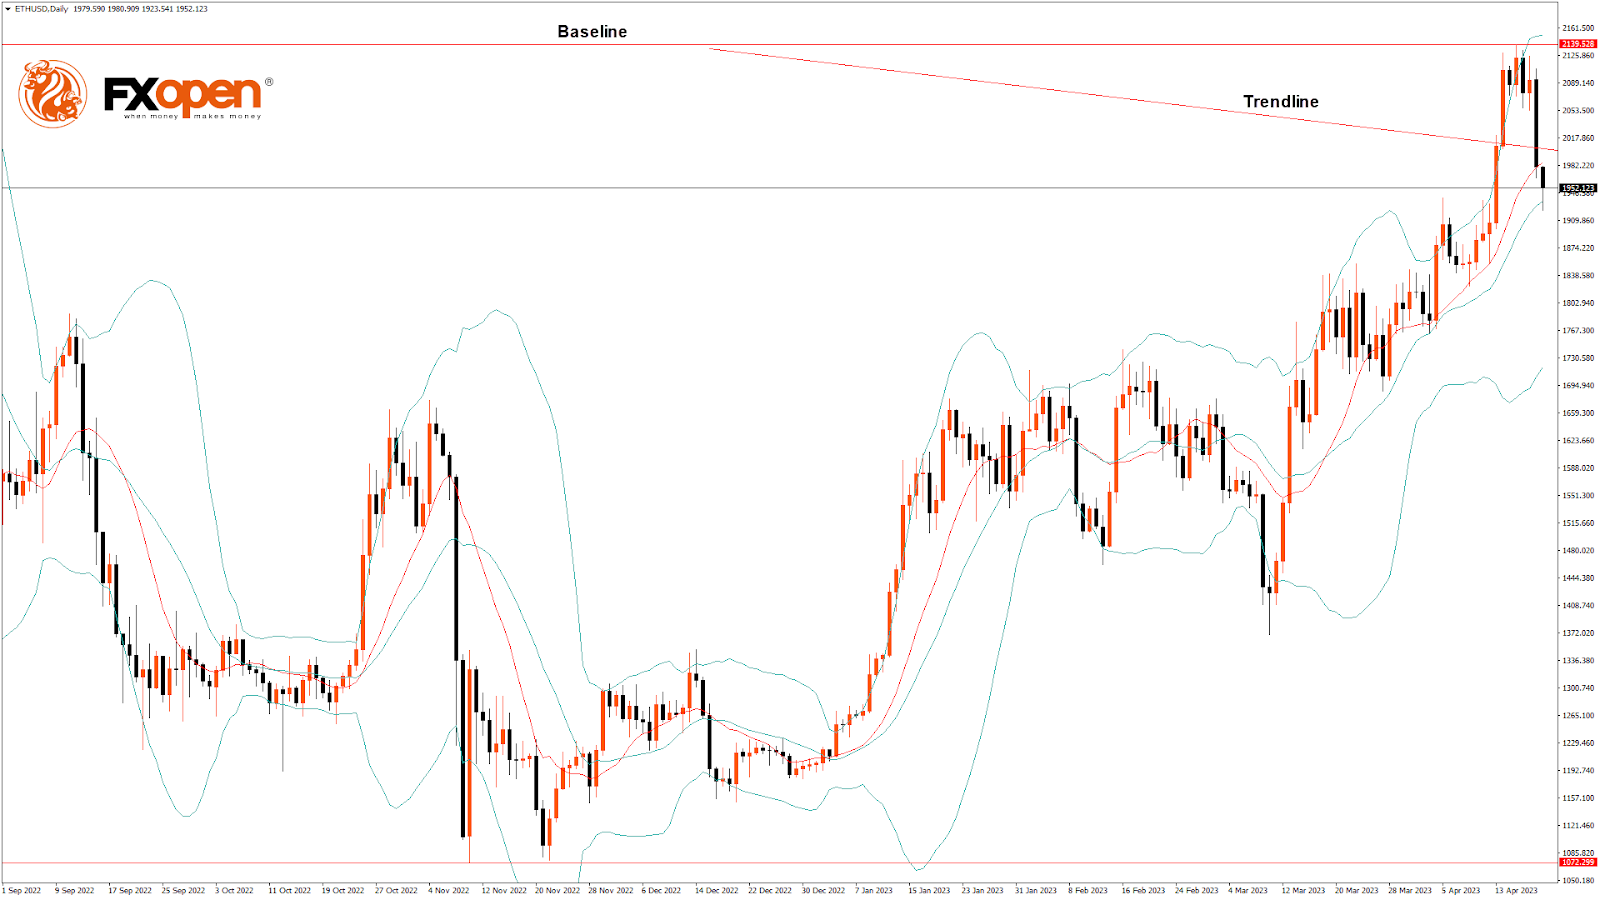
An Ichimoku bearish crossover between Tenkan and Kijun is formed in the 15-minute timeframe.
The price ranges near the channel's resistance in the 15-minute timeframe, indicating the bearish trend.
The key support levels to watch are $1,845, which is a 38.2% retracement from the 13-week high, and $1,861, which is a 14-day RSI at 50.
The Week Ahead
ETH is correcting lower below $2,000, indicative of the bearish momentum, and is expected to move towards the $1,900 level in the medium-term range in the H1 timeframe.
We see a short-term bearish trend line forming from $2,140 towards the $1,937 level.
There is a minor bearish trend line with the resistance at $1,994, at which the price crosses the 9-day moving average.
The immediate short-term outlook for ETH has turned mildly bearish, the medium-term outlook has turned bearish, and the long-term outlook is neutral in present market conditions.
The resistance zone is at $2,018, which is a pivot point, and at $2,063, which is 14-3 daily raw stochastic at 80.
The weekly outlook is $1,850 with a consolidation zone of $1,900.