

Sample Category Title
GBP/USD Daily Outlook
Daily Pivots: (S1) 1.2341; (P) 1.2389; (R1) 1.2426; More...
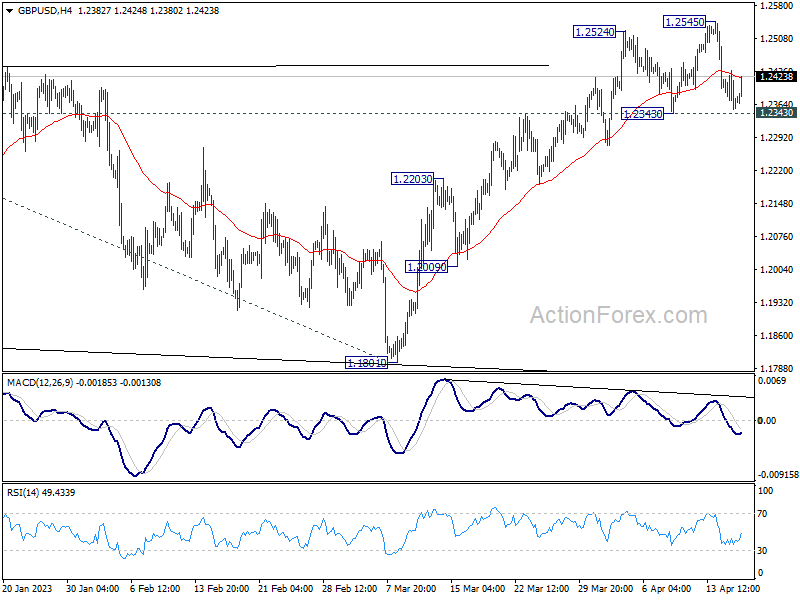
Intraday bias in GBP/USD remains neutral for the moment. Another rise is in favor with 1.2343 support intact. On the upside, above 1.2545 will target 1.2759 fibonacci level first. Firm break there will target 61.8% projection of 1.0351 to 1.2445 from 1.1801 at 1.3095. However, considering bearish divergence condition in 4H MACD, firm break of 1.2343 will confirm short term topping, and turn bias back to the downside for deeper pullback.
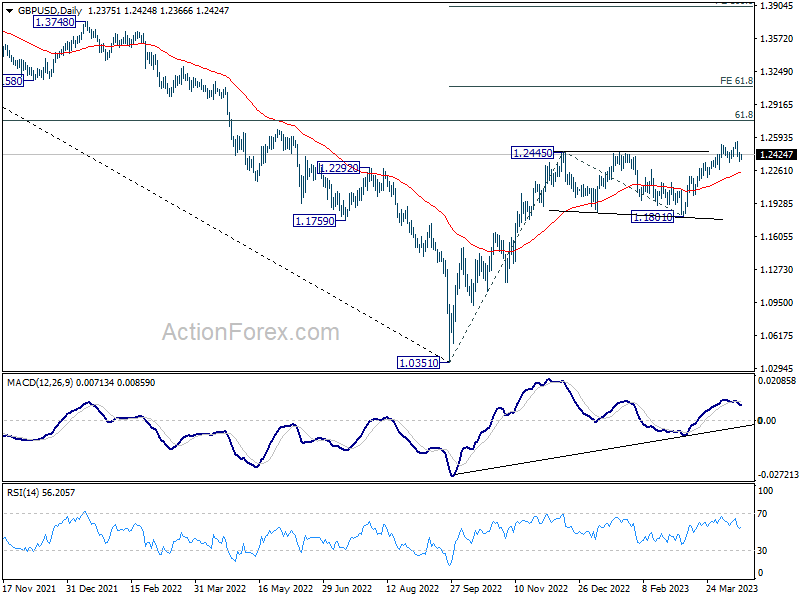
In the bigger picture, the rise from 1.0351 medium term term bottom (2022 low) is in progress for 61.8% retracement of 1.4248 (2021 high) to 1.0351 at 1.2759. Sustained break there will add to the case of long term bullish trend reversal. Further break of 61.8% projection of 1.0351 to 1.2445 from 1.1801 at 1.3095 could prompt upside acceleration to 100% projection at 1.3895. For now, this will remain the favored case as long as 1.1801 support holds, even in case of deep pull back.
USD/CHF Daily Outlook
Daily Pivots: (S1) 0.8941; (P) 0.8968; (R1) 0.9015; More...
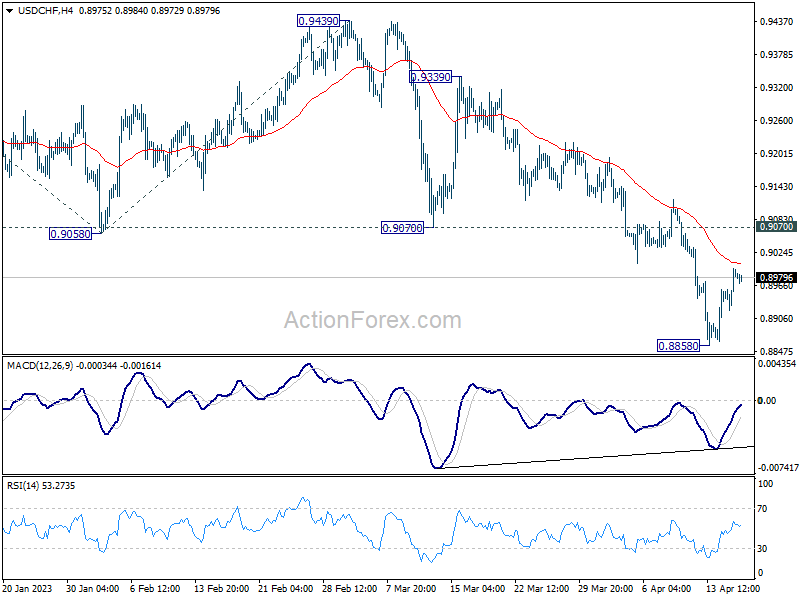
Intraday bias in USD/CHF remains neutral and another decline cannot be ruled out with 0.9070 support turned resistance intact. On the downside, below 0.8858 will resume the down trend to 61.8% projection of 1.0146 to 0.9058 from 0.9439 at 0.8767, which is close to 0.8756 long term support. Strong support is expected there to bring rebound, at least on first attempt. On the upside, break of 0.9070 support turned resistance will confirm short term bottoming and turn bias back to the upside.
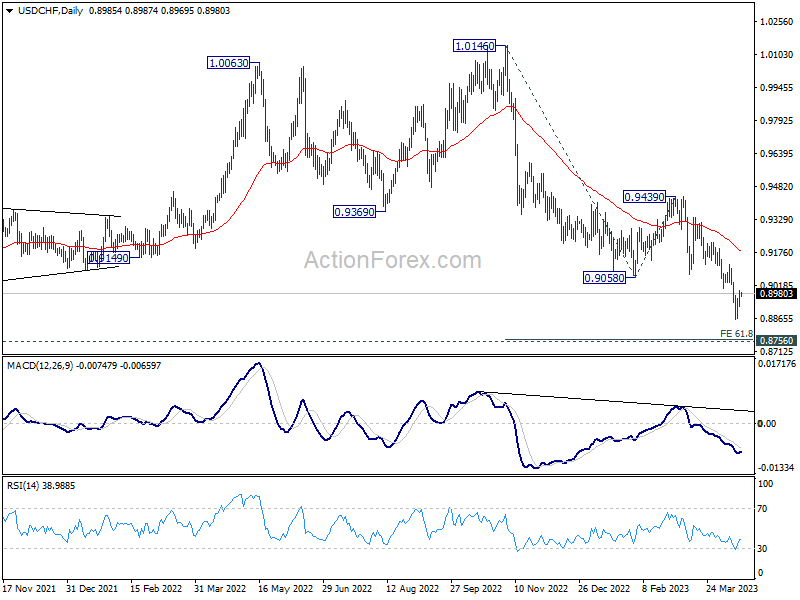
In the bigger picture, fall from 1.1046 (2022 high) is in progress for 0.8756 support (2021 low). But overall, this fall is still seen as a leg in the long term range pattern from 1.0342 (2016 high). So, downside should be contained by 0.8756 to bring reversal. Sustained break of 0.9058 support turned resistance will be the first sign of medium term bottoming. However, decisive break of 0.8756 will carry larger bearish implications.
USD/CAD Daily Outlook
Daily Pivots: (S1) 1.3351; (P) 1.3386; (R1) 1.3428; More....
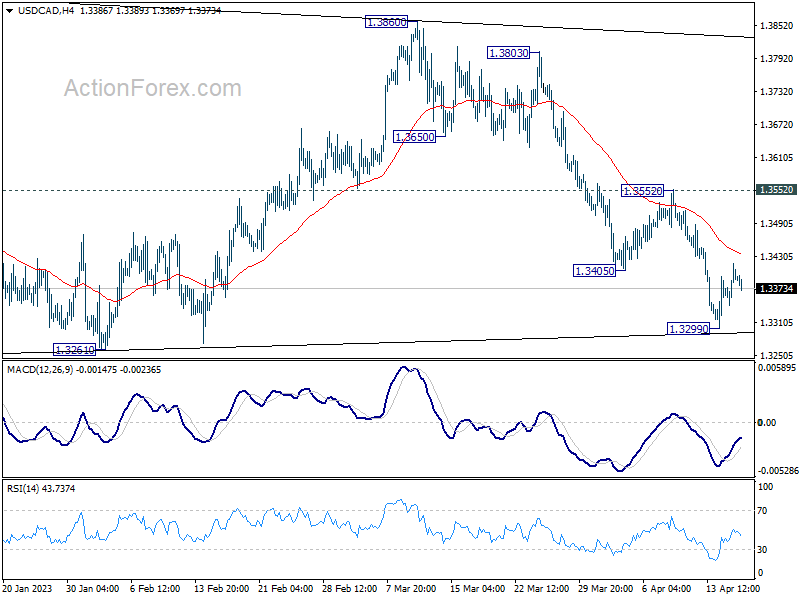
USD/CAD is staying in consolidation above 1.3299 and intraday bias remains neutral. Overall, fall from 1.3860 is seen as the third leg of the corrective pattern from 1.3976. In case of another decline, down side should be contained by 1.3224/61 support zone to bring rebound. Break of 1.3552 should turn bias back to the upside for stronger rally.
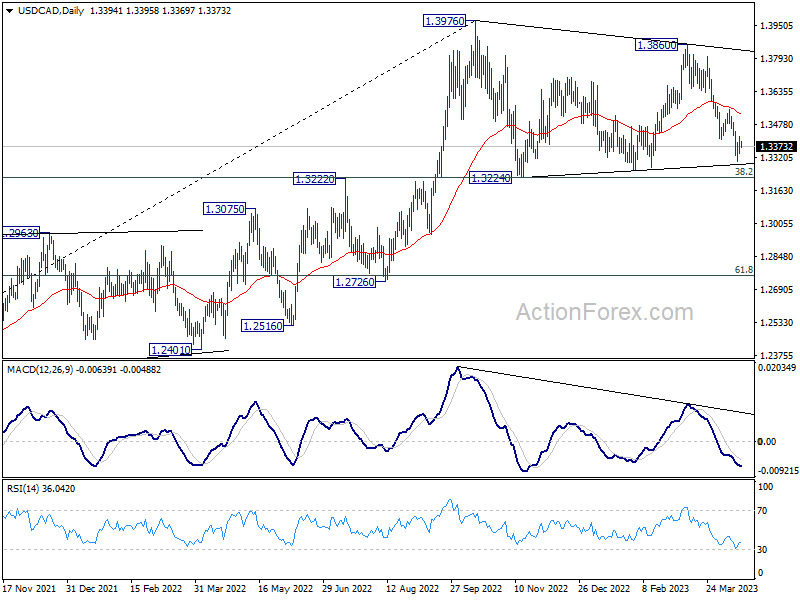
In the bigger picture, the up trend from 1.2005 (2021 low) is still in progress. Break of 1.3976 will confirm resumption and target 61.8% projection of 1.2401 to 1.3976 from 1.3261 at 1.4234. Firm break there will pave the way to long term resistance zone at 1.4667/89 (2016, 2020 highs). On the downside, sustained break of 55 W EMA (now at 1.3282) is needed to confirm medium term topping. Otherwise, outlook will remain bullish even in case of deep pull back.
USD/JPY Daily Outlook
Daily Pivots: (S1) 133.93; (P) 134.25; (R1) 134.79; More...
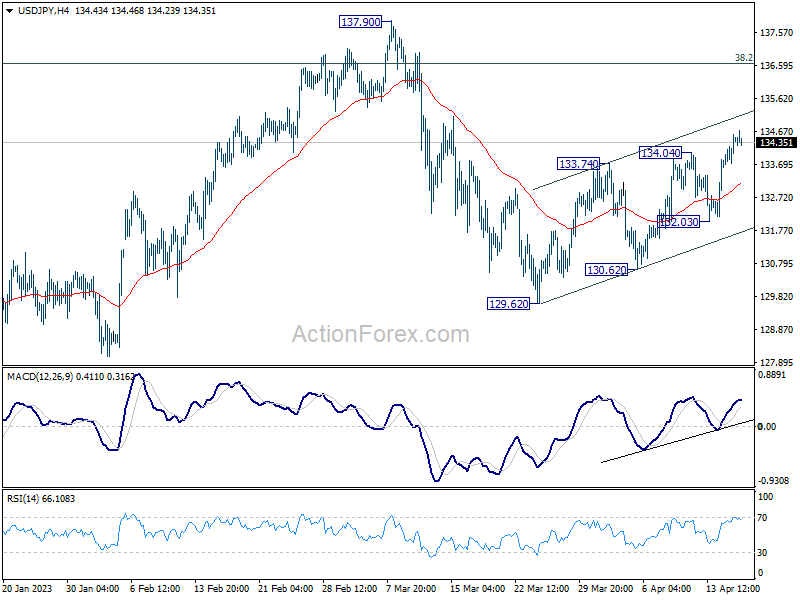
USD/JPY's rally is still in progress and intraday bias stays on the upside. Rebound from1 29.62 would extend towards 137.90 resistance. For now, further rise will remain in favor as long as 132.03 support holds, in case of retreat.
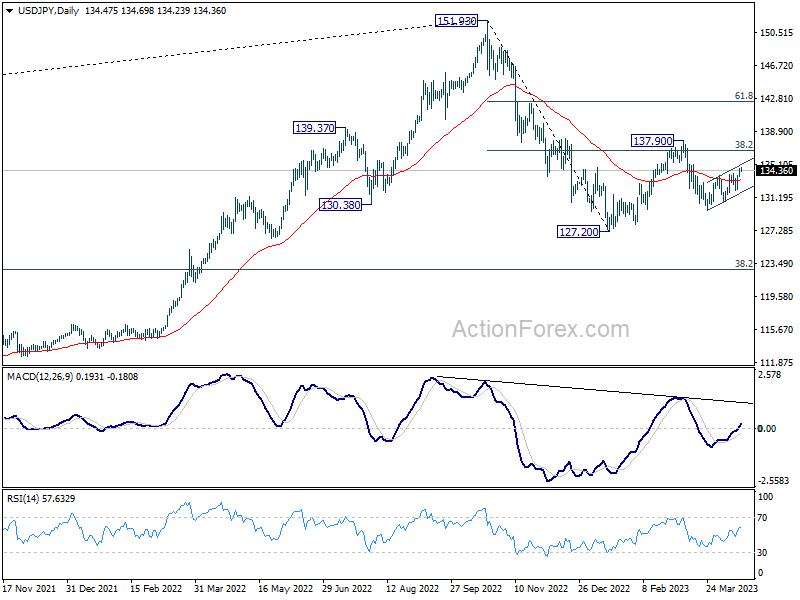
In the bigger picture, corrective pattern from 127.20 might be extending. But after all, down trend from 151.93 is expected to resume at a later stage. Break of 127.20 will resume this down trend and target 61.8% projection of 151.93 to 127.20 from 137.90 at 122.61. This will now be the favored case as long as 137.90 resistance holds.
USD Continues to Recover
AUD/USD seeks support
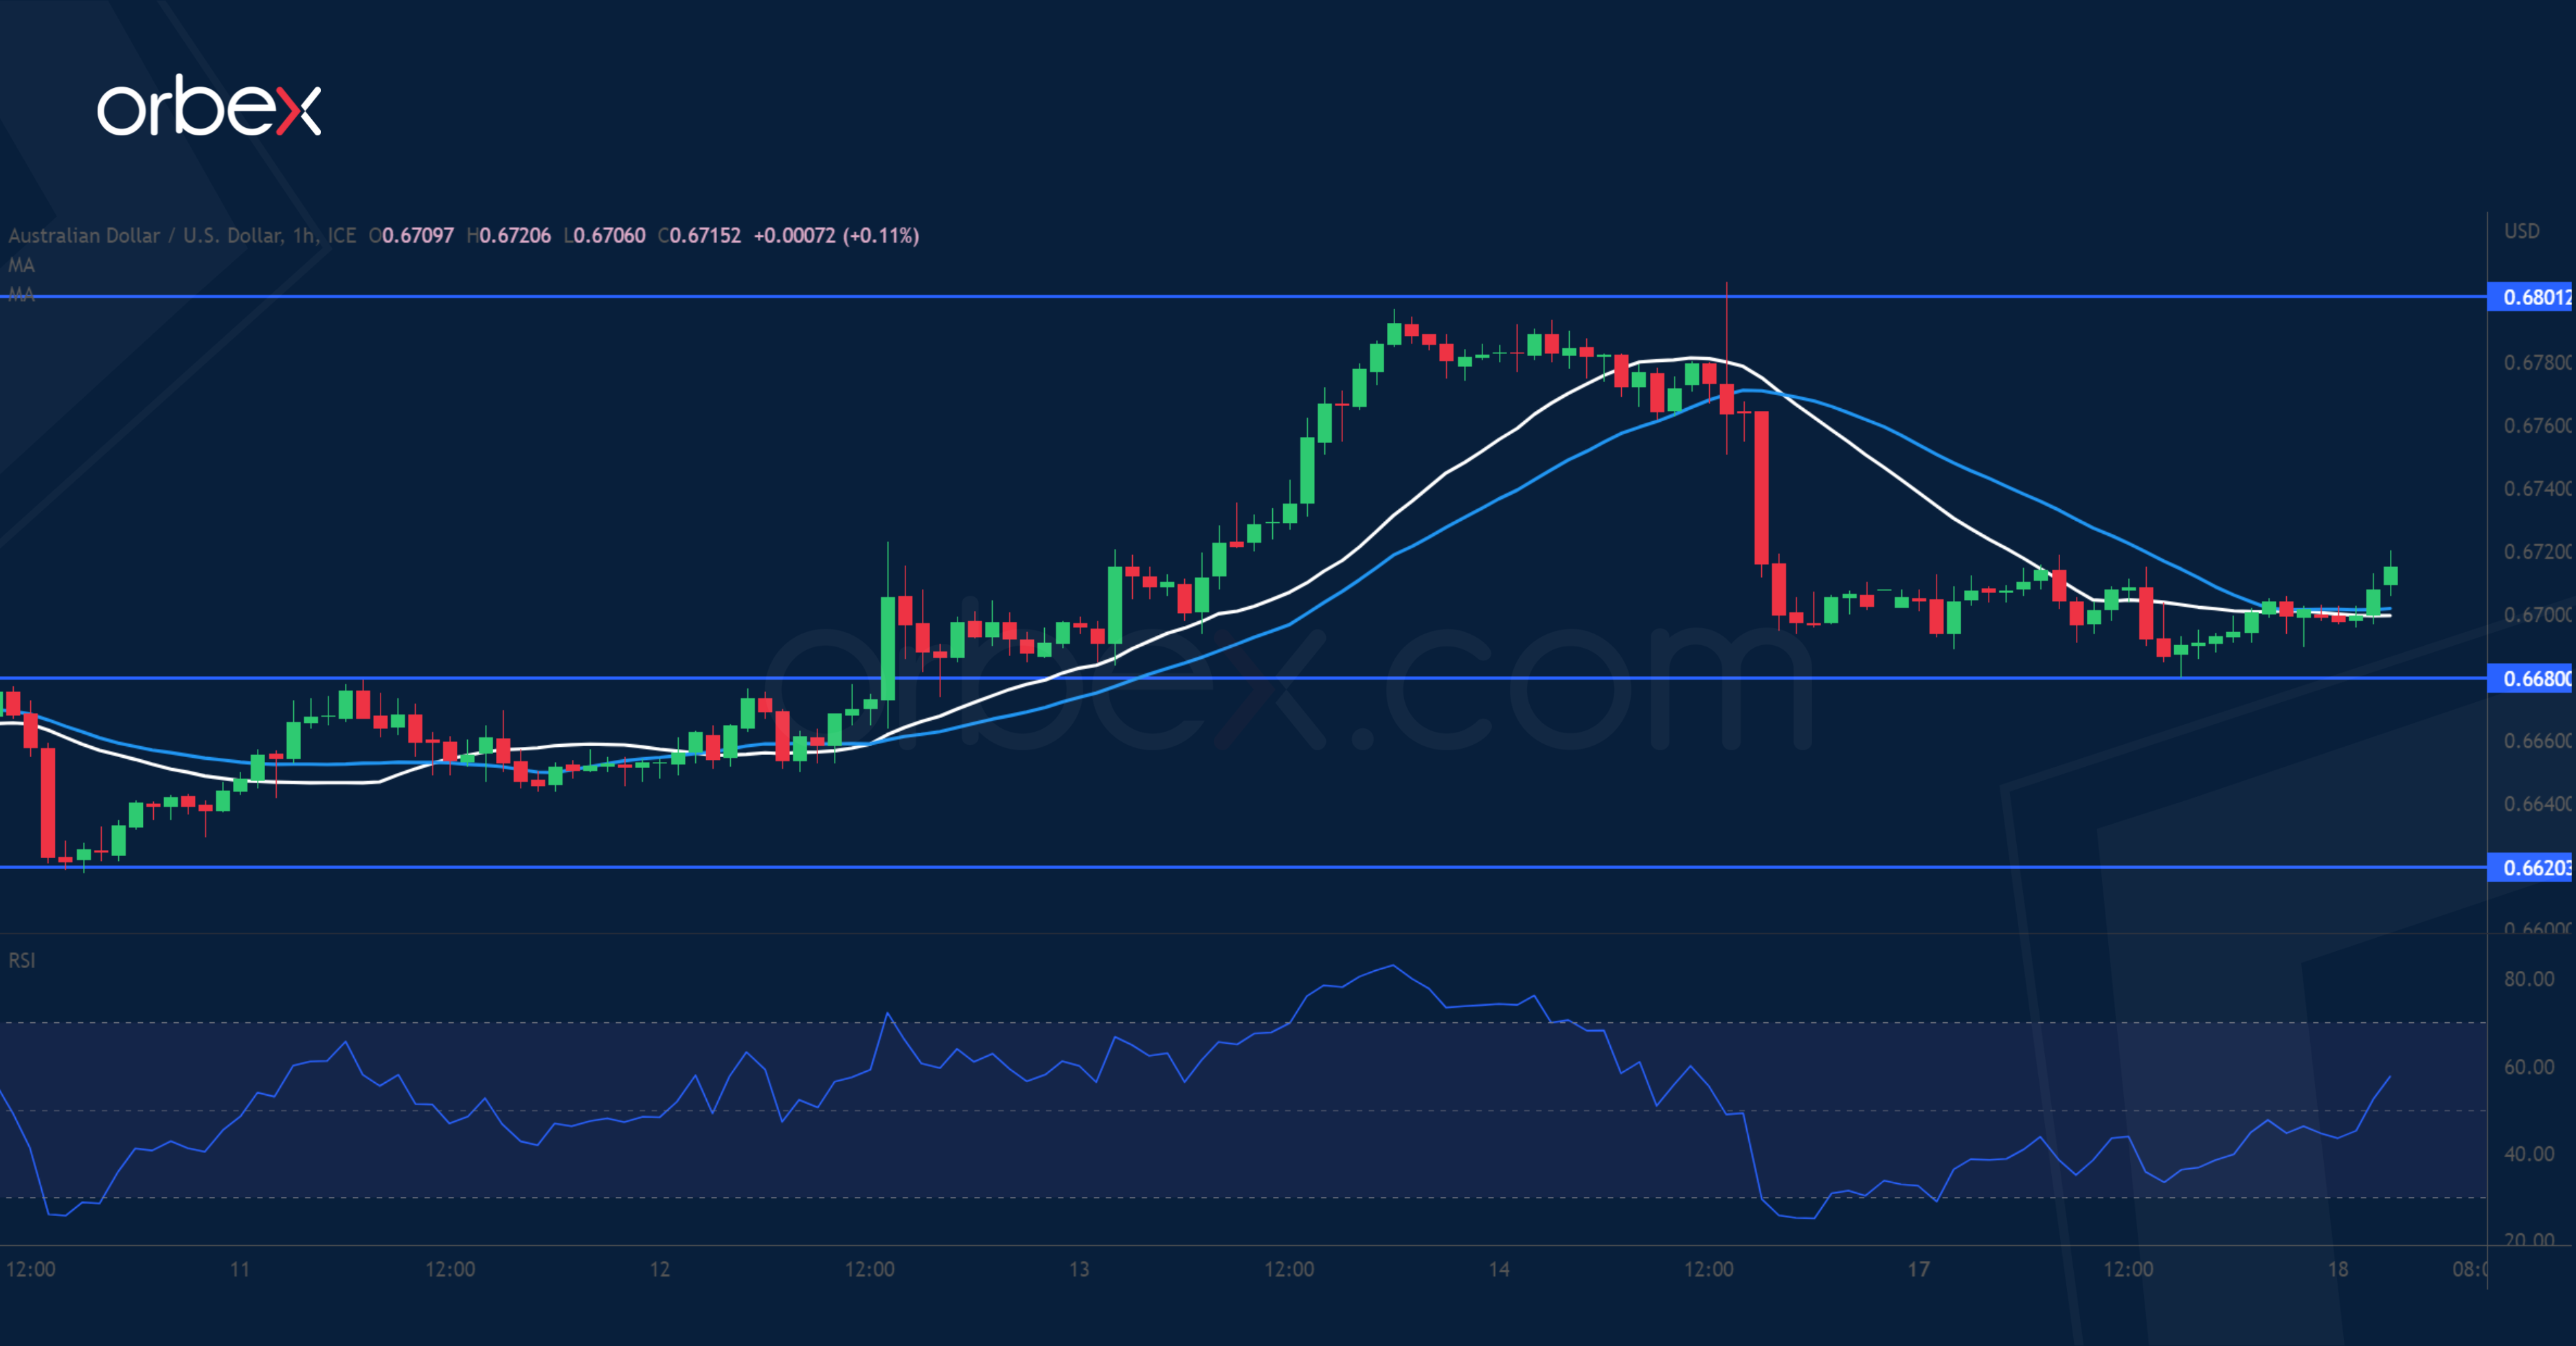
The Australian dollar bounced after the RBA minutes showed that another rate hike was considered. On the daily chart, the price is still in a flag-shaped consolidation following its break below this year’s low of 0.6700. This might temper any bullish velleity in the short-term as the bigger picture remains downbeat. 0.6800 has kept the aussie in check with a spike suggesting a rejection of the upside. 0.6680 is the level to see if the bulls are ready to step in and offer support. Otherwise, the swing low of 0.6620 is a critical floor.
USD/JPY bounces higher
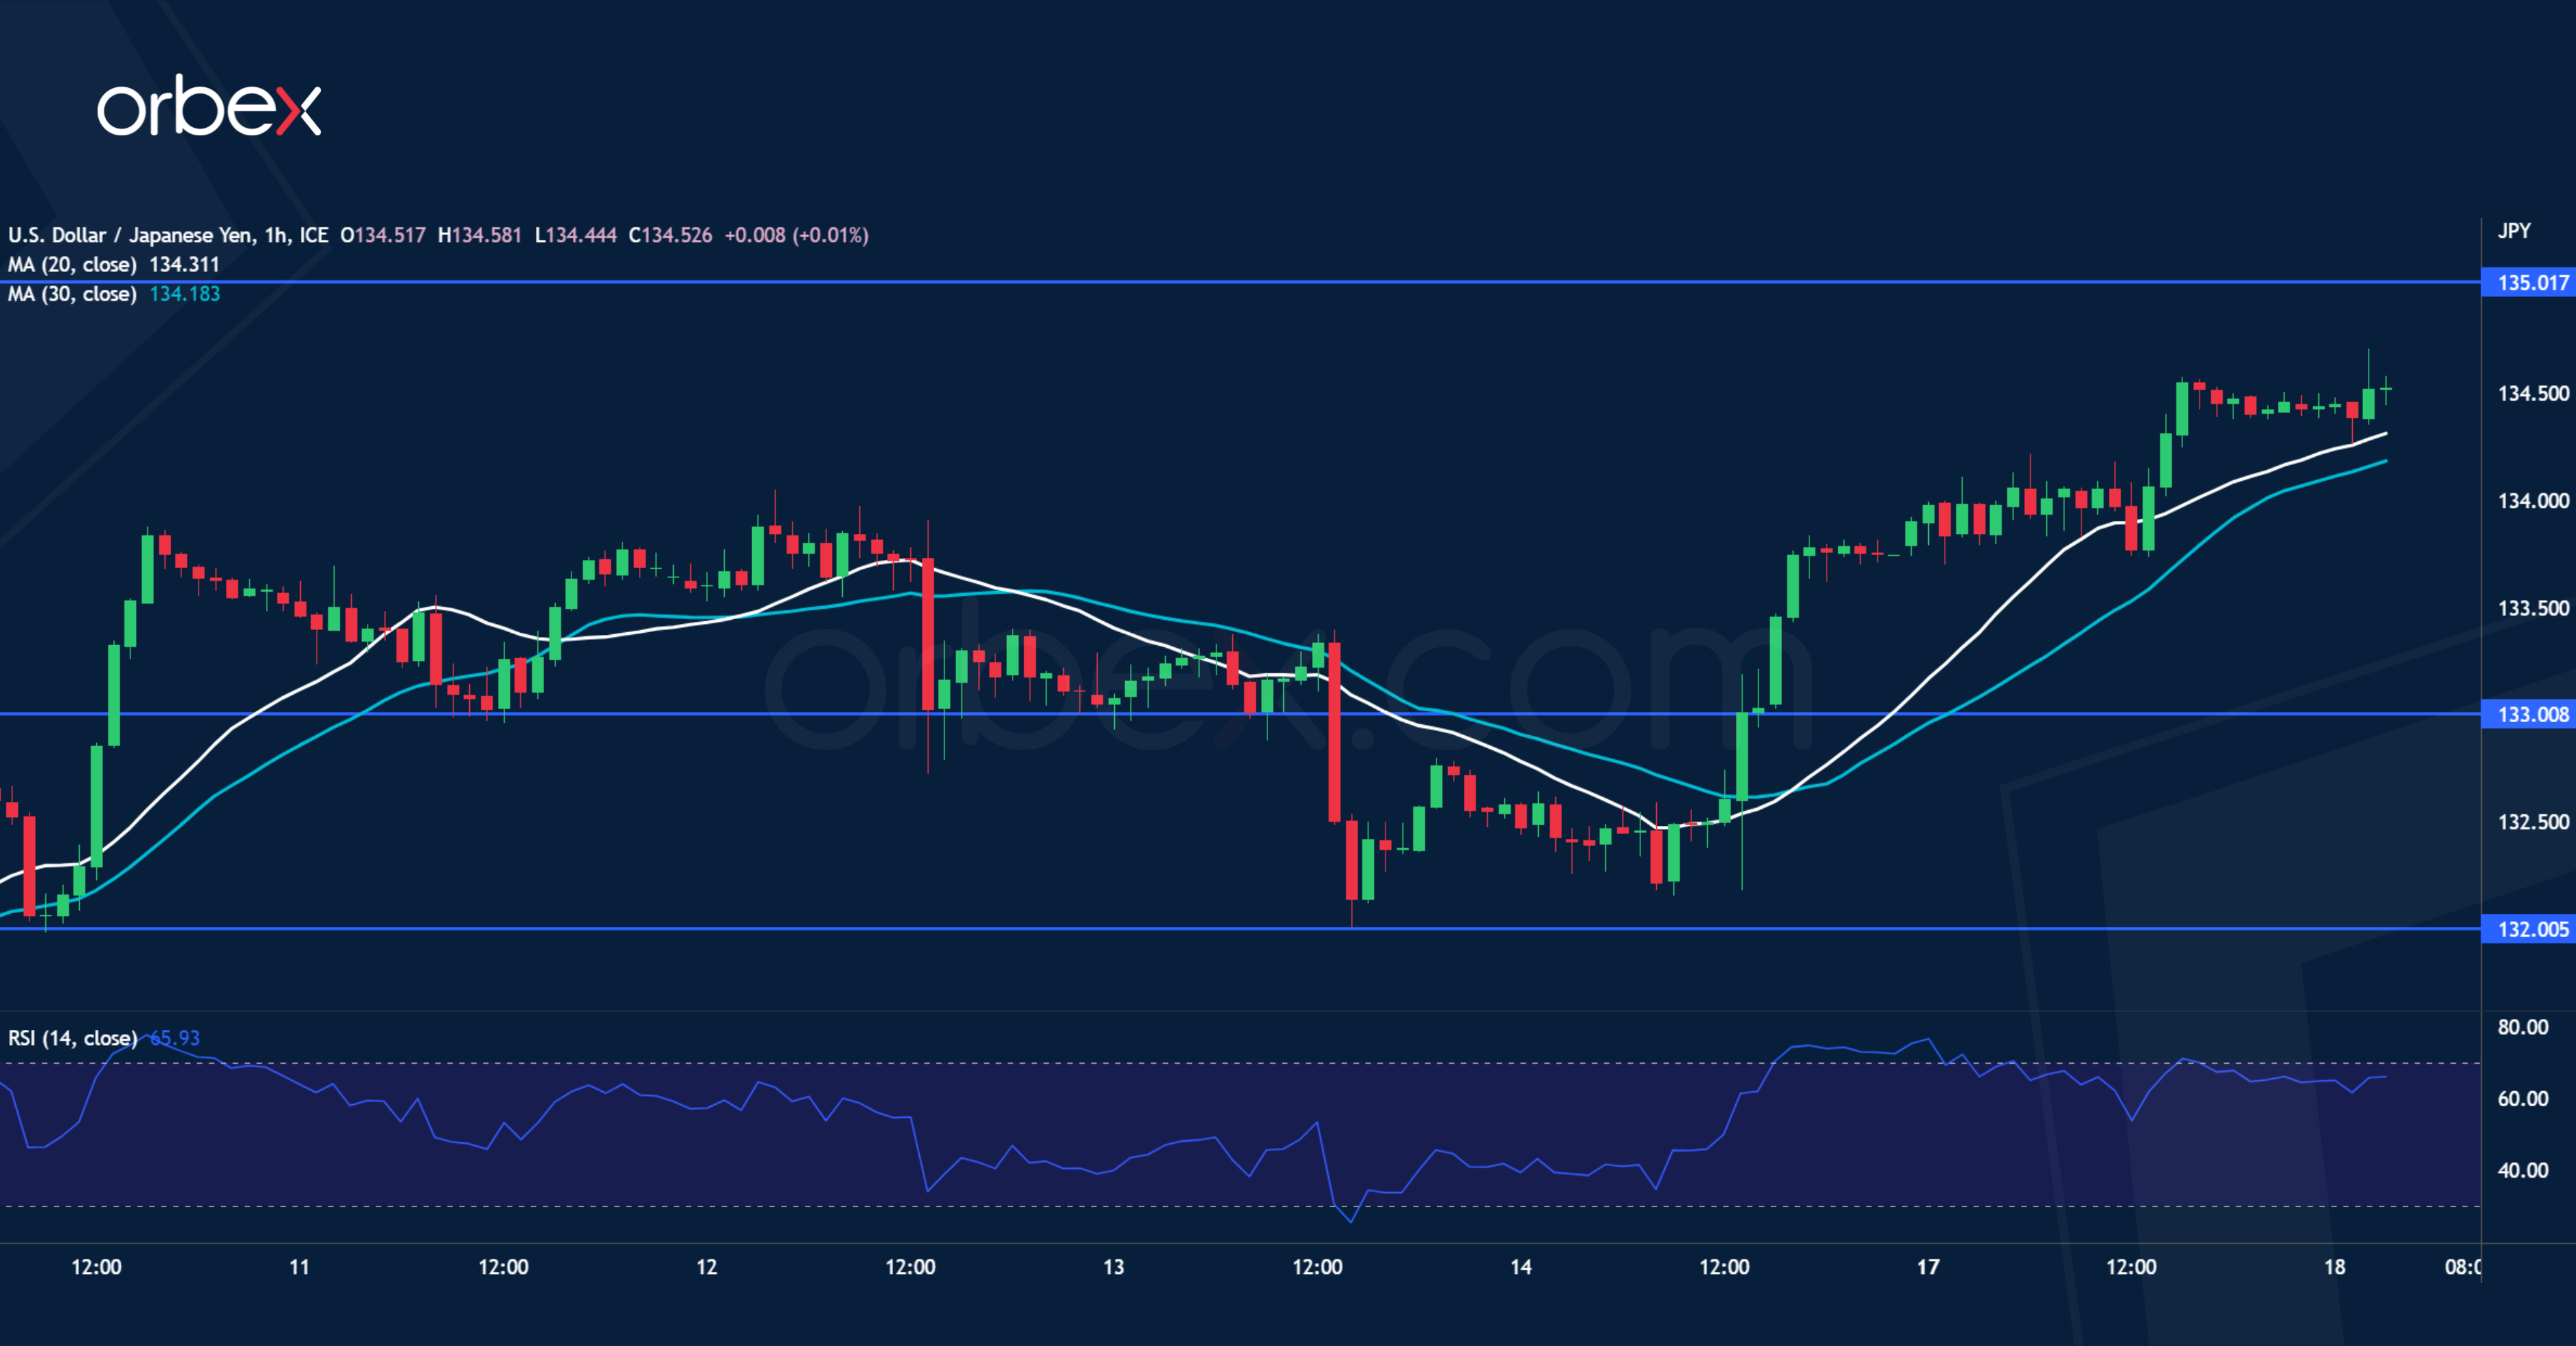
The US dollar climbs amid growing expectations of a 25 bp hike from the Fed in May. Sentiment has turned positive in the short-term with the pair achieving a series of higher highs despite choppiness. The greenback has secured a solid foundation above 131.00 then 132.00. A close above 134.00 may carry the price to the start of the March sell-off at 135.00 where stiff selling pressure could be expected. As the RSI drops back to the neutral area, 133.00 is the first level to see a follow-through. 132.00 is key in keeping the bounce intact.
GER 40 grinds higher
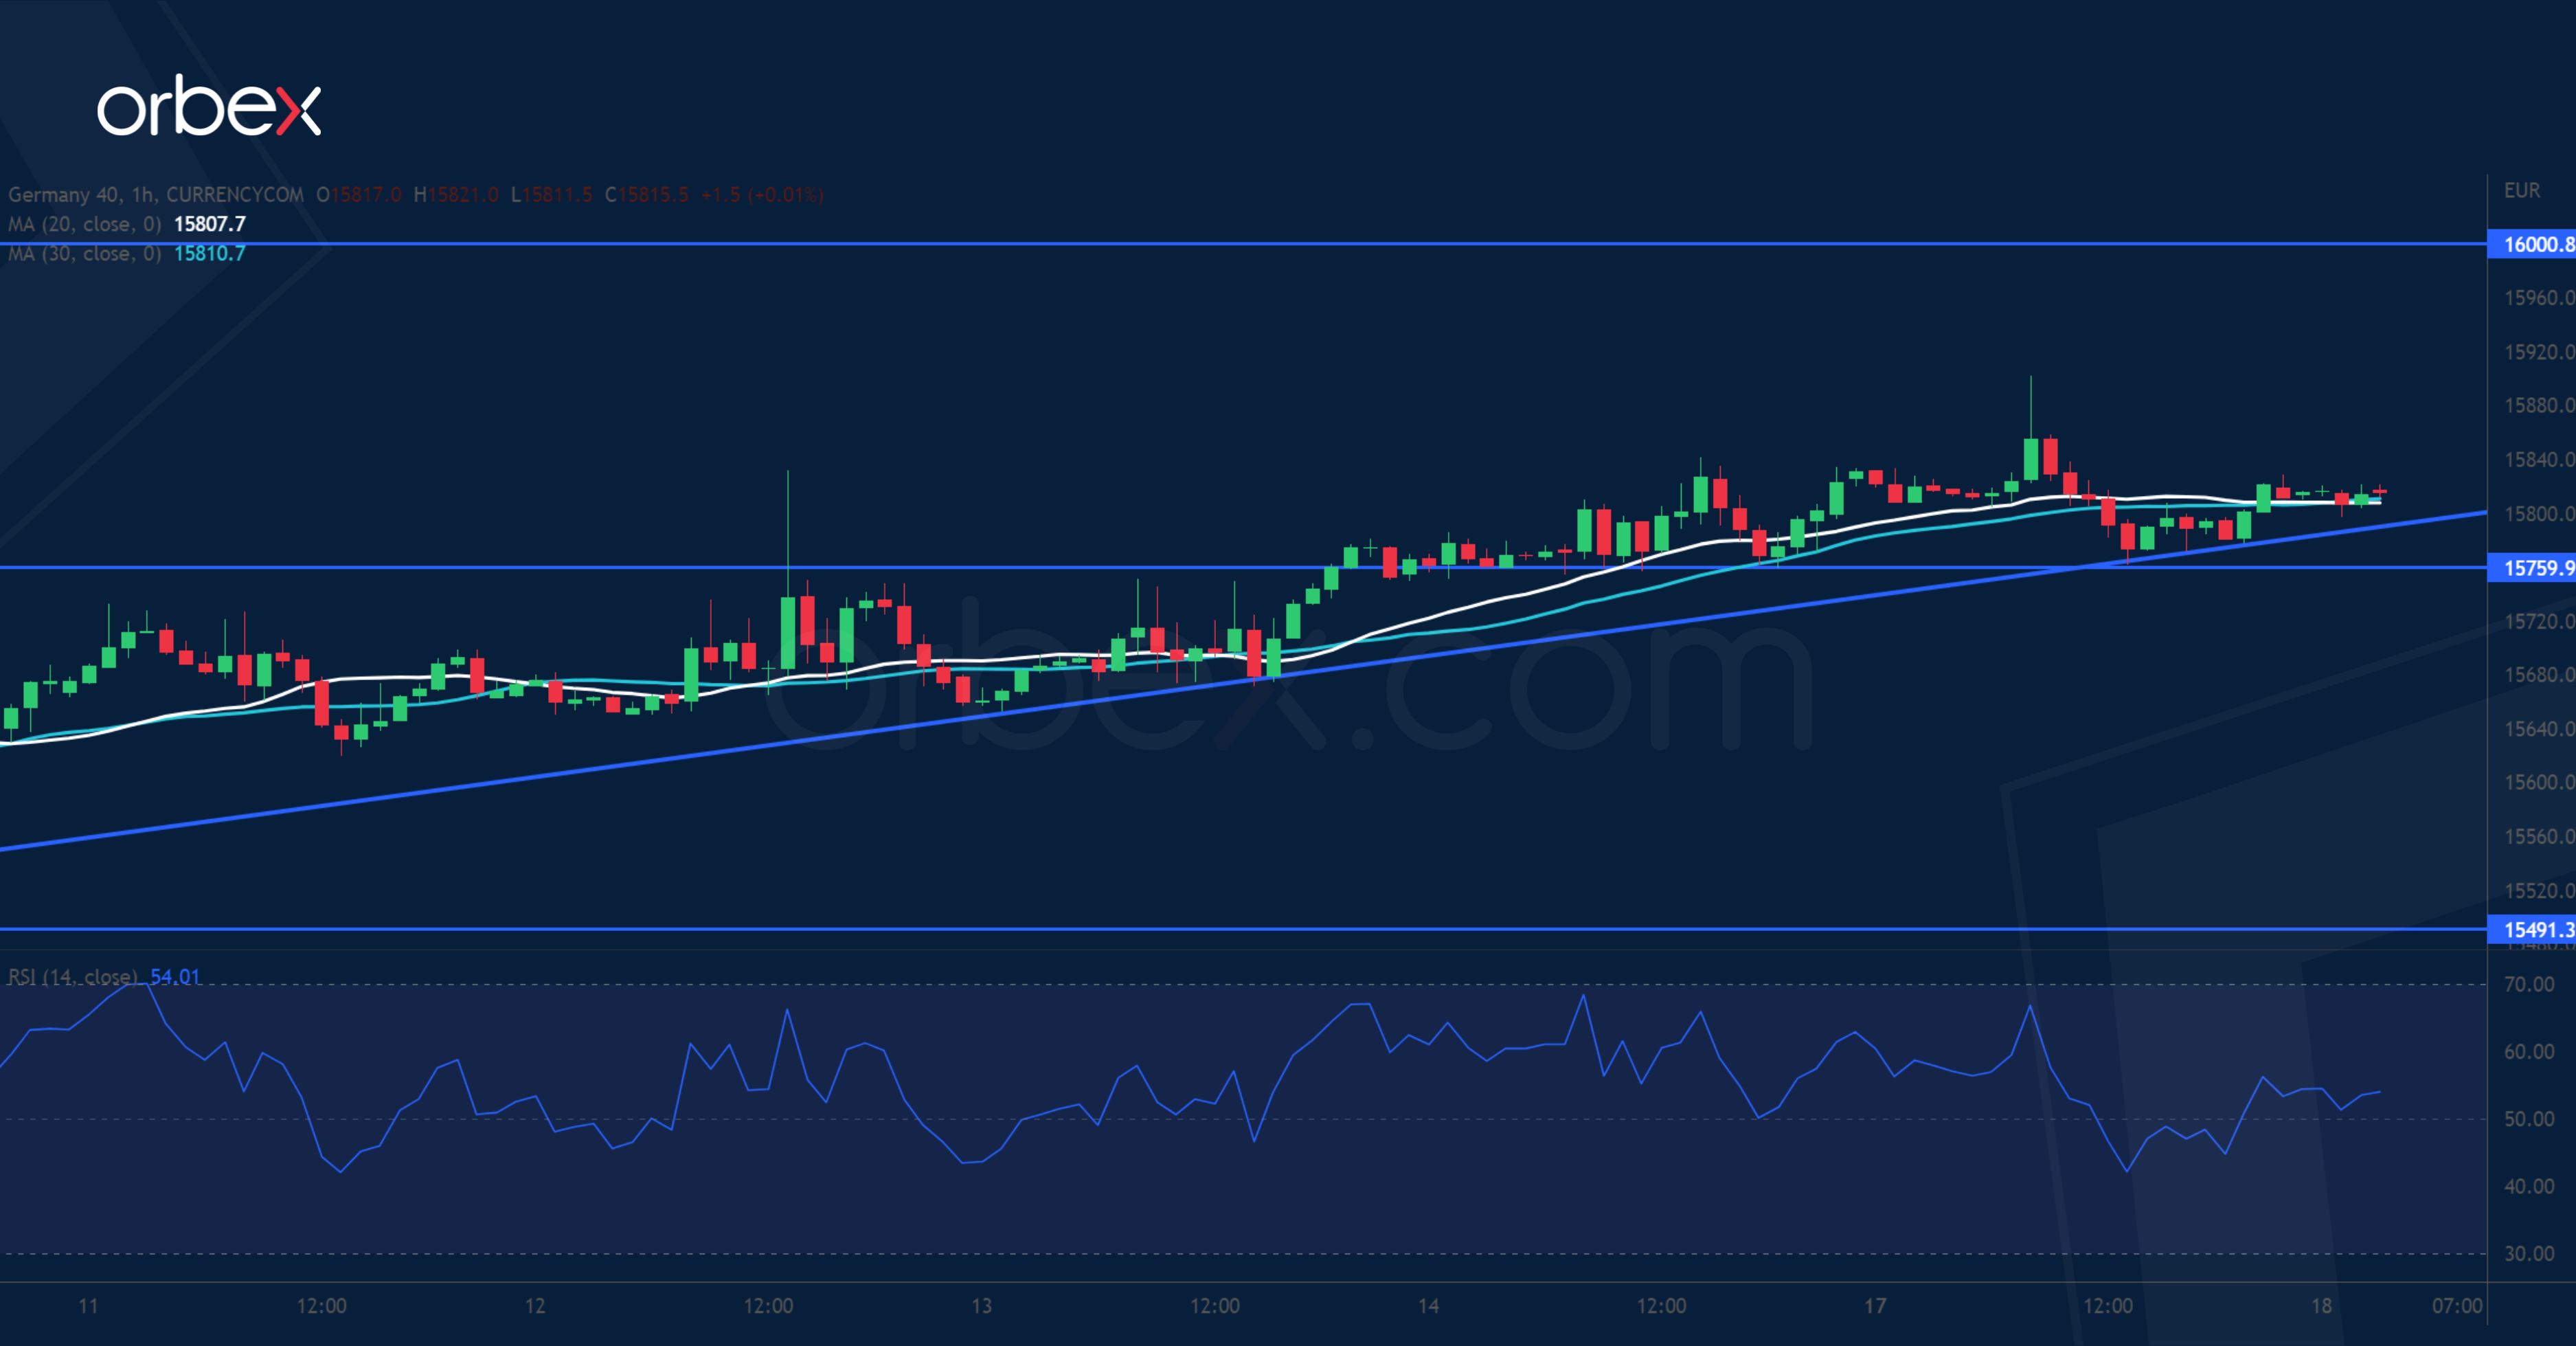
The Dax 40 steadies as investors remain optimistic ahead of earnings reports. A bullish MA cross on the daily chart indicates an acceleration to the upside after a break above this year’s peak of 15700. Following a brief consolidation, the bulls are now pushing towards the all-time high of 16300 from January 2022 with the psychological level of 16000 as the first hurdle ahead. The rising trend line from this month’s bounce off 15500 offers dynamic support to the index with 15760 as the closest level to monitor.
AUD/USD Short-term Uptrend Intact Supported by China’s Growth Spurt
- China’s Q1 GDP growth, retail sales, and industrial production continue to expand.
- Less aggressive monetary policy easing is needed from China’s central bank PBoC.
- AUD/USD short-term uptrend remains intact above 0.6645 key support.
The growth spurt from China reopening from its abandonment of stringent COVID-zero policy and implementation of stimulative policies late last year have continued to bear fruition. Today’s release of key China data indicates a robust internal economic environment coupled with its strong export growth for March that surged to an eight-month high of US$ 315.60 billion.
China’s key economic data continue to shine
China’s Q1 GDP growth grew at an annualized rate of 4.5%, accelerating from a 2.9% year-on-year growth recorded in Q4 22, above consensus estimates of 4%, its strongest pace of expansion since Q1 2022. Consumer spending continued to surge in March where growth in retail sales expanded to 10.6% year-on-year from 3.5% printed in February, beating estimates of 7.4%, its fastest growth rate since June 2021.
Industrial output continued to expand in March which recorded a higher growth of 3.9% year-on-year from a 2.4% rise recorded in the January to February combined period, the fastest expansion since October 2022 and almost on par with estimates of 4%. Meanwhile, the job market for China’s youth has remained lackluster, the youth urban jobless rate surged to 19.6% in March to hit a near-record high compared to the overall urban unemployed rate falling to 5.3% in March from 5.6% in February.
China’s central bank, PBoC is not in a panic mode to increase monetary policy easing
Given this latest set of robust economic data coupled with a rebound in new home prices in March that recorded its fastest pace of recovery in 21 months on a month-on-month basis; a 0.5% increase in March from a 0.3% rise in February, China central bank, PBoC is likely in no hurry mode to further loosen its liquidity taps to drive and stimulate economic growth at this juncture.
The latest monetary policy action of PBoC has shown evidence of such a “controlled accommodating” stance where it has left the key one-year medium-term lending facility interest rate (MLF) that is PBoC’s lending rate to big commercial banks unchanged yesterday at 2.75% for the fifth consecutive month. In addition, it injected the lease amount of medium-term cash into the banking system; a 20-billion-yuan net injection via the MLF facility in April, the smallest amount since November 2022.
Therefore, it is not surprising to see China-related benchmarks and stock indices underperform their regional peers today as profit-taking activities took shape on prior session gains as such solid economic data has been priced and the lack of monetary policy easing aggressiveness from PBoC. At this time of writing, the Hang Seng Index and Hang Seng China Enterprise Index declined by around 0.70%.
In the foreign exchange space, the Aussie dollar tends to have a positive correlation with China’s growth given its close international trade linkage. Let’s look at the AUD/USD from a technical analysis perspective.
AUD/USD Technical Analysis – short-term uptrend intact within the “Expanding Wedge”
Source: TradingView as of 18 Apr 2023
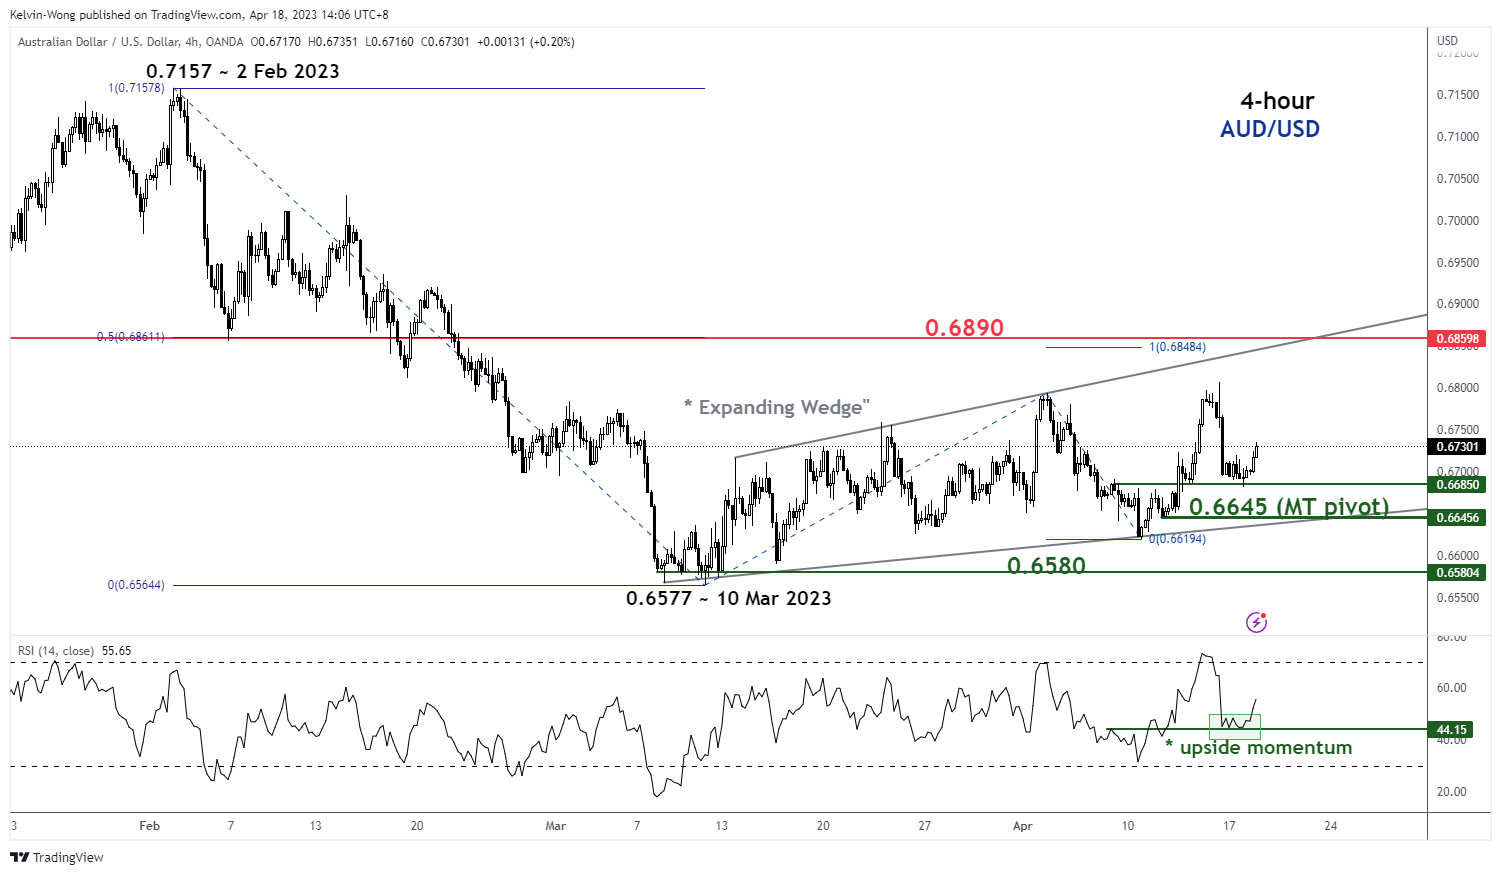
Since its 10 March 2023 low of 0.6577, the movement of AUD/USD has evolved into a short-term “Expanding Wedge” corrective rebound configuration as it sought to play out the retracement of its prior short-term downtrend of 592 pips from the 2 February high to 10 March 2023 low.
The short-term uptrend within the “Expanding Wedge” remains intact supported by a revival of short-term upside momentum as depicted on the 4-hour RSI oscillator as it staged a rebound from its corresponding support at the 44% level and has yet to reach its overbought level of more than 70%.
If the 0.6645 key medium-term pivotal support holds (also the lower boundary of the “Expanding Wedge”, the AUD/USD may see a push-up toward the next intermediate resistance at 0.6890 that confluences with the upper boundary of the “Expanding Wedge” and a Fibonacci extension/retracement cluster.
On the other hand, a break with a 4-hour close below 0.6645 invalidates the bullish tone for a continuation of the downtrend movement to retest the 10 March 2023 swing low area of 0.6580 in the first step.
UK Labour Data Published This Morning Printed Strong
Markets
After a slow start in Europe, core yields gradually resumed last week’s bottoming/rebounding pattern. One swallow doesn’t make a summer, but a big beat in the Empire Manufacturing survey (10.8 from -24.6 vs -18 expected with strong details) suggested that recent weakness in the production sector might be abating and rubberstamped the intraday rise in yields. The NAHB housing index also continued a cautious bottoming process (albeit at a low level, 45 from 44). In the end US yields gained between 9.5 bps (2-y) and 6.6 bps (10-y). The rise was almost solely due to a higher real yield. From a technical point of view, both the US 2-y and 10-y yield broke above the top of a (tentative) ST downtrend, improving the technical picture. However, next key resistance is looming respectively at 4.25% for the 2-y (currently 4.19%) and 3.65% for the 10-y yield (currently 3.59%). A further rise in US yields will mainly have to come from a further pricing out of Fed rate cuts. This might be a tough and slow process. A 25 bps rate hike for May or June is fully discounted. German yields lagged the US move, changing from -0.2 bps (2-y) to + 4.4 bps (30-y). US equities opened in red, but gradually found their composure (S&P +0.33%). Some first results from smaller US banks for now didn’t bring any really discomforting news. The (real) interest rate advantage facilitated the USD comeback. DXY extended its rebound off the 100.80 support area (touched on Friday) to close at 102.1. Still, the downtrend since early March isn’t broken yet. EUR/USD also corrected further south to close at 1.0926. Also in this cross rate the technical picture hasn’t change in a profound way.
This morning, the focus is on (better than expected) China Q1 GDP data (cfr. Infra). However, it doesn’t help a clear directional market reaction in Asian trading. Asian equities mostly trade with modest losses, Japan being the exception to the rule (yen softness). The dollar struggles to extend its rebound (DXY 102.02, EUR/USD 1.0935). US yields are easing marginally. The eco calendar today only contains ‘second tier’ data (ZEW survey, US housing starts and permits). This suggests more order driven trading and probably makes its difficult to break key technical levels on the interest rate markets (cfr. supra) or in the dollar. We stay cautious on a sustained USD comeback.
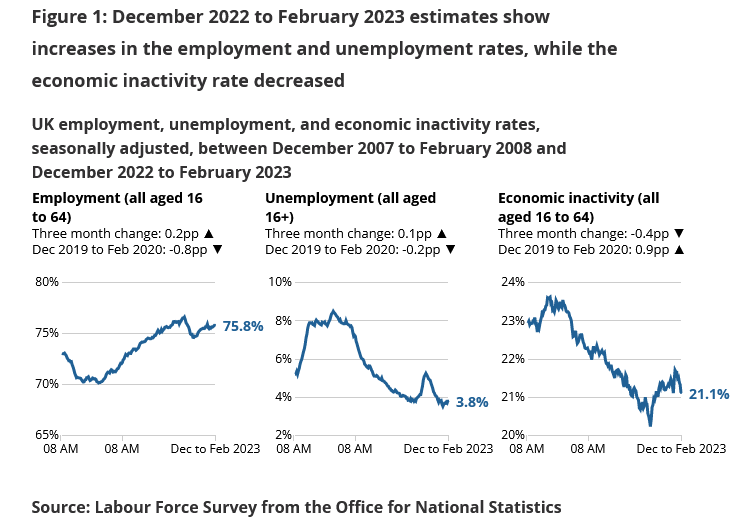
UK labour data published this morning printed strong. Employment in the 3 months to February was strong (3M/3M change 169k). Wage growth also surpassed the consensus (weekly earnings ex-bonus 6.6% vs 6.2% expected). At the same time, the unemployment rate ticked up from 3.7% to 3.8%. Sterling had a good intra-day run yesterday and tries to extend gains post data, with EUR/GBP currently trading near 0.8825. Tomorrow’s CPI will be key for markets to make up their mind on the BoE early May policy decision.
News and views
The Chinese economy grew by a more than expected 2.2% q/q in Q1 as it emerged from painful lockdowns. GDP is now 4.5% larger than in the same quarter last year. Growth is expected to accelerate in Q2 but to a large extent because of the low comparative base as China re-imposed a strict zero-Covid policy until end December. Details were mixed. Retail sales rebounded as pent-up demand was released, growing 5.8% in the first quarter with a 10.6% surge y/y in March alone. Exports also surged but could come under pressure amid weakening global demand. Industrial production rose 3% Y/Y in Q1, less than the 3.5% expected while investments (5.1% YtD Y/Y) also undershoot the 5.7% analyst consensus. The latter even came solely on the account of state-owned investments (10%). Private investments remained weak at 0.6%, highlighting company cautiousness. Property investment continued to decline. The Chinese yuan reacts stoic to the release, holding near USD/CNY 6.87. Chinese stocks lose some ground.
Turkey’s central bank (CBRT) last week asked local lenders to limit the amount of dollar purchases made in the interbank market, Bloomberg reported on Monday, citing people with knowledge of the matter. The CBRT assigned a daily cap on how much FX they should buy after meeting the needs created through exits from the KKM program – a government incentive to convert dollars to liras by compensating participants for swings in the exchange rate. The limit is yet another measure to prevent the lira from excessively weakening against the likes of the USD and euro with real (policy) rates in Turkey being extremely negative. The Turkish lira is setting record lows each day. USD/TRY is changing hands near 19.39. Volatility in the currency is searing as the May 14 presidential elections near.
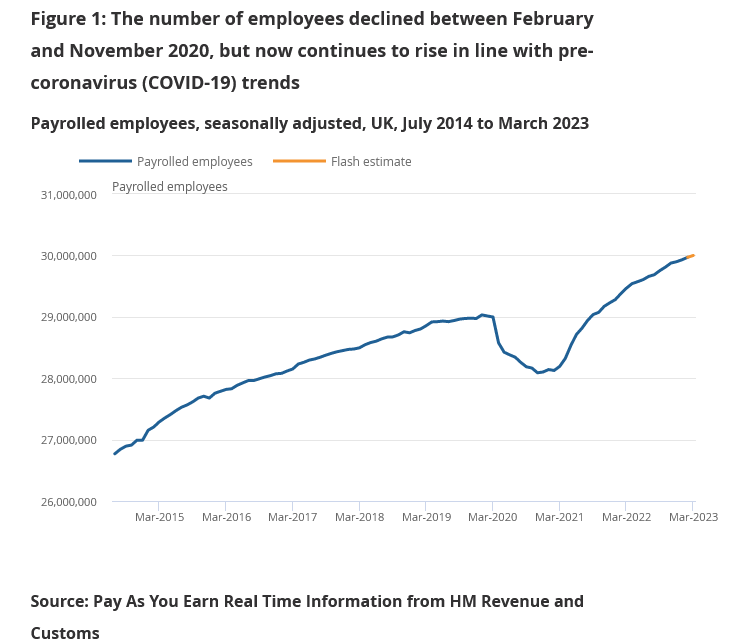
UK payrolled employment grew 31k in Mar, wage growth maintained in Feb
In March, UK payrolled employment grew 31k , or 0.1% mom. Compared with March 2022, payrolled employment rose 533k, or 1.8% yoy. Median monthly pay increased by 6.3% yoy, highest in finance and insurance sector with 10.1% yoy, and lowest in the education sector, with an increase of 3.6%. Claimant count rose 28.2k, above expectation of 10.2k.
In the three month to February, unemployment rate rose to 3.8%, above expectation of 3.7%, and 0.1% higher the previous three-month period. Employment rate was estimated at 75.8%, 0.2% higher than the previous three-month period. Average earnings excluding bonus rose 6.6% 3moy, unchanged from January's rate and above expectation of 6.2%. Average earnings including bonus was up 5.9% 3moy, unchanged from prior month's figure, beat expectation of 5.1%.
Is Faster Chinese Growth Good News?
Yesterday was driven by a broadly stronger US dollar, but also higher treasury yields and higher equity valuations as investor sentiment got a boost after a strongly positive surprise from the New York Empire State manufacturing index.
The US 2-year yield is now at around the 4.20%, the highest levels since the Silicon Valley Bank (SVB) collapsed, with potential of a further rise as the bank stress seems mostly abated by now.
Odds for Federal Reserve (Fed) rate cut toward the year-end fell to 25bp, from up to 100bp expected at some point at the high of the SVB crisis.
The US 10-year yield is now around 3.60%. An advance above this level has acted as a selling signal for equities in December and in February.
Time to sell?
The S&P 500 is approaching the highest levels reached in February, as the market focus is shifting back to economic and corporate data.
Stronger-than-expected earnings could give a hand to equity bulls… but US yields will likely readjust to the economic reality of the field: strong employment, resilient economic activity and still-high inflation – with a threat of U-turn in the recent improvement due to rising energy prices.
Is faster Chinese growth good news?
The Chinese GDP growth accelerated from below 3% to 4.5% in Q1, versus 4% penciled in by analysts, the industrial production rose 3%, retail sales by more than 10% - which we saw in LVMH and Hermes results as well last week. Both numbers were better-than-expected, and the unemployment rate fell more than expected, as well.
Strong China data helped stopping the US oil selloff into the $80pb level, but the US equity futures didn’t really cheer up the news.
A strong Chinese growth is excellent for French luxury brands – and also for many other companies across the world, but it also means a potential boost to energy and raw material prices, that would boost inflation, get the central bankers’ hands tighter and have a reduced positive impact for equities.
And if an equity selloff is on the horizon, the negative impact will likely be harder on rate-sensitive tech stocks, including chipmakers that had a great start to the year with the AI craze.
Yet, positive exposure to mining and energy stocks is certainly a good hedge against another round of energy and raw material-boosted inflation. In this sense, there is little doubt that the British FTSE index – which is packed with energy and mining stocks – could easily outperform in the environment of energy-boosted global inflation.
Chinese Economy Grows Again
Market movers today
We get ZEW expectations from Germany today. It will be interesting to see if we get a rebound after bank concerns put a dent in an otherwise positive trend this year.
In the US, March housing starts will shed further light on the shape of the housing market. Later we also have Fed's Bowman on the wires.
Today is the 'Tax Date' in the US, which marks the annual deadline for filing income taxes, and thus also the largest daily inflow of tax revenue during most years. The revenue will provide some clarity on how close the US government is to defaulting due to the debt ceiling. The Treasury General Account has already shrunk to the lowest level since late 2021, while US 5y CDS is trading at the highest level since 2012. Read more in our earlier note: Research US - We expect a debt ceiling resolution only by next summer, 23 February.
The 60 second overview
China: The Chinese economy expanded more than expected in Q1 growing 2.2% q/q vs 2.0% q/q consensus and up from 0.0% q/q in Q4. Consumer spending in particular looks strong. Retail sales rose 10.6% y/y in March. Data confirms that Chinese economy is up and running again after the long period of lockdowns that ended at the beginning of the year, while still growing slower than it did before the crisis.
G7: G7 affirmed its commitment to supporting Ukraine for as long as it takes to help the country defend itself against Russia. It also recognised the need to work together with China on common interest and called for a peaceful resolution to Taiwan-related issues.
US: NY Fed's Empire Manufacturing index ticked sharply higher to 10.8 (from -24.6) driven in particular by stronger new orders. Notably, prices paid index dropped further, and hovers just above the pre-covid average. Employment index ticked modestly higher, yet remains at weak levels. Manufacturing is not the most important inflation driver right now, but generally some positive signs ahead of the flash PMIs due on Friday.
Equities: Global equities rose yesterday as stocks in US rallied the last couple of hours and went from negative to positive levels. Yet again, it was the group of cyclicals together with value leading the increases. However, it was not due to earnings reports like on Friday, instead higher yields and goldilocks set of macro data drove the rotations yesterday. In US, Dow +0.3%, S&P 500 +0.3%, Nasdaq +0.3% and Russell 2000 +1.2%. Equity markets are a bit mixed in Asia this morning. The sum of release of Chinese macro data this morning is positive in our opinion but not enough to lift Chinese equities. Japanese markets are on the flipside higher and should be so in aftermath of the macro and financial market moves yesterday. Futures in Europe are marginally higher this morning while US futures are showing small declines.
FI: Rates rose from the long end through most of yesterday's trading session, with 10y German Bunds ending just shy of 2.5%. The rates up move yesterday was supported by the US empire manufacturing that came in stronger than anticipated, but also the significant long-end supply expected to come to the market today.
FX: The broad USD comeback on the back of rising US yields continued yesterday, with EUR/USD now firmly below 1.10 once more. The NOK had a poor afternoon whereas the SEK showed some resilience, thus bringing NOK/SEK below 0.99. The CEE currencies continued their recent run, with HUF and PLN as the top performers over the past 5 trading sessions.
Credit: Credit spreads sold off slightly yesterday with iTraxx Xover and Main closing 4bp and 0.3bp wider, respectively. Primary market activity was subdued with only a couple of issuers bringing new deals to the market.