Sample Category Title
Bitcoin breaks out surpassing 30k, NASDAQ to follow?
Bitcoin has finally broken through its recent range to the upside, surpassing 30k level for the first time since June 2022. While some observers may attribute the rally since mid-March to safe-haven flows amid banking turmoil, it seems more likely that Bitcoin is moving in tandem with tech stocks, in anticipation of Fed nearing a pause in tightening.
With 100% projection of 15452 to 25242 from 19552 at 29342 now surpassed, the next target is 161.8% projection at 35392. Even if a retreat occurs, outlook will remain bullish as long as 27,808 support holds.
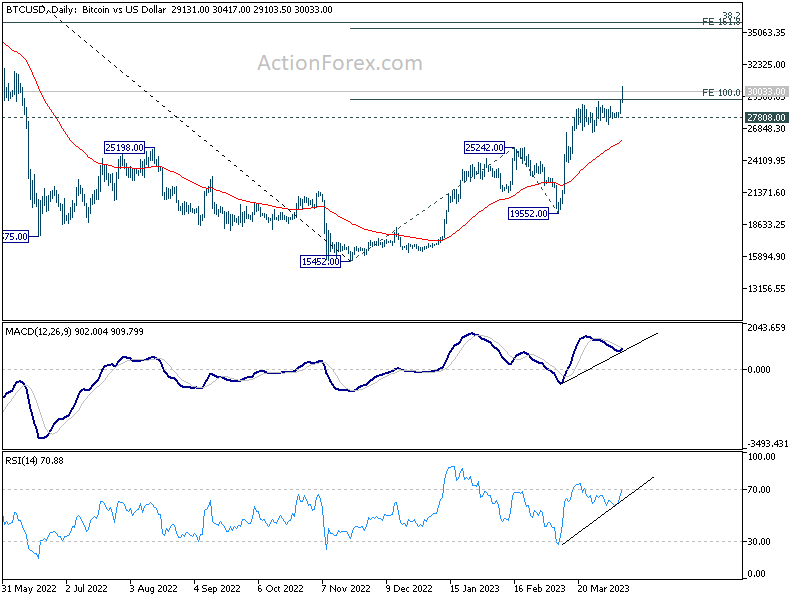
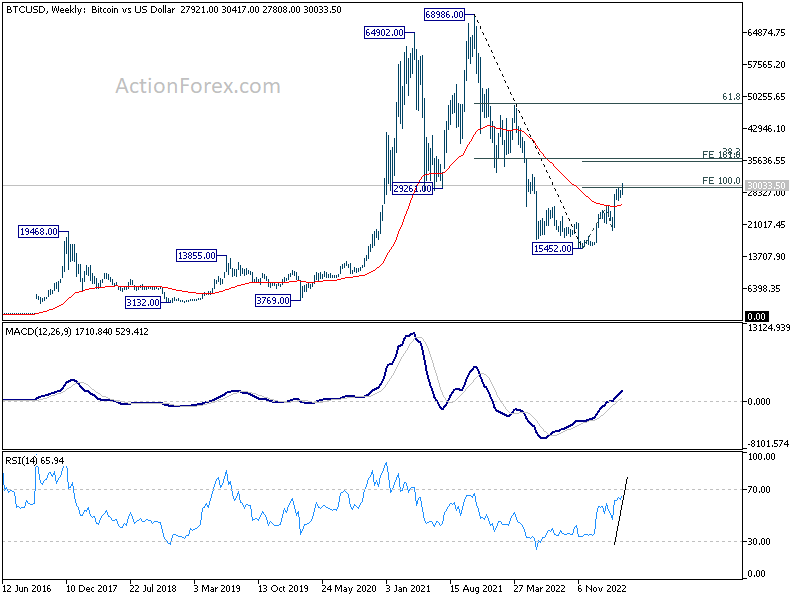
Focus now shifts to the upside momentum of the current move and the reaction to the 35392 projection target. This level is close to the 38.2% projection of 68986 to 15452 at 35901.
Strong upside momentum and a decisive break of the 35k/36k zone would suggest that the rise from 15452 is a of a medium-term impulsive up trend, potentially leading to further gains. Conversely, weak momentum and rejection by the 35k/36k zone would indicate that rebound from 15452 remains just a corrective move.
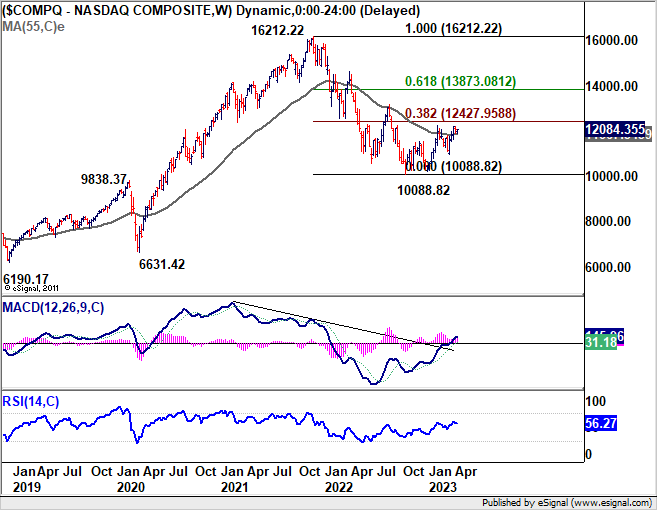
Another question arising is whether NASDAQ can follow suit and decisively break through 38.2% retracement of 16,212.22 to 10,088.82 at 12,427.95, confirming the underlying bullish momentum in tech-related sectors.
Eurozone Sentix Investor Confidence rose to -8.7, negative momentum weakening
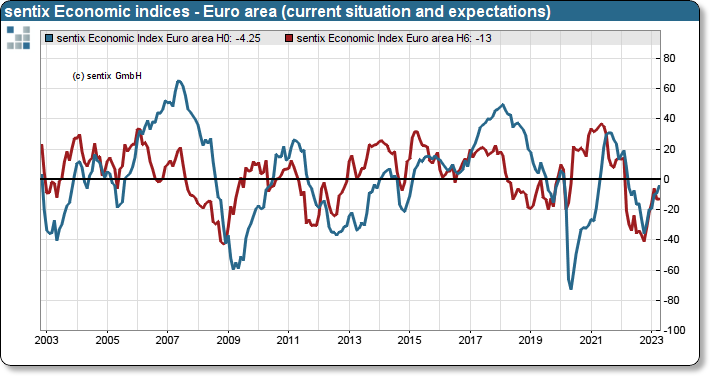
Eurozone Sentix Investor Confidence increased from -11.1 to -8.7 in April, surpassing the expected -14.0. The Current Situation index experienced its sixth consecutive rise, moving from -9.3 to -4.3, reaching its highest level since March 2022. The Expectations index, however, remained unchanged at -13.0.
Sentix commented on the data, stating, "There is no doubt that the Eurozone economy has come through the winter months better than many feared in the autumn." However, when considering the future, investors are less optimistic, citing "still considerable uncertainty about the further course of the Ukraine war, concerns about a lasting burden on the energy-intensive industrial sector, and - new - question marks about the state of the US economy."
Despite these concerns, the Sentix Theme Barometer indicates that negative expectations regarding inflation and central bank policy have noticeably decreased. While not an all-clear signal, the negative momentum seems to be weakening.
Eurozone retail sales down -0.8% mom in Feb, EU down -0.9% mom
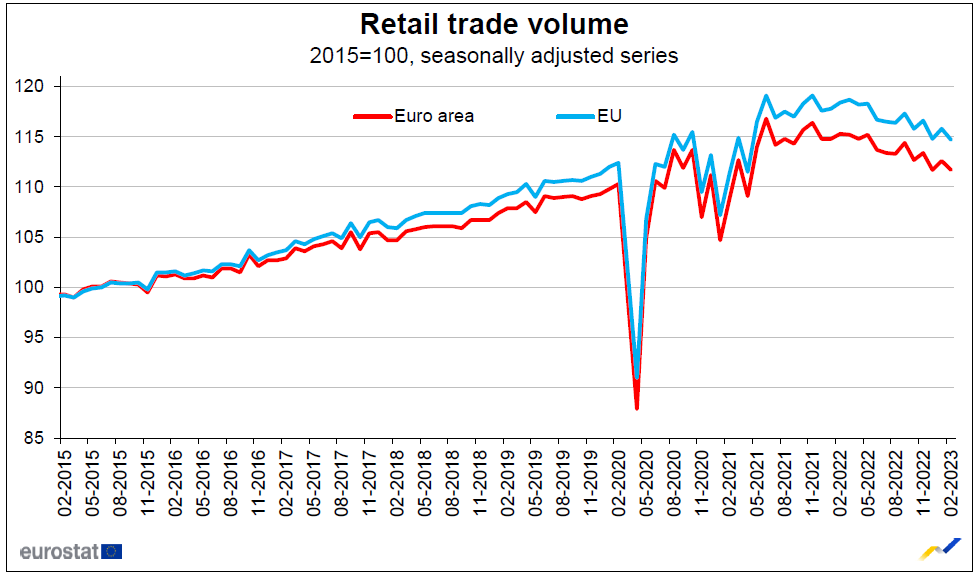
Eurozone retail sales volume dropped -0.8% mom in February, matched expectations. Volume of retail trade decreased by -1.8% for automotive fuels, by -0.7% for non-food products and by -0.6% for food, drinks and tobacco.
EU retail sales declined -0.9% mom. Among Member States for which data are available, the largest monthly decreases in the total retail trade volume were registered in Slovenia (-10.5%), Hungary and Poland (both -2.0%) and Sweden (-1.6%). The highest increases were observed in Cyprus (+1.6%), Luxembourg (+0.8%) and Belgium (+0.7%).
EUR/USD Daily Outlook
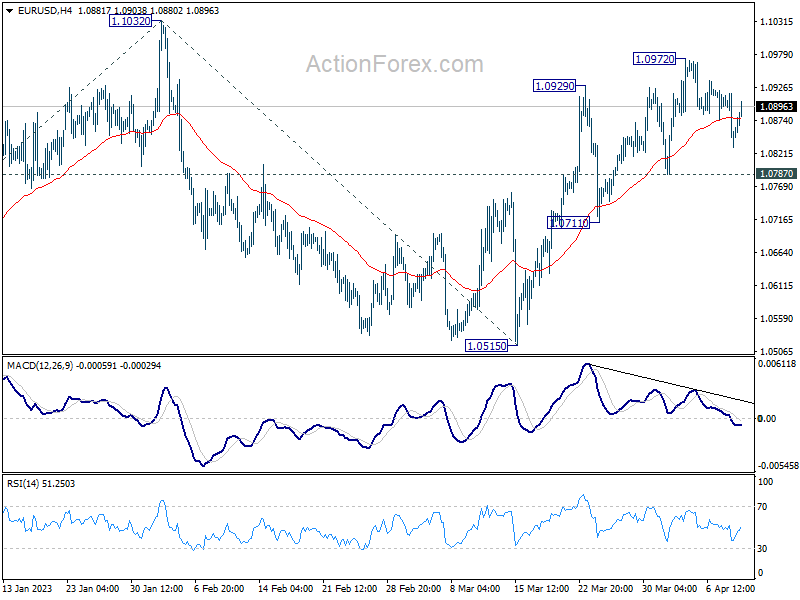
Daily Pivots: (S1) 1.0823; (P) 1.0870; (R1) 1.0908; More...
EUR/USD is staying in consolidation below 1.0972 and intraday bias stays neutral. With 1.0787 support intact, further rally is expected. On the upside, above 1.0972 will resume the rally from 1.0515 to retest 01.1032 high. Firm break there will resume larger up trend from 0.9534. However, break of 1.0787 will turn bias back to the downside for 1.0711 support instead.
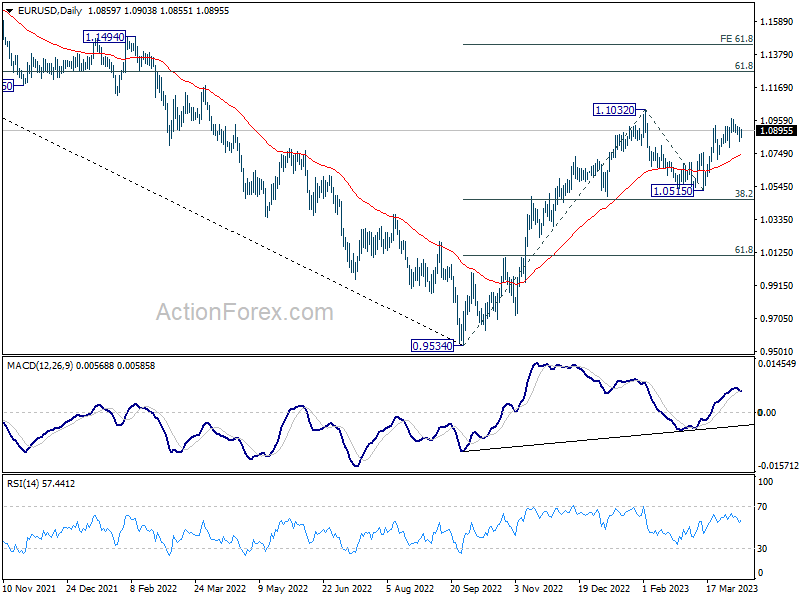
In the bigger picture, rise from 0.9534 (2022 low) is in progress with 38.2% retracement of 0.9534 to 1.1032 at 1.0460 intact. The strong support from 55 week EMA (now at 1.0625) was also a medium term bullish sign. Next target is 61.8% retracement of 1.2348 (2021 high) to 0.9534 at 1.1273. Sustained break there will solidify the case of bullish trend reversal and target 1.2348 resistance next (2021 high).
USD/JPY Daily Outlook
Daily Pivots: (S1) 132.33; (P) 133.10; (R1) 134.37; More...
Focus stays on 133.74 resistance in USD/JPY. Firm break there will resume the rebound form 129.62 and target 137.90 resistance again. However, on the downside, below 130.62 will resume the fall from 137.90 through 129.62 to retest 127.20 low.
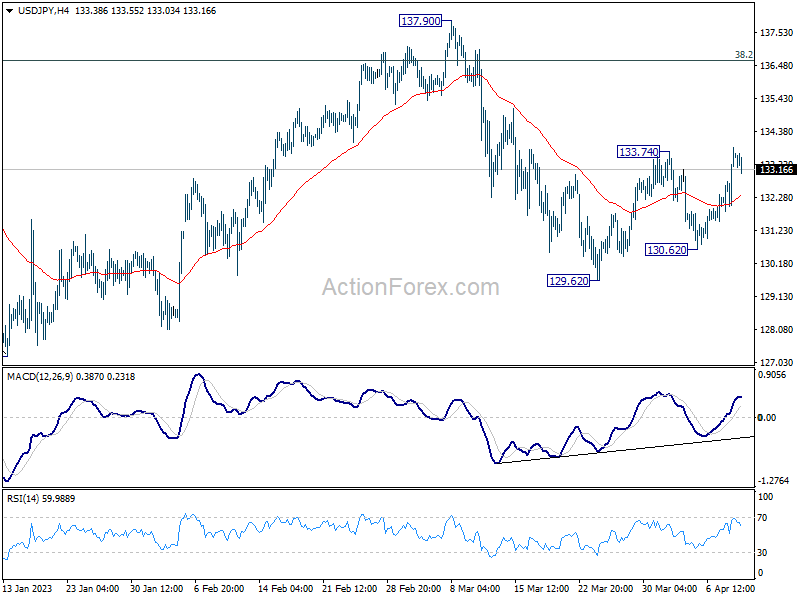
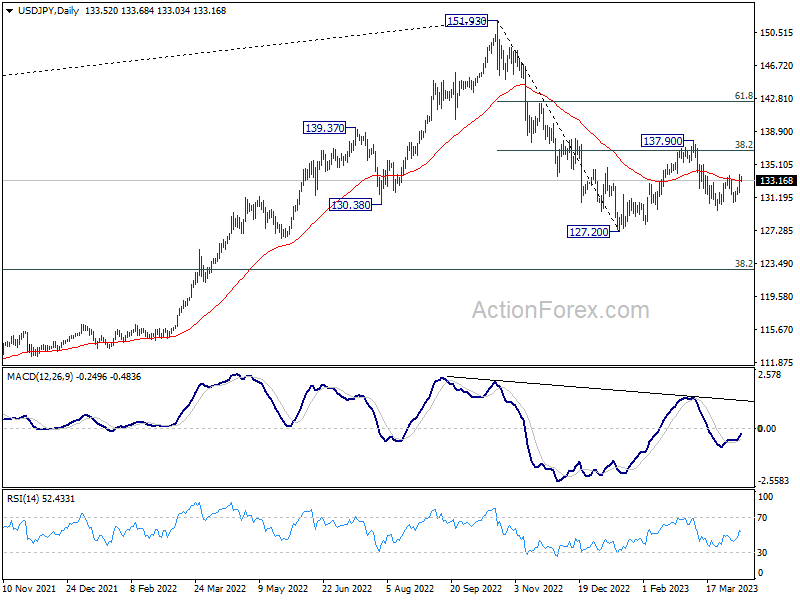
In the bigger picture, corrective pattern from 127.20 might be extending. But after all, down trend from 151.93 is expected to resume at a later stage. Break of 127.20 will resume this down trend and target 61.8% projection of 151.93 to 127.20 from 137.90 at 122.61. This will now be the favored case as long as 137.90 resistance holds.
GBP/USD Daily Outlook
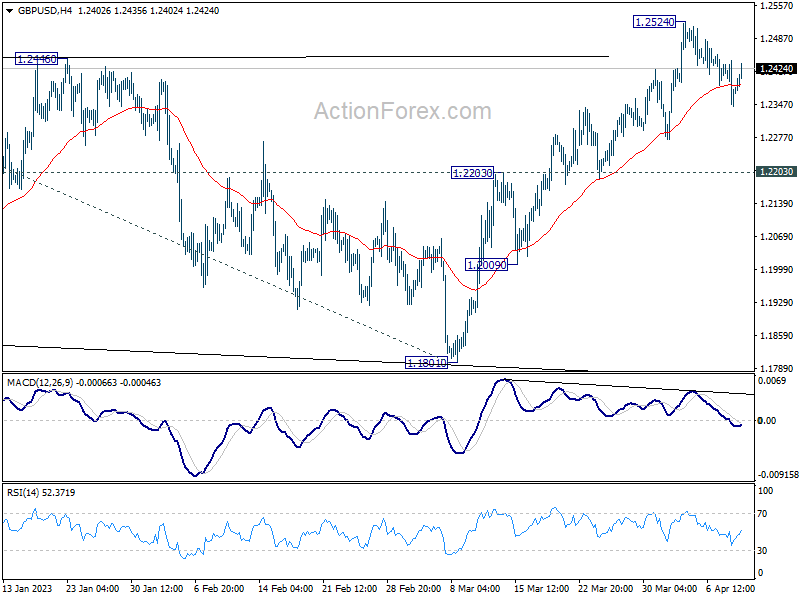
Daily Pivots: (S1) 1.2338; (P) 1.2390; (R1) 1.2436; More...
GBP/USD is staying in consolidation from 1.2524 and intraday bias remains neutral at this point. Further rally is expected with 1.2203 resistance turned support intact. On the upside, break of 1.2524 will target 1.2759 fibonacci level first. Firm break there will target 61.8% projection of 1.0351 to 1.2445 from 1.1801 at 1.3095.
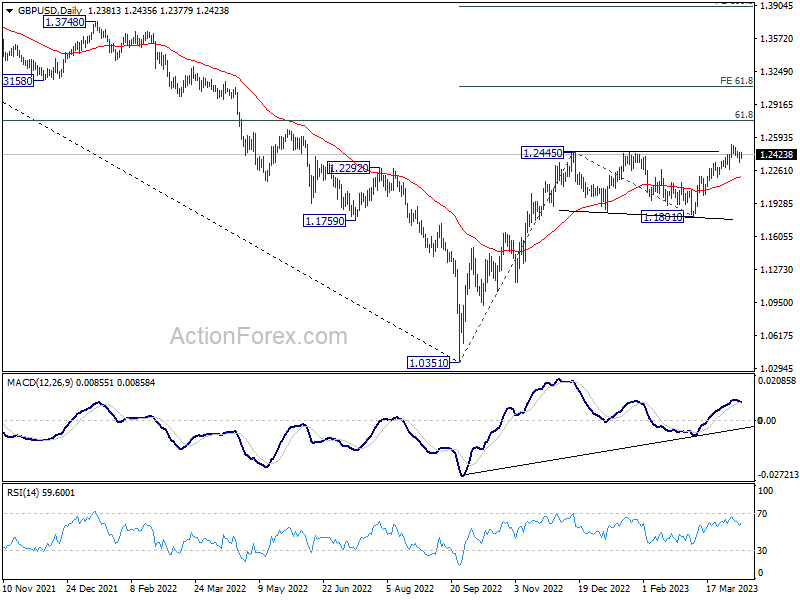
In the bigger picture, the rise from 1.0351 medium term term bottom (2022 low) is in progress for 61.8% retracement of 1.4248 (2021 high) to 1.0351 at 1.2759. Sustained break there will add to the case of long term bullish trend reversal. Further break of 61.8% projection of 1.0351 to 1.2445 from 1.1801 at 1.3095 could prompt upside acceleration to 100% projection at 1.3895. For now, this will remain the favored case as long as 1.1801 support holds, even in case of deep pull back.
USD/CHF Daily Outlook
Daily Pivots: (S1) 0.9048; (P) 0.9084; (R1) 0.9131; More...
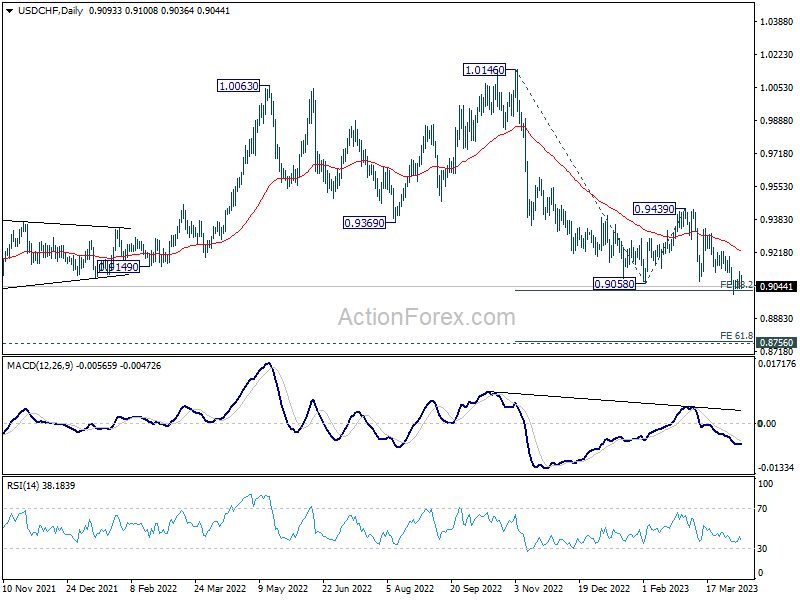
Intraday bias in USD/CHF stays neutral for the moment, and further decline is expected with 0.9118 minor resistance intact. On the downside, break of 0.9005 and sustained trading below 38.2% projection of 1.0146 to 0.9058 from 0.9439 at 0.9023 will extend the down trend from 1.0146 to 61.8% projection at 0.8767. However, firm break of 0.9118 will indicate short term bottoming, and turn bias to the upside for stronger rebound.
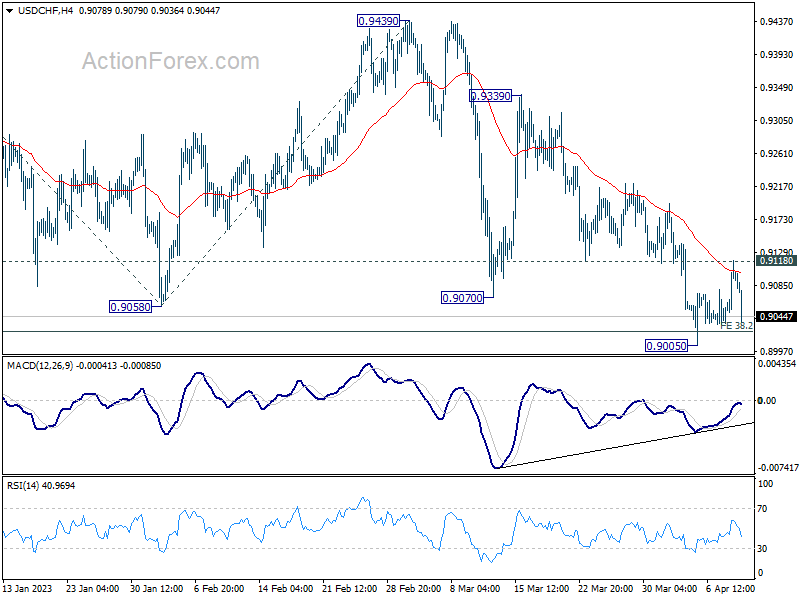
In the bigger picture, outlook will stay bearish as long as 0.9439 resistance holds, and fall from 1.1046 (2022 high) is still in progress. Prior rejection by 55 week EMA was a medium term bearish sign. Sustained of 0.9058 will resume such decline towards 0.8756 support (2021 low). But overall, this fall is still as a leg in the long term range pattern from 1.0342 (2016 high). So, downside should be contained by 0.8756 to bring reversal.
US 100 Cash Index in Delicate Balance after Higher High
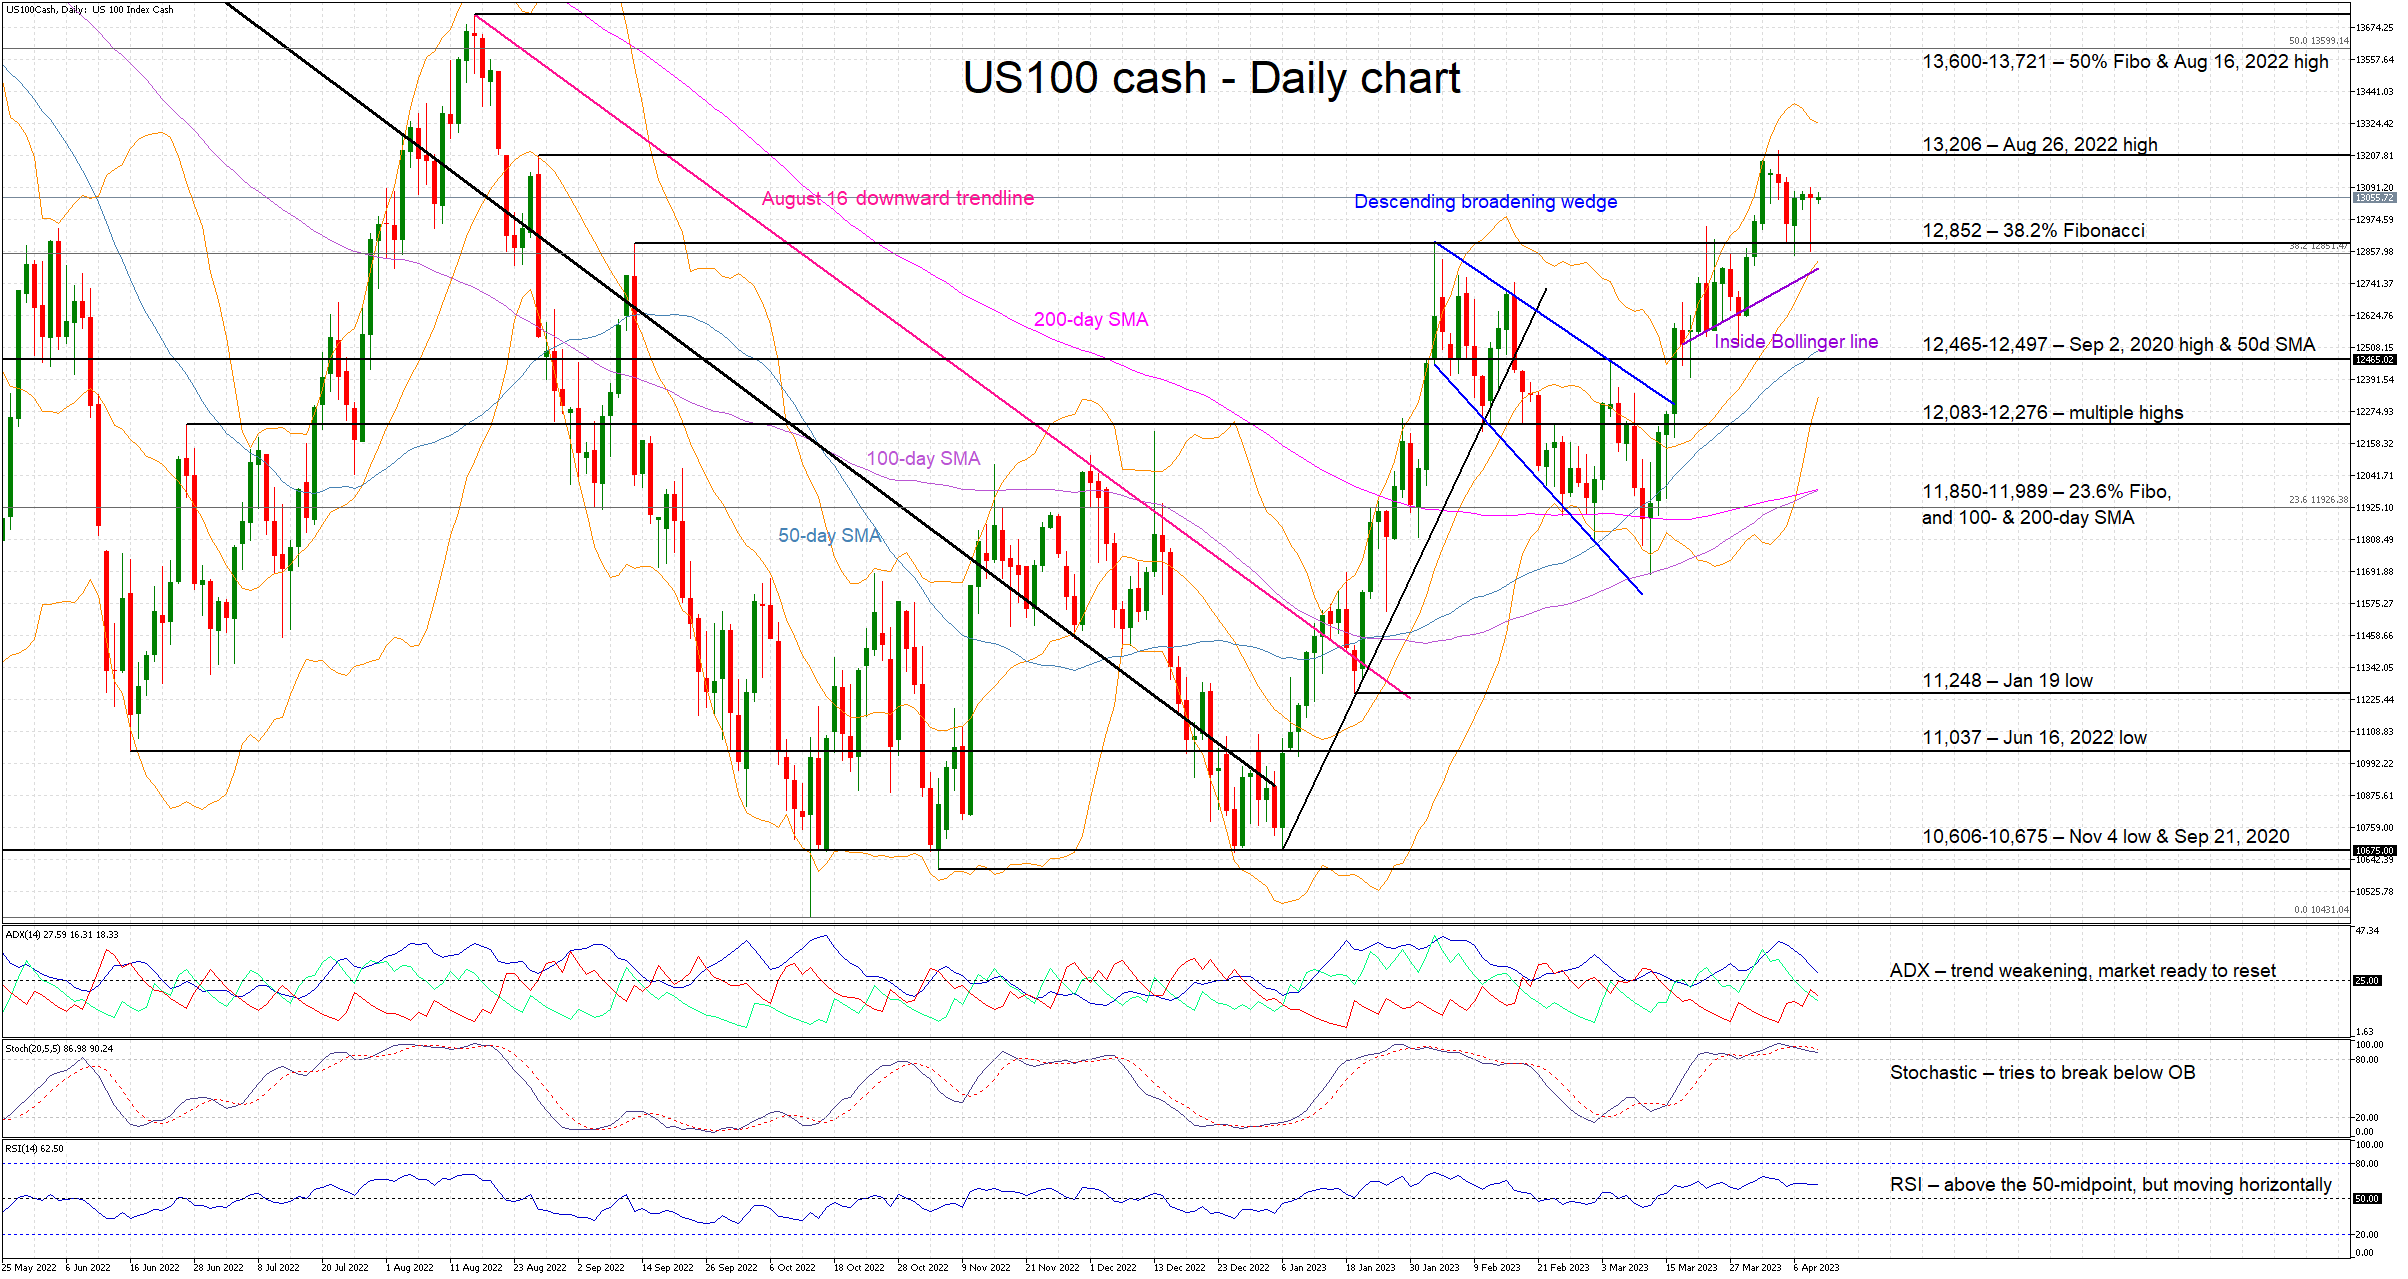
The US 100 cash index is consolidating after reaching 13,225, the highest level since August 19, 2022, fully recovering from the mid-March banking sector woes. The bulls might not be so upset about the current price action as they may accept that a small correction could set the stage for a new high afterwards, provided that the next low recorded is above the 11,850 area.
There are some key support levels on the way down starting with the 38.2% Fibonacci retracement level of the November 22, 2021 – October 13, 2022 downtrend at 12,852, and the 12,465-12,497 range set by the September 2, 2020 high and the 50-day simple moving average (SMA). Even lower, the 12,083-12,276 area appears to be a good area for the bulls to set up their defence.
The stochastic oscillator seems ready to signal a downwards move as it is currently hovering in the overbought territory, battling with its moving average. A potentially aggressive move lower by this indicator would infuse confidence in the bears to stage a proper correction. But they have to ignore the RSI trading above its 50-threshold and the Average Directional Movement Index (ADX) remaining on the sidelines at the moment.
Should the bulls manage to remain in control of the market, their first aim would be to retest the August 26, 2022 high at 13,206. Upon successfully clearing this level, the path is clear until the 13,600-13,721 range defined by the 50% Fibonacci retracement and August 16, 2022 high.
To sum up, the bulls managed to push the index higher amidst a difficult period. The current consolidation could work in their favour provided this delicate balance does not translate into a stronger downward move.
US CPI to Influence Fed Hike Bets
Markets are set to use the incoming US inflation print to predict the likelihood of a Fed rate hike in May, which investors are betting will likely be the last in this cycle.
At the time of writing, Fed funds futures point to a 71% chance of another 25-basis point rate hike at next month’s FOMC meeting, reverting to expectations held prior to the recent banking turmoil and SVB’s collapse.
A headline CPI print that’s higher than the forecast 5.1% year-on-year figure should shore up support for the US dollar in the lead up to next May’s rate decision. Fresh evidence of stubbornly high US core inflation may also keep gold prices subdued in sub-$2k territory while limiting the upside for US equities.
However, if US disinflation is shown to be gathering pace as price pressures fall more sharply than expected, that may offer further upside impetus for the precious metal and risk assets, while undermining the dollar’s rebound from the past week.
Ultimately, the CPI print will be used to validate the recent rhetoric by Fed officials who are still focused on restoring price stability, even as such attempts have been made more complicated by a still-tight labour market as well as the unexpected OPEC+ crude oil supply cuts.
EURJPY Ascends Steeply Towards 2023 Highs
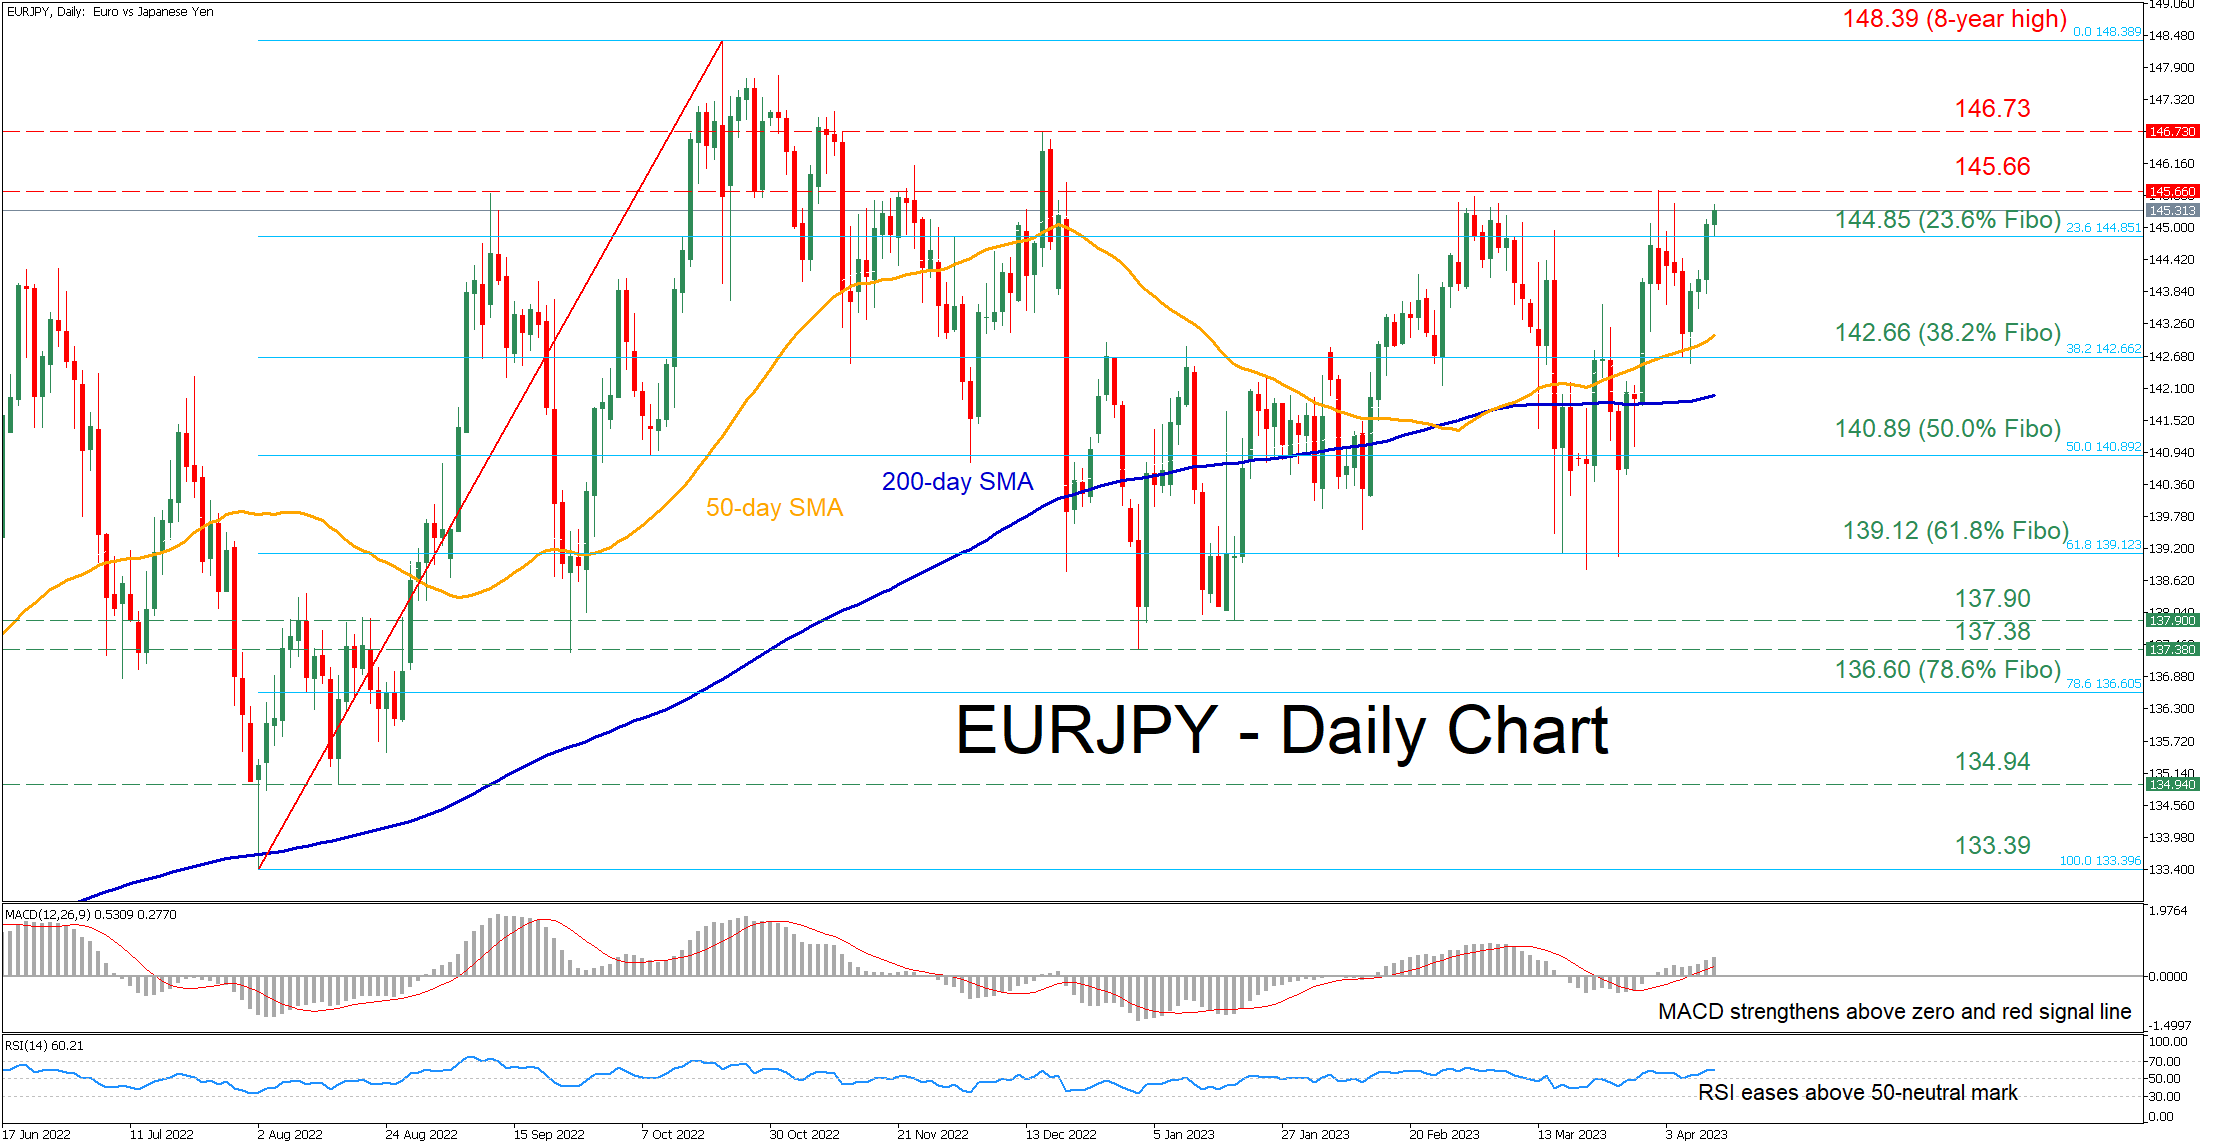
EURJPY has been moving without a clear direction since mid-March albeit with very high volatility. In the past few daily sessions, the pair has rebounded after a minor pullback and it is ready to challenge its highest levels observed in 2023.
The momentum indicators are promoting this strong recovery. Specifically, the MACD histogram is strengthening above both zero and its red signal line, while the RSI has flatlined significantly above its 50-neutral mark.
If bullish pressures persist, the 2023 peak of 145.66 might act as the first barrier for buyers to claim. Piercing through that zone, the pair could ascend towards the December 2022 high of 146.73. A violation of that zone could set the stage for the eight-year high of 148.39.
On the flipside, bearish actions could send the price to test 144.85, which is the 23.6% Fibonacci retracement of the 133.39-148.39 upleg. If that barricade fails, the bears could aim for the 38.2% Fibo of 142.66 before the 50.0% Fibo of 140.89 appears on the radar. Even lower, the 61.8% Fibo of 139.12 may curb further declines.
Overall, EURJPY seems to be recovering from the latest pullback that dragged it away from its 2023 highs. Therefore, the pair's advance could accelerate in the case that it breaks above the 145.66 ceiling.