Sample Category Title
NZD/USD: Waiting for Impulse (c) in a Bearish Zigzag
The current chart shows that NZDUSD in the long term may form a corrective zigzag pattern consisting of primary waves.
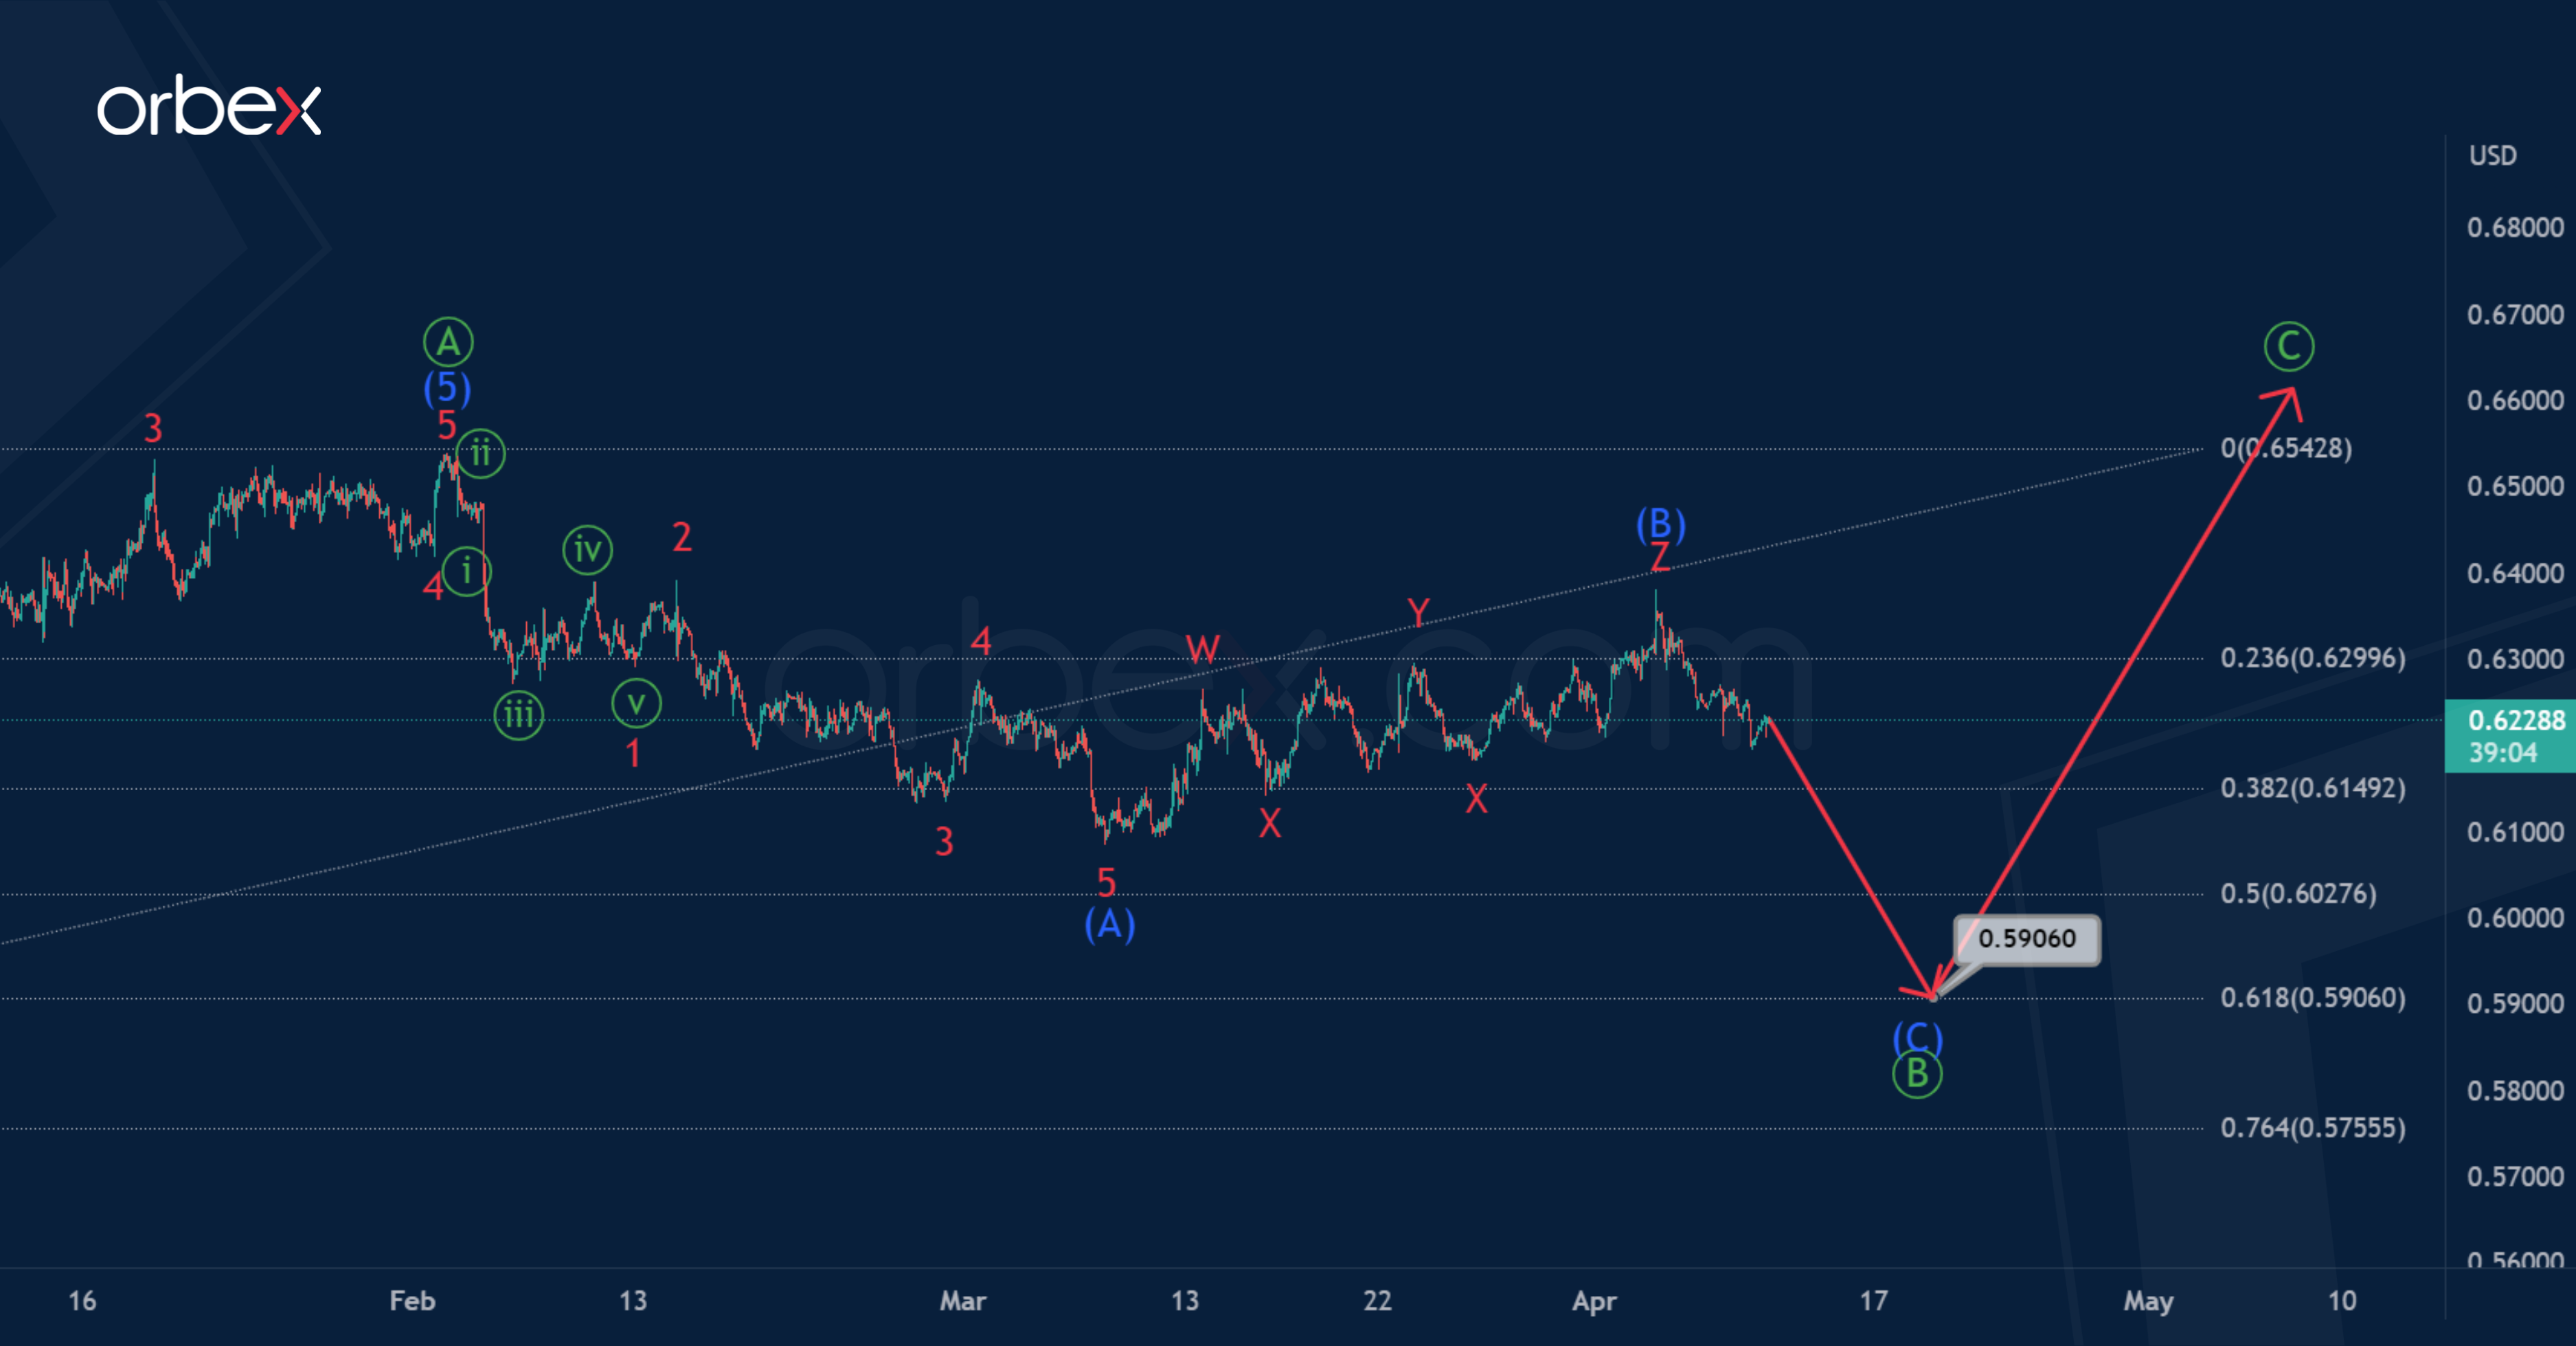
The first impulse wave. has been successfully completed. A bearish correction. is under development, the internal structure of which is similar to a zigzag (A)-(B)-(C). Impulse (A) and correction (B) can be considered completed.
In the near future, the price may drop in the intermediate impulse (C) to 0.590. At that level, primary correction will be at 61.8% of actionary wave.
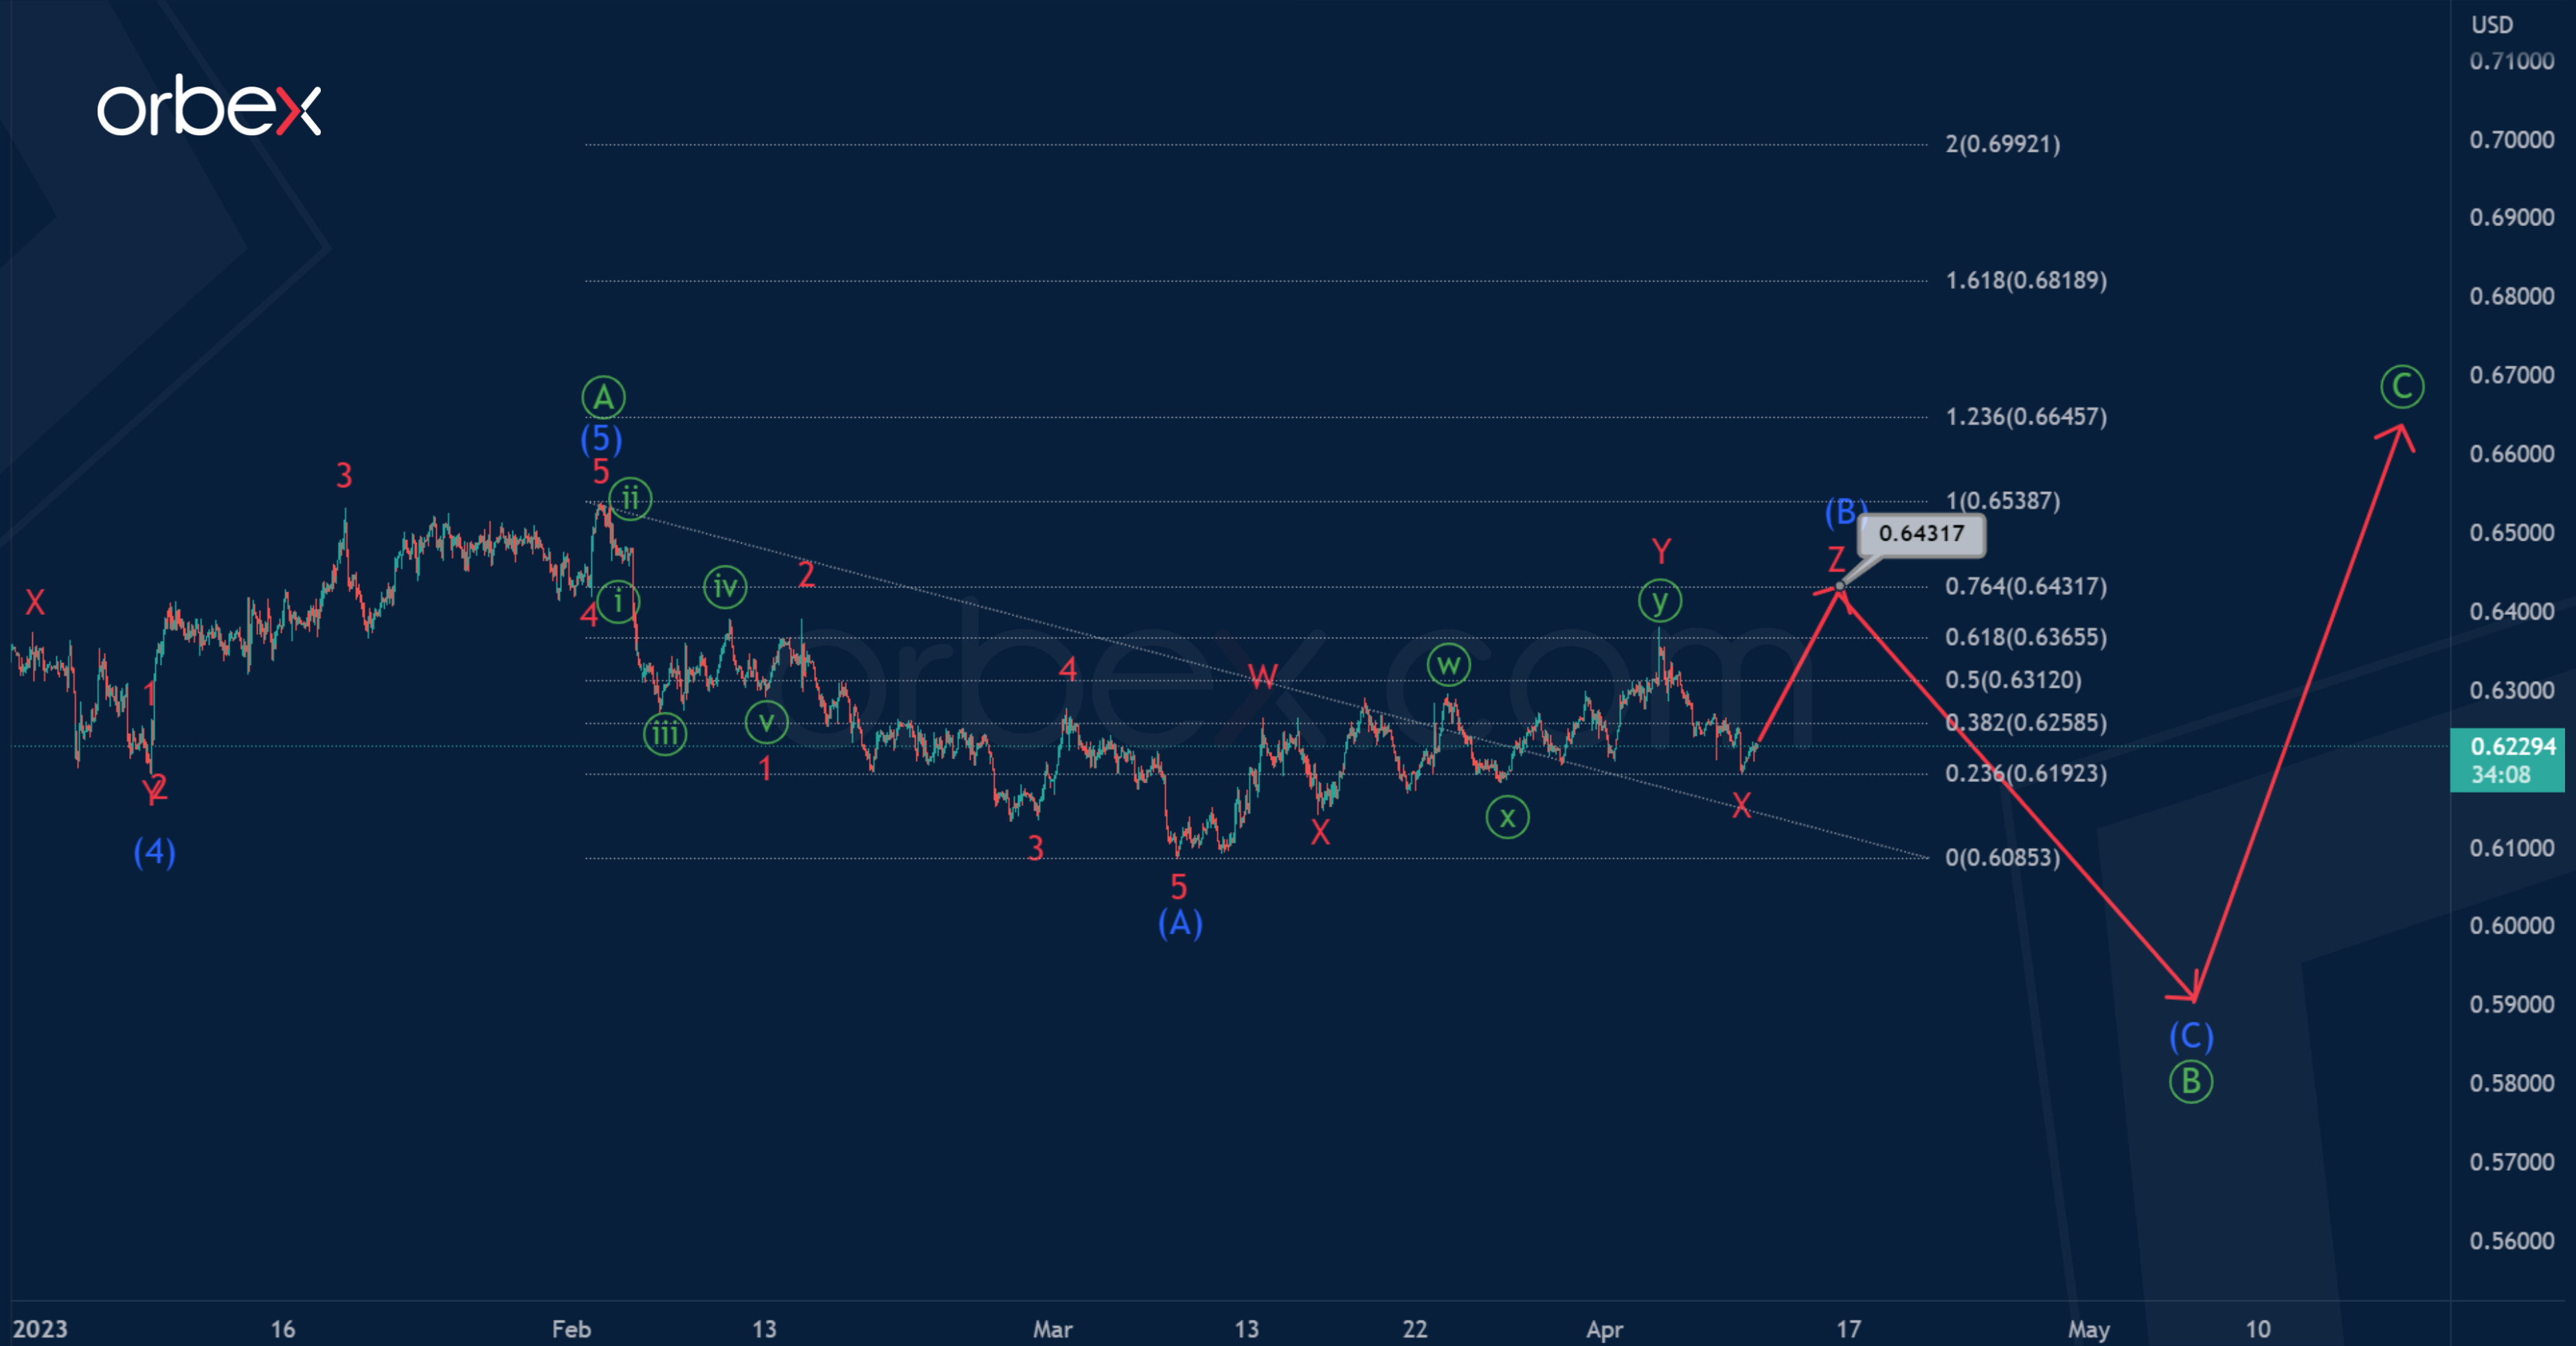
Alternatively, only the first impulse wave (A) is completed inside the primary correction, and the intermediate correction (B) is likely to continue to form.
It is assumed that the correction (B) takes the form of a minor triple zigzag, in which the first four parts could end. In the near future, market participants may observe a rise in the price in the final actionary wave Z.
Most likely, the price will rise to 0.643. At that level, correction (B) will be at 76.4% along the Fibonacci lines of impulse (A).
EUR/USD Should Soon Finds Its Way Back Above 1.09
Markets
Europe was still enjoying a four-day Easter weekend yesterday. The US had less time off with both equity and bond markets again fully open. The absence of other important economic data allowed Friday’s payrolls release to linger on. That March report was overall slightly stronger than expected, ending a streak of disappointing data earlier that week. After shooting higher by almost 15 bps during a holiday-shortened session end last week, Treasury yields added another 1.7-3 bps across the curve under lower-than-usual volumes. The dollar gained against most of the majors. The trade-weighted index advanced from 102.09 to 102.57. EUR/USD swapped 1.09 for a close at 1.0859. The Japanese yen ended last vs comparable peers. USD/JPY added one and a half big figure to 133.61. Aside from higher core bond yields, the currency suffered from Bank of Japan governor Ueda at his inaugural news conference sticking to YCC and negative interest rates for now. An intraday improvement on Wall Street didn’t help either. The likes of the Nasdaq gapped 1.35% lower at the open in a catch-up move with Friday’s US yield surge (equity markets did close on Good Friday). Stocks eventually finished flat to slightly higher (DJI +0.3%).
Asian-Pacific markets draw comfort from WS’s intraday recovery. Stocks in Korea and Japan outperform, China lags behind. News revolves around the Bank of Korea’s policy decision (cfr. infra) as well as Chinese inflation numbers. PPI inflation declined by the expected 2.5% y/y but CPI (0.7% y/y) missed a 1% consensus. The yuan trades stable around 6.88 USD/CNY with a generally better-offered dollar containing the damage for the Chinese currency. EUR/USD ekes out a gain to trade in the high 1.08 area. US cash yields shed a few bps but Bund yields are set for a gap higher in a catch-up move with Friday and to a lesser extent Monday. Trading for the remainder of the day will be technically and sentiment driven. With the exception of the IMF’s updated World Economic Outlook, the calendar eyes meagre today. That changes starting tomorrow, with US CPI numbers and the Fed meeting minutes due. US retail sales and U. of Michigan consumer confidence are scheduled for release on Friday, together with the (unofficial) start of the Q1 earnings season. Quotes from IMF/World Bank spring meetings will hit the screens all week. Support in the US 10y yield at the 3.30% area survived but it’ll take a return at least above 3.50% for the immediate downside alert to be called off. The 2y yield tries to take out the 4% barrier. The technical picture in the German 10y looks less dramatic. First resistance here is located at 2.40%. In case equity sentiment holds up, EUR/USD should soon finds its way back above 1.09. The 1.0973 April high serves as the first meaningful resistance.
News Headlines
The Bank of Korea kept its policy rate as expected unchanged at 3.5% for a second meeting running. The decision was unanimous. The Board keeps a hawkish bias when it comes to further rate increases while adding that the restrictive policy stance will be maintained for a considerable time with an emphasis on ensuring price stability. It is forecast that inflation will continue to be above the 2% target level for a considerable time although it is projected to continue to slow, and uncertainties surrounding the policy decision are also judged to be high with increasing risks to the financial sector in major countries. Consumer price inflation for this year is expected to be consistent with the February forecast of 3.5%. Meanwhile, it is judged that core inflation is likely to be somewhat higher than the February forecast of 3% for this year, considering its slow pace of decline recently.
The NY Fed yesterday released its March Survey of Consumer Expectations. It showed that inflation expectations increased at the short-term (1y; 4.7% from 4.2%; first increase since October) and medium-term (3y; 2.8% from 2.7%) horizons, but decreased slightly at the longer-term horizon (5y; 2.5% from 2.6%). Especially expectations for the cost of college education increased. Median one-year-ahead expected earnings growth remained unchanged at 3% in March with median expected growth in household income up 0.1 ppt to 3.3%. The mean perceived probability of losing one’s job in the next 12 months decreased by 0.4 percentage point to 11.4%. Perceptions of credit access compared to a year ago deteriorated in March, with the share of households reporting it is harder to obtain credit than one year ago rising and reaching a series high.
EUR/AUD Daily Outlook
Daily Pivots: (S1) 1.6317; (P) 1.6352; (R1) 1.6388; More...
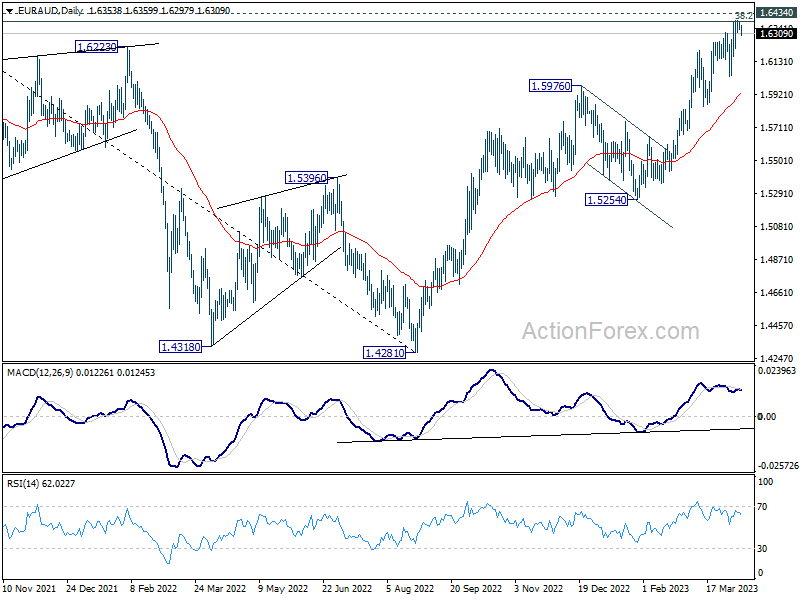
EUR/AUD dips slightly lower today but stays well above 1.6216 minor support. Intraday bias stays neutral for the moment. Considering bearish divergence condition in 4H MACD, firm break of 1.6216 should confirm short term topping, after rejection by 1.6389/6434 cluster resistance zone. Intraday bias will be back on the downside in this case, to 1.6033 support and possibly below. However, on the upside, decisive break of 1.6389/6434 cluster resistance zone will carry larger bullish implications.
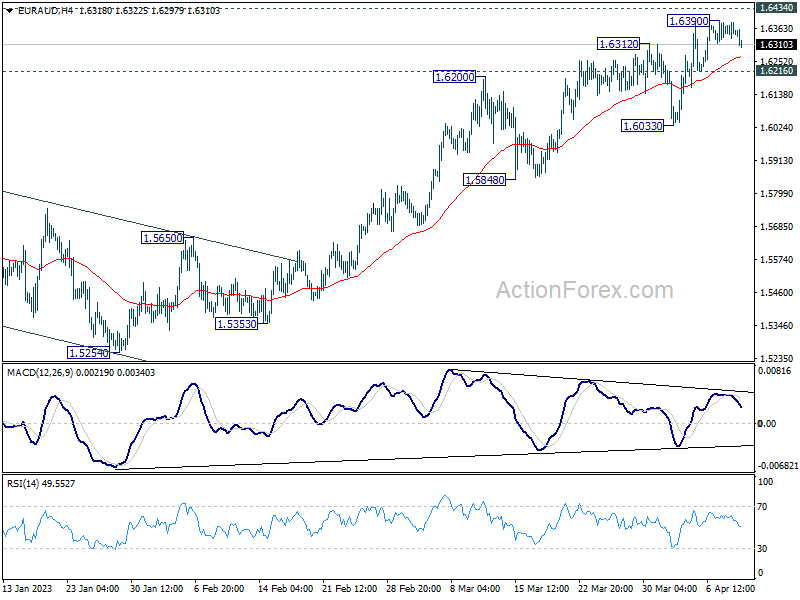
In the bigger picture, focus stays on 1.6389/6434 cluster resistance (38.2% retracement of 1.9799 to 1.4281 at 1.6389). Sustained break there should confirm that whole down trend from 1.9799 (2020 high) has completed. Further rally should then be seen to 61.8% retracement at 1.7691. However, rejection by this cluster resistance will make medium term outlook neutral at best.
Aussie Gains on Improved Consumer and Business Confidence, Yen Under Pressure
Australian Dollar is having a broad recovery in Asian session today, bolstered by improvements in both consumer and business confidence data. While the rally's strength is still limited, Aussie appears to have some room for further upside before encountering near-term resistance levels. European majors follow as the next strongest, with Sterling holding a slight advantage over other peers.
Yen remains under pressure due to expectations that the BoJ will not alter its ultra-loose monetary policies anytime soon. Dollar is also losing ground on positive market sentiment. Canadian Dollar is currently mixed, with the market awaiting tomorrow's BoC rate decision, where a hold is widely expected.
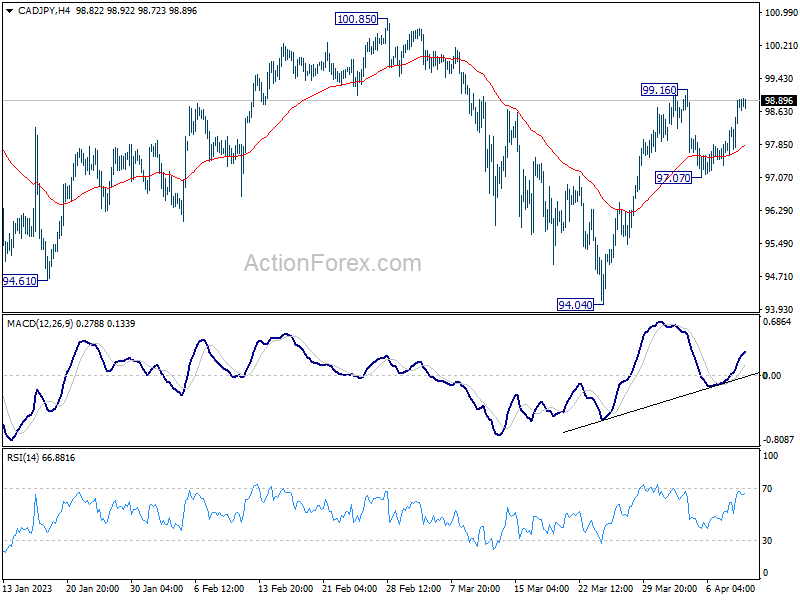
Technically speaking, CAD/JPY's retreat from 99.16 seems to have completed at 97.07. The rise from 94.04 short-term bottom could be set to resume. A firm break above 99.16 would confirm this bullish case, targeting 100.85 resistance. The key question is: When the upside breakout occurs, will it be accompanied by a deeper sell-off in USD/CAD or a stronger rally in USD/JPY?
In Asia, Nikkei close up 1.05%. Hong Kong HSI is up 0.33%. China Shanghai SSE is down -0.;23%. Singapore Strait Times is up 0.02%. Japan 10-year JGB yield is down -0.0115 at 0.457. Overnight, DOW rose 0.30%. S&P 500 rose 0.10%. NASDAQ dropped -0.03%. 10-year yield rose 0.127 to 3.415.
Australia consumer sentiment jumped 9.4% on RBA pause
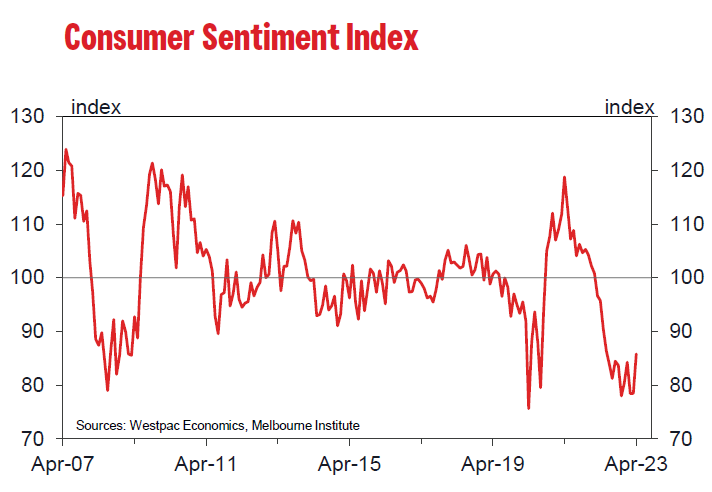
Australia Westpac Melbourne Institute Consumer Sentiment Index witnessed a significant 9.4% increase in April, jumping from 78.4 in March to 85.8. This remarkable recovery can be largely attributed to RBA's decision to pause rate hikes during its April meeting, breaking a sequence of ten consecutive meetings with cash rate increases.
However, confidence remains weak, sitting -10.4% lower than April of the previous year, before the tightening cycle began. Respondents continue to exercise caution, with 34.11% still expecting the Standard Variable Rate to rise by more than 1% over the year, although this figure is down from 44.55%.
Regarding the RBA's meeting on May 2, Westpac noted that the central bank would benefit from a clean read on underlying inflation from the March quarter Inflation Report, set to be released on April 26, as well as staff's refreshed economic forecasts. Westpac anticipates that a final 0.25% increase in the cash rate during the May Board meeting would be the best policy approach, rather than waiting for additional information and risking higher rates later in the cycle.
Australian NAB business confidence improved, conditions remain resilient
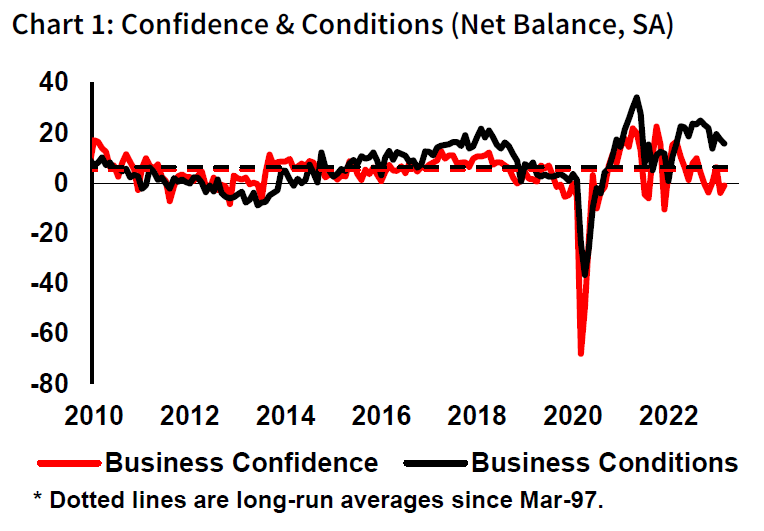
Australia NAB Business Confidence improved from -4 to -1 in March, while Business Conditions dropped slightly from 17 to 16. Delving into some details, trading conditions rose from 25 to 26, profitability conditions dipped from 14 to 13, and employment conditions fell from 12 to 10.
NAB Chief Economist Alan Oster commented, "Business conditions have been resilient, slowly edging lower over the past few months but remaining well above their long-run average." He added that "trading conditions are particularly elevated, indicating that businesses continue to experience strong demand, and conditions are generally strong across states and sectors."
On the topic of confidence, Oster stated, "Confidence appears to have stabilized, but it remains below average at -1 index point." He noted that confidence was particularly poor in retail and wholesale sectors, likely due to firms being concerned about the sustainability of consumer spending.
In summary, the survey suggests the Australian economy is still holding up, with some easing in inflation. However, Oster emphasized that "there is still a long way to go to bring inflation back down to the RBA's target band and growth could be more volatile from there."
China CPI slows to 18-month low, PPI sees steepest decline since June 2022
China's CPI slowed from 1.0% yoy to 0.7% yoy in March, falling below the expected 1.0% yoy and marking the lowest level in 18 months since September 2021. Excluding food and energy, CPI increased from 0.6% to 0.7% yoy. Food prices rose by 2.4% yoy compared to a year ago, down from 2.6% yoy in February. Notably, pork prices surged by 9.6% yoy, up from a rise of 3.9% yoy in February.
Dong Lijuan, an NBS statistician, attributed the easing consumer inflation in March to "continued resumption of production and life as well as sufficient market supplies." He also mentioned that the fall in factory-gate prices was affected by a high comparison base in the previous year.
Meanwhile, PPI dropped from -1.4% yoy to -2.5% yoy, matching expectations and marking the steepest decline since June 2022. Dong Lijuan, senior NBS statistician, explained that "production and life continued to recover with sufficient supplies in March."
Looking ahead
Eurozone Sentix investor confidence and retail sales will be released in European session. US economic calendar is near empty with NFIB small business index featured only.
EUR/AUD Daily Outlook
Daily Pivots: (S1) 1.6317; (P) 1.6352; (R1) 1.6388; More...
EUR/AUD dips slightly lower today but stays well above 1.6216 minor support. Intraday bias stays neutral for the moment. Considering bearish divergence condition in 4H MACD, firm break of 1.6216 should confirm short term topping, after rejection by 1.6389/6434 cluster resistance zone. Intraday bias will be back on the downside in this case, to 1.6033 support and possibly below. However, on the upside, decisive break of 1.6389/6434 cluster resistance zone will carry larger bullish implications.
In the bigger picture, focus stays on 1.6389/6434 cluster resistance (38.2% retracement of 1.9799 to 1.4281 at 1.6389). Sustained break there should confirm that whole down trend from 1.9799 (2020 high) has completed. Further rally should then be seen to 61.8% retracement at 1.7691. However, rejection by this cluster resistance will make medium term outlook neutral at best.
Economic Indicators Update
| GMT | Ccy | Events | Actual | Forecast | Previous | Revised |
|---|---|---|---|---|---|---|
| 00:30 | AUD | Westpac Consumer Confidence Apr | 9.40% | 0.00% | ||
| 01:30 | AUD | NAB Business Conditions Mar | 16 | 17 | ||
| 01:30 | AUD | NAB Business Confidence Mar | -1 | -4 | ||
| 01:30 | CNY | CPI Y/Y Mar | 0.70% | 1.00% | 1.00% | |
| 01:30 | CNY | PPI Y/Y Mar | -2.50% | -2.50% | -1.40% | |
| 06:00 | JPY | Machine Tool Orders Y/Y Mar P | -15.20% | -10.70% | ||
| 08:30 | EUR | Sentix Investor Confidence (Apr) | -14 | -11.1 | ||
| 09:00 | EUR | Eurozone Retail Sales M/M Mar | -0.80% | 0.30% | ||
| 10:00 | USD | NFIB Business Optimism Index Mar | 89.6 | 90.9 |
DXY (US Dollar) Elliott Wave Sequence Favors Lower
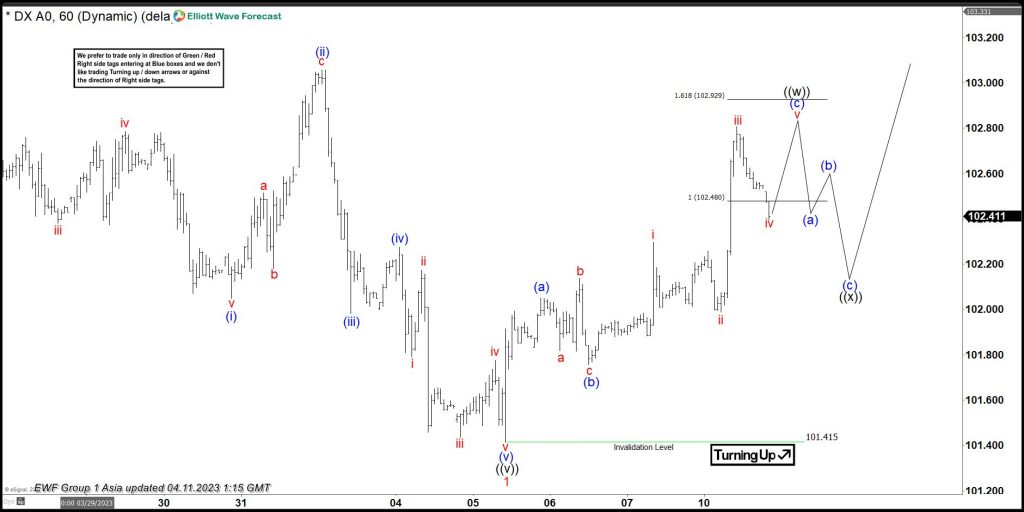
DXY (US Dollar) Showing 5 swings impulse Elliott wave sequence lower from the 3/08/2023 high, which ended at $101.415 low on 4/05/2023. Above there, it favors a corrective bounce in 3, 7 or 11 swings before downside resumes. DXY proposed ended (B) at $105.883 high on 3/08/2023. Below there, it placed ((i)) at $103.484 low & ((ii)) at $105.103 high. ((ii)) was 0.618 Fibonacci retracement of first leg. It placed ((iii)) at $101.915 low on 3/23/2023. It bounced off in ((iv)), which ended at $103.357 high on 3/24/2023. Finally, it ended ((v)) as diagonal sequence at $101.415 low on 4/05/2023 to finish wave 1. Above there, it favors a corrective bounce in wave 2, which should fail below (B) high to resume lower as the part of (C) leg, which confirms below February low.
Above wave 1 low, it placed (a) at $102.052 high & (b) at $101.755 low. It favors higher in (c) of ((w)) of wave 2. It placed i at $102.297 high, ii at $101.988 low & iii at $102.807 high. Below there, it favors pullback in iv before final leg higher in v to finish (c) as ((w)) within extreme areas. It may even ended ((w)) leg & correcting lower in ((x)) leg to retest the low before turning higher in wave ((y)) as the part of 2. Wave 2 bounce should fail in 7 or 11 swings from extreme areas in bearish sequence to resumes downside later in wave 3 of (C), which confirms below $101.415 low.
DXY 60 Minute Elliott Wave Chart
DXY Elliott Wave Video
https://www.youtube.com/watch?v=wpBFAtXxKDk
Technical Outlook and Review
DXY:
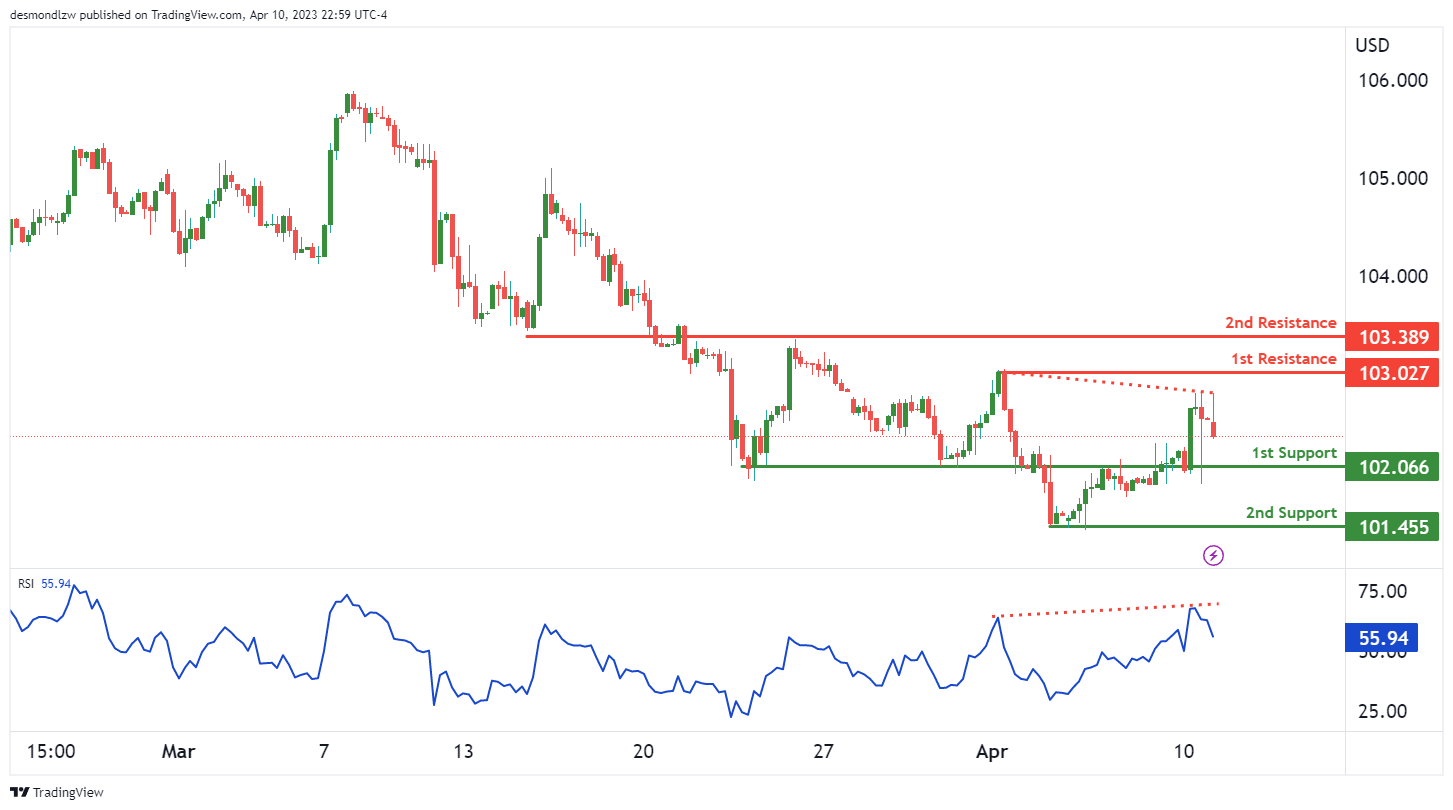
Looking at the DXY chart, the overall momentum is currently bearish. There is potential for a bearish continuation towards the 1st support level at 102.06, which is a pullback support level. If the price were to break below this level, the next support level it could drop to is the 2nd support level at 101.45, which is also a pullback support level.
On the other hand, the 1st resistance level is at 103.02, which is a swing high resistance level. If the price were to rise, the next resistance level it could face is the 2nd resistance level at 103.38, which is an overlap resistance level.
It’s worth noting that the RSI is displaying bearish divergence versus price, suggesting that a reversal might occur soon.
EUR/USD:
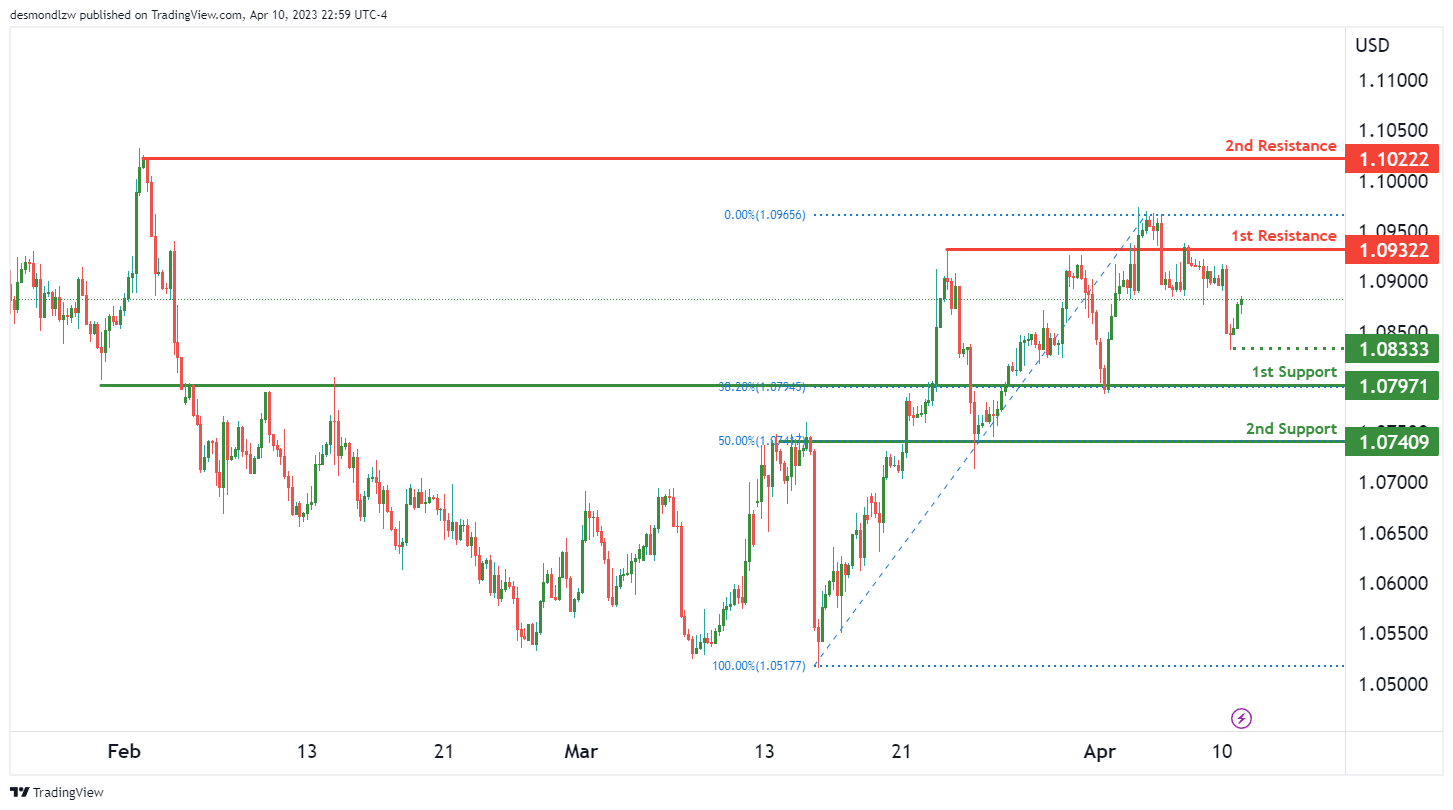
The EUR/USD chart is currently showing bullish momentum. Price could potentially make a bullish continuation towards the 1st resistance. The 1st support is at 1.0797, which is an overlap support level and also coincides with the 38.20% Fibonacci retracement level. The 2nd support level is at 1.0740, which is another overlap support level and also coincides with the 50% Fibonacci retracement level.
On the other hand, the 1st resistance level is at 1.0932, which is an overlap resistance level. The 2nd resistance level is at 1.1022, which is a swing high resistance level.
In addition to these levels, there is an intermediate support level at 1.0833, which is a swing low support level.
GBP/USD:
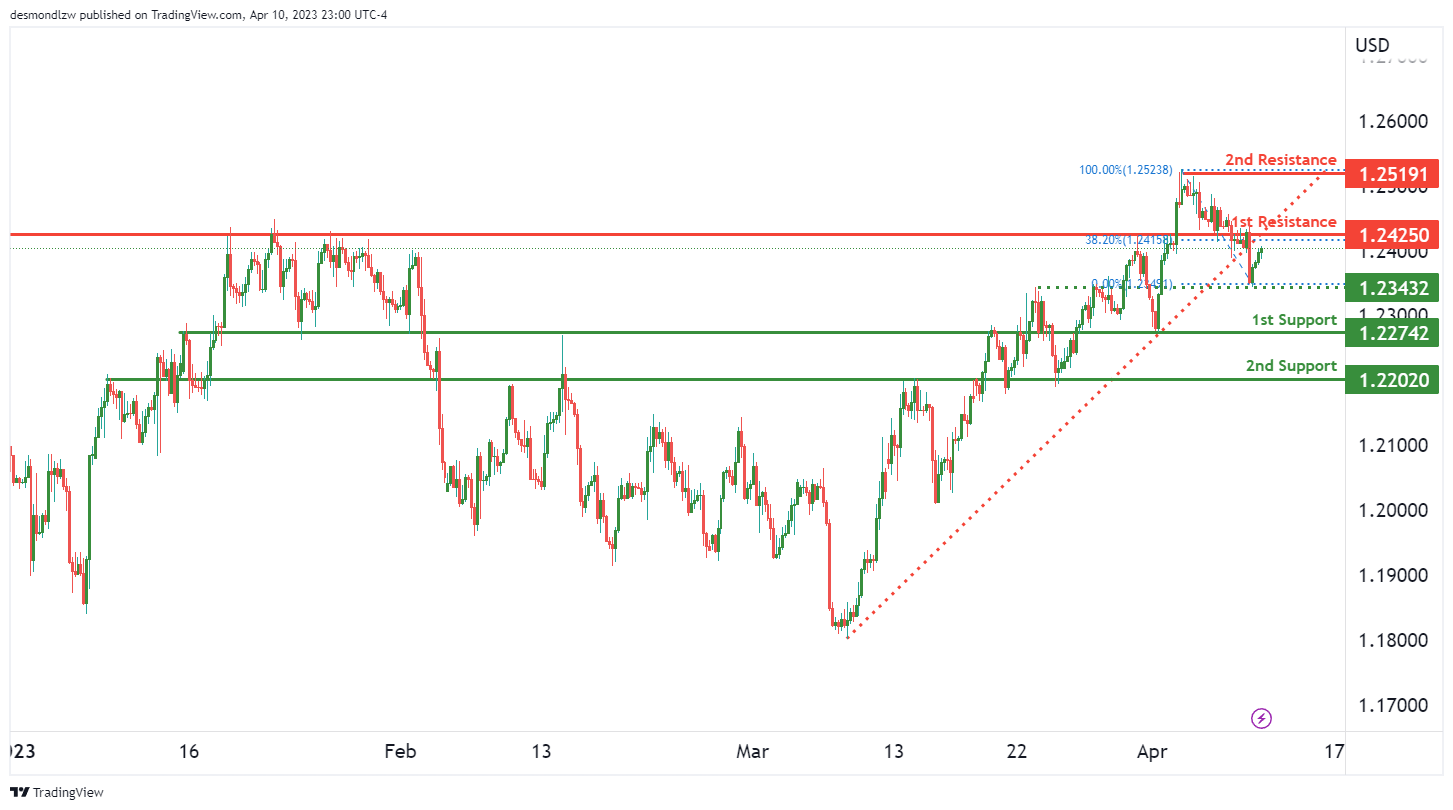
The overall momentum of the GBP/USD chart is currently bullish, despite breaking below an ascending support line, which has triggered a potential bearish move. Factors contributing to the bullish momentum include a potential bullish continuation towards the 1st resistance level.
At the moment, the 1st support level for GBP/USD is at 1.2274. This is a strong overlap support level and is followed by a 2nd support level at 1.2202, which is also an overlap support level. If the price were to bounce off either of these support levels, it could potentially rise to the 1st resistance level at 1.2425. This resistance level is also an overlap resistance level, and a break above it could trigger a bullish continuation towards the 2nd resistance level at 1.2519.
It’s worth noting that there is also an intermediate support level at 1.2343, which is also an overlap support level. This could be a potential area for a bounce if the price were to drop further.
USD/CHF:
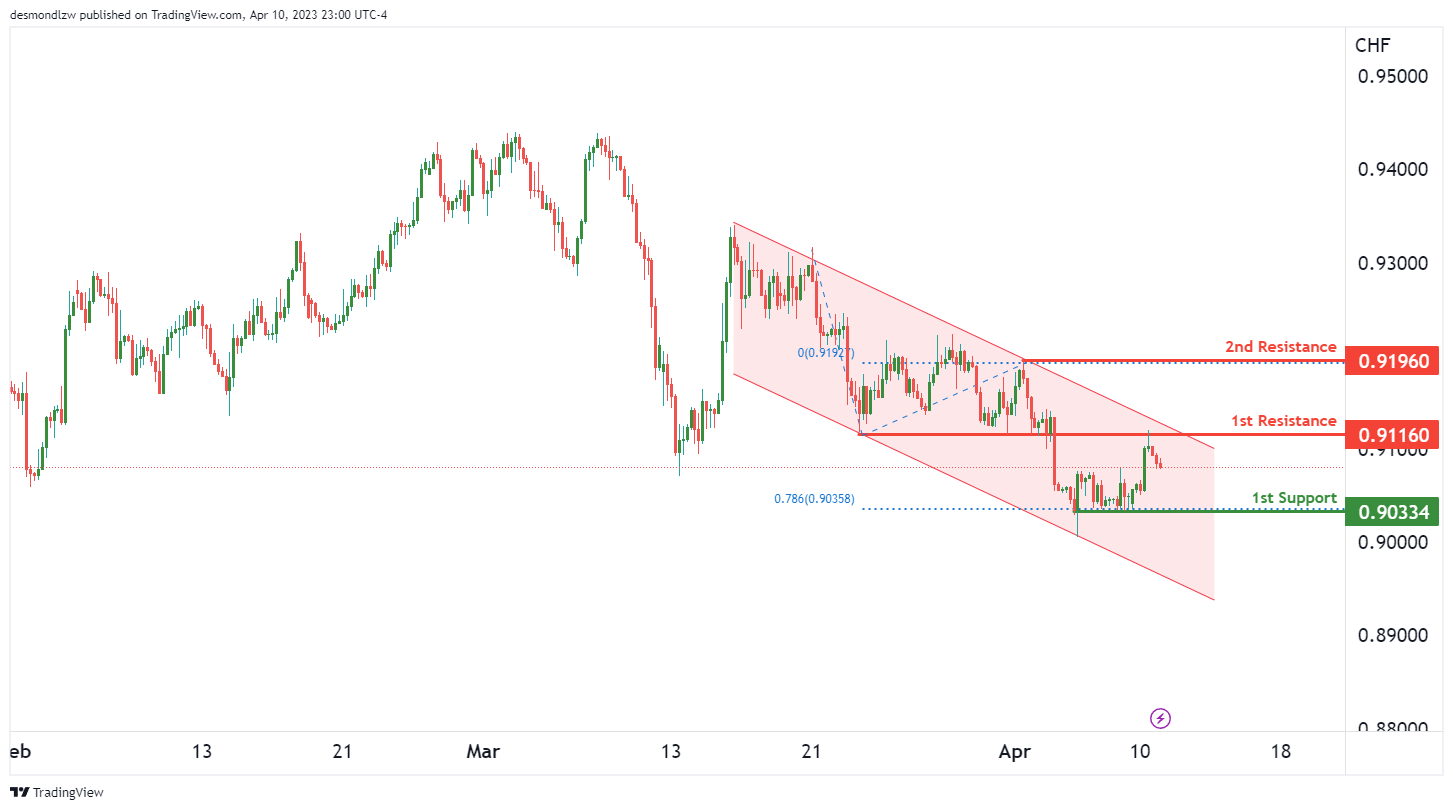
The USD/CHF chart is currently displaying bearish momentum, with the price potentially continuing its downtrend towards the first support at 0.9033. This level is a pullback support and has previously held as a support level in the past.
At the moment, there isn’t any particular bullish factor contributing to the momentum, making the chart outlook bearish. Additionally, price is not only below the Ichimoku cloud, indicating bearish momentum, but it has also broken below an ascending support line, which could potentially trigger further bearish momentum.
Looking at the resistance levels, the first resistance at 0.9116 is a strong overlap resistance. If price were to break above this level, it could potentially rise towards the second resistance at 0.9196, which is a swing high resistance. However, the overall bearish momentum suggests that a bearish continuation towards the first support is more likely.
USD/JPY:
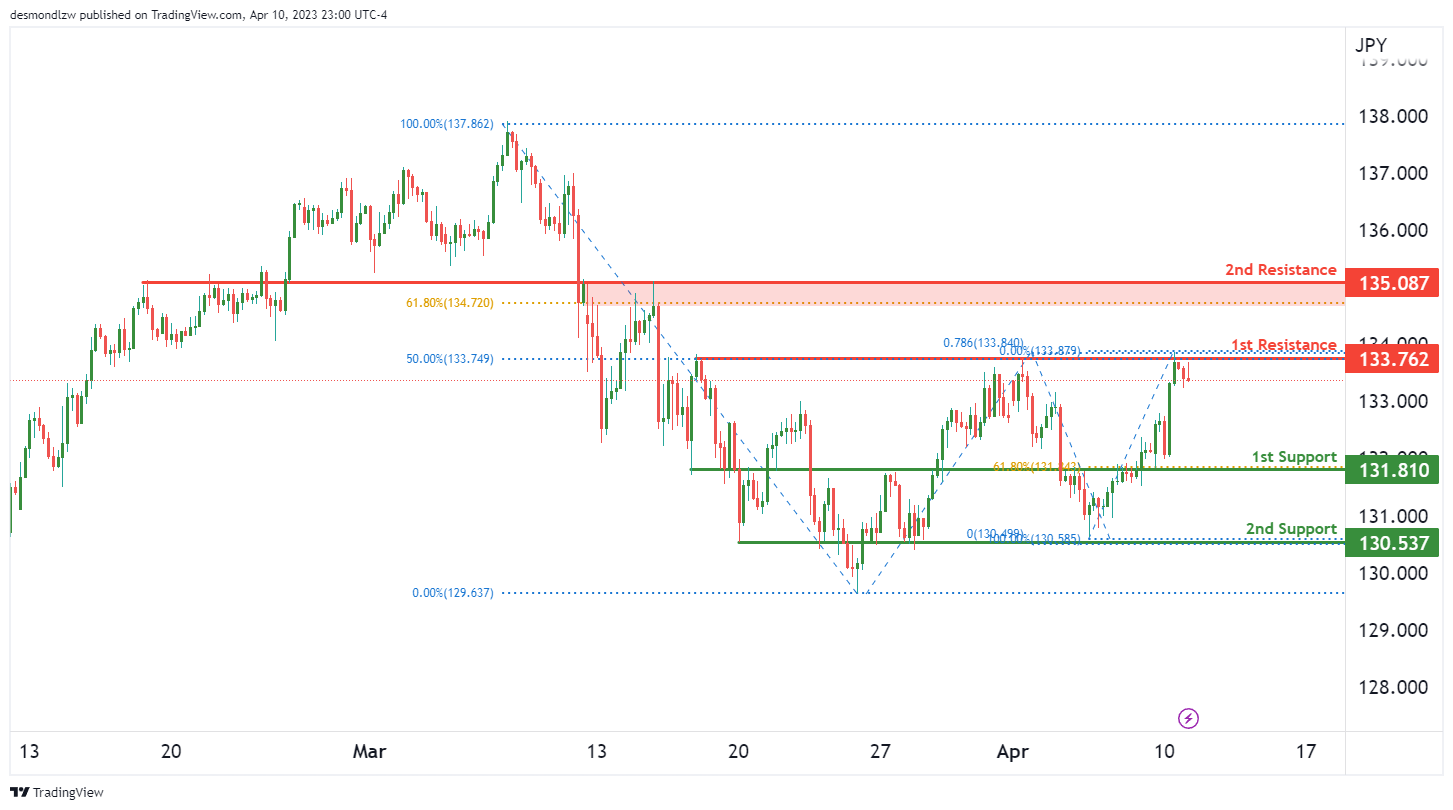
The USD/JPY chart is currently showing a bearish overall momentum, suggesting that we may see a drop in price in the near future. If we look at the chart, there is a potential for a bearish reaction off the 1st resistance level at 133.76, which is a strong pullback resistance level, coinciding with the 78.60% Fibonacci projection. If price drops from this resistance level, it could potentially fall towards the 1st support at 131.81. This level is an overlap support level and has the 61.80% Fibonacci retracement lining up with it, making it a good level for price to potentially bounce off of.
If price were to break below the 1st support, it could fall towards the 2nd support at 130.53, which is also an overlap support level. However, if price were to break above the 1st resistance, it could potentially rise towards the 2nd resistance at 134.08, which is an overlap resistance level and has the 61.80% Fibonacci retracement lining up with it.
AUD/USD:
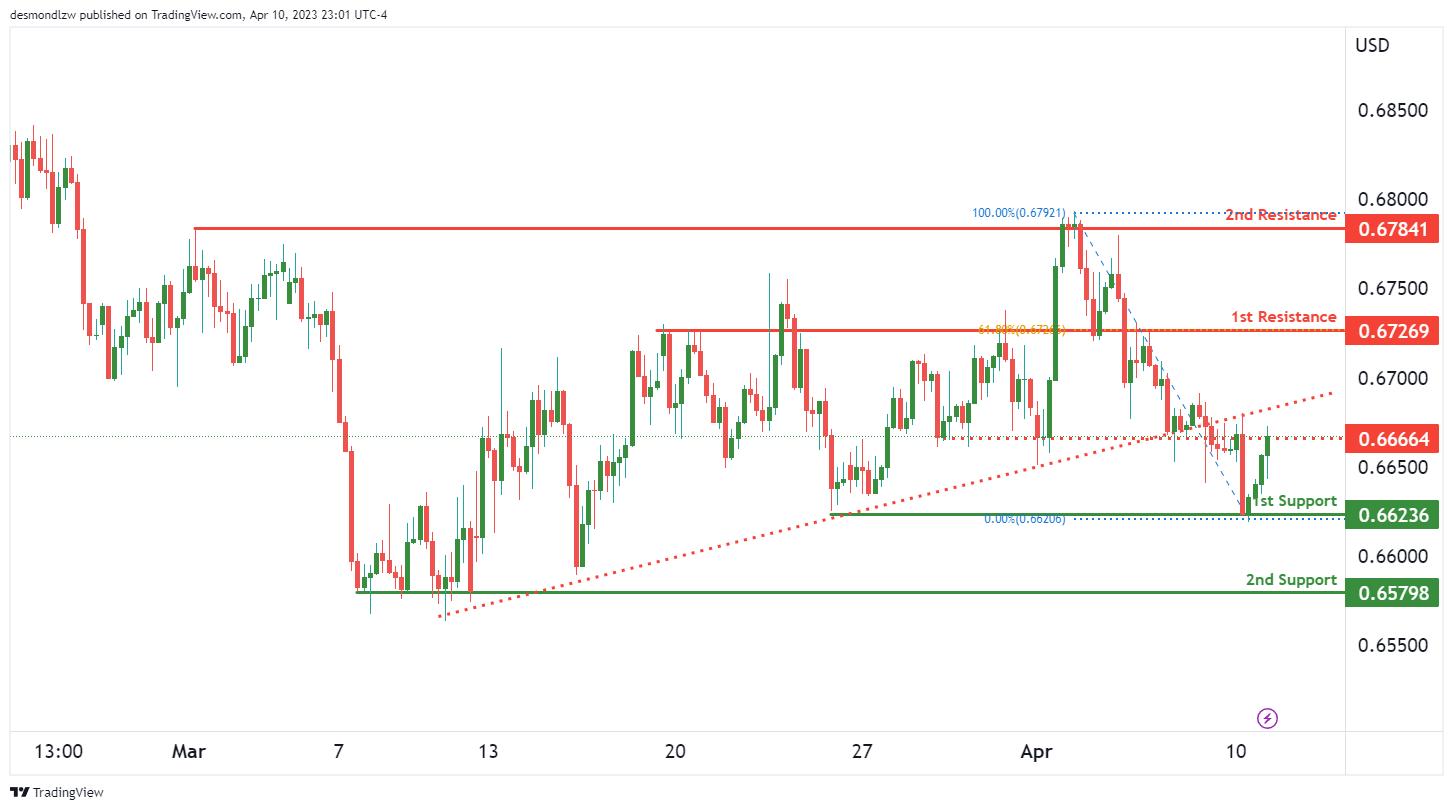
The overall momentum of the AUD/USD chart is currently bearish, with price breaking below an ascending support line and triggering a potential bearish move. This suggests that there may be further downside potential for the pair.
Looking at potential price movements, AUD/USD could potentially make a bearish reaction off the first resistance level and drop to the first support level. The first support is located at 0.6623 and is a swing low support. Should price break this level, the next support is at 0.6579, a multi-swing low support.
On the other hand, the first resistance level is at 0.6726, an overlap resistance level. If price were to bounce off this level, it could potentially drop to the first support at 0.6623. The second resistance level is at 0.6784, a multi-swing high resistance level.
There is also an intermediate resistance at 0.6666, an overlap resistance level, which is located between the current price and the first resistance level.
NZD/USD:
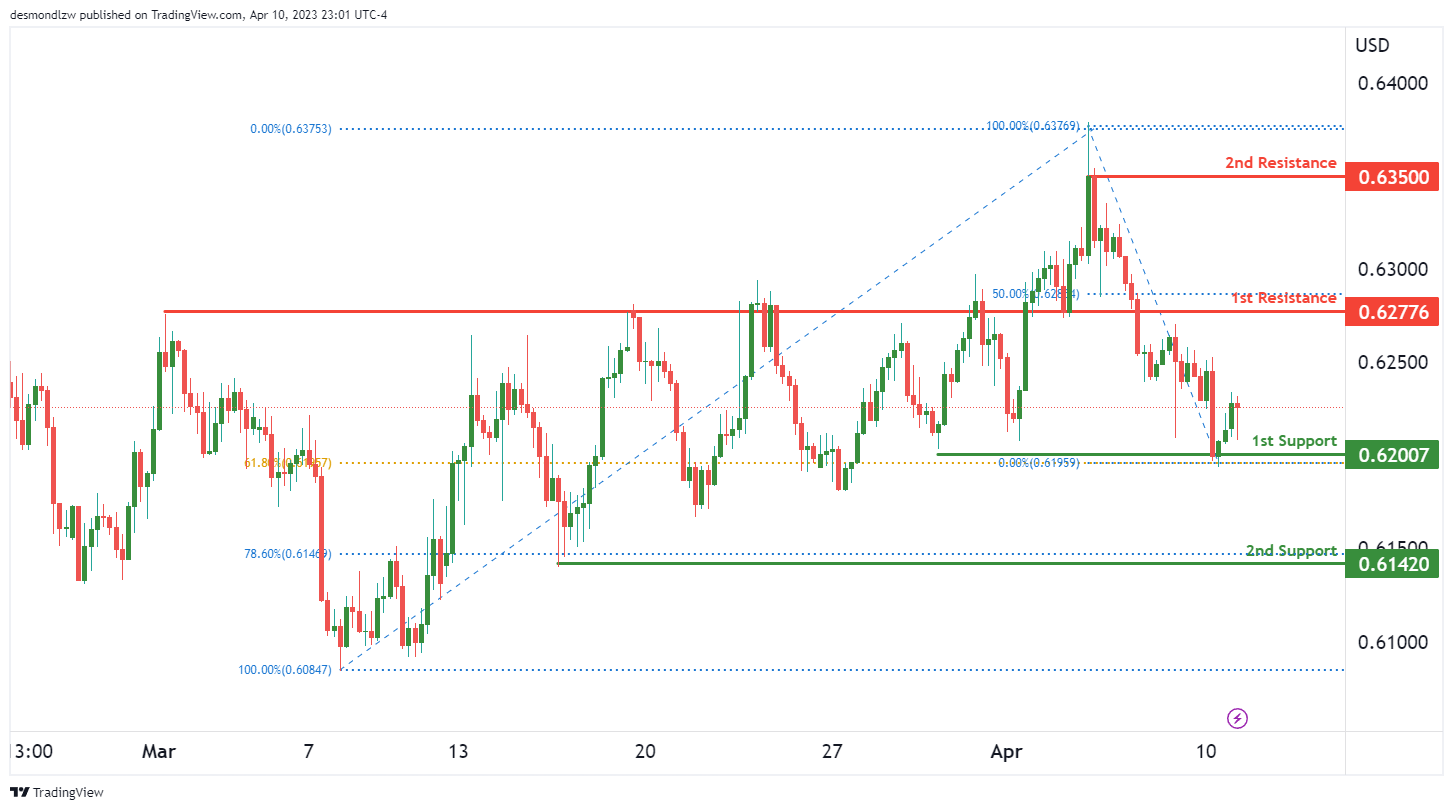
The NZD/USD chart is currently showing bullish momentum, with potential for a continuation towards the 1st resistance level. The 1st support level is at 0.6200, which is a pullback support and coincides with a 61.80% Fibonacci retracement. A bounce from this support level could lead to a rise towards the 1st resistance at 0.6277, which is a strong overlap resistance and has a 50% Fibonacci retracement lining up with it.
If the price manages to break through the 1st resistance level, it could potentially reach the 2nd resistance level at 0.6350, which is a swing high resistance. On the other hand, if the price were to fall below the 1st support level, the next support level to look out for is the 2nd support at 0.6142, which is a swing low support and coincides with a 78.60% Fibonacci retracement.
USD/CAD:
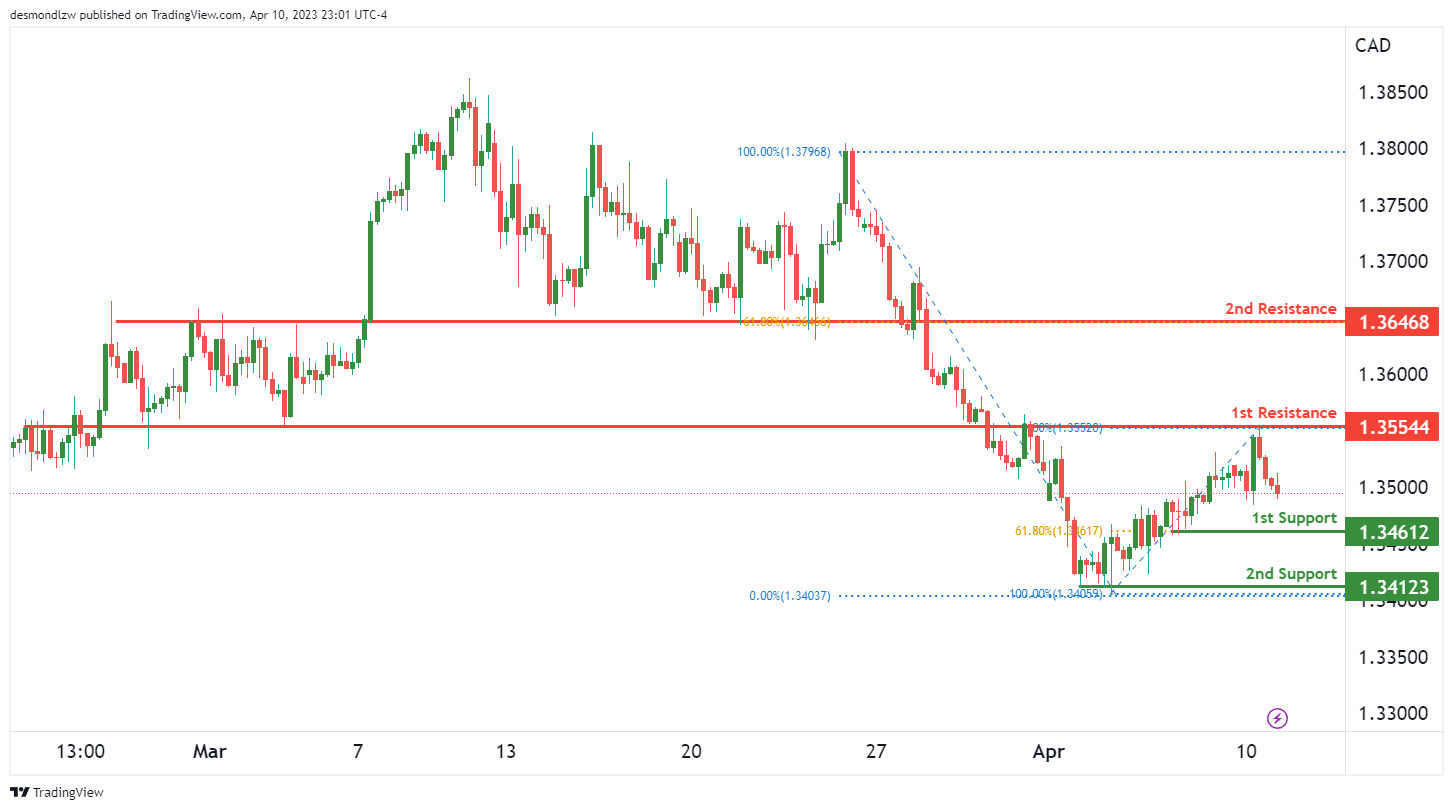
Overall, the USD/CAD chart appears to have a bearish momentum, with potential for a bearish continuation towards the 1st support at 1.3461. This support level is a swing low support and also lines up with a 61.80% Fibonacci retracement, making it a strong level of support. The 2nd support level at 1.3412 is a multi-swing low support, which adds to its significance as a potential area where price could bounce.
On the other hand, there is a 1st resistance level at 1.3554, which is an overlap resistance. If price were to break above this level, it could suggest a potential bullish reversal. However, the 2nd resistance level at 1.3646 is a pullback resistance that lines up with a 61.80% Fibonacci retracement, making it a strong level of resistance where price could potentially reverse.
DJ30:
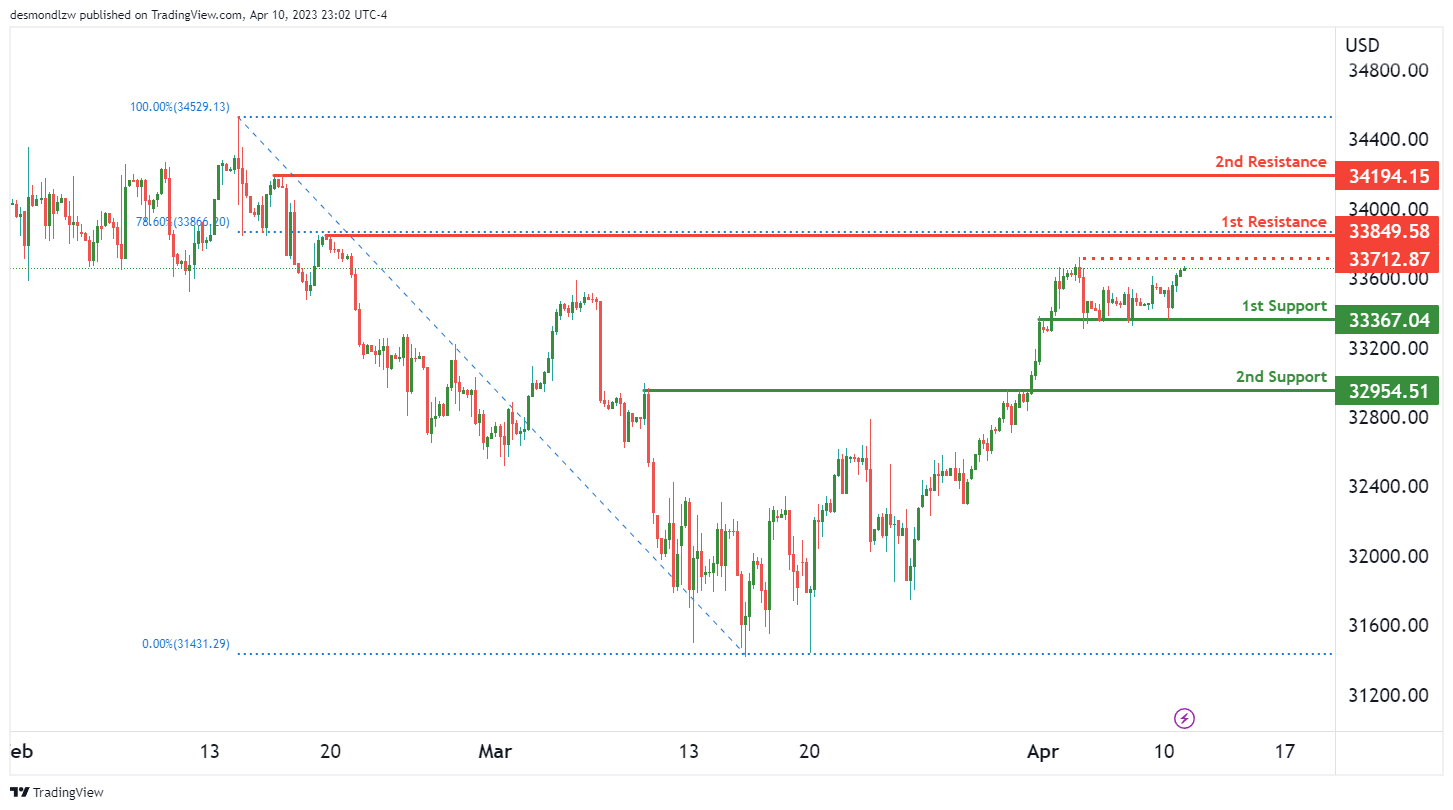
The overall momentum of the DJ30 chart is bullish, with potential for a continuation towards the 1st resistance level. This momentum is supported by the fact that price is above the Ichimoku cloud and has broken above an ascending trend line, both of which are bullish indicators.
The 1st support level is at 33,367.04, and it is a multi-swing low support level. This makes it a strong level of support. If price were to drop and bounce off this support, it could potentially rise towards the 1st resistance level.
The 2nd support level is at 32,954.51, and it is a pullback support level. This level has been tested multiple times in the past, making it a strong level of support. If price were to drop and bounce off this support, it could potentially rise towards the 1st resistance level.
The 1st resistance level is at 33,849.58, and it is a pullback resistance level. This level lines up with a 78.60% Fibonacci retracement, which makes it a strong level of resistance. If price were to break above this resistance level, it could potentially rise towards the 2nd resistance level.
The 2nd resistance level is at 34,194.15, and it is a swing high resistance level. This level has been tested multiple times in the past, making it a strong level of resistance. If price were to break above this resistance level, it could potentially continue to rise further.
There is also an intermediate resistance level at 33,712.87, which is a swing high resistance level. If price were to break above this level, it could trigger a stronger bullish acceleration towards the 1st resistance level.
GER30:
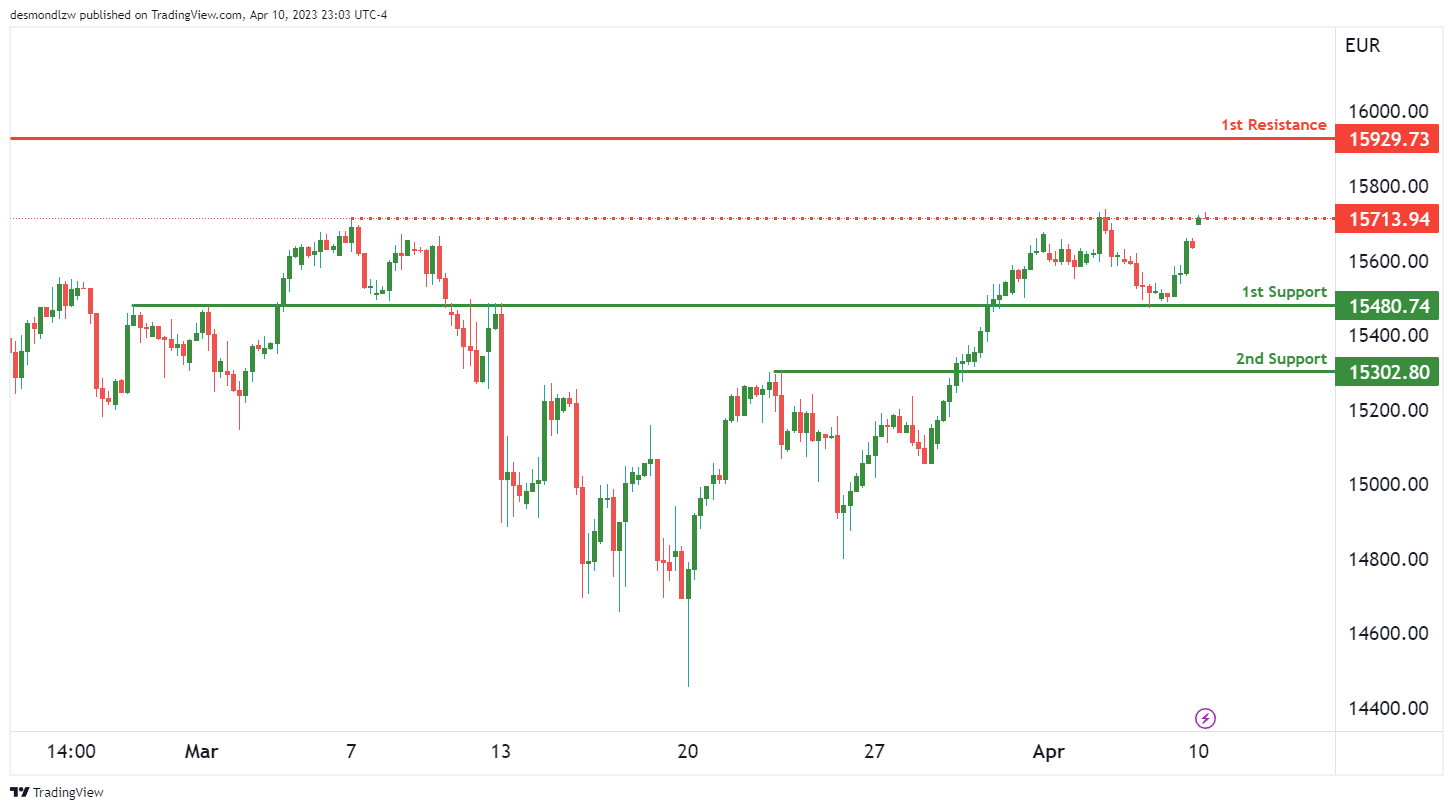
The GER30 chart shows a bullish momentum, and there is a potential for a bullish continuation towards the first resistance level. The first support level is at 15480.74, which is an overlap support level. If the price bounces off this support level, it could potentially rise towards the first resistance level of 15929.73. The second support level is at 15302.80, which is a pullback support level.
However, it’s worth noting that there is an intermediate resistance level at 15713.94 between the current price and the first resistance level. If the price were to break through this intermediate resistance level, it could trigger a stronger bullish acceleration towards the first resistance level.
BTC/USD:
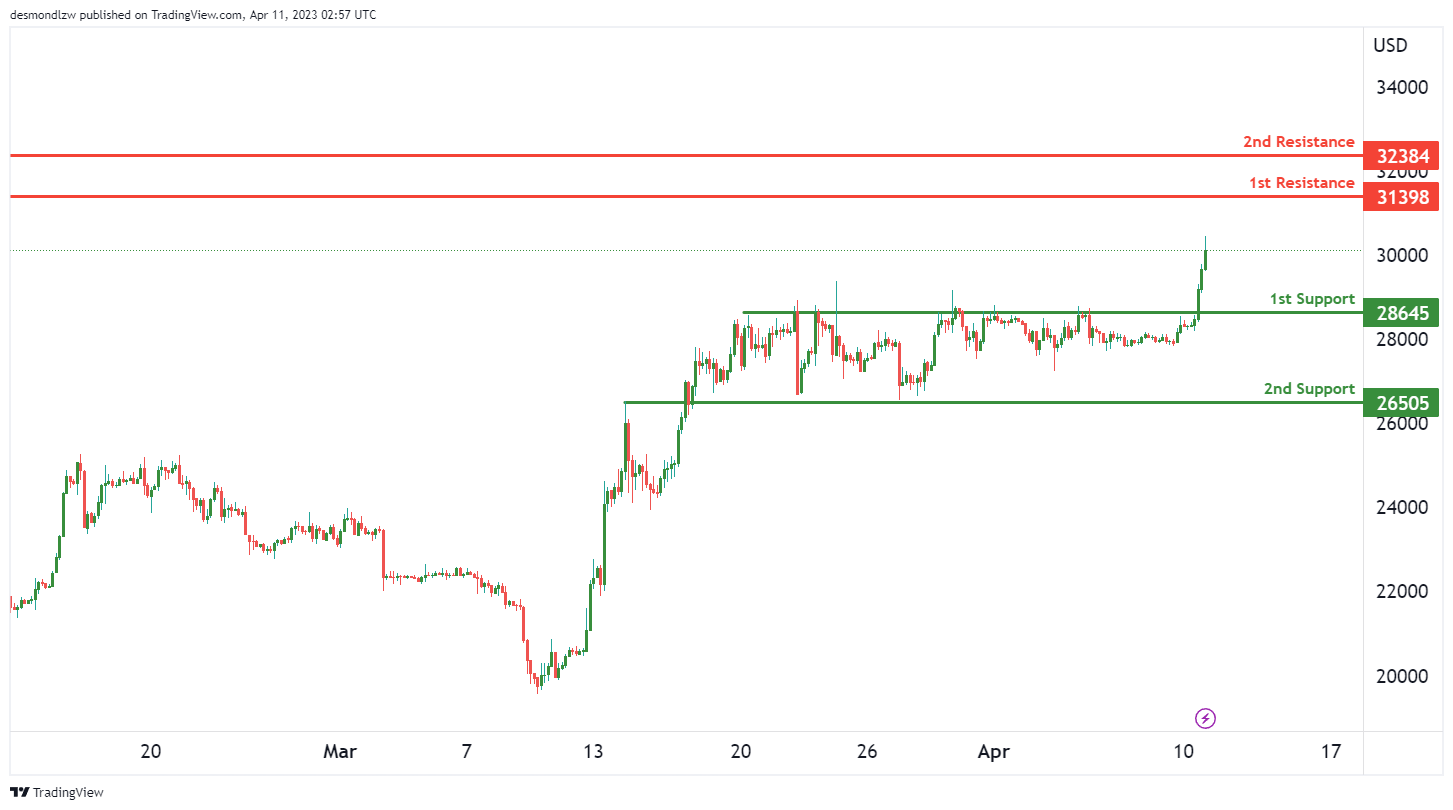
Bitcoin (BTC/USD) is currently displaying bullish momentum, with the potential for a continuation towards its first resistance level.
The first support level is at $28,645, which is a pullback support level. The second support level is at $26,505, which is an overlap support level.
On the other hand, the first resistance level is at $31,398, which is a swing high resistance level. If BTC/USD manages to break through this level, the second resistance level at $32,384 could potentially come into play.
It’s worth noting that BTC/USD has seen a strong bullish momentum in recent times, making the potential for a continuation towards the first resistance level higher. However, it’s important to keep an eye on the support levels as well, in case of a potential pullback.
US500
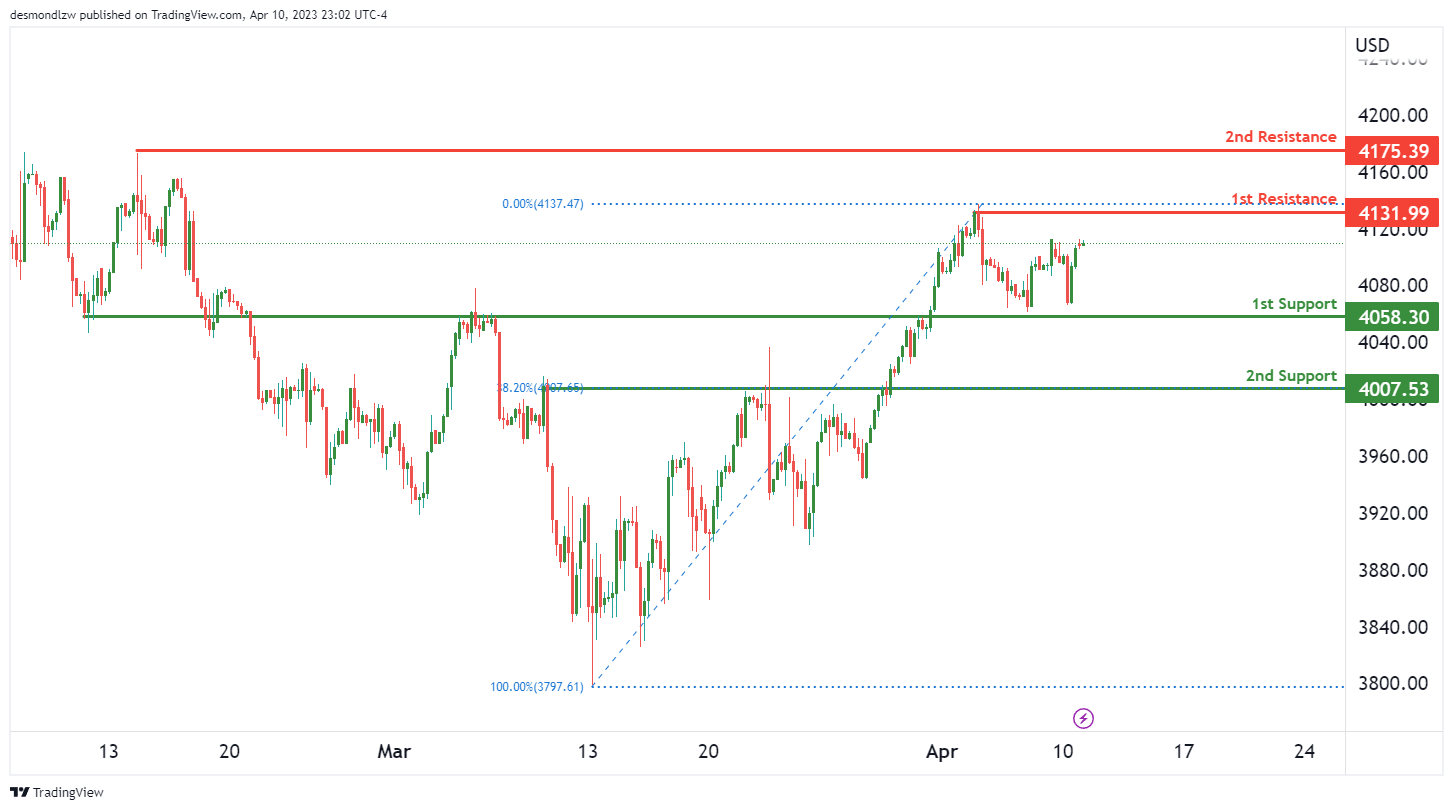
The US500 chart is showing strong bullish momentum, with potential for a bullish continuation towards the 1st resistance level. This bullish sentiment is reflected in the ascending support line and Ichimoku cloud support. Although the chart does not present a clear trend direction, there are several factors that point towards a bullish scenario.
The 1st support level at 4058.30 is a good level to watch for a bounce back up. It is an overlap support, which means it has been tested several times in the past and has proven to be a strong support level. If price were to bounce from this level, it could rise to the 1st resistance at 4131.99. This resistance level is a swing high resistance, which indicates that it has been tested several times and has proven to be a strong level of resistance. Additionally, this resistance level lines up with a 38.2% Fibonacci retracement.
There is also an intermediate support at 4007.53 which is another good level to watch for a bounce. It is a pullback support, which means it lines up with a previous pullback level. If price were to break this intermediate support, it could drop down to the 2nd support at 3905.07. This level is an overlap support and has been tested several times in the past.
On the other hand, if price were to break the 1st resistance, it could potentially rise towards the 2nd resistance level at 4175.39. This is also a swing high resistance and lines up with a 50% Fibonacci projection, which suggests that it could be a significant level to watch for a breakout.
ETH/USD:
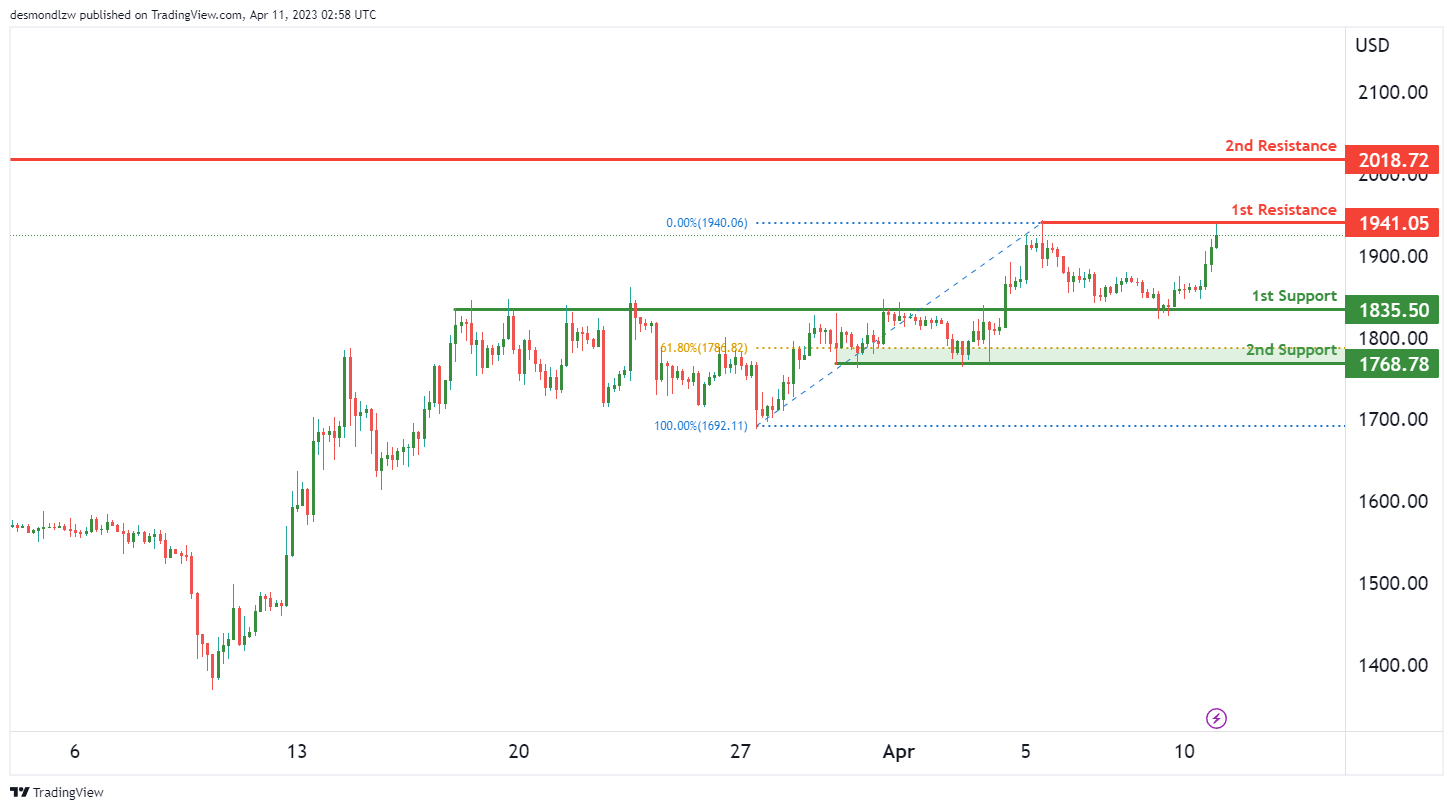
The Ethereum/USD chart is showing a bearish momentum overall. The price could potentially make a bearish reaction off 1st resistance and drop to the 1st support level. The 1st support is at 1835.50, which is an overlap support. The 2nd support at 1768.78 is also an overlap support and a 61.80% Fibonacci retracement level, which makes it a strong support level.
On the other hand, the 1st resistance is at 1941.05, which is a multi-swing high resistance level. If the price manages to break above this level, the 2nd resistance level at 2018.72, a swing high resistance level, could potentially be reached.
WTI/USD:
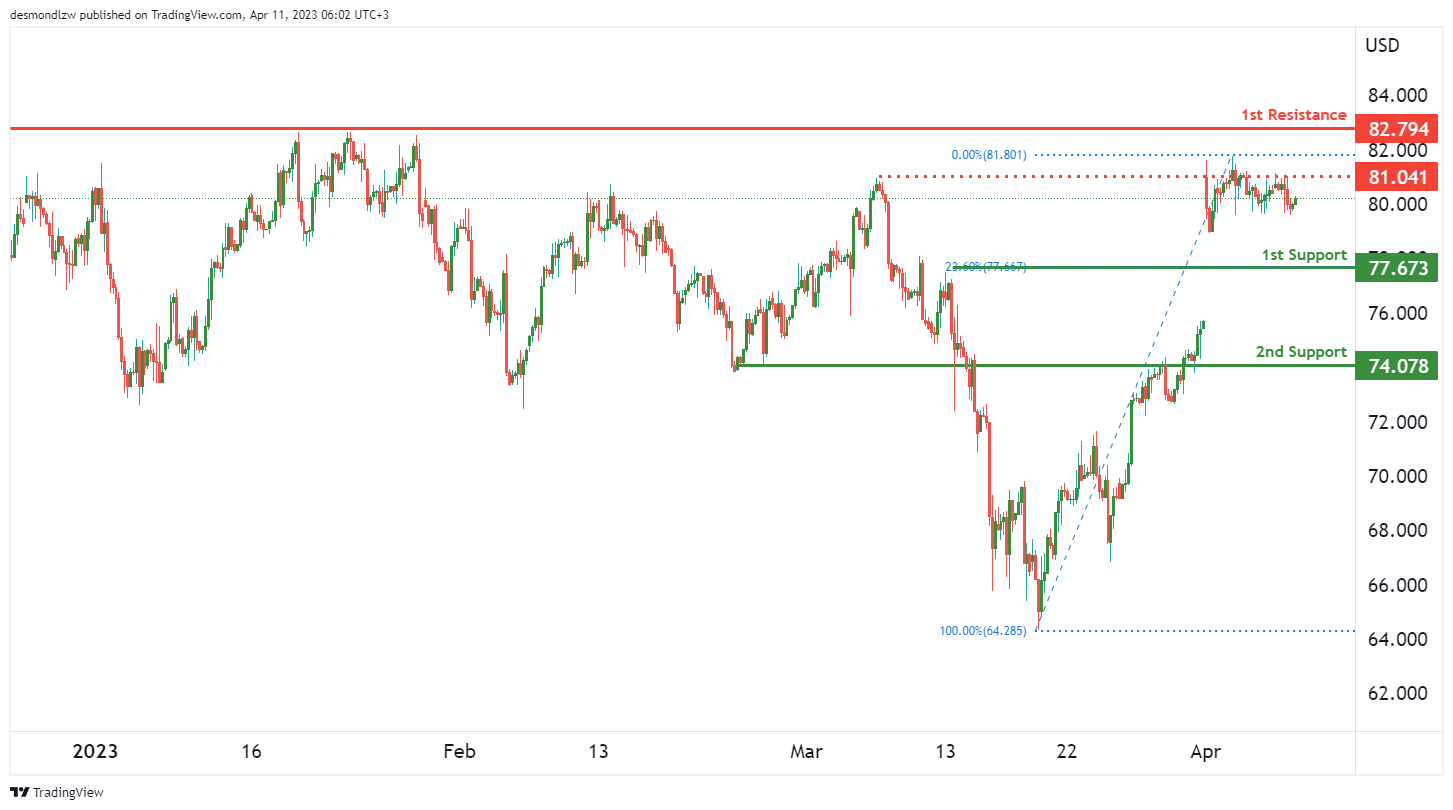
Crude oil prices have been in a bearish trend lately, and the momentum of the chart appears to be bearish. If the bearish move continues, we could potentially see the price of WTI crude oil drop towards the first support level at 77.67. This level is a pullback support and is also at the 23.60% Fibonacci retracement level, which adds to its significance as a support level.
If the price continues to drop, the next support level at 74.07 is also a good level to watch out for. This level is an overlap support, meaning it has held as a support level in the past, making it a good area for buyers to enter the market.
On the other hand, if the price of WTI crude oil starts to rise, it could potentially move towards the first resistance level at 82.79. This level is a multi-swing high resistance, which means it has acted as a barrier to further price increases on multiple occasions in the past.
If the bullish momentum continues, the intermediate resistance level at 81.04 is also a good level to watch out for, as it has held as a swing high resistance in the past.
XAU/USD (GOLD):
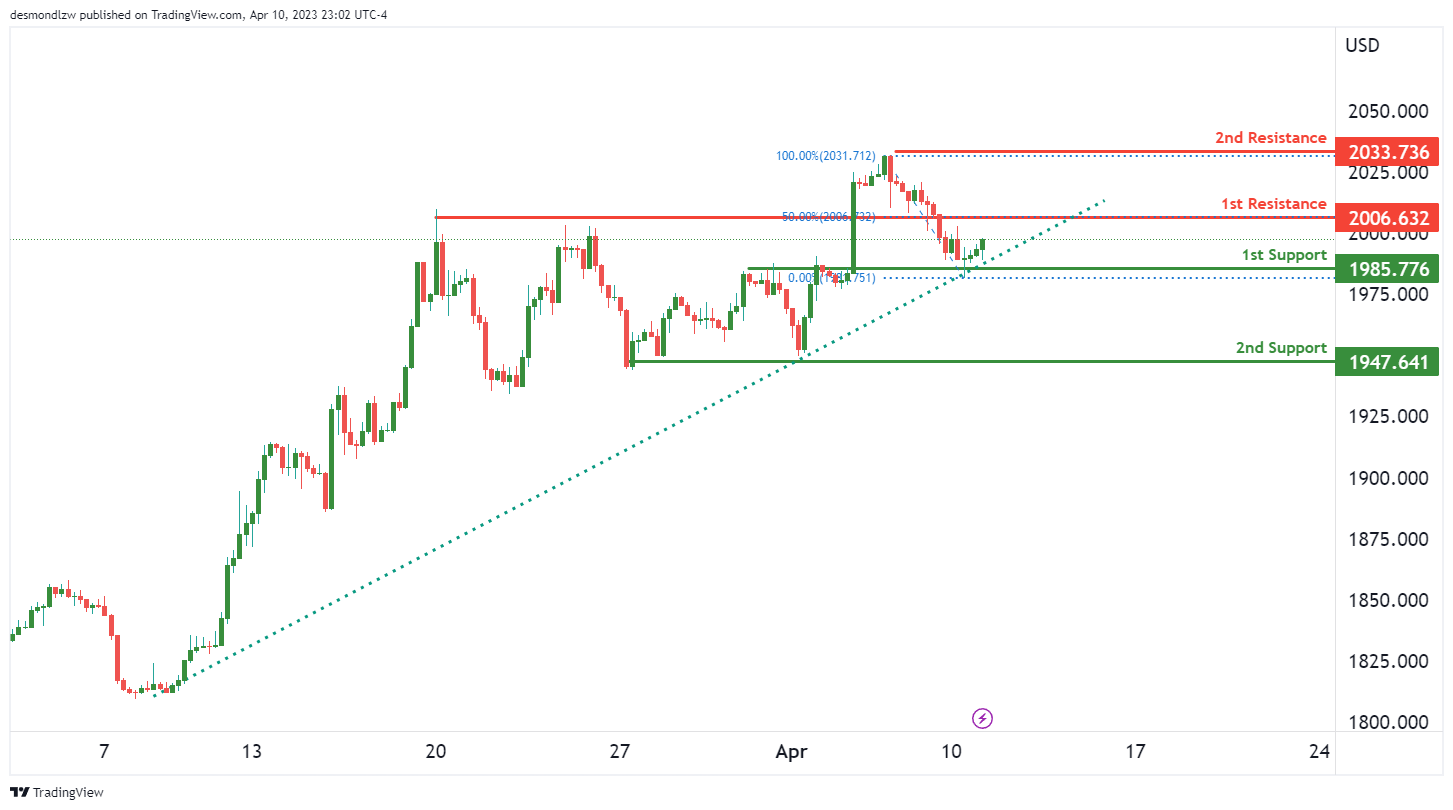
Gold (XAU/USD) has been showing bullish momentum and has been in an uptrend for some time now. The overall momentum of the chart is bullish, with the price currently above a major ascending trend line. This suggests that further bullish momentum is on the cards.
In terms of potential price action, Gold could potentially make a bullish continuation towards the first resistance level at 2006.63. This is a good resistance level as it is an overlap resistance. If the price manages to break above this level, then the next resistance level to watch out for is at 2033.73, which is a swing high resistance.
On the downside, there are two good support levels to keep an eye on. The first support level is at 1985.77, which is an overlap support level and also coincides with the 50% Fibonacci retracement level. The second support level is at 1947.64, which is a multi-swing low support level.
Solid US Jobs Growth Supports May Hike from Fed
Market movers today
Today we zoom in on Nordic inflation with March CPI figures out of Denmark and Norway. In Denmark, we expect a 0.6 percentage point decline to 7.0% driven by base effects from energy prices. In Norway, we expect a 0.2 percentage point increase in core inflation to 6.1% (see more below).
In the euro area, we expect a weak release of February retail sales, as the service sector is currently the strong part of the economy.
Besides the incoming data, markets will digest the US jobs report from Good Friday.
In the remainder of the week, US CPI figures on Wednesday will be key to markets.
The 60 second overview
US: Following a streak of weaker-than-expected macro data last week (ISM, JOLTs, ADP), Good Friday's US nonfarm payrolls were strong enough to lift US Treasury yields over Easter despite coming out slightly below expectations (+236k; consensus 240k; Danske 250k; Feb revised higher by 15k). While other indicators suggest that labour demand is already cooling, and sectors such as retail trade and manufacturing recorded job losses, recovering labour force participation (62.6%; from 62.5%) continues to ease labour shortages especially in the leisure and hospitality sector (+72k jobs), supporting headline jobs growth. Average hourly earnings growth ticked higher to +0.3% m/m (from 0.2%), which means that wage sum growth still exceeds pre-pandemic average levels. The unemployment rate remains very stable around the recent lows at 3.5% (from 3.6%), which NY Fed's Williams called a 'striking development' on Monday. NY Fed's consumers' 1y inflation expectations ticked even higher in March to 4.7% (Feb 4.2%), which together with the resilient labour markets continues to support our base case for one more 25bp Fed hike at the May meeting. US equity markets recovered from an early dip as markets reopened from the long Easter weekend on Monday, with investors now pricing a more than 80% probability for another 25bp hike.
Bank of Japan: JPY weakened yesterday after the new Bank of Japan (BoJ) governor Ueda in an inaugural news conference reiterated that the current ultra-loose monetary policy is appropriate given the economic conditions. The new governor noted that there are "positive developments" around wages and if that continues, there is "enough possibility that this would lead to a more stable 2% inflation". He also added that if the BoJ realises that inflation is above target in a sustainable manner and decides to normalise monetary policy, it will have "to make very big policy adjustments" and it will "cause big disruptions in the economy and markets". Thereby Ueda communicated that any changes to monetary policy will be gradual and with a cautious approach. After Ueda's comments yesterday, it seems likely that the BoJ will keep monetary policy unchanged at the next meeting on 28 April. There is, however, a chance that the BoJ underestimates the current price pressures in Japan, and we still think that the BoJ will at least have to tweak its YCC during Q2.
China's consumer inflation slowed in March despite a pick-up in economic activity, while producer prices contracted further. CPI rose 0.7% from a year earlier (from 1% in February) and PPI dropped 2.5% in March. The figures suggest some weakness in domestic demand and pricing power remains despite the post-Covid reopening.
Equities: Global equities ended higher yesterday as US equities rose into the late hour trading. Europe was closed for the final day of Easter and hence and not surprising to see subdued activity. Limited sector and style rotation as yields were more or less unchanged yesterday and the macro calendar was thin. The factor of fading bond volatility still supports equities. Implied bond volatility (MOVE) peaked on 15 March and since then equities are up by 6%. The MOVE index is still twice the average of the last 10 years and hence it is fair to assume more tailwind to equities through increased confidence if bond volatility continues to come down. In US yesterday Dow +0.3%, S&P 500 +0.1%, Nasdaq -0.03% and Russell 2000 +1.0%. Asian markets are higher this morning lifted by Japan where the new Bank of Japan governor Ueda signalled a continuation of the Kuroda style loose monetary policy. European futures are higher this morning and the same goes for most US indices though we see more marginal increases in the US.
FI: US Treasury yields rose modestly yesterday after the solid rise on Friday following the better than expected non-farm payrolls released on Friday. 2Y US Treasury yields also rose a few bp to 4%. However, we are still far from the 5% level in 2Y Treasuries that we saw prior to problems with some of the US regional banks.
FX: Within G3, USD is the outperformer over Easter holidays, after resilient US job numbers on Friday and where, in particular, USD/JPY gained after the new Bank of Japan governor said yesterday that current policy is appropriate. Scandies lost ground vs EUR in thin liquidity over Easter. Both EUR/SEK and EUR/NOK breached 11.40.
Credit: CDS indices were broadly wider last week heading into the Easter holiday, with iTraxx Main wider by 4bp to 88bp and Xover by 23bp to 459bp. Last week did see a fair amount of issuance with European banks returning in unsecured format again following a long pause caused by concerns over the state of the banking sector. Financial issuance during the week totalled EUR 9.1bn (including EUR 5.3bn in covered bond format), while corporate issuance amounted to EUR 1.4bn.
Nordic macro
We expect Danish March CPI inflation declined to 7.0% from 7.6% in February. Energy prices are likely to be the key driver, with fuel prices slightly lower as opposed to March last year, when prices soared. Generally, we expect to see underlying price pressures in the economy remain elevated.
Norwegian core inflation surprised to the downside in February, with the annual rate slowing to 5.9%. This was due partly to a price war causing food prices to rise much less than feared. The big question, of course, is how much of this will have reversed in March. In addition, Norges Bank's regional survey sent clear signals that firms supplying goods and services to consumers are still planning substantial price increases, which could mean keep inflation high. Thus there is still great uncertainty, but we reckon that the annual rate of core inflation climbed to 6.1% in March.
China CPI slows to 18-month low, PPI sees steepest decline since June 2022
China's CPI slowed from 1.0% yoy to 0.7% yoy in March, falling below the expected 1.0% yoy and marking the lowest level in 18 months since September 2021. Excluding food and energy, CPI increased from 0.6% to 0.7% yoy. Food prices rose by 2.4% yoy compared to a year ago, down from 2.6% yoy in February. Notably, pork prices surged by 9.6% yoy, up from a rise of 3.9% yoy in February.
Dong Lijuan, an NBS statistician, attributed the easing consumer inflation in March to "continued resumption of production and life as well as sufficient market supplies." He also mentioned that the fall in factory-gate prices was affected by a high comparison base in the previous year.
Meanwhile, PPI dropped from -1.4% yoy to -2.5% yoy, matching expectations and marking the steepest decline since June 2022. Dong Lijuan, senior NBS statistician, explained that "production and life continued to recover with sufficient supplies in March."
Australian NAB business confidence improved, conditions remain resilient
Australia NAB Business Confidence improved from -4 to -1 in March, while Business Conditions dropped slightly from 17 to 16. Delving into some details, trading conditions rose from 25 to 26, profitability conditions dipped from 14 to 13, and employment conditions fell from 12 to 10.
NAB Chief Economist Alan Oster commented, "Business conditions have been resilient, slowly edging lower over the past few months but remaining well above their long-run average." He added that "trading conditions are particularly elevated, indicating that businesses continue to experience strong demand, and conditions are generally strong across states and sectors."
On the topic of confidence, Oster stated, "Confidence appears to have stabilized, but it remains below average at -1 index point." He noted that confidence was particularly poor in retail and wholesale sectors, likely due to firms being concerned about the sustainability of consumer spending.
In summary, the survey suggests the Australian economy is still holding up, with some easing in inflation. However, Oster emphasized that "there is still a long way to go to bring inflation back down to the RBA's target band and growth could be more volatile from there."
Australia consumer sentiment jumped 9.4% on RBA pause
Australia Westpac Melbourne Institute Consumer Sentiment Index witnessed a significant 9.4% increase in April, jumping from 78.4 in March to 85.8. This remarkable recovery can be largely attributed to RBA's decision to pause rate hikes during its April meeting, breaking a sequence of ten consecutive meetings with cash rate increases.
However, confidence remains weak, sitting -10.4% lower than April of the previous year, before the tightening cycle began. Respondents continue to exercise caution, with 34.11% still expecting the Standard Variable Rate to rise by more than 1% over the year, although this figure is down from 44.55%.
Regarding the RBA's meeting on May 2, Westpac noted that the central bank would benefit from a clean read on underlying inflation from the March quarter Inflation Report, set to be released on April 26, as well as staff's refreshed economic forecasts. Westpac anticipates that a final 0.25% increase in the cash rate during the May Board meeting would be the best policy approach, rather than waiting for additional information and risking higher rates later in the cycle.