Sample Category Title
GBP/USD Dips But This Support Holds The Key
Key Highlights
- GBP/USD struggled near 1.2525 and corrected lower.
- It traded below a key bullish trend line with support near 1.2400 on the 4-hour chart.
- EUR/USD also corrected lower below the 1.0880 support level.
- Crude oil prices remained elevated and eye more gains.
GBP/USD Technical Analysis
The British Pound gained pace above 1.2400 against the US dollar. GBP/USD even broke the 1.2500 resistance before the bears appeared.
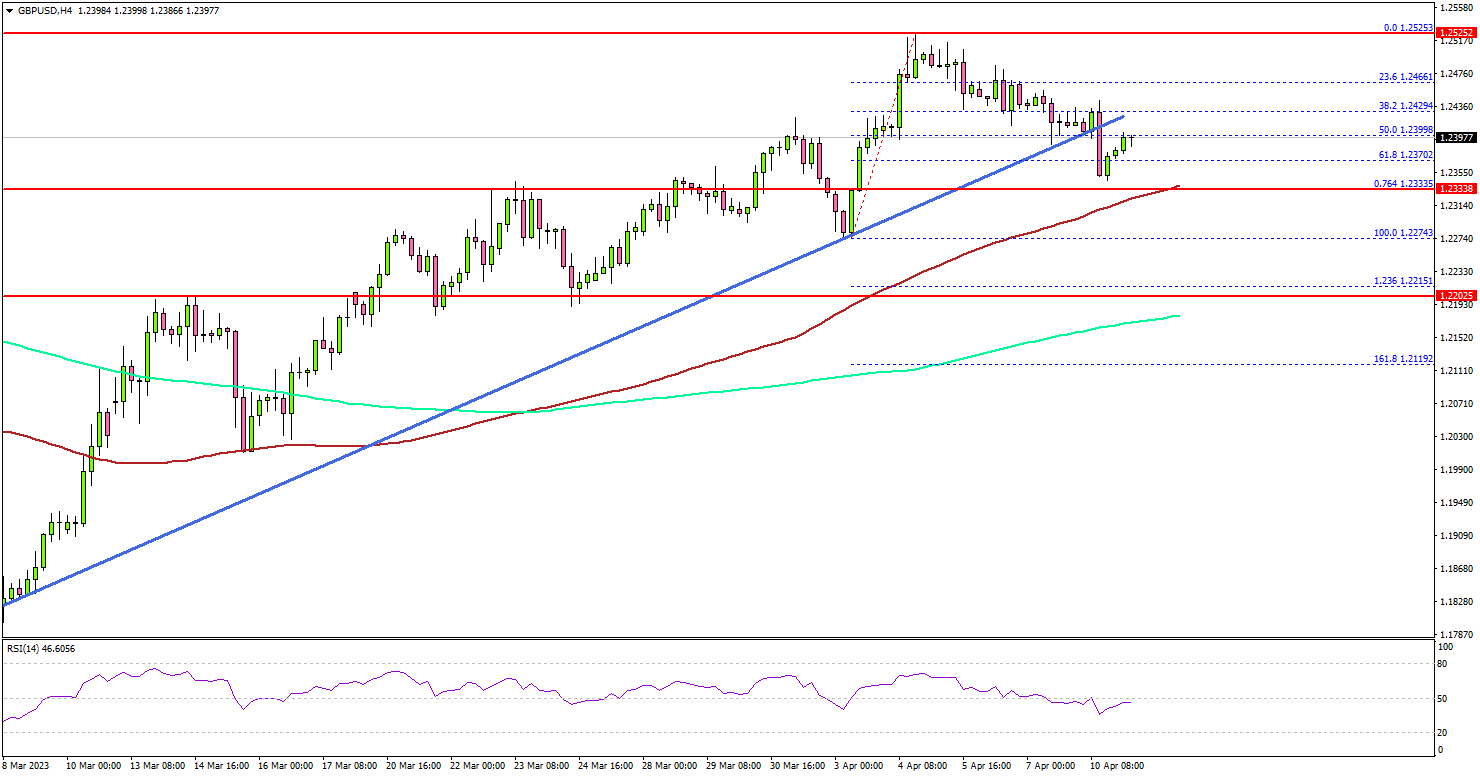
Looking at the 4-hour chart, the pair traded as high as 1.2525 and settled above the 1.0900 resistance, the 100 simple moving average (red, 4 hours), and the 200 simple moving average (green, 4 hours).
Recently, there was a downside correction below the 1.2480 support. The pair traded below a key bullish trend line with support near 1.2400 on the same chart. However, the pair is still above the 1.2320 support and the 100 simple moving average (red, 4 hours).
The next major support is near the 1.2250 level, below which the pair might test the 1.2220 zone. Any more losses might send the pair toward the 1.2150 level.
On the upside, the pair is now facing resistance near the 1.2400 level. The next key resistance is near the 1.2450 zone. A clear move above the 1.2450 resistance might send the pair toward the 1.2525 zone. Any more gains might send the pair toward 1.2620.
Looking at crude oil prices, the bulls were active near the $80 zone and they seem to be aiming for more gains in the near term.
Economic Releases
- Euro Zone Retail Sales for March 2023 (YoY) - Forecast -3.5%, versus -2.3% previous.
- Euro Zone Retail Sales for March 2023 (MoM) - Forecast -0.8%, versus +0.3% previous.
GBPJPY Wave Analysis
- GBPJPY reversed from support level 163.55
- Likely to rise to resistance level 166.00
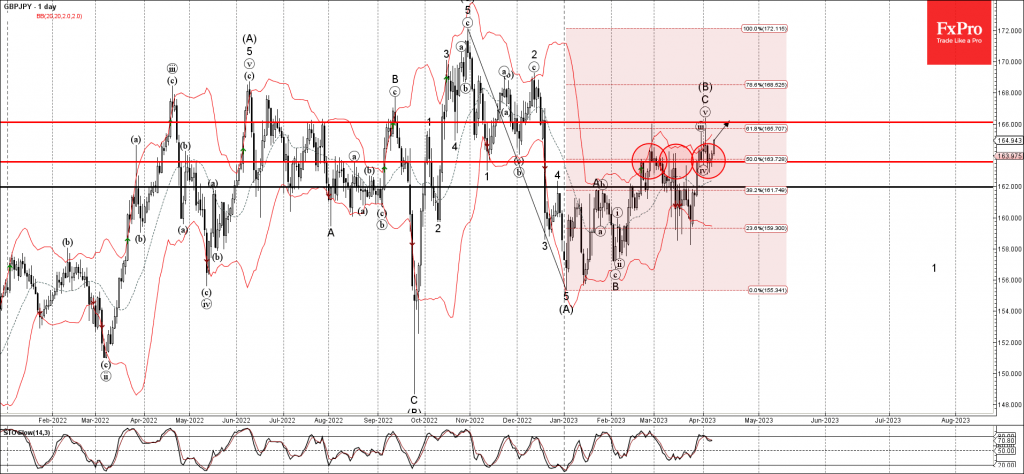
GBPJPY currency pair recently reversed up from the pivotal support level 163.55 (former resistance level which has been reversing the price from the start of March).
The upward reversal from the support level 163.55 runs counter to the active intermediate impulse wave (C) from the start of April.
Given the strong yen sales, GBPJPY can then be expected to rise further toward the next resistance level 166.00 (top of the previous impulse wave C).
FTSE 100 Wave Analysis
- FTSE 100 broke key resistance level 7600.00
- Likely to rise to resistance level 7800.00
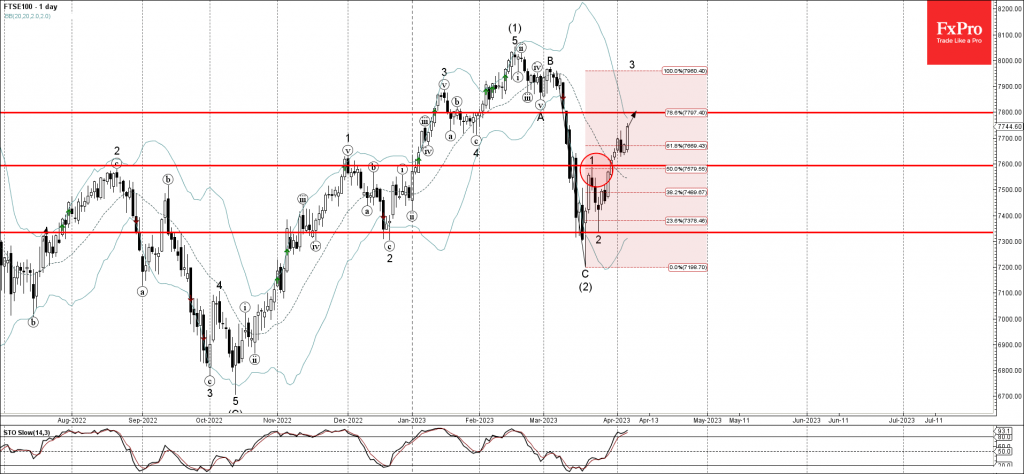
FTSE 100 index recently broke the key resistance level 7600.00 (former top of the impulse wave 1 from the middle of March).
The breakout of the resistance level 7600.00 coincided with the breakout of the 50% Fibonacci correction of the previous sharp downward impulse wave C from the start of last month.
Given the strong daily uptrend, FTSE 100 index can then be expected to rise further toward the next resistance level 7800.00.
NIKKEI: Reaction Lower From Equal Legs Area
Hello Traders, in this article we will see how the NIKKEI ( JAPAN225 ) index has reacted lower from equal legs area. Here at Elliott Wave Forecast we have developed a system that allows us to define areas of the market in which buyers and seller agree to a reaction. These are high frequency areas in which gives us at least an 85% chance of a 3 waves reaction from these areas.
As soon as we can project an equal legs area we present it into our charts and our members know what they can expect. Nikkei has been trading within a 1 hour cycle from 03.15.2023 to complete its ((x)) leg higher. Consequently, having it’s first leg higher and connector within the corrective bounce we have presented the equal legs area. Let’s see the 1 hour update we presented to members from 04.01.2023 weekend update.
NIKKEI 1 hour Weekend update 04.01.2023
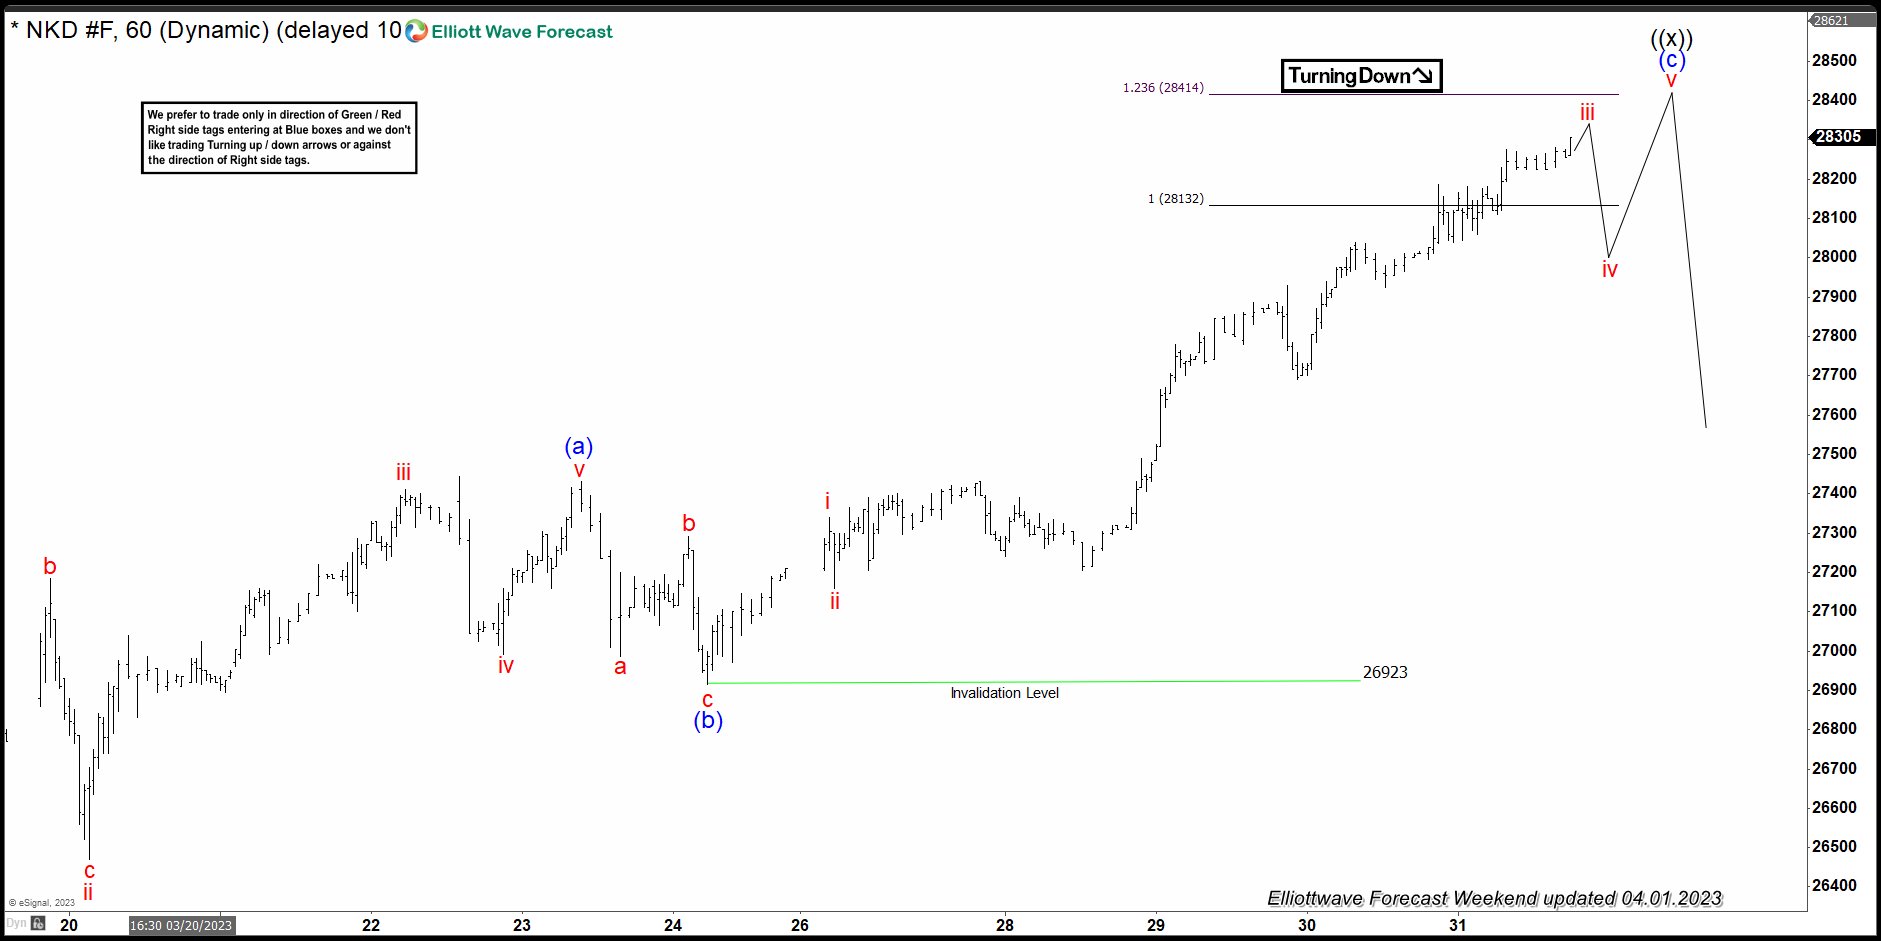
As we can see at that time we were within equal legs area of 28132 – 28414 area in which we were expecting a minimum of 3 waves reaction lower at least. Traders have a defined entry level with a defined Stop Loss at this point. As it is highly important to have a proper risk management system that allows you to enter and exit the market at all times. Next let’s have a look at the aftermath after the update. We will check the latest 1 hour weekend update from 04.08.2023.
NIKKEI 1 Hour Weekend Update 04.08.2023
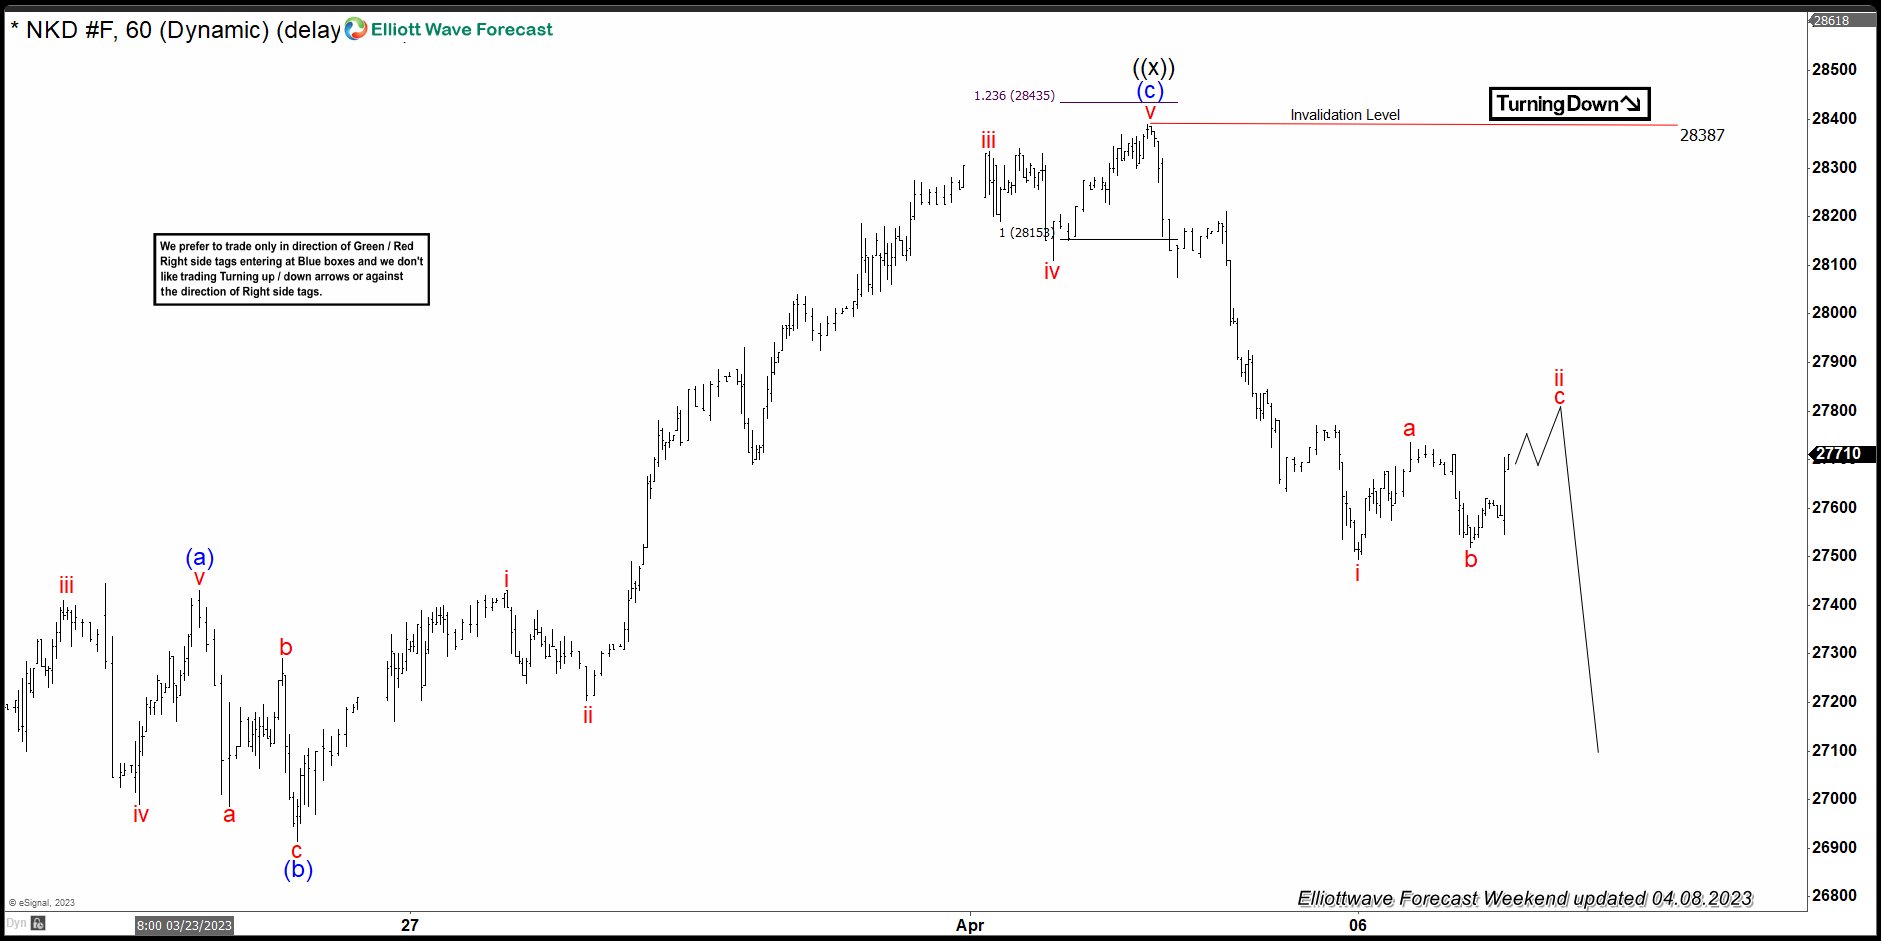
It has reacted lower as expected within wave i. Currently it is bouncing within wave c of ii and expected to fail below 28387 for wave iii lower. NIKKEI belong to our Group 1 instruments amongst other Indices such as the SPX, FTSE, DOW JONES.
GBP/USD: Extended Pullback to Mark a Healthy Correction While Above 20DMA
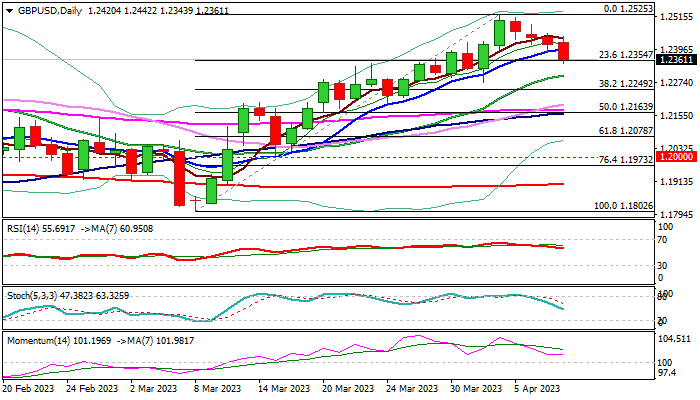
Cable accelerates lower in thin volumes on Monday, extending pullback from 1.2525 top (Apr 4) into fourth straight day.
Drop below initial support provided by 10DMA (1.2395) and extension briefly below 1.2354 (Fibo 23.6% of 1.1802/1.2525) generates initial reversal signal, though close below these levels is needed to confirm signal. Daily RSI and stochastic are in steep descend, along with south-heading 14-d momentum, which is still in the positive territory, supporting fresh weakness.
Next solid support lays at 1.2300 (rising 20DMA) and if dips find ground here, current pullback will be marked as healthy correction, which should provide better levels to join bullish market ahead of fresh push higher. Sustained break of 1.2525 peak to unmask next targets at 1.2659/66 (May 2022 double-top).
Conversely, loss of 20DMA support would weaken near-term structure and risk drop below pivotal support at 1.2249 (Fibo 38.2% of 1.1802/1.2525).
Res: 1.2395; 1.2447; 1.2525; 1.2600.
Sup: 1.2300; 1.2274; 1.2249; 1.2174.
USD/JPY – Yen Slides as Ueda Says No Plans for Policy Shift
BoJ’s Ueda says current policy will continue
Bank of Japan Governor Ueda spoke at his first news conference as head of the central bank today. It wasn’t quite a State of the Union address, but Ueda’s message was clear – the current monetary policy was appropriate and he had no plans to make any major shifts.
There has been strong speculation that Ueda will make some significant moves, perhaps not right away but in the next few months. After years of battling deflation, Japan is facing inflation which has risen above the BoJ’s 2% target. The US/Japan rate differential has been widening as the Fed continues to raise rates while the BoJ has capped yields on 10-year government bonds and interest rates remain negative.
The changing of the guard at the BoJ seemed to some as an opportunity for BOJ policy makers to take some steps toward normalization, such as tweaking or even removing yield curve control. Ueda poured cold water on this sentiment, stating that, “Right now, the yield curve control is considered most appropriate for the economy while tending to market functionality”. Ueda’s message of “stay tuned for more of the same” has lowered expectations of a policy shift at the April 28th meeting and the yen has responded with sharp losses.
Japan’s consumer confidence gave policy makers something to cheer about, rising to 33.9 in March, vs. 33.1 prior and 30.9 anticipated. This was the highest level since May 2022, although consumer confidence remains deep in negative territory, below the 50-level which separates contraction from expansion.
US nonfarm payrolls ease but remain strong
The week ended with a solid US employment report. The economy added 236,000 jobs last month, within expectations and softer than the upwardly revised 326,000 reading in February. The labour market is cooling but has been surprisingly resilient to relentless rate hikes and the odds of a 25-bp rate hike have increased to 68% according to the CME Group, compared to around 50% prior to the employment report release.
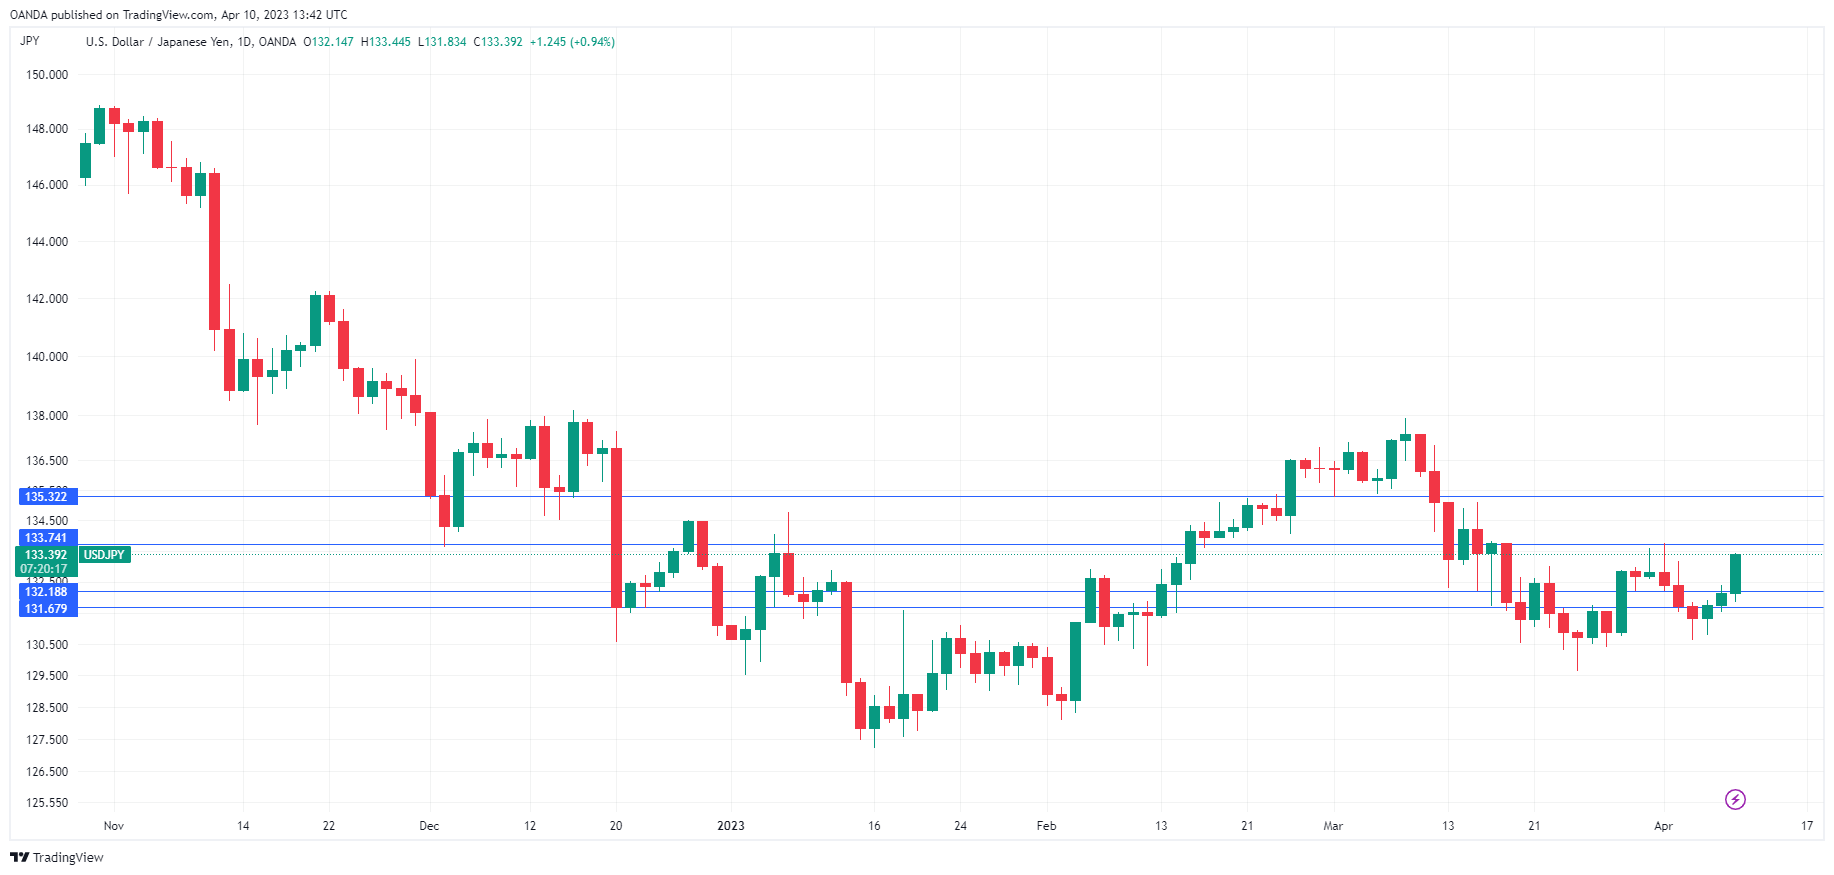
USD/JPY Technical
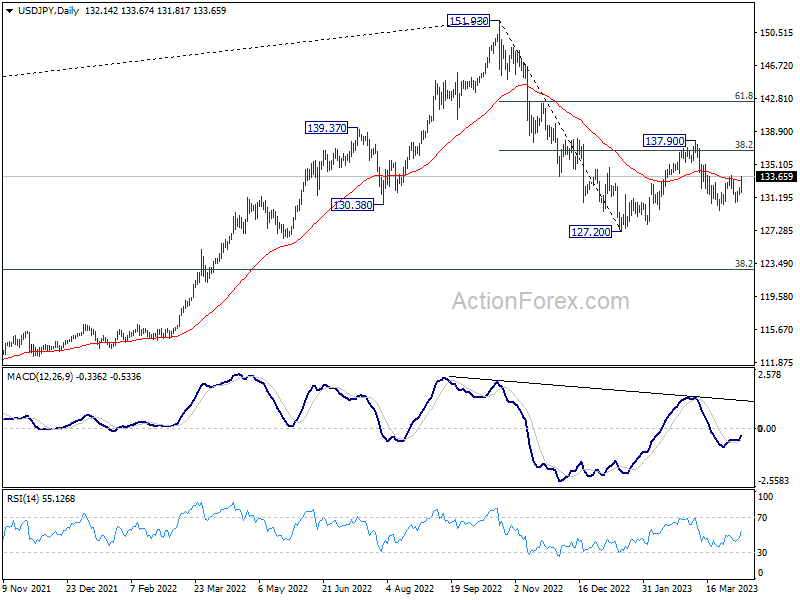
- There is resistance at 133.74 and 135.31
- 132.18 and 131.67 are providing support
EUR/USD: Consolidation Range and Potential Directional Movements
The EUR/USD currency pair is starting the new week of April balanced, hovering around 1.0900. Market activity was slowed down during the Easter holidays in the US and Europe, but investors are gradually returning to trades.
Last Friday, the US labor market statistics were released, and while they came out almost unnoticed, market participants will have a chance to account for the data in the quotes later. The unemployment rate in March saw a decrease to 3.5%, which was better than expected. Nonfarm payrolls (NFP) rose by 236 thousand against the forecasted 228 thousand and 326 thousand previously. The data from February were revised and came out better, which is a positive signal. The average hourly wage also grew by a stable 0.3% m/m.
Although for now, the risk that the economy could slow down has not found any reflection in the employment sector, this margin of safety is unlikely to last long.
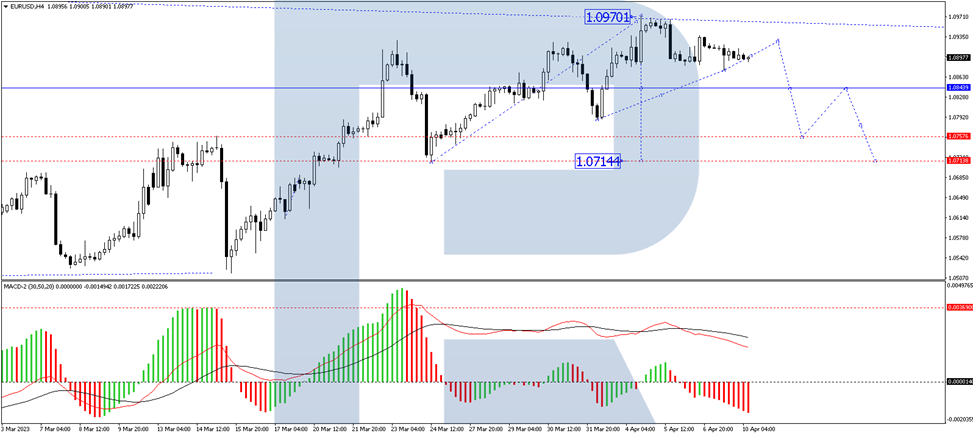
On the H4 chart, the EUR/USD currency pair has performed an impulse of decline to 1.0875. Currently, the market is forming a consolidation range under this level. There is a possibility of growth to 1.0930, followed by a decline to 1.0760, from where the wave could continue to 1.0720. Technically, this scenario is confirmed by the MACD indicator, which shows that its signal line is above the zero mark and directed strictly down to renew the lows.
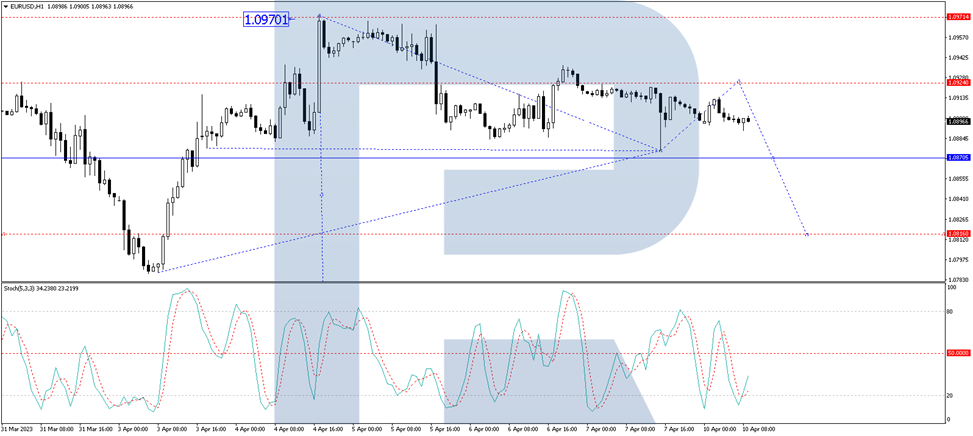
On the H1 chart, the EUR/USD currency pair has completed a structure of the declining wave to 1.0875. At the moment, a consolidation range is forming above this level. The price could break the range upwards and correct to 1.0924. Then, a decline to 1.0820 could follow, with the target being local. This scenario is technically confirmed by the Stochastic oscillator, which shows that its signal line is near 50, expected to grow to 80, and then drop to 20.
EUR/USD Daily Outlook
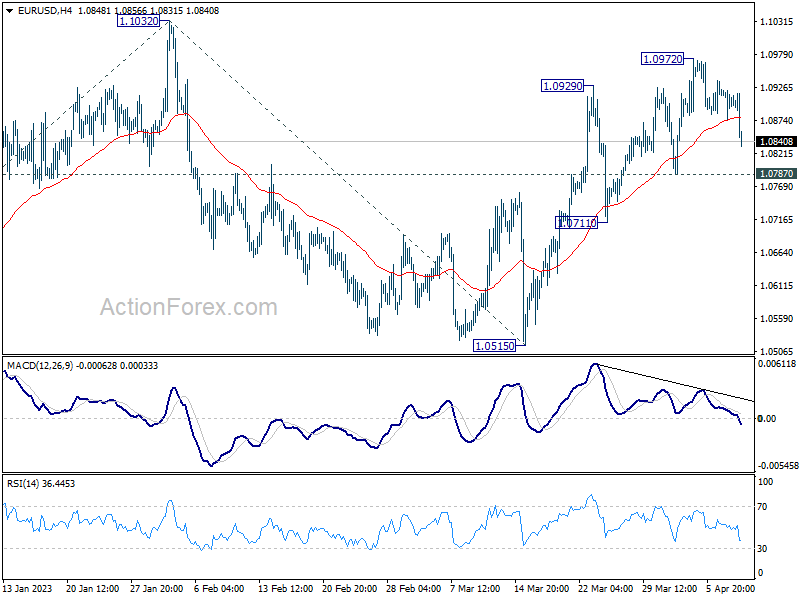
Daily Pivots: (S1) 1.0878; (P) 1.0903; (R1) 1.0930; More...
EUR/USD's retreat from 1.0972 extends lower today but stays well above 1.0787 support. Intraday bias remains neutral and another rise is still expected. Above 1.0972 will resume the rally from 1.0515 to retest 01.1032 high. Firm break there will resume larger up trend from 0.9534. However, break of 1.0787 will turn bias back to the downside for 1.0711 support instead.
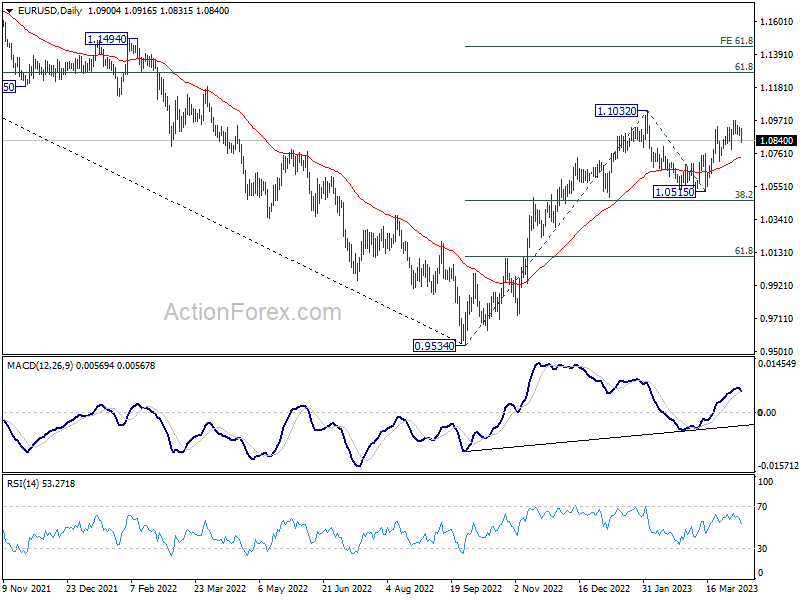
In the bigger picture, rise from 0.9534 (2022 low) is in progress with 38.2% retracement of 0.9534 to 1.1032 at 1.0460 intact. The strong support from 55 week EMA (now at 1.0625) was also a medium term bullish sign. Next target is 61.8% retracement of 1.2348 (2021 high) to 0.9534 at 1.1273. Sustained break there will solidify the case of bullish trend reversal and target 1.2348 resistance next (2021 high).
USD/JPY Daily Outlook
Daily Pivots: (S1) 131.67; (P) 132.02; (R1) 132.51; More...
Intraday bias in USD/JPY stays neutral but focus is now on 133.74 resistance. Firm break there will resume the rebound form 129.62 and target 137.90 resistance again. However, below 130.62 will resume the fall from1 37.90 through 129.62 to retest 127.20 low.
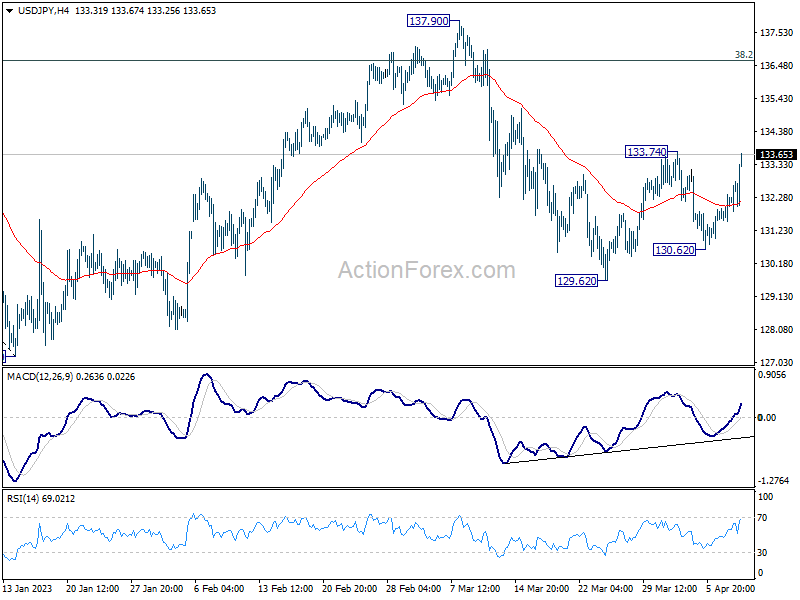
In the bigger picture, corrective pattern from 127.20 might be extending. But after all, down trend from 151.93 is expected to resume at a later stage. Break of 127.20 will resume this down trend and target 61.8% projection of 151.93 to 127.20 from 137.90 at 122.61. This will now be the favored case as long as 137.90 resistance holds.