

Sample Category Title
EUR/USD Aims Fresh Increase While EUR/JPY Eyes More Upsides
EUR/USD is consolidating above the key 1.0880 support zone. EUR/JPY is rising and might rally further if it clears the 145.40 resistance zone.
Important Takeaways for EUR/USD and EUR/JPY
- The Euro started a downside correction from the 1.0970 zone.
- There is a key bearish trend line forming with resistance near 1.0910 on the hourly chart at FXOpen.
- EUR/JPY started a steady increase after it found support near 142.50.
- There is a major bullish trend line forming with support near 144.20 on the hourly chart.
EUR/USD Technical Analysis
On the hourly chart of EUR/USD, the Euro remained well-bid above the 1.0880 zone and started a fresh increase against the US Dollar. EUR/USD was able to break above the 1.0920 resistance level.
The pair tested the 1.0970 zone before it started a correction. There was a break below the 1.0920 level, but the bulls were active near the key 1.0880 support. A low is formed at 1.0876, and the pair is now consolidating.
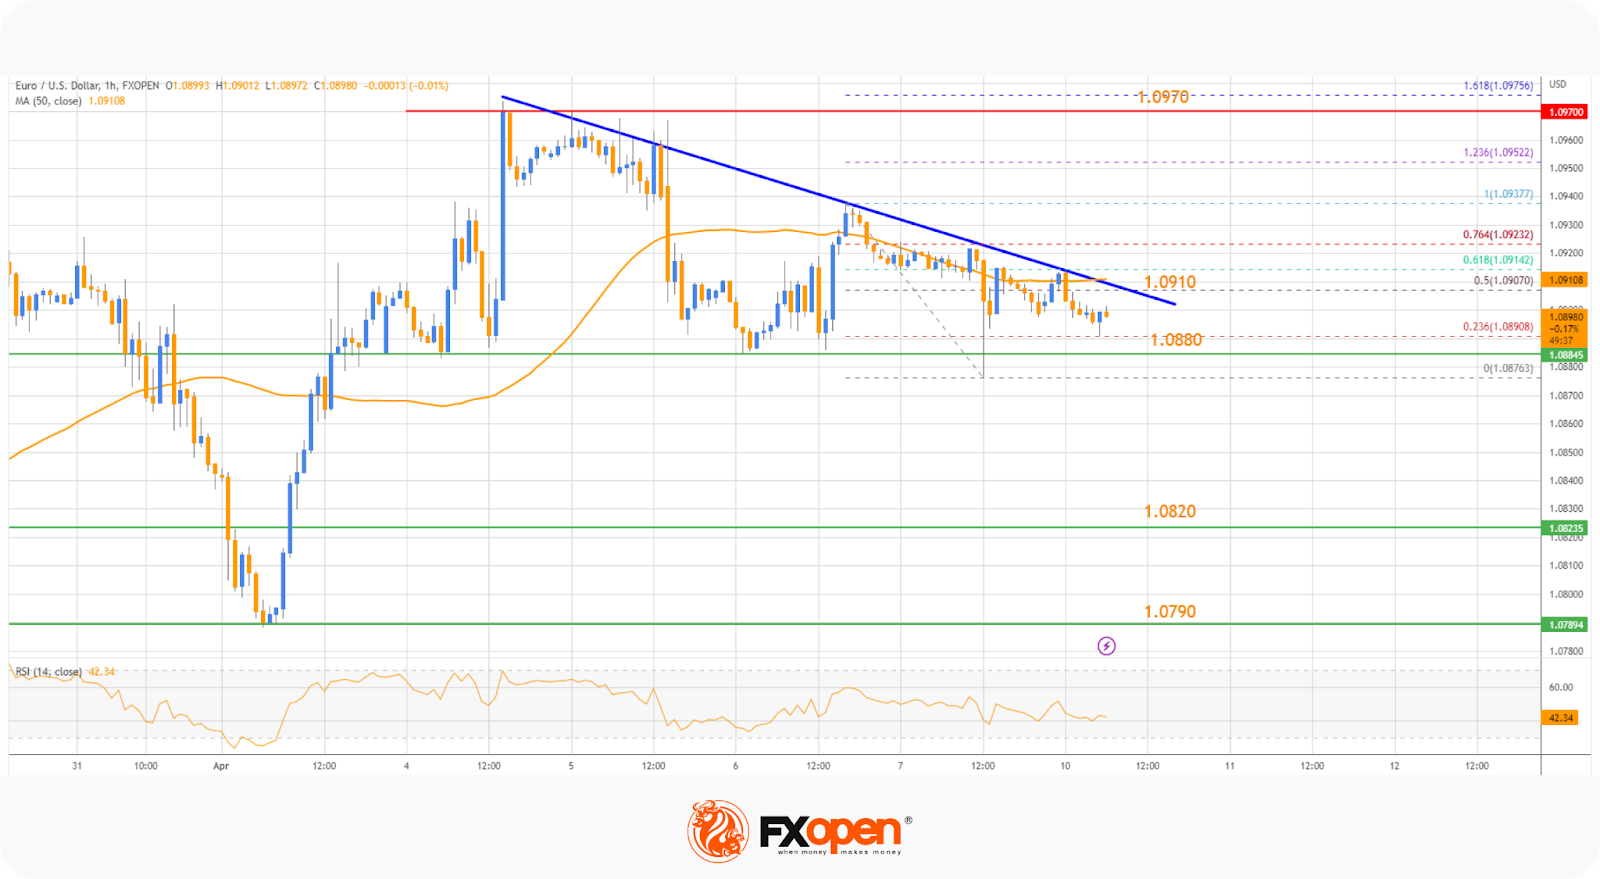
Immediate resistance is near the 1.0910 level. Besides, there is a key bearish trendline forming with resistance near 1.0910. The trendline is close to the 50% Fib retracement level of the downward move from the 1.0937 swing high to the 1.0876 low.
The next major resistance is near the 76.4% Fib retracement level at 1.0925. A clear move above the 1.0925 level might send the pair toward the 1.0970 level. Any more gains could set the pace for a test of 1.1000.
On the downside, the pair might find support near the 1.0880 level. The next major support sits near the 1.0820 level, below which the pair could even test the 1.0790 support zone.
If there is a downside break below the 1.0790 support, the pair might accelerate lower in the coming days. In the stated case, it could even test 1.0720.
EUR/JPY Technical Analysis
On the hourly chart of EUR/JPY, the Euro formed a base above the 142.50 support zone against the Japanese Yen. The EUR/JPY pair started a decent increase above the 142.80 and 143.00 resistance levels.
The bulls were able to push the pair above the 50% Fib retracement level of the downward move from the 145.42 swing high to the 142.54 low. It is now consolidating above the 144.00 level and above the 50-hour simple moving average.
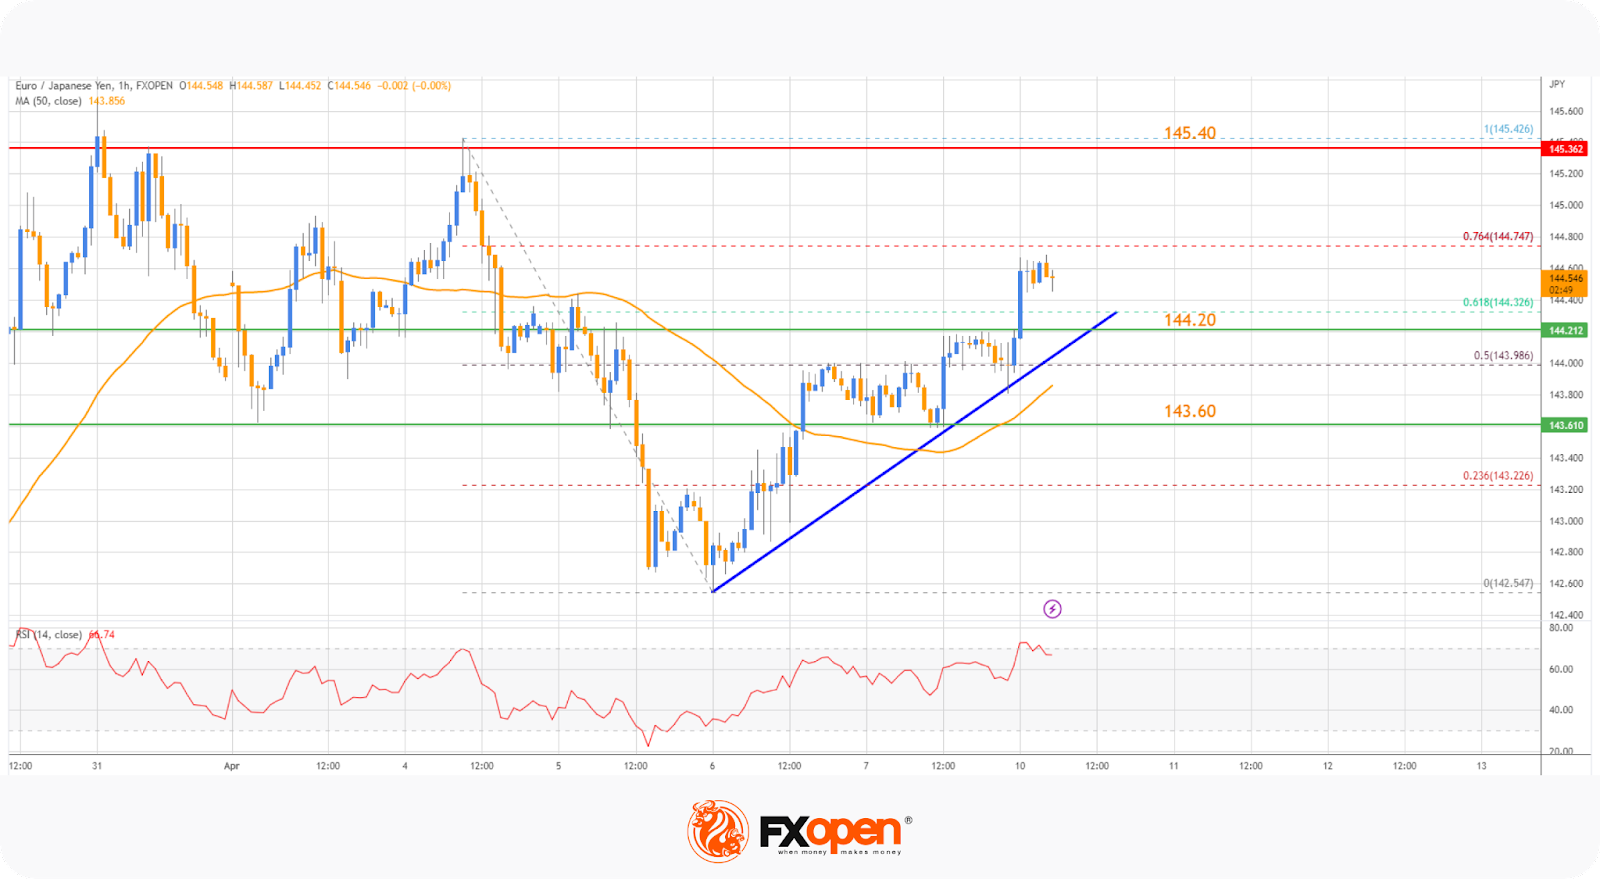
Immediate resistance on the upside is near the 76.4% Fib retracement level of the downward move from the 145.42 swing high to the 142.54 low at 144.75.
The next major resistance could be near the 145.40 level. If there is an upside break above 145.40, the pair could test 146.00. Any more gains might send the pair toward the 146.80 level.
On the downside, the pair might find support near the 144.20 level. Besides, there is a major bullish trendline forming with support near 144.20.
The next major support is near 143.60, below which there is a risk of a larger decline. In the stated case, EUR/JPY might decline toward the 143.00 level. Any more losses could lead the pair toward 142.50 in the near term.
Gold Price Technical Analysis
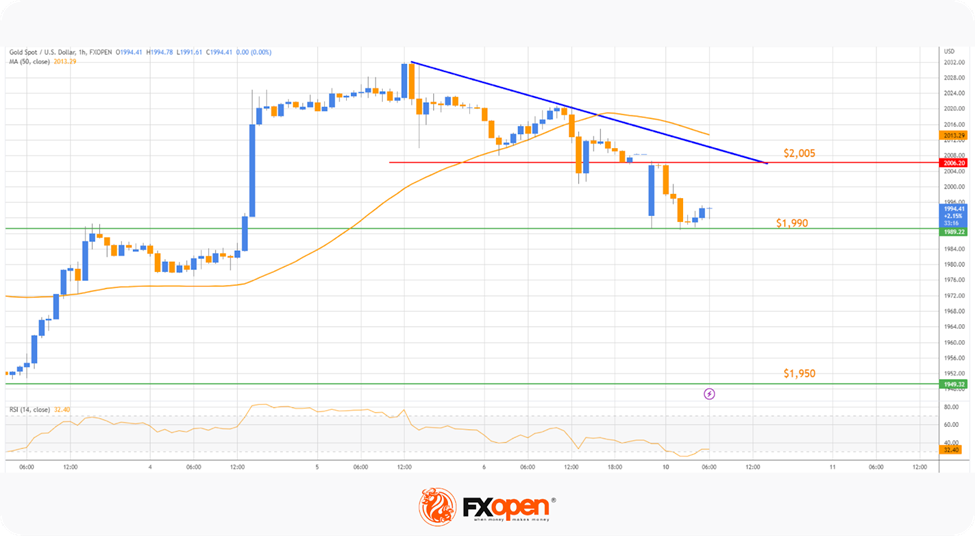
On the hourly chart at FXOpen, Gold price started a downside correction from the $2,030 zone against the US Dollar. The price fell below the $2,015 level to move into a short-term bearish zone.
There was a clear move below the $2,005 level and the 50-hour simple moving average. It is now consolidating losses, with immediate resistance on the upside near a bearish trendline at $2,005.
The next important resistance could be near the 50-hour simple moving average at $2,015, above which the price could extend its rally towards the $2,030 level. Any more gains might send the price toward $2,050.
On the downside, immediate support is near the $1,990 level. The next major support is near the $1,975 level, below which the price might decline toward the $1,950 support level in the near term.
BoC expected to hold steady: Loonie’s fate lies in oil prices and US data
Bank of Canada (BoC) is widely anticipated to maintain its pause this week, leaving interest rates unchanged at a 15-year high of 4.50%. Governor Macklem has emphasized that there's no need for additional rate hikes if the economy unfolds according to central bank's projections, which forecast stalling growth for the rest of the year, subsequently cooling inflation. Macklem also stated that an "accumulation of evidence" would be required before considering resuming tightening.
Consequently, it's unlikely that BoC's announcement on Wednesday or Macklem's speech on Thursday will trigger significant volatility in Canadian Dollar. Instead, Loonie is expected to be more reactive to developments in oil prices, as WTI crude remains stuck around 80 mark. Additionally, the currency could be influenced by US CPI data and the release of FOMC minutes when paired against the greenback.
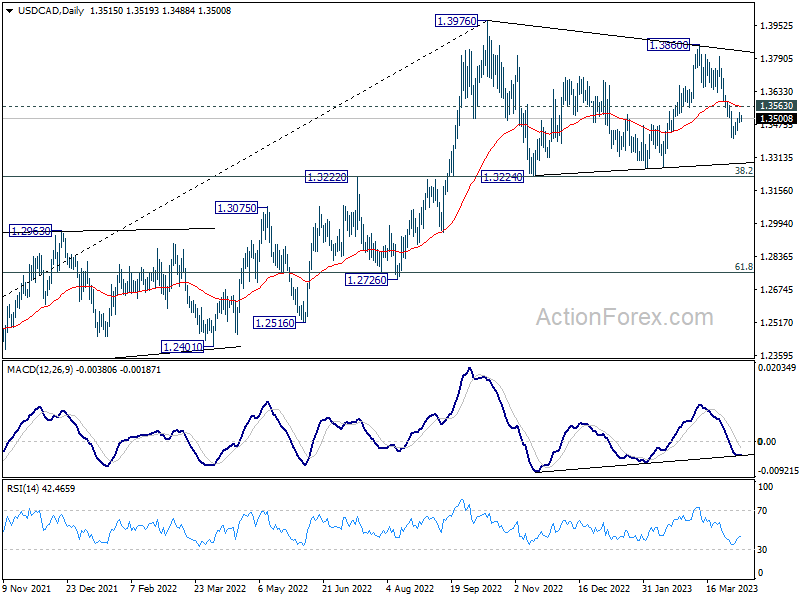
From a technical perspective, USD/CAD appears to be in the third leg of the corrective pattern from 1.3967. Deeper decline is expected as long as 1.3563 minor resistance holds. However, robust support is anticipated around 1.3224, which should contain the downside and complete the pattern. On the other hand, a sustained break of 1.3563 and 55-day EMA (now at 1.3562) would likely result in a stronger rally back towards 1.3860 resistance level. Ultimately, the larger uptrend is envisaged to resume through 1.3976 at a later stage.
Gold Slides Below 2,000 as Bullish Bias Weakens
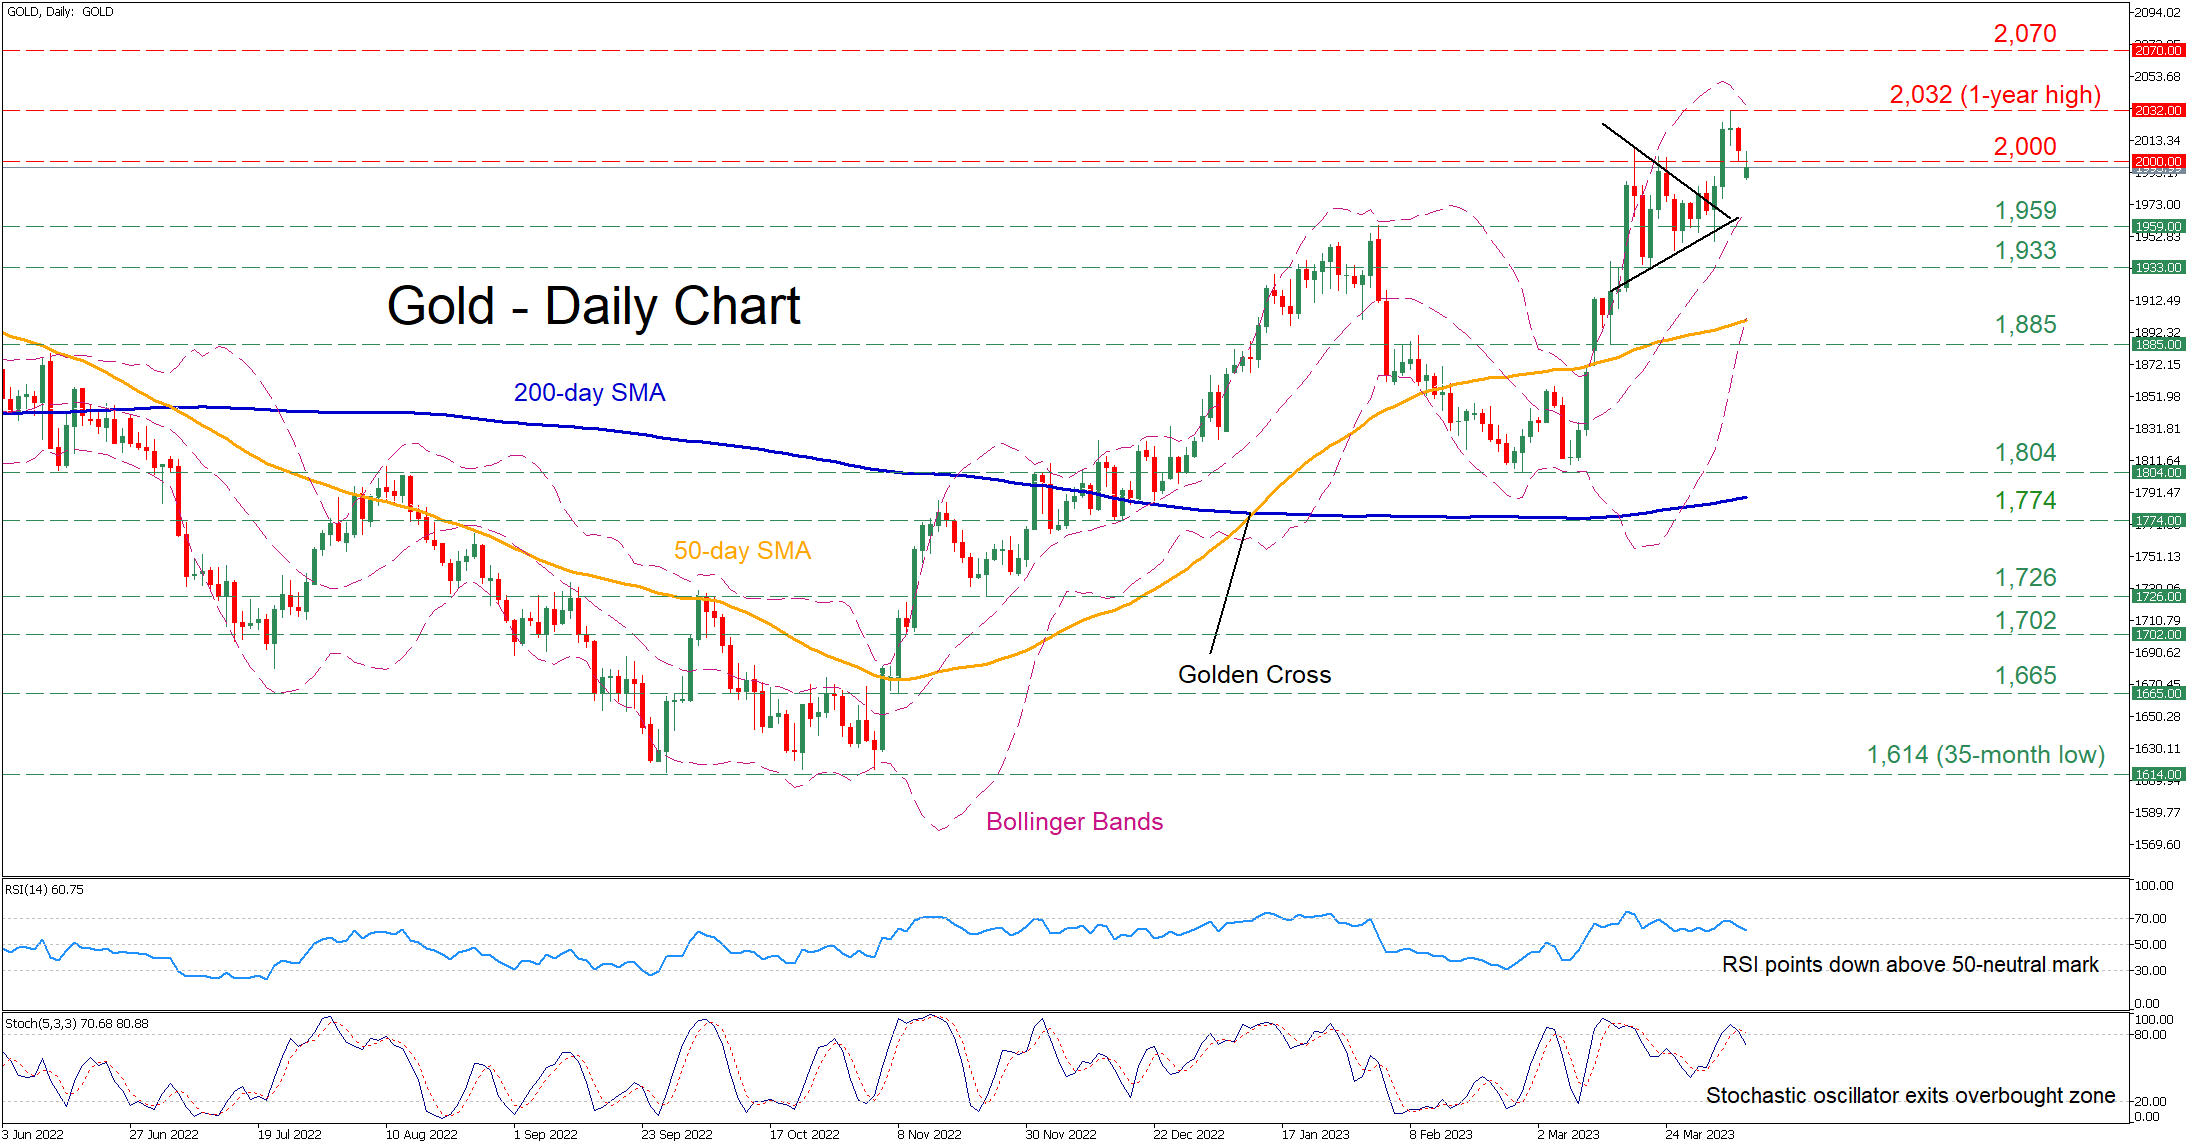
Gold experienced a remarkable surge since early March, breaking above its bullish pennant formation to post a fresh one-year high of 2,032 in the previous week. However, bullion quickly retraced lower and fell back below its 2,000 psychological mark but the bulls have not surrendered yet.
The short-term oscillators currently suggest that the positive momentum is waning, but buyers remain in control. Specifically, the RSI is ticking downwards above its 50-neutral mark, while the stochastic oscillator is retreating after posting a bearish cross in the overbought zone.
If bullish pressures fade completely and the price moves to the downside, the February resistance region of 1,959 could act as initial support. Dipping beneath that zone, gold could descend to challenge 1,933 before the 1,885 hurdle appears on the radar. Should that barricade fail, the 2023 low of 1,804 could provide downside protection.
Alternatively, should gold attract further buying interest, the bulls could attempt to reclaim the 2,000 psychological mark. A break above that crucial level might pave the way for the one-year high of 2,032. Failing to stop there, further advances could cease at the March 2022 high of 2,070 registered after Russia’s invasion of Ukraine.
Overall, gold has been experiencing a downside correction in the past few daily sessions, hinting that its recent advance could be overstretched. This pullback could extend in the case that the 2,000 psychological mark acts as a strong ceiling.
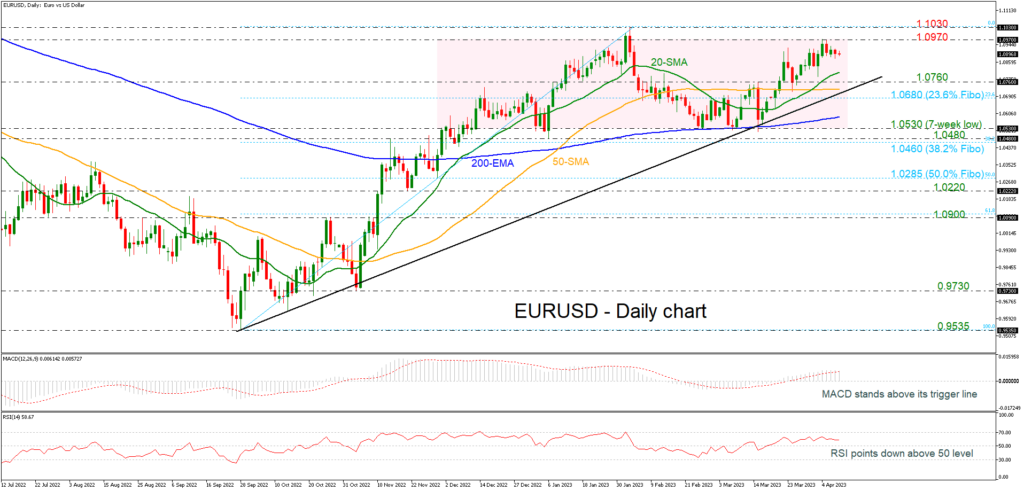
EURUSD Loses Ground Around 1.0900
EURUSD is losing momentum after the climb towards the 1.0970 resistance level, dropping back below the 1.0900 psychological mark. In the medium-term timeframe, the pair is consolidating within a range, with upper boundary 1.0970 and lower boundary the 1.0530 barrier. However, in the longer timeframe, the pair is still bullish as it is holding above the uptrend line, drawn on September 28.
From the technical perspective, the MACD oscillator is holding near its trigger line in the positive region, while the RSI is moving sideways above the neutral threshold of 50.
Should EURUSD make a run higher, it’s likely to meet resistance at the 1.0970 barrier ahead of the crucial 1.1030 resistance, registered on February 2. A successful break above this key area would open the way for the 1.1180, taken from the peak in March 2022.
If prices turn lower, the 20-day simple moving average (SMA) at 1.0808 is the nearest support that could halt steeper declines. A potentially more important support, though, is the 1.0760 inside swing high ahead of the flat 50-day SMA at 1.0720, which stands near the long-term ascending trend line. If breached, it would shift the focus to the downside and prices would slip beneath the 23.6% Fibonacci retracement level of the up leg from 0.9535 to 1.1030 at 1.0680 before slipping towards the 200-day exponential moving average (EMA) at 1.0590, remaining in the neutral zone.
In the bigger picture, EURUSD would need to make a sustained climb above 1.1030 for the outlook to become convincingly bullish.
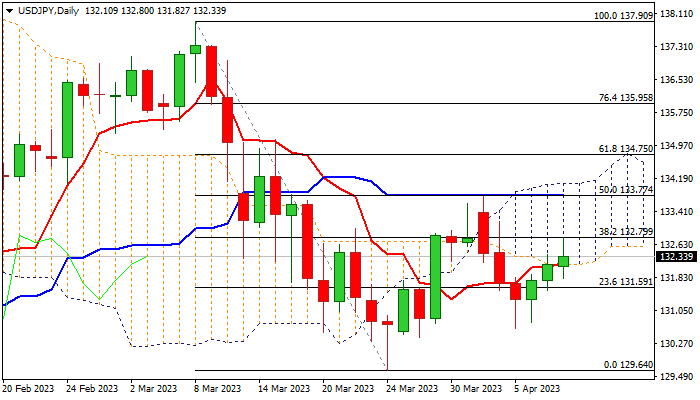
USD/JPY: More Work at the Upside Needed to Strengthen Bullish Structure
The USDJPY keeps positive tone for the third consecutive day, as improved sentiment and solid US jobs data underpin dollar.
Fresh extension in early Monday penetrated thick daily Ichimoku cloud (cloud base lays at 132.15) and cracked pivotal Fibo resistance at 132.79 (38.2% of 137.90/129.64).
Holding above cloud base (reinforced by daily Tenkan-sen) is seen as minimum requirement to keep bulls in play, with extension and close above 132.79 barrier, to open way for further recovery.
Key barriers lay at 133.75/77 (Apr 3 high / 50% retracement of 137.90/129.64 / daily Kijun-sen) and 134.08 (daily cloud top), with sustained break here to generate strong bullish signal (also on completion of bullish failure swing) and expose targets at 134.75/135.11 (Fibo 61.8%/mid-Mar lower platform).
Caution on dip and close below daily cloud base (as bullish momentum is fading on daily chart and sends warning signals) which would signal recovery stall and possible end of three-day recovery.
Res: 132.80; 133.16; 133.77; 134.08.
Sup: 132.15; 131.59; 131.00; 130.62.
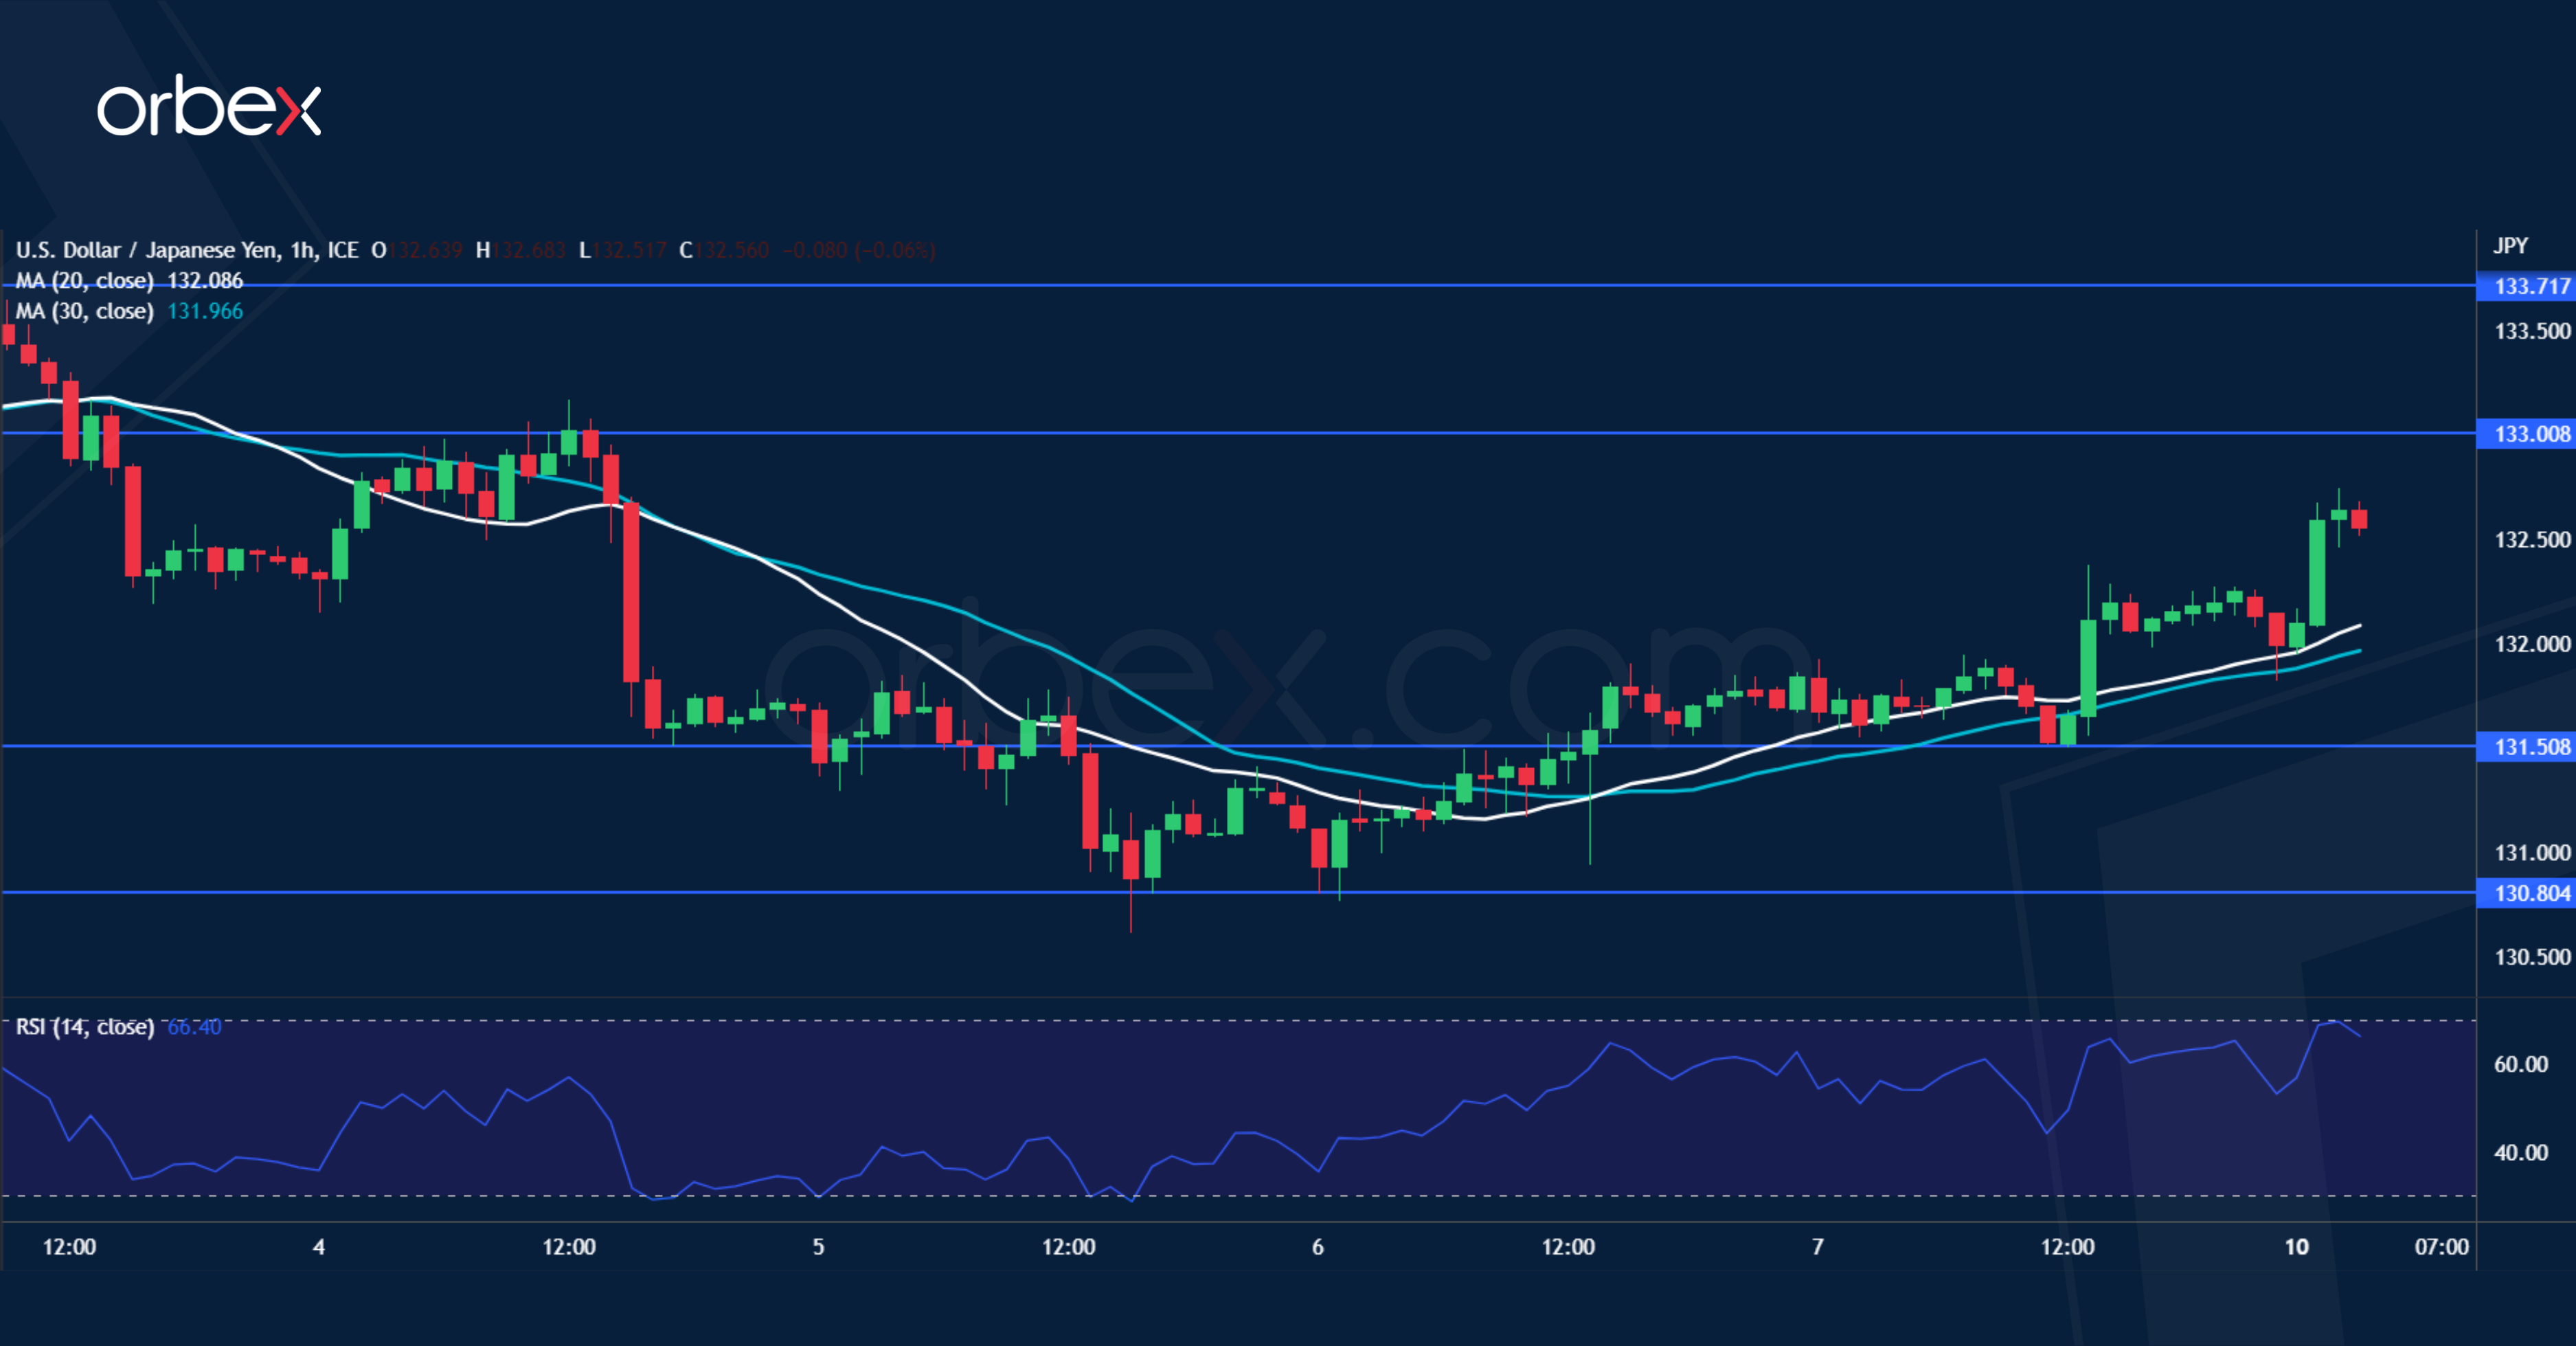
USD Tries to Recoup Losses
USD/JPY attempts to bounce
The US dollar strengthens as March’s jobs data shows solid fundamentals. The price action is at a crossroads on the daily chart, with a bearish MA cross suggesting an acceleration to the downside on the one hand and a tentative bounce off the daily low of 130.00 on the other. A break of this psychological level may cause prolonged weakness. 131.50 is the immediate support on the hourly chart and 133.00 the first hurdle the bulls will need to lift. Only a close above 133.70 would help the greenback recover in a sustainable fashion.
EUR/GBP grinds key support
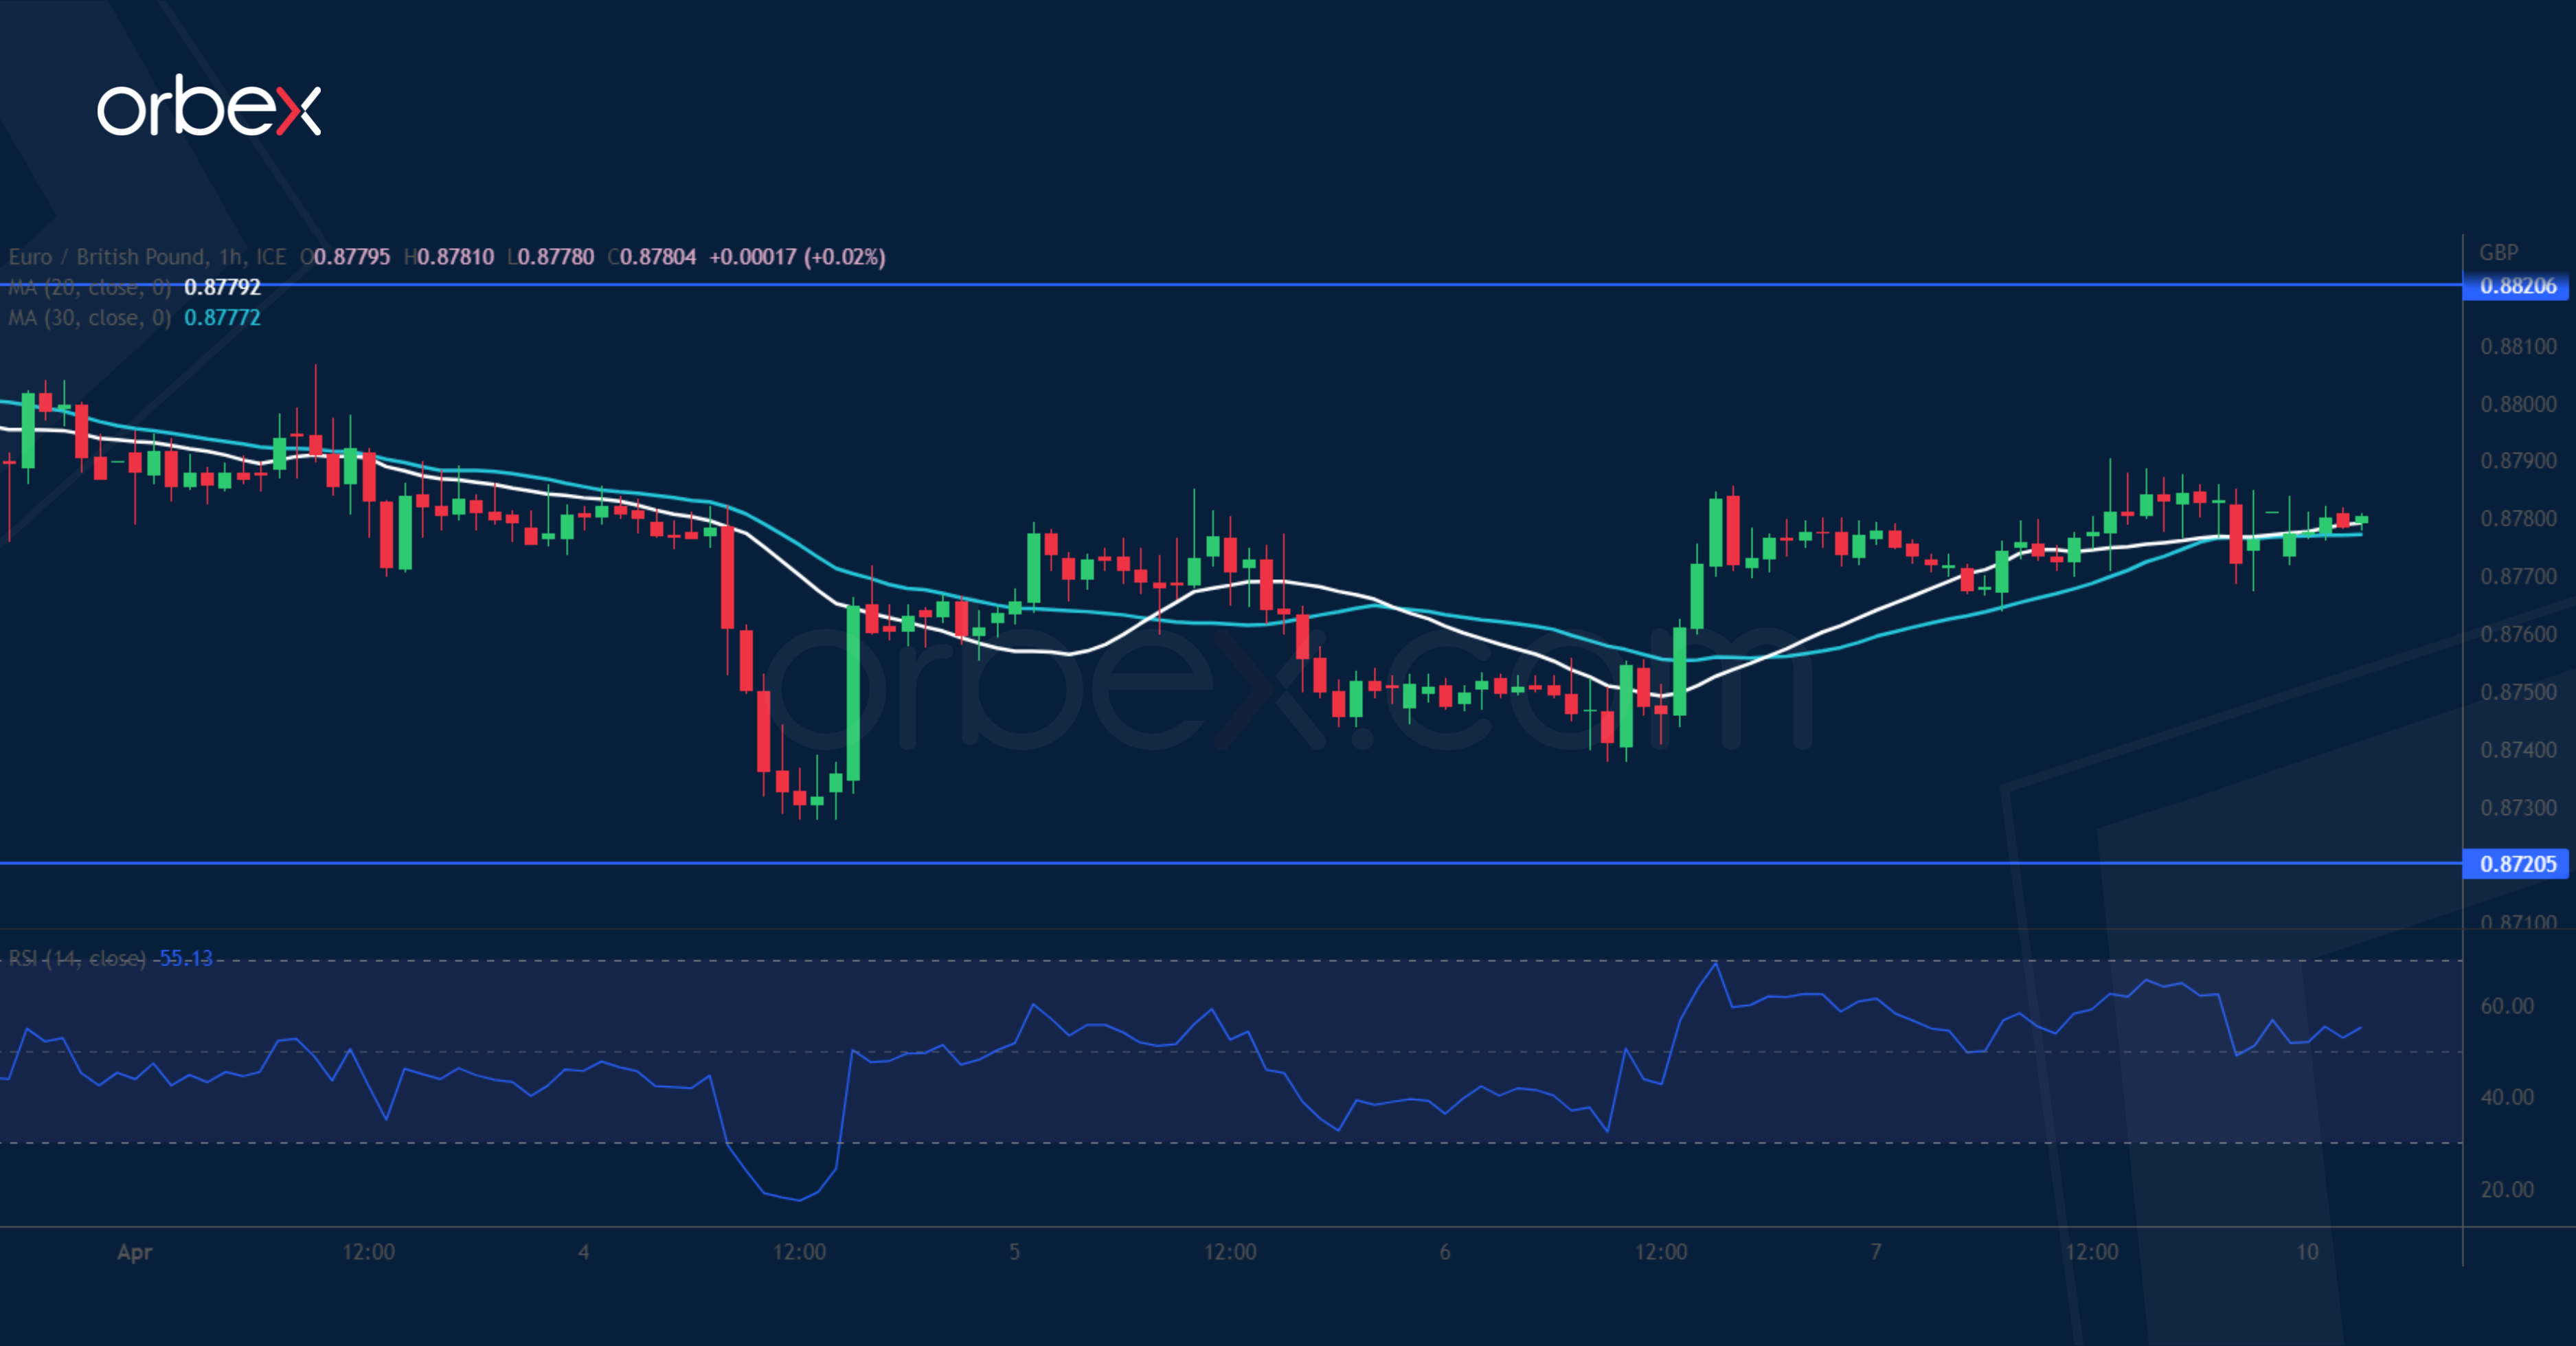
The euro firms up as the ECB’s chief economist calls for further rate increases. Overall sentiment remains cautious as the pair hovers above the double bottom from the January and March lows at 0.8720. The RSI’s oversold situation attracted some bargain hunters but the bulls will need to push past 0.8820 before they could hope for a broader recovery above 0.8860. Otherwise, the path of least resistance would be down and the single currency could be vulnerable to a round of liquidation with buyers scrambling for the exit.
SPX 500 holds on to gains
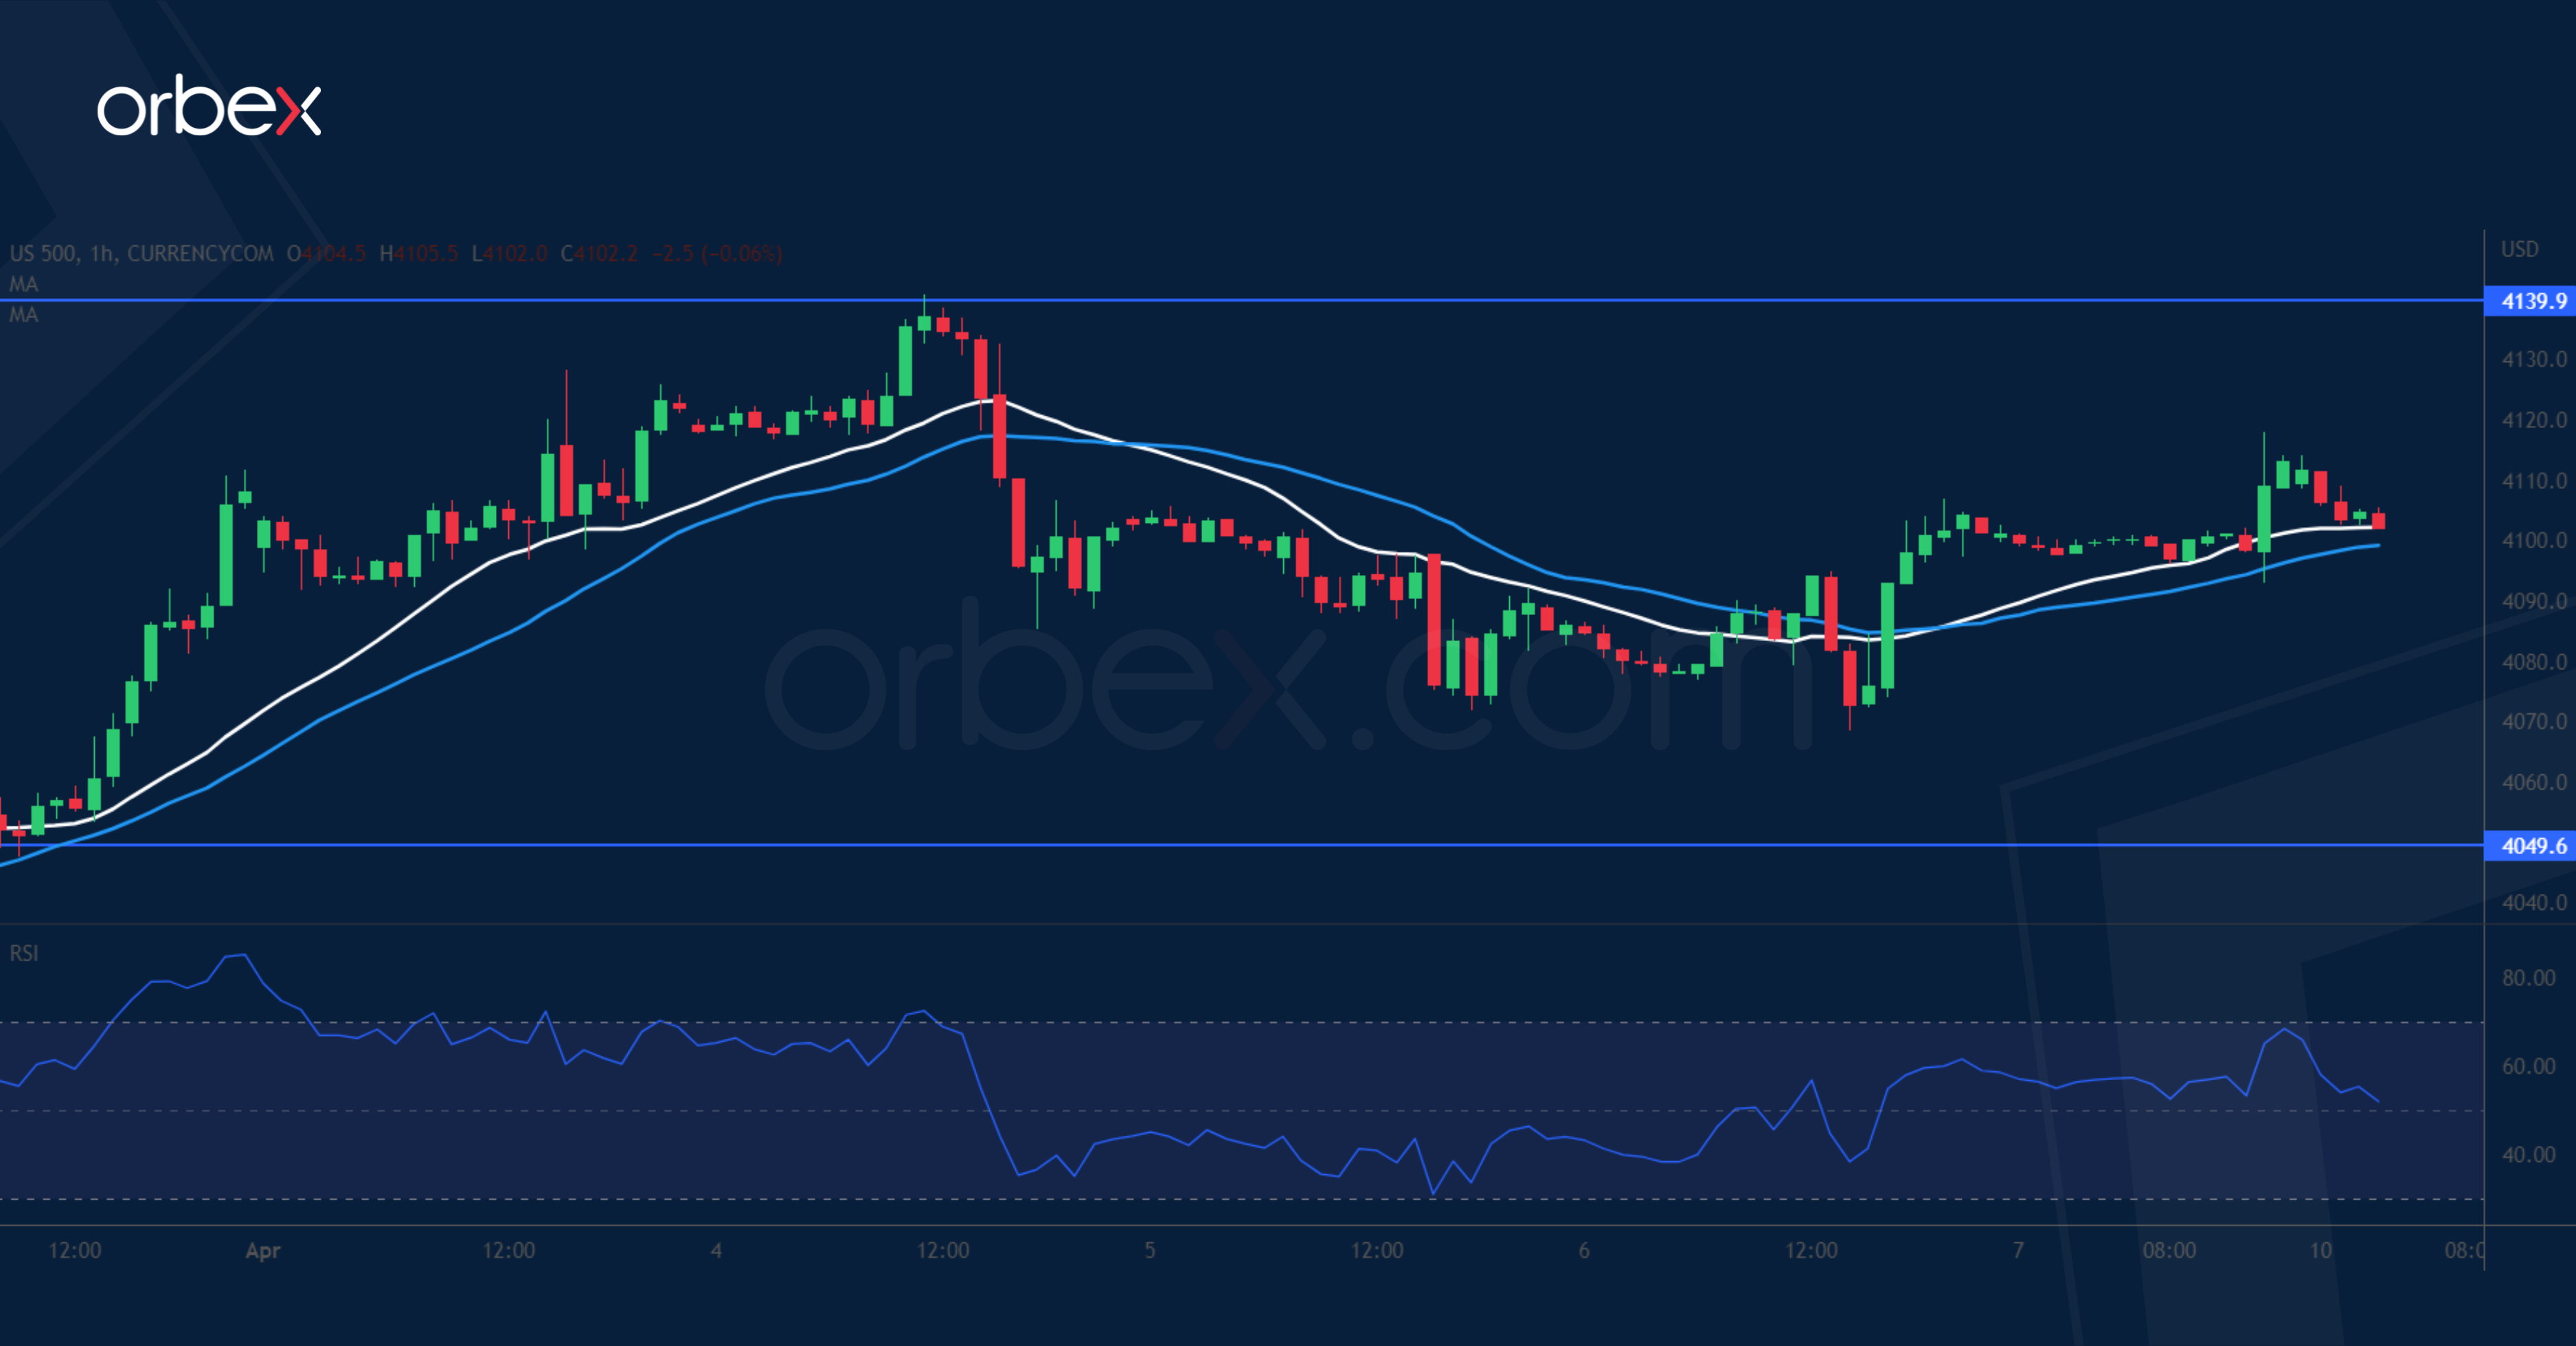
The S&P 500 as the labour market’s cooling may allow the Fed to moderate its stance later this year. A bullish MA cross on the daily chart is a sign of improved sentiment after the index cleared the March high of 4050. The current pullback from 4140 is an opportunity for the bulls to take a breather after the RSI shot into the overbought area. 4050 has turned into a support level. Further down, the psychological level of 4000 at the confluence of the base of the late March breakout rally and the 20-day SMA is a major floor.
Technical Outlook and Review
DXY:
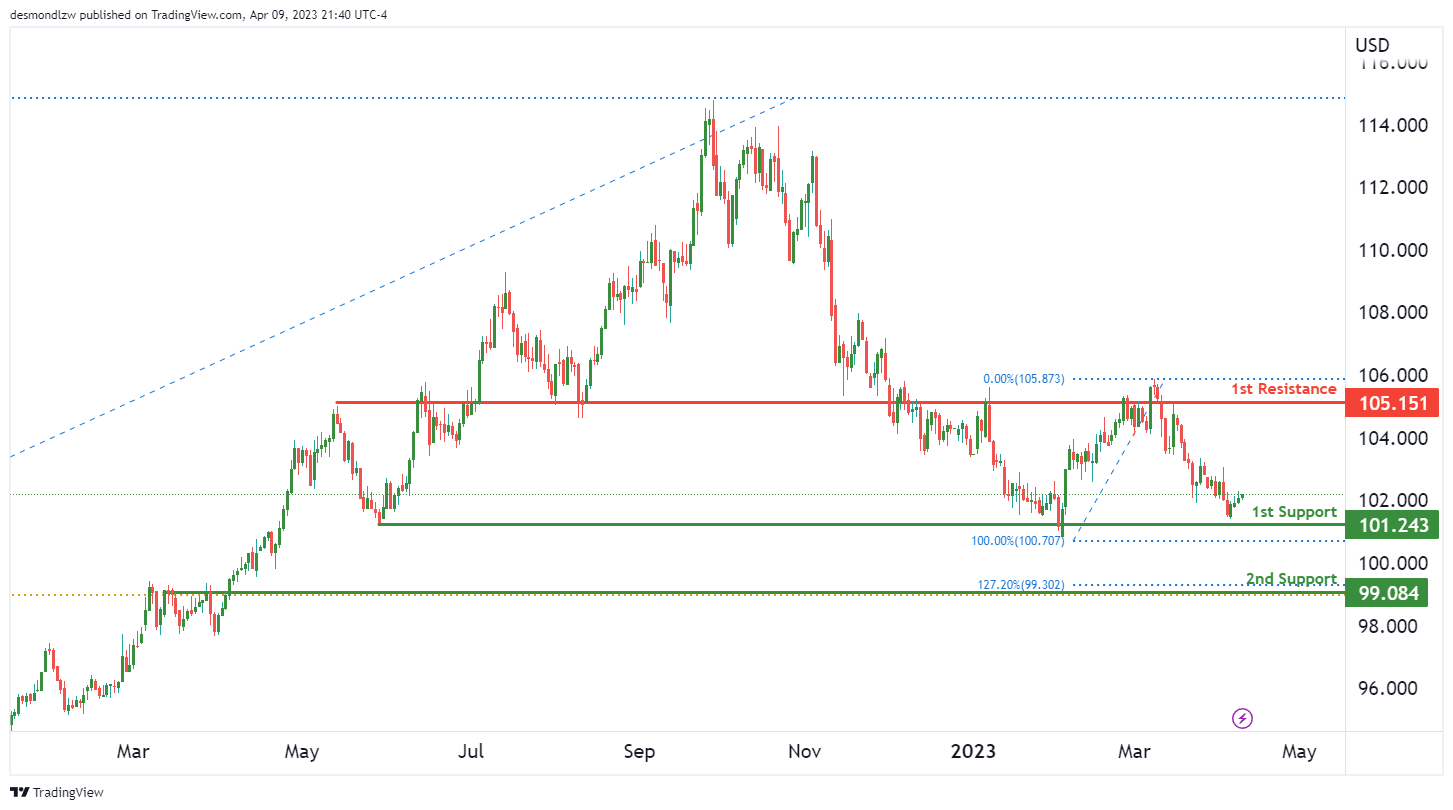
Looking at the DXY chart, the overall momentum of the chart is bullish, indicating a potential for prices to rise in the near future. The first potential scenario for price is a bullish continuation towards the first resistance at 105.15, which is a strong overlap resistance level.
On the support side, the first support level to watch is at 101.24, which is a multi-swing low support level. This level has been tested multiple times in the past and has held strong as a level of support. If price were to drop below the first support, the next support level to watch is at 99.08, which is an overlap support level. This level has also held as a level of support in the past.
On the resistance side, the first resistance level to watch is at 105.15, which is a strong overlap resistance level. This level has been tested multiple times in the past and has held as a level of resistance. If price were to break above the first resistance, the next level to watch is the second resistance level at 107.50, which is a swing high resistance level.
EUR/USD:
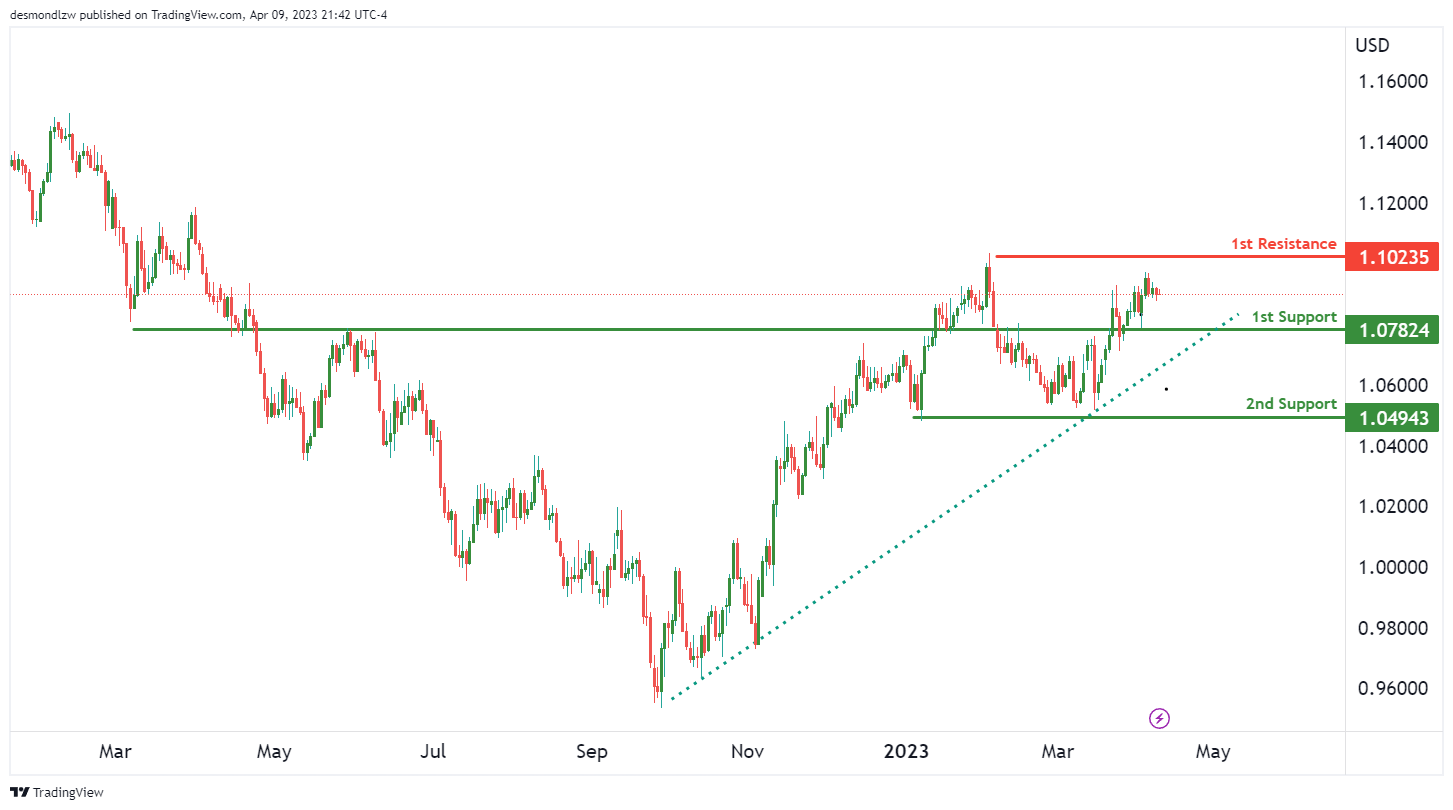
Looking at the EUR/USD chart, the overall momentum is currently neutral. However, it’s worth noting that the price is above a major ascending trend line, which suggests that there may be further bullish momentum on the cards.
In terms of potential price movements, price could fluctuate between the 1st resistance and 1st support levels.
The 1st support level is at 1.0782 and is an overlap support level. This level has been tested multiple times in the past, making it a strong support level.
The 2nd support level is at 1.0494 and is a multi-swing low support level. This level has also been tested multiple times in the past, making it another strong support level to watch out for.
On the resistance side, the 1st resistance level is at 1.1024 and is an overlap resistance level. This level has also been tested multiple times in the past, making it a strong resistance level.
GBP/USD:
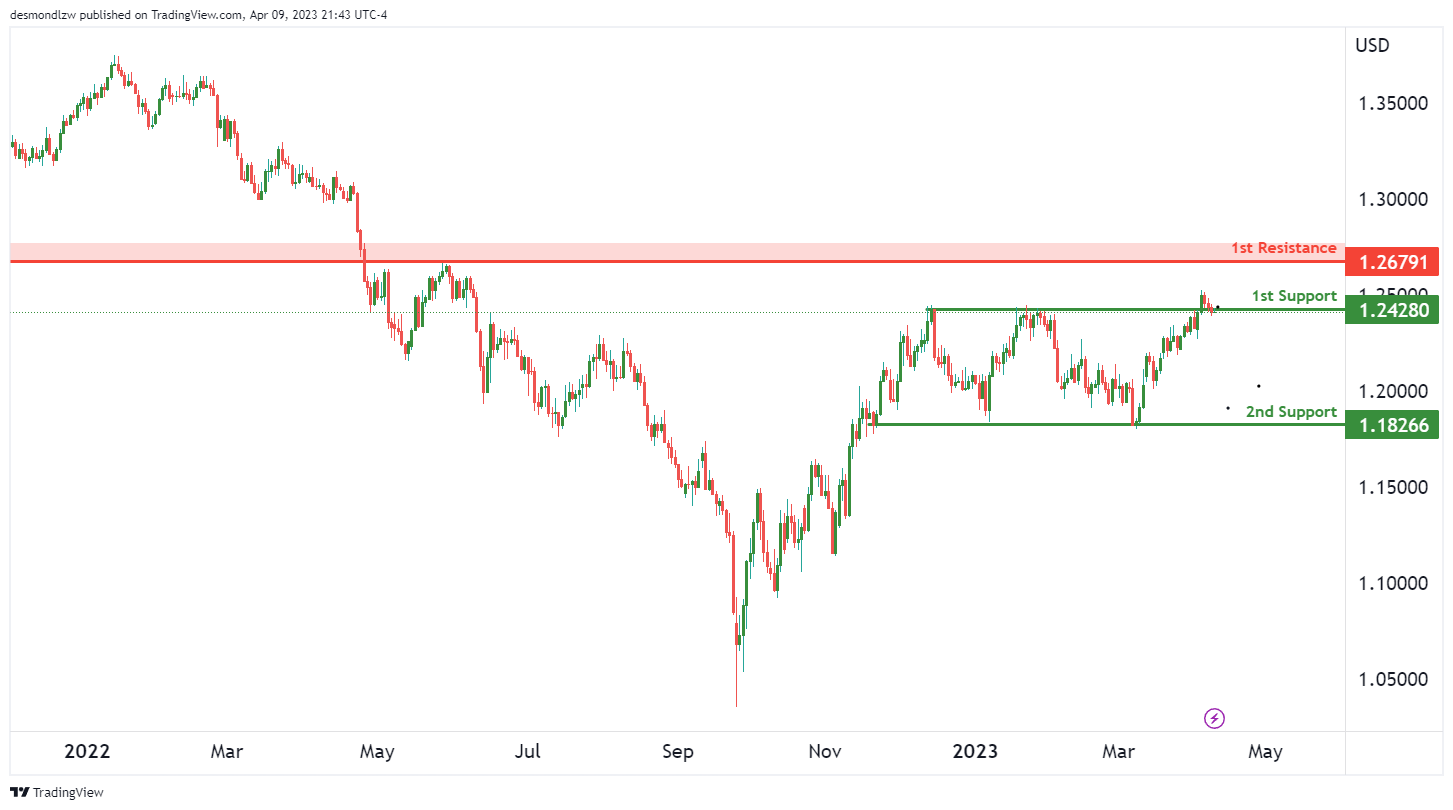
Looking at the chart for GBP/USD, the overall momentum is bullish. Price has the potential to continue its bullish momentum towards the first resistance level of 1.2679.
The first support level to watch is at 1.2428, which is a pullback support level. This level provides a good buying opportunity as price could potentially bounce off from this level and continue its bullish trend. The second support level to watch is at 1.1826, which is a multi-swing low support level. This level is also important as price has previously bounced off from this level, indicating its significance.
On the resistance side, the first level to watch is at 1.2679, which is an overlap resistance level. This level is significant as a break above it could potentially signal a continuation of the bullish momentum
USD/CHF:
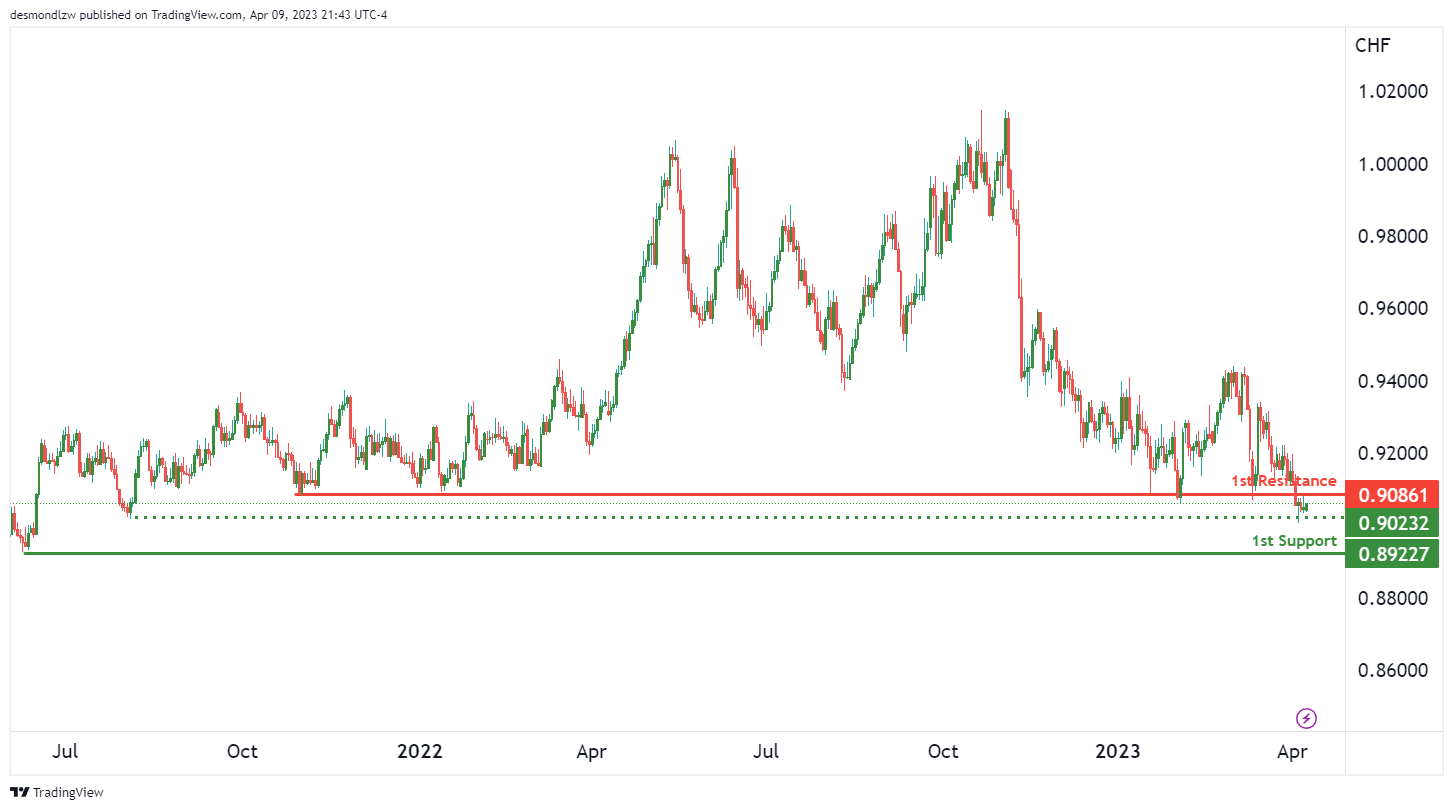
Looking at the USD/CHF chart, the overall momentum is bearish, with price potentially continuing its bearish movement towards the first support level. Price is currently below an ascending trendline, which could contribute to the bearish momentum.
The first support level to watch is at 0.8922, which is a swing low support level. If price breaks below this level, it could potentially signal a continuation of the bearish momentum. There is also an intermediate support level at 0.9023, which is a multi-swing low support level.
On the resistance side, the first level to watch is at 0.9086, which is a pullback resistance level. If price manages to break above this level, it could potentially signal a reversal of the bearish momentum.
USD/JPY:
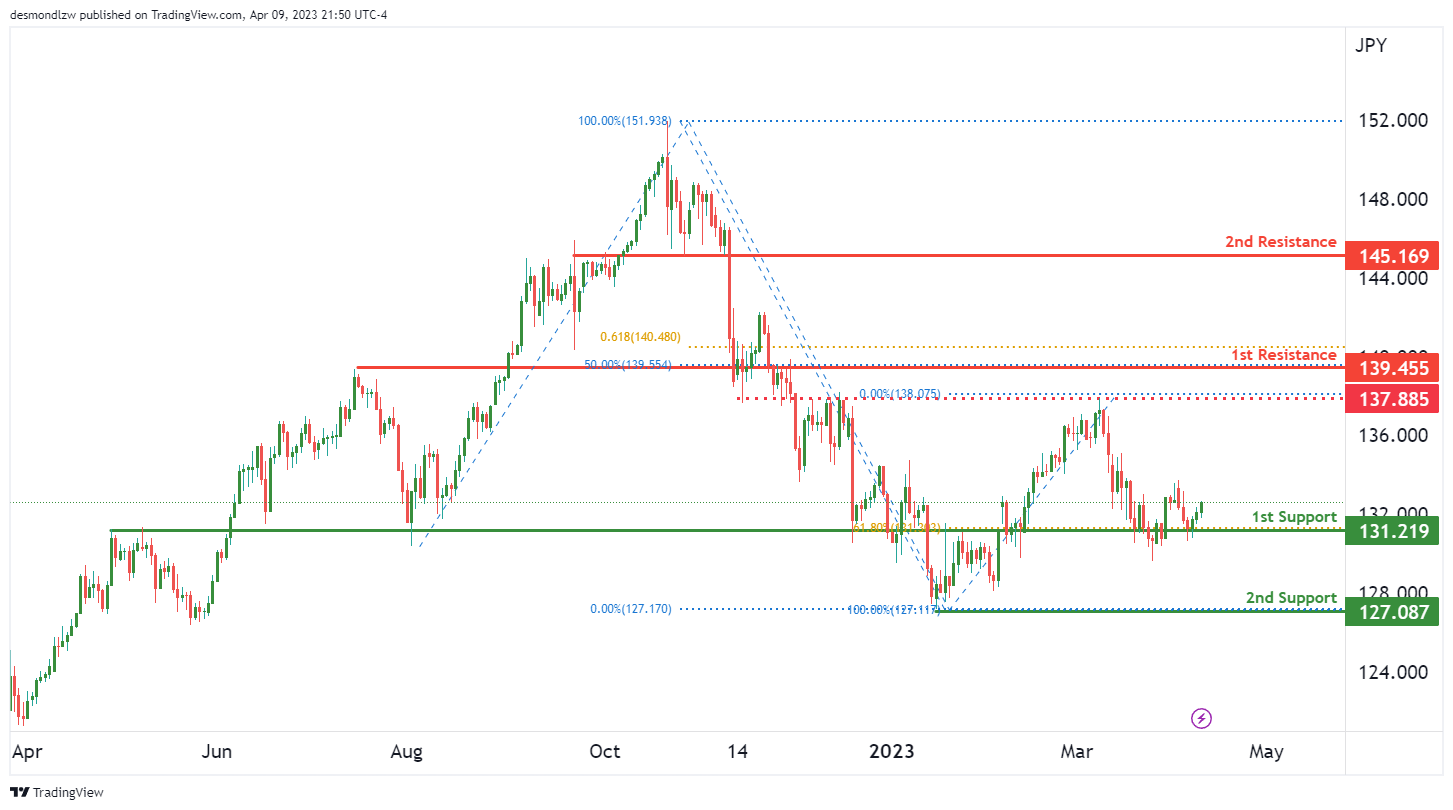
Looking at the USD/JPY chart, the overall momentum is bullish. This suggests that price could potentially continue to rise towards the 1st resistance level.
The 1st support level is at 131.2100, which is a strong overlap support level and also coincides with the 61.80% Fibonacci retracement. This makes it a good level for buyers to potentially enter the market.
If price were to drop below the 1st support level, it could potentially find support at the 2nd support level at 127.0800, which is a swing low support level.
On the other hand, if price were to continue to rise, it could potentially reach the 1st resistance level at 139.4500, which is a pullback resistance level and coincides with the 50% Fibonacci retracement.
If price were to break the 1st resistance level, it could potentially rise towards the 2nd resistance level at 145.1600, which is also a pullback resistance level.
There is also an intermediate resistance level at 137.8800, which is an overlap resistance level and could potentially act as a barrier for price before reaching the 1st resistance level.
AUD/USD:
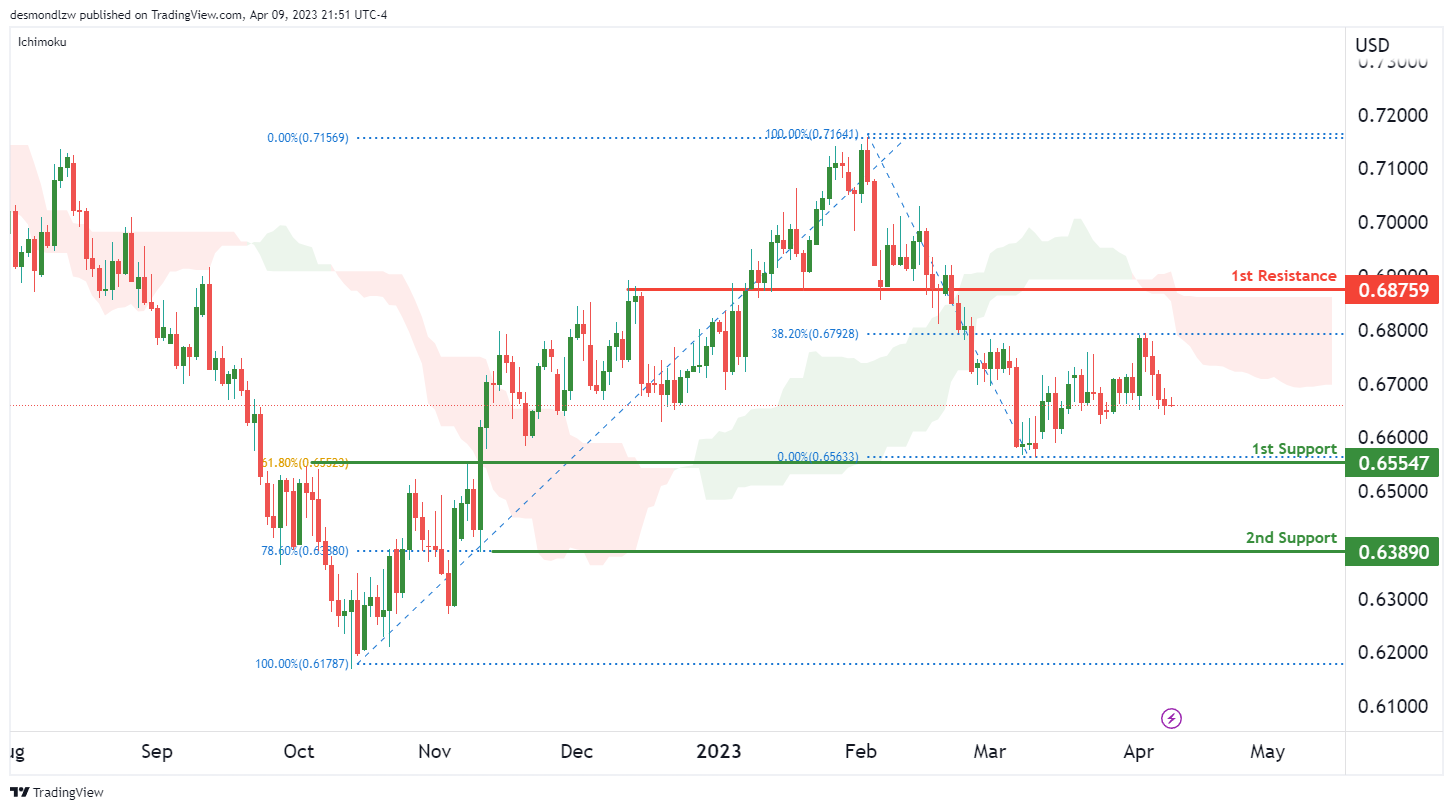
The AUD/USD chart is currently showing a bearish momentum, with prices trading below the bearish Ichimoku cloud. This suggests that there might be further downside potential for the currency pair.
Looking at the potential price movements, a bearish continuation towards the first support level at 0.6554 is likely. This level is a strong overlap support and has a 61.80% Fibonacci retracement lining up with it, making it a key level to watch.
If prices break below this level, the next support level it could drop to is the second support at 0.6389. This level is a pullback support and has a 78.60% Fibonacci retracement lining up with it, adding to its significance.
On the resistance side, the first resistance level at 0.6875 is a key level to watch. It’s a pullback resistance, but with no Fibonacci retracements lining up with it, it’s not as significant as the support levels.
Overall, with the bearish momentum and the current positioning below the Ichimoku cloud, it’s likely that the AUD/USD currency pair will continue to see downside pressure.
NZD/USD:
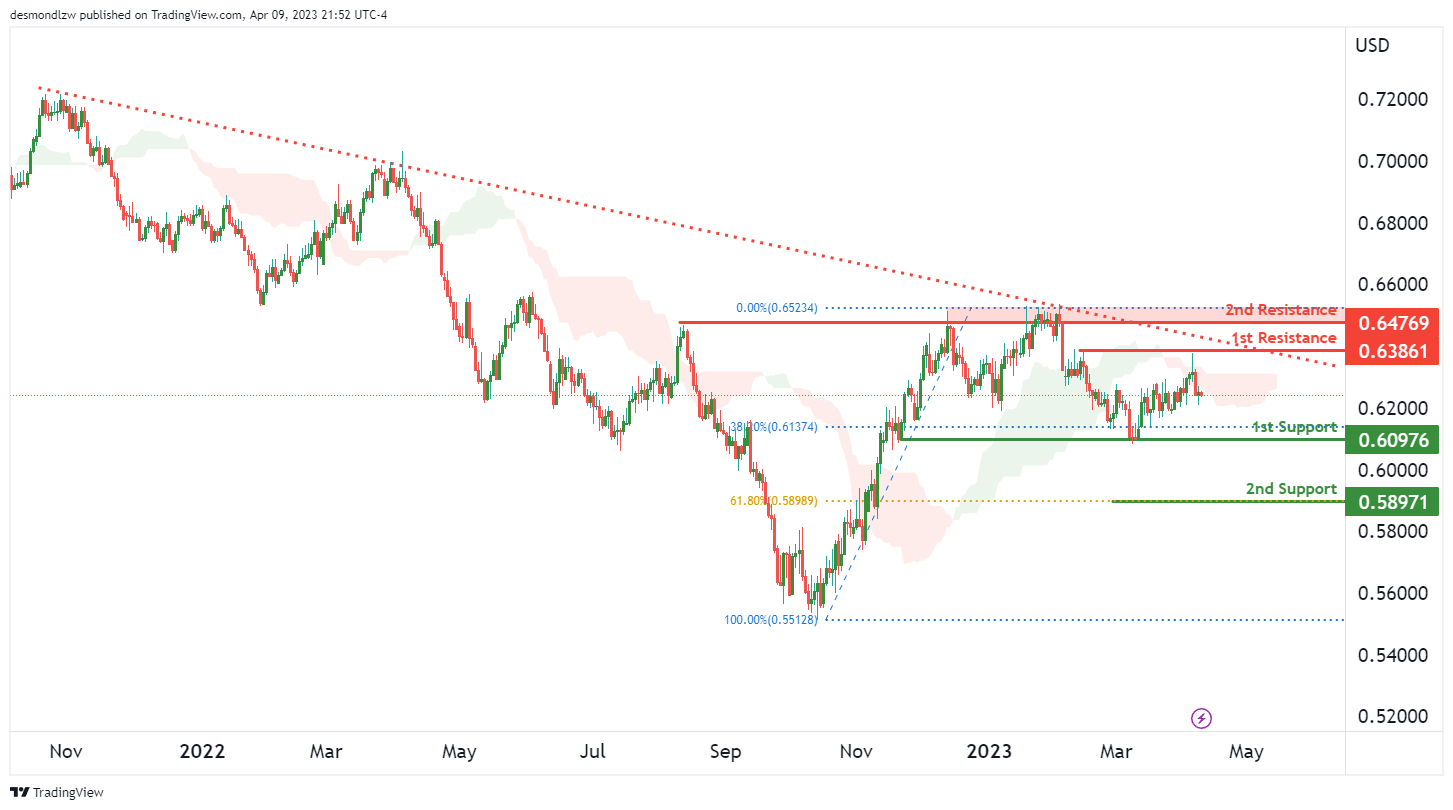
The NZD/USD chart currently shows strong bearish momentum, with price trading below the bearish Ichimoku cloud and a major descending trend line. This suggests that the path of least resistance is to the downside, and that we may see further bearish movement in the near future.
Looking at the support and resistance levels, the 1st support is located at 0.6097, which is a pullback support and also lines up with the 38.20% Fibonacci retracement. If price were to break below this level, it could potentially drop towards the 2nd support at 0.5897, which is a swing low support and coincides with the 61.80% Fibonacci retracement.
On the other hand, the 1st resistance is at 0.6386, which is a multi-swing high resistance level. If price were to break above this level, it could potentially rise towards the 2nd resistance at 0.6476, which is also a multi-swing high resistance level.
However, given the bearish momentum and the fact that price is currently below the Ichimoku cloud and the descending trend line, it is more likely that we may see a continuation of the bearish movement towards the 1st support level.
USD/CAD:
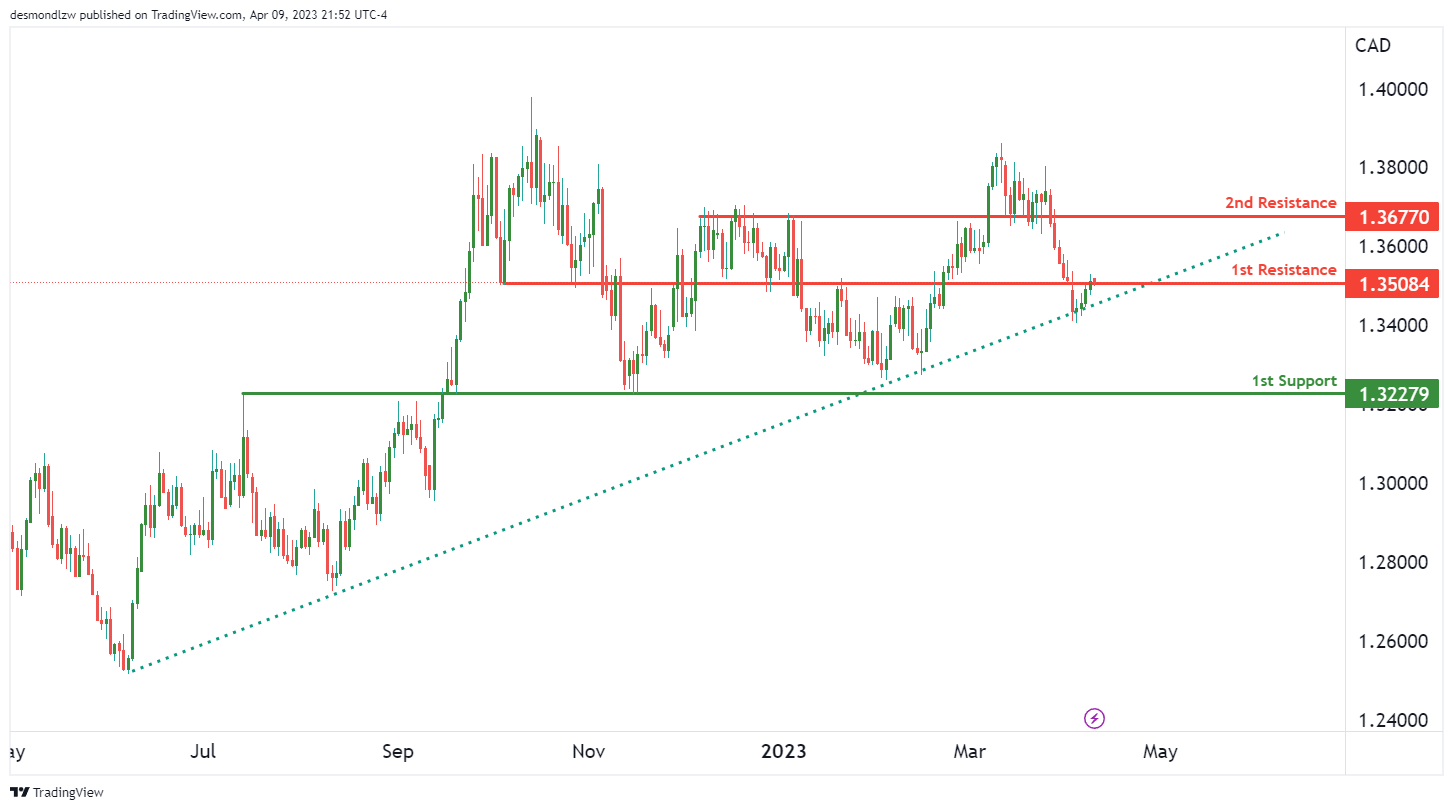
The USD/CAD chart is currently showing strong bullish momentum, with price trading above a major ascending trend line. This suggests that we might continue to see further bullish price action.
In terms of potential price movements, price could potentially make a bullish break through our 1st resistance at 1.3508, and rise towards our 2nd resistance at 1.3677.
On the other hand, if price were to fall below our current support level of 1.3227, it could potentially drop towards the next support level at 1.3000, which is a major overlap support.
It’s worth noting that the 1st resistance level at 1.3508 is also an overlap resistance, which makes it a strong level to watch. If price were to break above this resistance level, it could trigger a stronger bullish acceleration towards our 2nd resistance level.
Overall, the current bias of the USD/CAD chart is bullish, with potential for price to continue rising towards our resistance levels. However, a break below our support level could indicate a potential bearish shift in momentum.
DJ30:
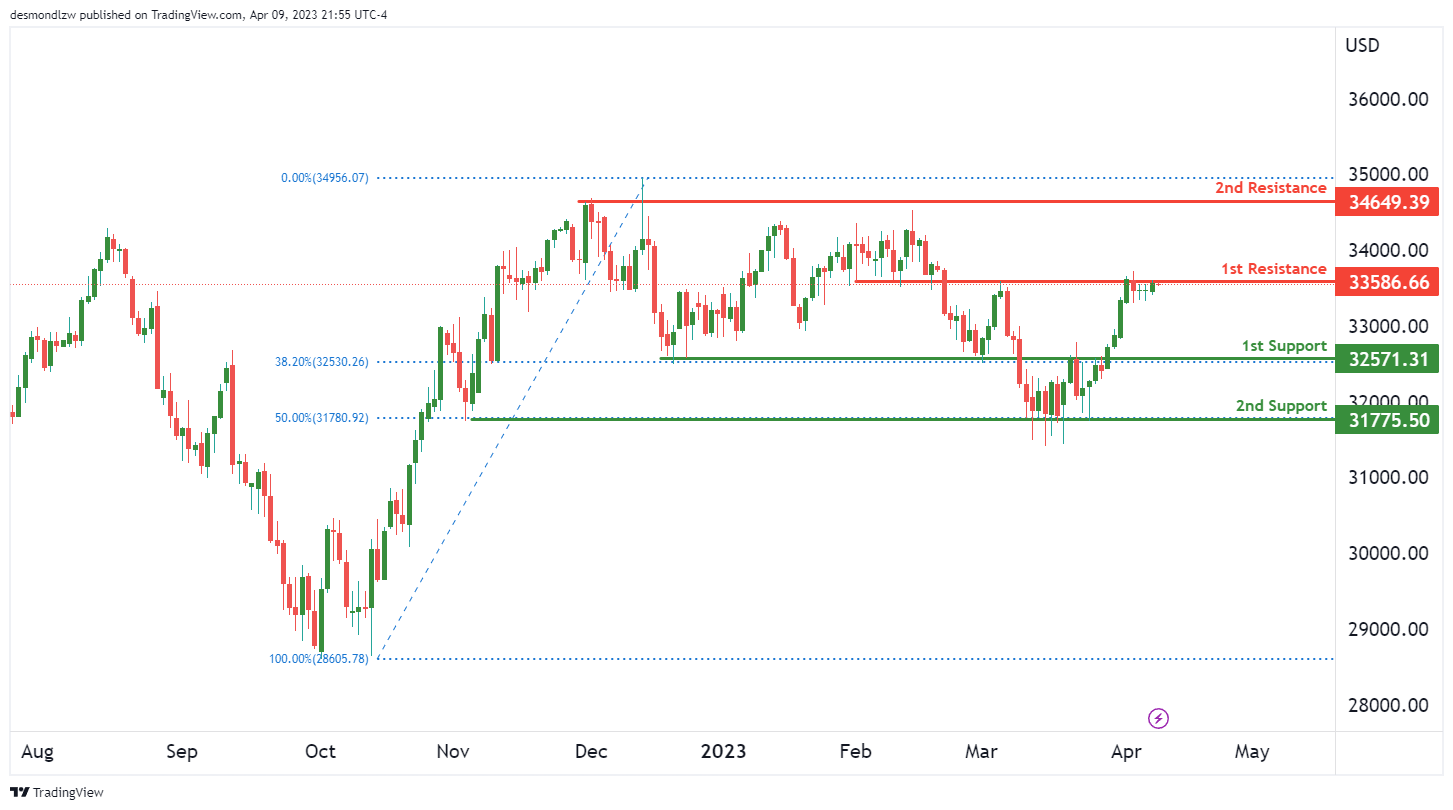
The Dow Jones Industrial Average (DJ30) has been exhibiting a bearish momentum on the chart lately. This is suggested by the fact that the price is currently below a major descending trend line.
Looking at potential price action, there is a possibility of bearish movement if the price reacts off the 1st resistance level and drops to the 1st support.
The 1st support level is located at 32571.31 and is a strong overlap support. It also coincides with the 38.20% Fibonacci retracement level, making it a good candidate for a potential bounce. In the event that the price breaks through this support level, the next support level it could potentially drop to is the 2nd support at 31775.50. This level is also a pullback support and is located at the 50% Fibonacci retracement level.
On the resistance side, the 1st resistance level at 35586.66 is a strong pullback resistance level. If the price were to reach this level, it could trigger a bearish reaction, pushing prices back down towards the support levels. The 2nd resistance level at 34649.39 is also an important multi-swing high resistance level that could potentially provide further resistance for prices.
GER30:
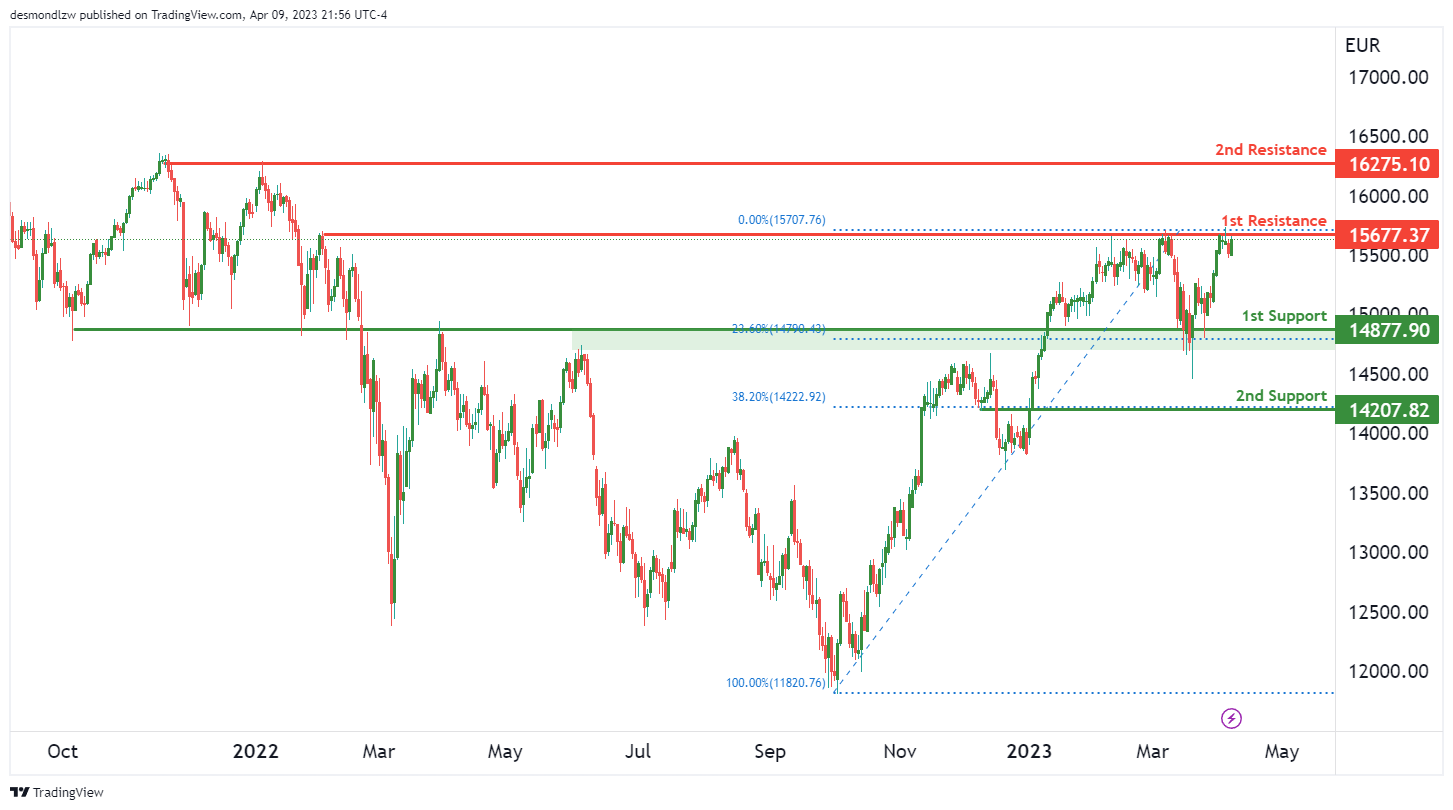
The GER30 chart appears to have a bearish momentum. The 1st resistance level is at 15677.37 and if price were to react bearishly off this level, it could potentially drop towards the 1st support at 14877.90.
The 1st support level at 14877.90 is a strong overlap support with a 23.60% Fibonacci retracement lining up with it, making it a good potential area for price to bounce back up. The 2nd support level at 14207.82 is also a pullback support with a 38.20% Fibonacci retracement lining up with it, adding to its potential strength.
On the other hand, the 1st resistance level at 15677.37 is a pullback resistance that could trigger a bearish reaction in price. If price were to break through this resistance level, it could potentially rise towards the 2nd resistance at 16277.37, which is a multi-swing high resistance level and could pose a significant obstacle to further bullish movement.
BTC/USD:
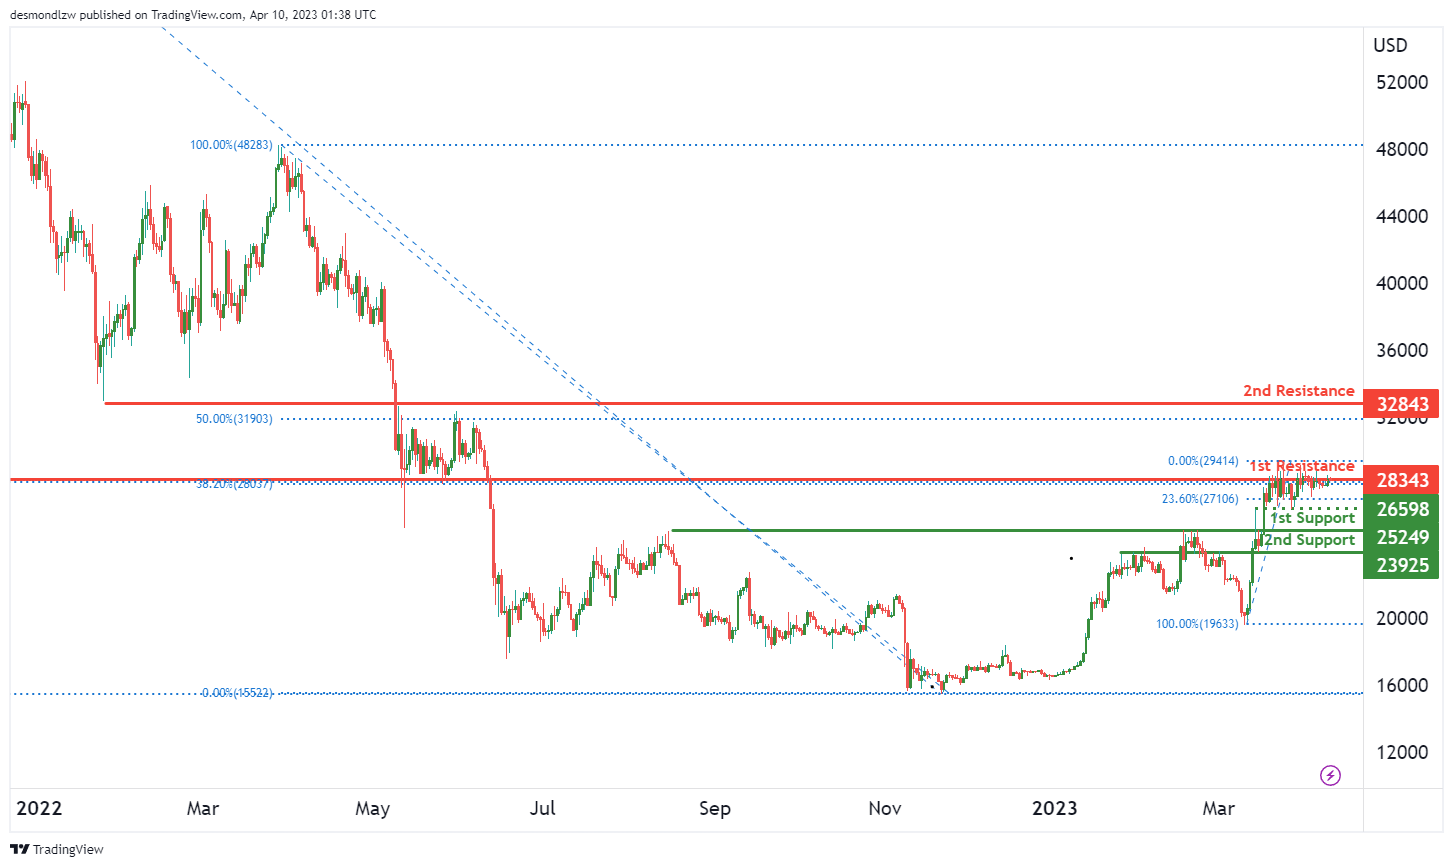
The cryptocurrency market has been experiencing bearish momentum lately, and Bitcoin is no exception. The overall momentum of the BTC/USD chart is currently bearish, indicating that prices are likely to continue to fall in the near term.
According to the chart, the price of Bitcoin could potentially face resistance at the 1st resistance level of 28343. This level is an overlap resistance, which indicates that it has been an important level in the past. If the price of Bitcoin fails to break through this level, we could see a bearish reaction and the price might drop towards the 1st support level of 25249. This level is a pullback support and could potentially act as a strong support for the price of Bitcoin.
If the price of Bitcoin breaks through the 1st resistance level, the next resistance level it could face is the 2nd resistance level of 32843, which is a pullback resistance. On the other hand, if the price of Bitcoin breaks below the 1st support level, the next support level it could drop to is the 2nd support level of 23925. This level is also a pullback support and could potentially act as a strong support for the price of Bitcoin.
It’s worth noting that there is also an intermediate support level at 26598, which is a swing low support and has a 23.60% Fibonacci retracement lining up with it. This level could potentially act as a support for the price of Bitcoin in case it drops towards the 1st support level.
US500
US500 Momentum Bullish, Potential for Continuation to 1st Resistance
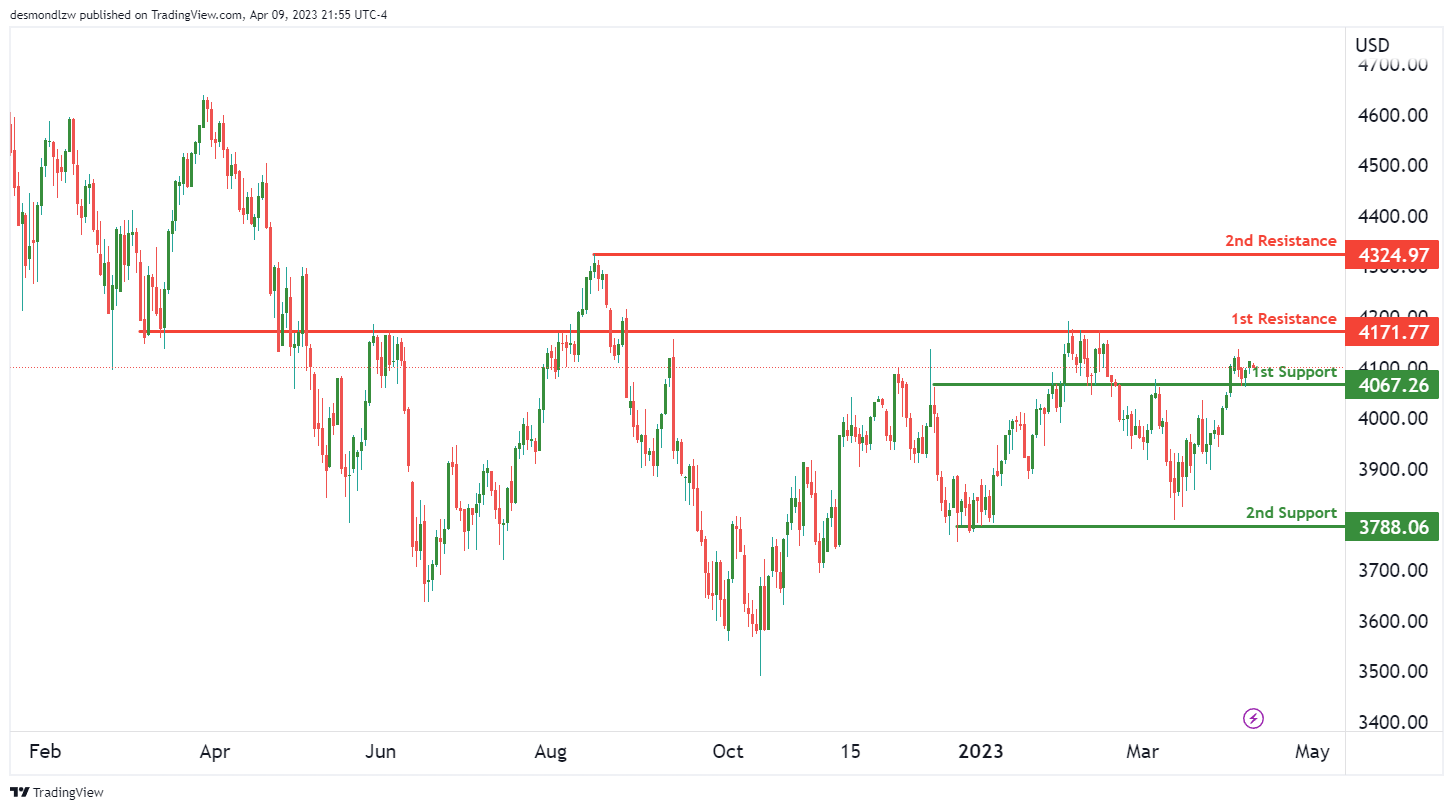
The overall momentum of the US500 chart is bullish, suggesting a potential for price to rise further. The current price is above a major ascending trend line, supporting the continuation of the bullish momentum.
Price could potentially make a bullish continuation towards the 1st resistance at 4171.77. Before reaching the 1st resistance, price has to break through the 2nd support at 3788.06, which is a multi-swing low support. If price bounces from the 2nd support, it could rise to the 1st resistance at 4171.77.
The 1st support at 4067.26 is a strong overlap support, which could provide additional support to the bullish momentum. If price were to break the 1st support, it could drop to the 2nd support at 3788.06.
The 2nd resistance at 4324.97 is a swing high resistance that could potentially act as a barrier for price to rise further. However, if price were to break the 1st resistance, it could potentially rise towards the 2nd resistance.
ETH/USD:
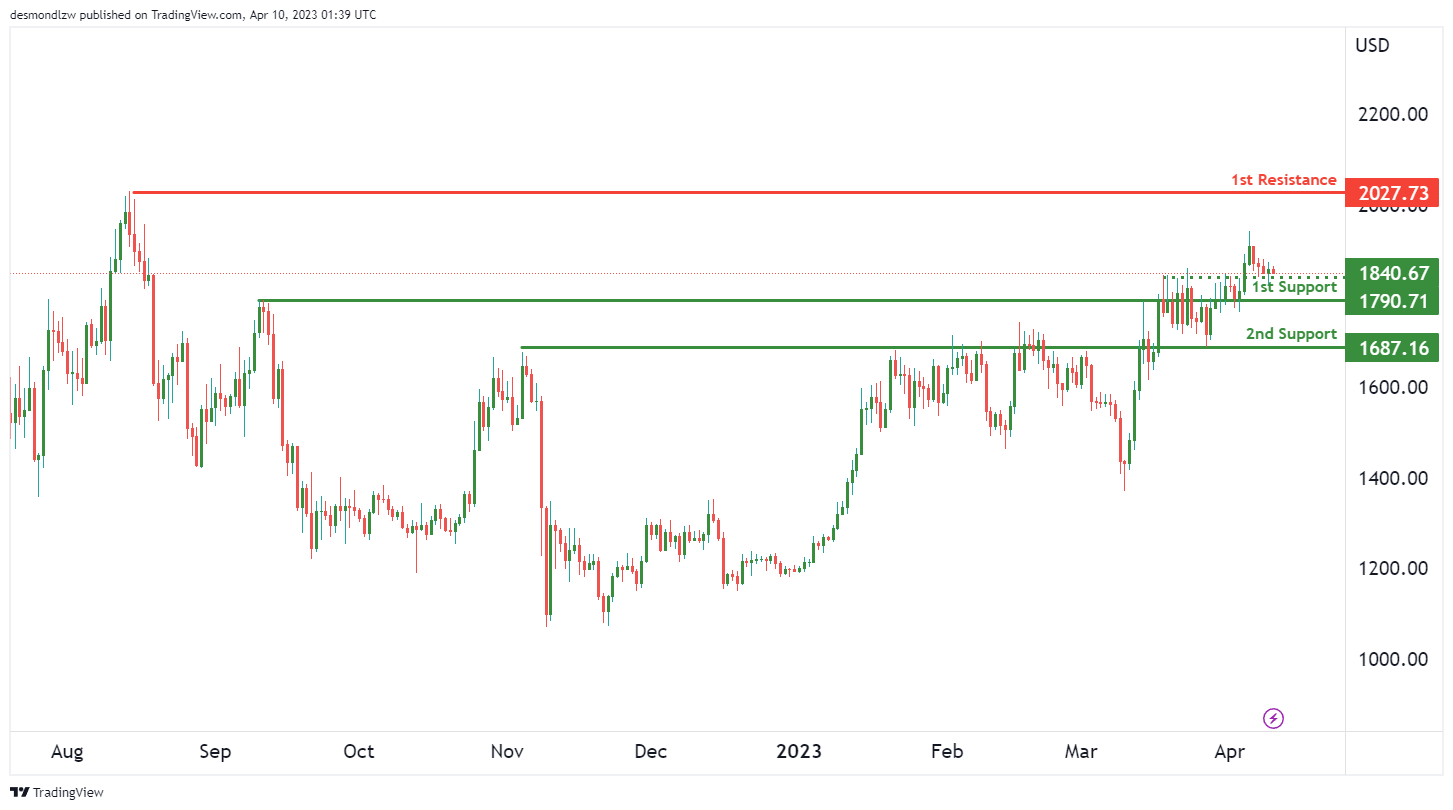
ETH/USD continues to see bearish momentum on the chart, as price remains below key resistance levels. A potential bearish continuation towards the 1st support level is expected.
The 1st support level is at 1790.71, and it’s a strong overlap support. In case of a bearish breakout, the 2nd support level at 1687.16 may come into play, as it is also an overlap support. These levels may provide some buying opportunities for traders looking for a reversal in the downtrend.
On the other hand, the 1st resistance level at 2027.73 is a multi-swing high resistance. In case of a bullish breakout, ETH/USD may rise towards this level. However, it’s worth noting that the current bearish momentum may make it difficult for price to break above this level. An intermediate support level at 1840.67 may offer a temporary respite, but traders should remain cautious as the bearish momentum continues.
Overall, the chart suggests a bearish bias for ETH/USD. As always, traders should use proper risk management strategies and closely monitor price movements to identify potential opportunities for profit.
WTI/USD:
WTI Crude Oil Sees Bearish Momentum with Potential Drop to Support
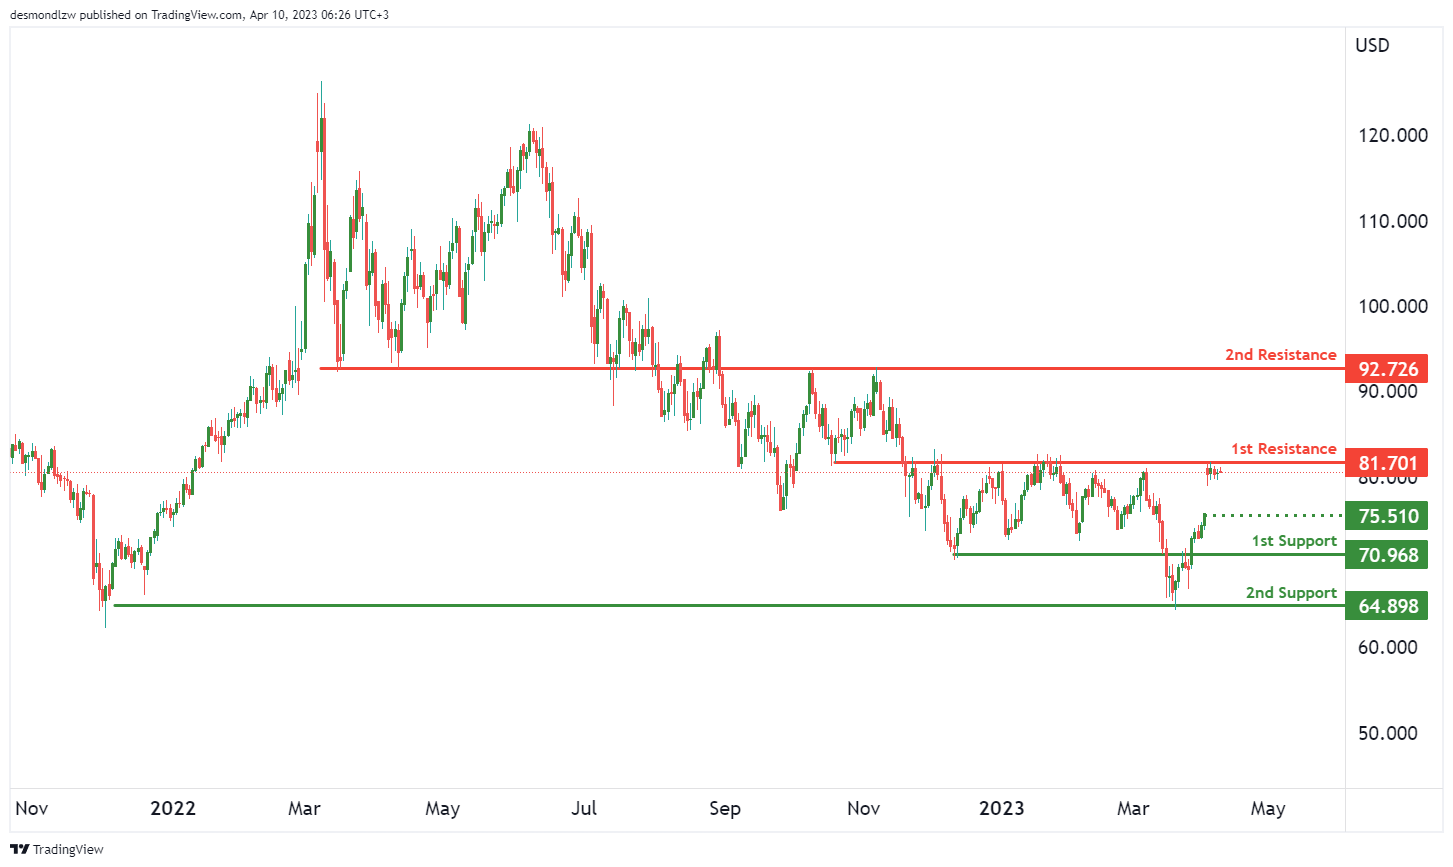
WTI crude oil has been seeing bearish momentum on the chart with the potential for a continuation towards the 1st support level.
Currently trading below the Ichimoku cloud, the overall bias of the chart is bearish. Additionally, there is a long-term descending trend line suggesting that further bearish momentum may be on the cards.
Looking at the levels of support and resistance, the 1st support level is at 70.96, which is a strong overlap support level. If the price were to drop further, the 2nd support level is at 64.89, which is a multi-swing low support level.
On the other hand, the 1st resistance level is at 81.70, which is a pullback resistance level. If the price were to rise, the 2nd resistance level is at 92.72, which is another pullback resistance level.
In addition to these levels, there is an intermediate support level at 75.51, which is a swing low support level.
XAU/USD (GOLD):
Gold prices have been experiencing a bullish trend, with the overall momentum of the chart showing a strong uptrend. While there may be some short-term fluctuations, it is likely that the price will continue its upward trajectory.
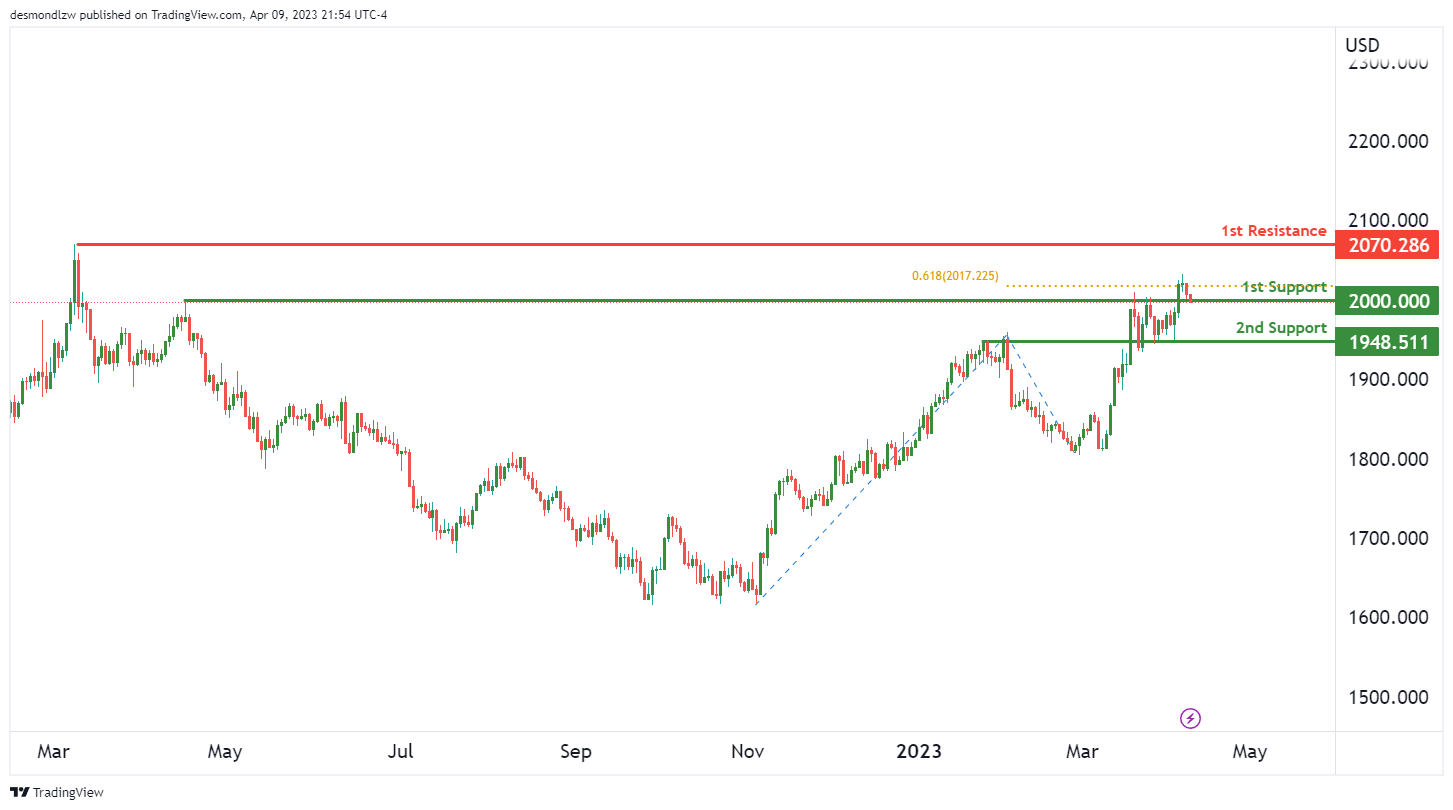
Looking at the current chart, it appears that the price of gold could potentially bounce off the 1st support level of 2000 and head towards the 1st resistance level of 2070. The 1st support level is a pullback support level, indicating that it could provide a strong foundation for a bullish reversal. The 2nd support level of 1948 is also an overlap support level, providing additional confirmation of potential support at this level.
On the other hand, the 1st resistance level of 2070 is a swing high resistance level, which has historically provided a strong barrier for the price of gold to break through. However, given the strong momentum of the current trend, it is possible that the price could break through this resistance level and continue to rise.
Gold falls below 2000 as expectations of anther Fed hike firm up
Gold dipped below 2000 as near-term pullback extended into Asian session, with many markets still on holiday. Shift appears to be driven by growing market conviction that Fed will implement another 25bps hike in May, as fed fund futures now indicate a 66% probability. This sentiment follows last week's robust US non-farm payroll report. However, expectations could still change after release of March CPI data and FOMC minutes on Wednesday.
Technically, a short-term top for Gold may have formed at 2032.05, evidenced by a bearish divergence in 4-hour MACD. Rally from 1084.48 might have completed a five-wave sequence and stalled just ahead of key resistance zone between 2070.06 and 2074.84 record high.
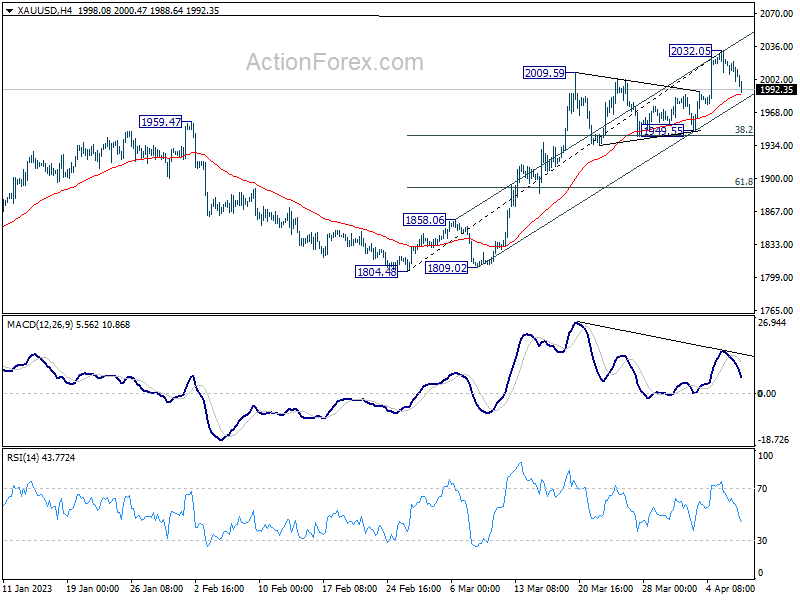
Considering this, a deeper pullback is now anticipated. Crucial near-term support level can be found at 38.2% retracement of 1804.48 to 2032.05 at 1945.11 which is in proximity to 1949.55 support level. As long as this support zone holds, current price action from 2032.05 should be regarded as a brief corrective phase, and a rally to new record highs is expected sooner rather than later.
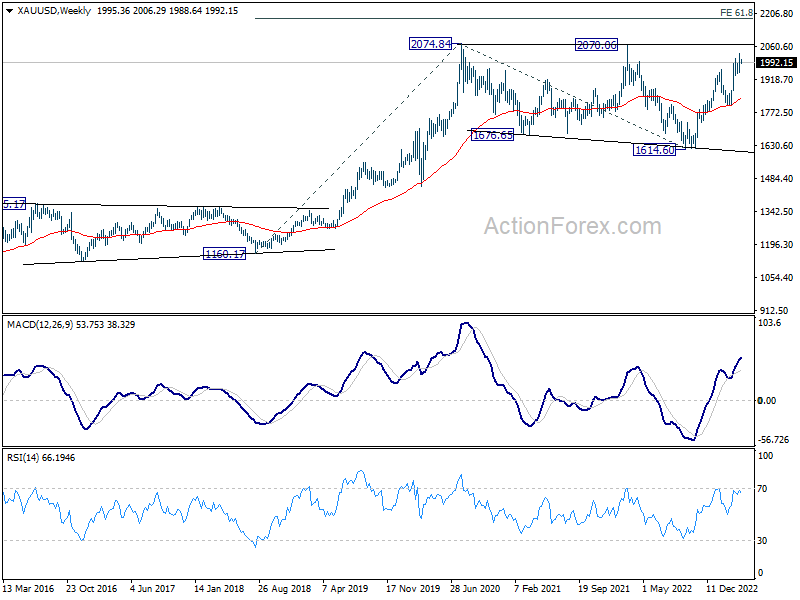
However, sustained break of 1945.11/1949.55 support zone could signal a deeper fall in underway, possibly extending the long-term consolidation pattern from 2074.84 with another downward leg. In this scenario, gold prices could decline to 61.8% retracement of 1804.48 to 2032.05 at 1894.41 or even further towards 1084.48.
EUR/USD Targets Fresh Highs, Oil Price Rallies
Key Highlights
- EUR/USD started a fresh increase above the 1.0880 resistance.
- A key bullish trend line is forming with support near 1.0860 on the 4-hour chart.
- GBP/USD tested the 1.2500 resistance before it corrected lower.
- Crude oil price rallied and climbed above the $80 resistance.
EUR/USD Technical Analysis
The Euro formed a base above the 1.0800 zone against the US dollar. EUR/USD remained well bid and was able to climb above the 1.0880 resistance zone.
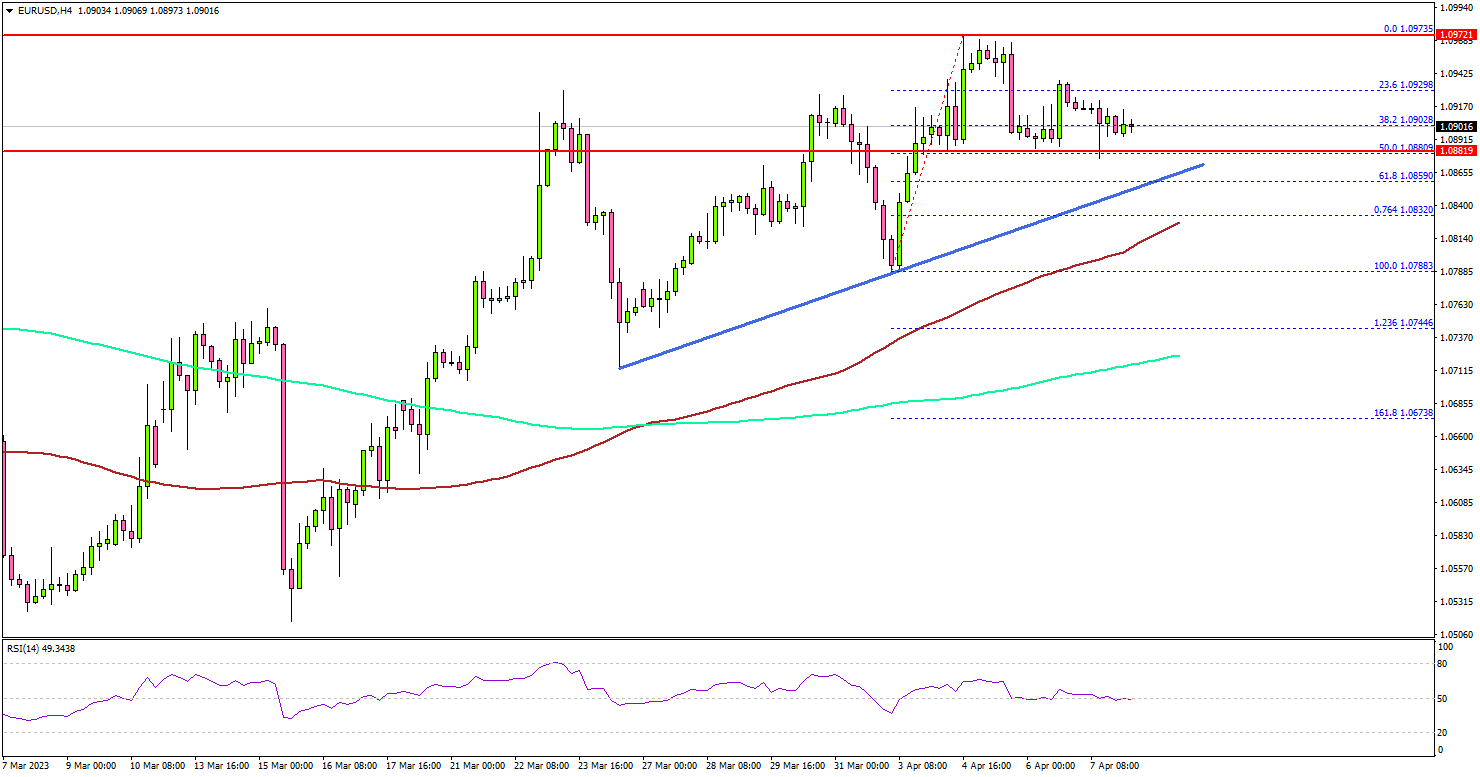
Looking at the 4-hour chart, the pair was able to settle above the 1.0900 resistance, the 100 simple moving average (red, 4 hours), and the 200 simple moving average (green, 4 hours).
Finally, it traded above the 1.0950 resistance but failed to test the 1.1000 resistance. It traded as high as 1.0973 and recently started a downside correction. There was a move below the 1.0950 and 1.0920 levels.
On the downside, immediate support is near the 1.0880 level. The next major support is near the 1.0860 level. There is also a key bullish trend line forming with support near 1.0860 on the same chart, below which the pair might test the 1.0820 zone.
On the upside, the pair is now facing resistance near the 1.0950 level. The next key resistance is near the 1.0975 zone. A clear move above the 1.0975 resistance might send the pair toward the 1.1000 zone. Any more gains might send the pair toward 1.1120.
Looking at crude oil price, there was a decent rally above the $78 resistance and the price even climbed above the $80 pivot level.
Economic Releases
- US Wholesale Inventories for Feb 2023 – Forecast +0.2%, versus +0.2% previous.