Sample Category Title
EUR/USD: Euro Remains Constructive Ahead of US Labor Data
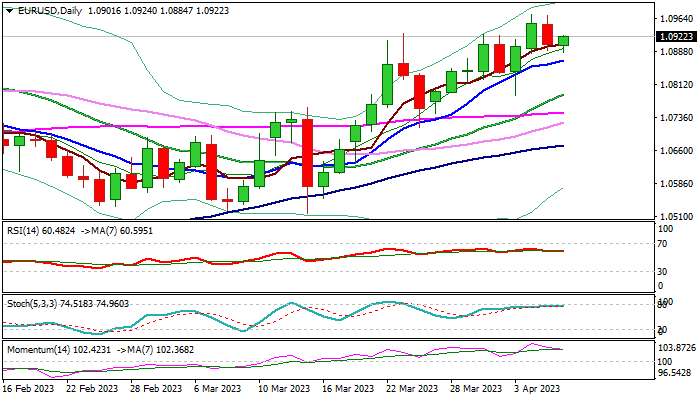
The Euro started to gain traction in early US trading on Thursday, following a limited dip from new two-month high on Wednesday.
Overall picture remains bullish as the single currency benefited from weaker dollar, after downbeat US data pointed to cooling labor market and growing fears of recession risk, with immediate bullish bias to remain intact as long as the price stays above rising 10DMA (1.0865).
All eyes are on Friday’s release of US labor data, which is expected to provide fresh direction signals for dollar and subsequently impact Euro’s performance.
The greenback is likely to come under increased pressure if labor figures fall below expectations, particularly NFP and earnings.
This scenario will be positive for euro and would spark fresh bullish acceleration towards targets at 1.1000/32 (psychological / 2023 high).
Conversely, stronger than expected number in March would lift the greenback and deflate euro.
Res: 1.0973; 1.1000; 1.1032; 1.1100
Sup: 1.0865; 1.0835; 1.0789; 1.0774
How Will Gold and USD React to NFP?
Oh, look at that! NFP is coming up shortly, and while some predict that XAU/USD could reach new heights in 2023, reports from other analysts reveal that the price of Gold has dropped to around $1,950 due to the US Treasury bond yield bouncing back. So, while we watch for potential buying opportunities, we must also exercise caution as we position ourselves to follow whatever immediate move the market presents us first. Let's see what the charts are saying!
XAUUSD - Weekly
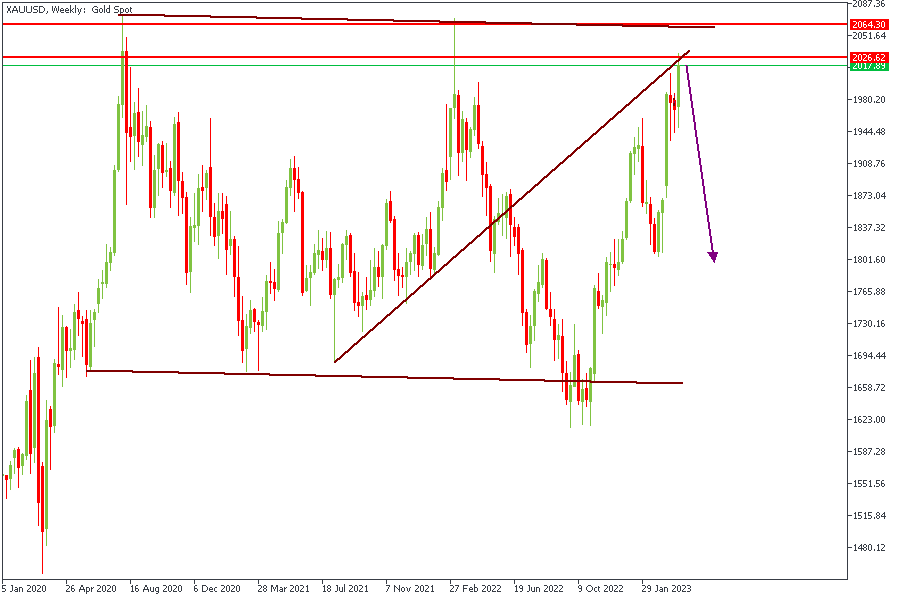
Gold, on the weekly timeframe, is trading within a descending channel. The trendline resistance fits into the order block created by the rally-base-drop supply. The price has also created a 'turnkey' trendline resistance that aligns with the supply zone. Based on the confluence of the Fibonacci retracement tool and the other factors mentioned, we would see some bearish retracement from Gold in the coming days, possibly due to the NFP figures.
Analysts’ Expectations:
- Direction: Bullish
- Target: $1888
- Invalidation: $2062
US DOLLAR - Daily
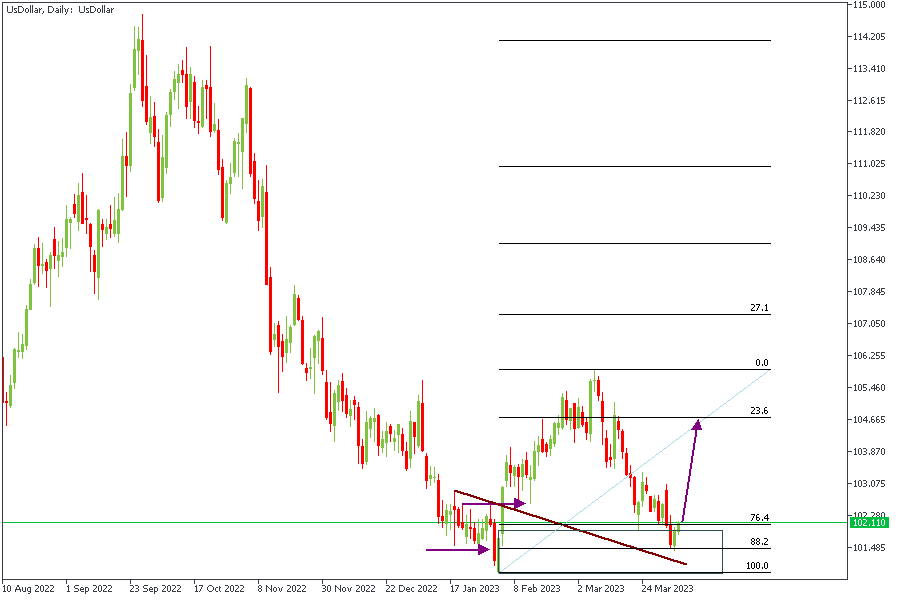
Based on the chart attached, we can see a clear AMD pattern created by price on the Daily timeframe. Moreover, there is a clear reaction of price away from the 88% of the Fibonacci retracement zone. The confluence of factors points solidly towards a potential bullish move, which I expect to be triggered by the NFP release.
Analysts’ Expectations:
- Direction: Bullish
- Target: 104.399
- Invalidation: 100.815
CONCLUSION
The trading of CFDs comes at a risk. Thus, to succeed, you have to manage risks properly. To avoid costly mistakes while you look to trade these opportunities, be sure to do your due diligence and manage your risk appropriately.
ETHUSD Technical Analysis
ETHUSD – Hammer Pattern Is Above $1,763
Bears couldn’t keep control of the market, and after touching a low of $1,763 on 03rd April, the ETH/USD pair started to correct upwards, touching a high of $1,939 on 05th April.
ETHUSD is now moving under bearish pressure after touching a high of $1,939 on 05th April. The immediate bearish pressure suggests we will enter a consolidation phase above the $1,850 level.
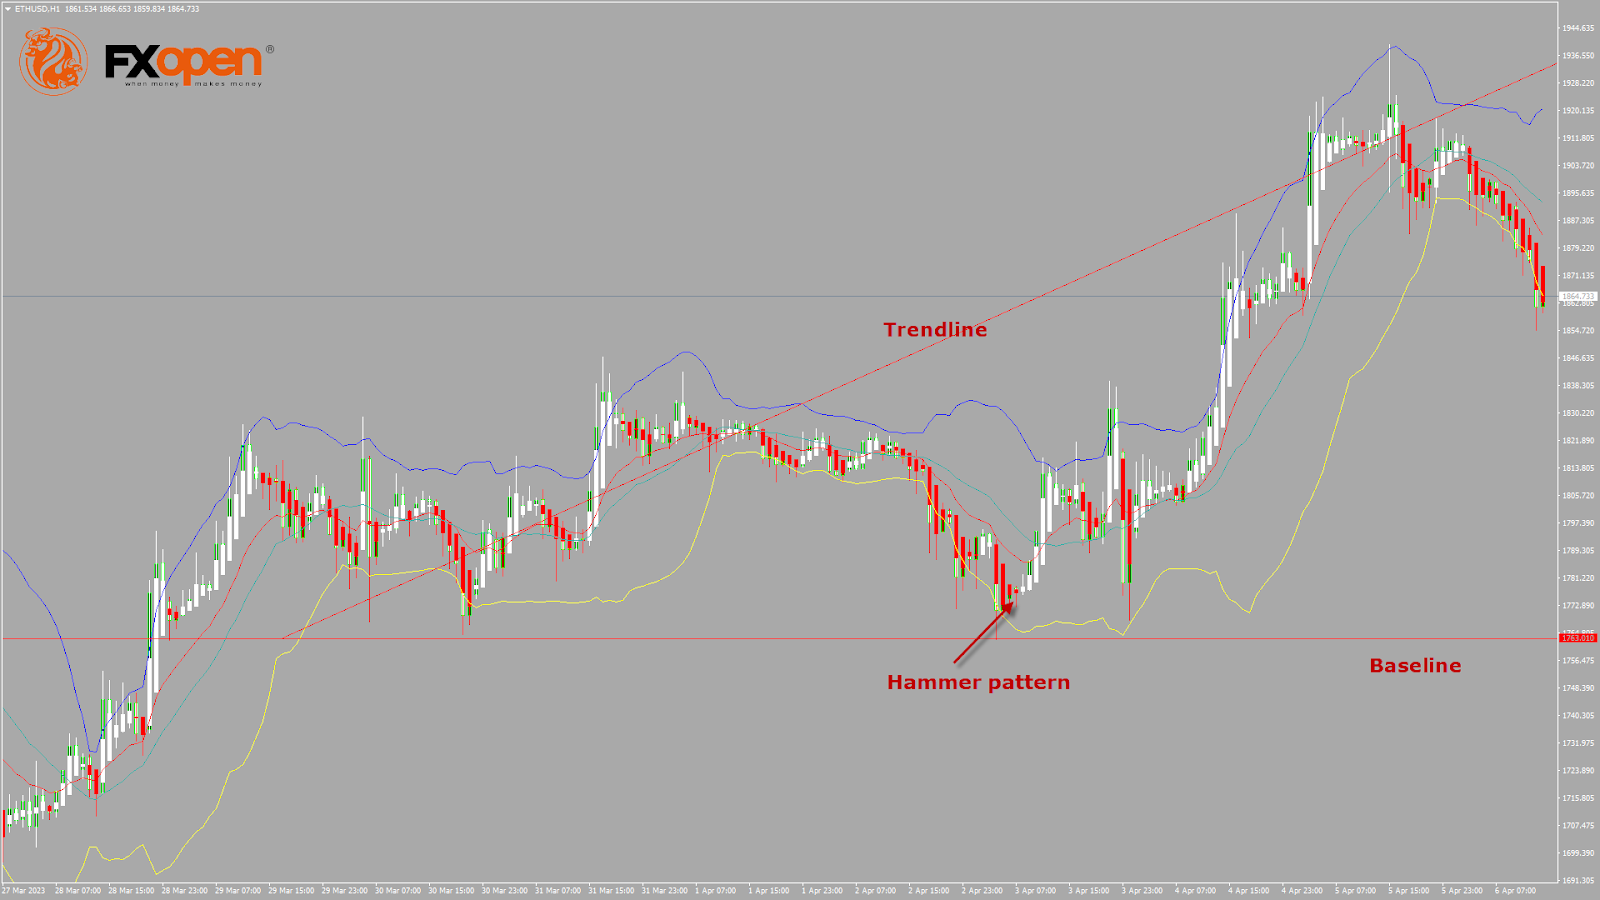
A hammer pattern is above the $1,763 handle. It’s a bullish pattern, which signifies the end of a bearish phase. Also, we can see the formation of the morning star pattern.
The price is above the Ichimoku cloud, indicating a bullish nature of the market. Moreover, Ethereum is near the support of the channel.
The relative strength index is at 56.91, indicating a strong demand for Ether and a continuation of the buying pressure in the markets.
The average directional index and commodity channel index give a neutral signal, meaning that the price is expected to enter into a consolidation phase in the short-term range.
Some of the technical indicators are giving a bullish market signal. Most moving averages are giving a bullish signal at the current market level of $1,866.
ETH is now trading above the 200-hour simple and 200-hour exponential moving averages.
- Ether bullish reversal is seen above the $1,763 mark.
- The short-term range is expected to be mildly bullish.
- The average true range indicates high market volatility.
Ether Bullish Reversal Seen Above $1,763
On the daily chart, ETH is trading just below its pivot level of $1,885 but is moving into a mild bullish channel and testing its classic resistance level of $1,893 and Fibonacci resistance level of $1,907, after which the path towards $1,950 will get cleared.
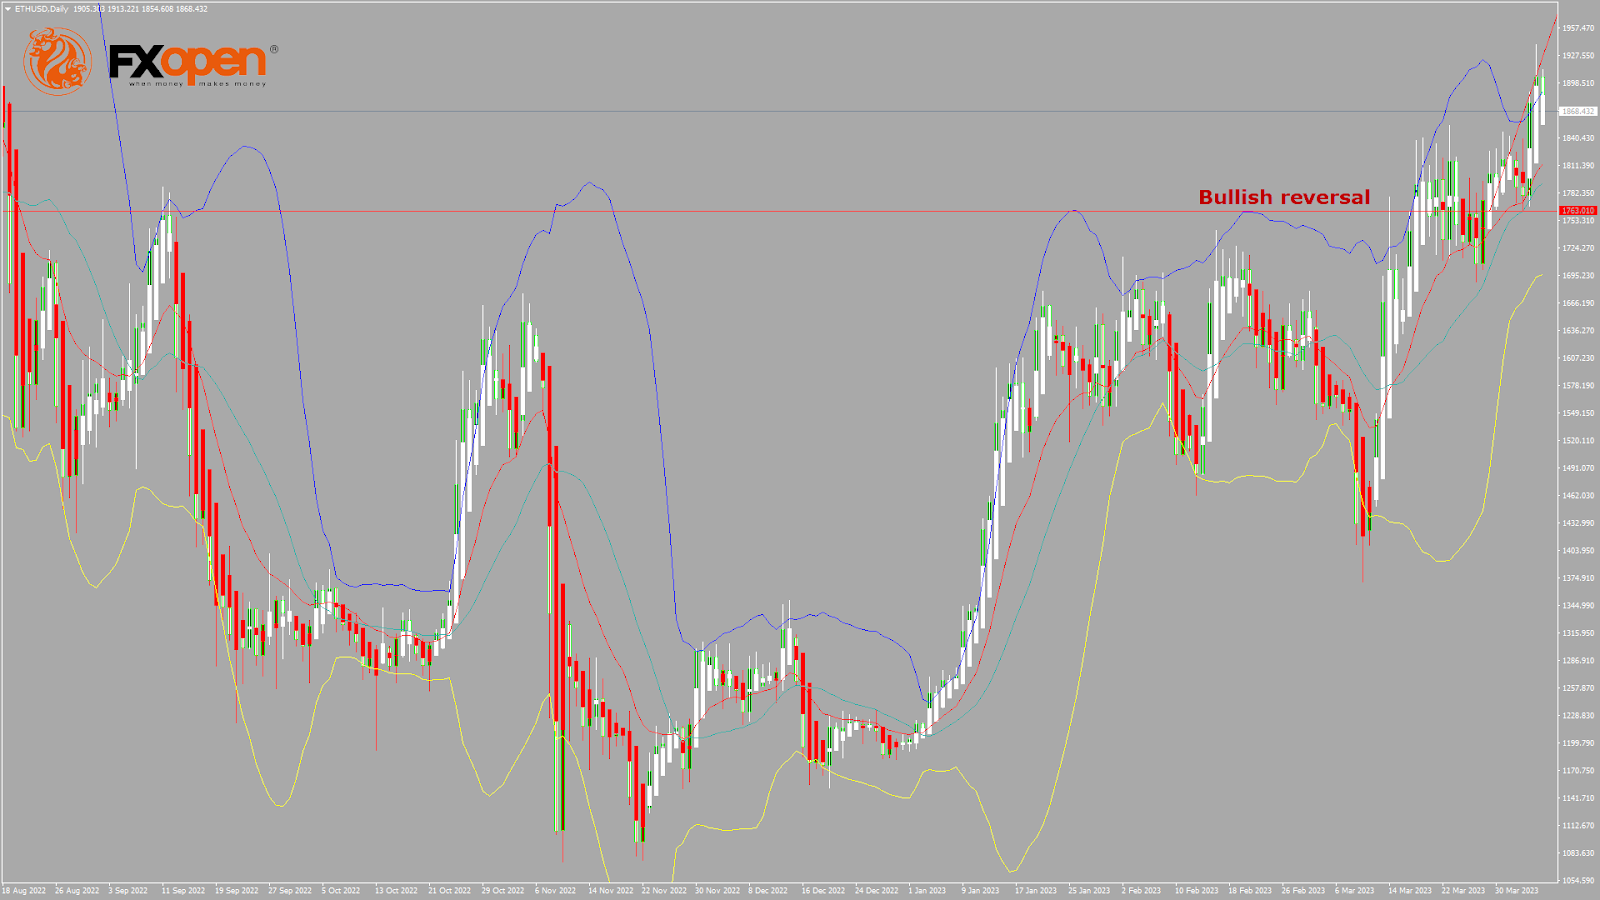
We can see the formation of a bullish price crossover with the 50-week adaptive moving average. The key support levels to watch are $1,808, at which the price crosses the 9-day moving average, and at $1,810, which is a 38.2% retracement from the 52-week low.
The Week Ahead
ETH has crossed the $1,900 barrier, and now we are heading towards the $2,000 level in the medium-term range in the H1 timeframe.
We can see a bullish ascending channel forming from $1,763 towards the $1,935 level.
We can see the formation of a major bullish trendline with the support located at $1,727, which is a 14-day RSI at 50.
The immediate short-term outlook for Ether has turned as mildly bullish, the medium-term outlook has turned bullish, and the long-term outlook for Ether is neutral in present market conditions.
The resistance zone is located at $1,899, which is a pivot point, and at $1,932, which is a 13-week high.
The weekly outlook is $2,000 with a consolidation zone of $1,950.
LTCUSD Technical Analysis
LTCUSD – Bullish Harami Pattern Is Above $86.64
Bears couldn't pull the market further down last week, and after touching a low of $86.64 on 30th March, the prices started to correct upwards against the US Dollar, touching a high of $94.91 on 03rd April.
We have seen a bullish opening of the markets this week.
We can see a bullish harami pattern above the $86.64 handle. It signifies the end of a bearish phase and the start of a bullish phase in the market.
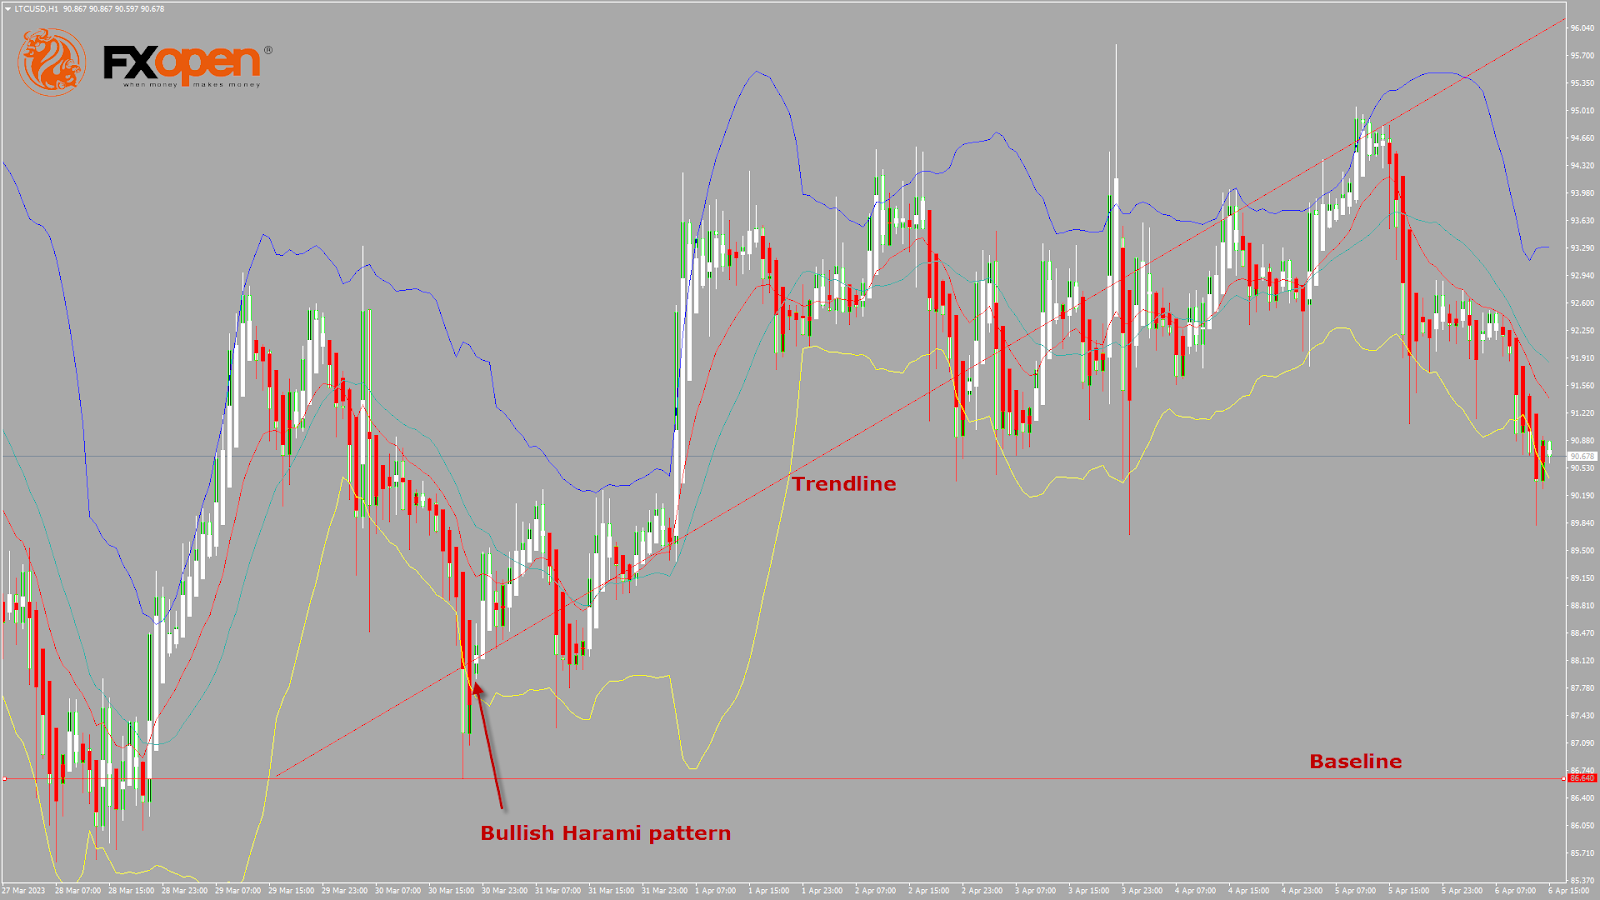
The price of Litecoin is near the channel's support, indicating upcoming bullish movement. Also, Litecoin is trading above its 100-hour simple moving average and 100-hour exponential moving average, and it's above the pivot level of $92.93.
The relative strength index is at $52.50, indicating a neutral demand for Litecoin and a shift towards the market consolidation phase.
The prices of Litecoin continue to remain above some of the moving averages, which are giving a bullish signal at current market levels of $90.65
Both the Williams percent range and commodity channel index are signalling neutral market conditions, which means that the price is expected to remain in a consolidation phase in the short-term range.
The short-term outlook for Litecoin has turned mildly bullish.
- Some of the technical indicators are giving a bullish signal.
- Litecoin bullish reversal is seen above the $86.64 level.
- The RSI gives a neutral signal.
- The average true range indicates low market volatility.
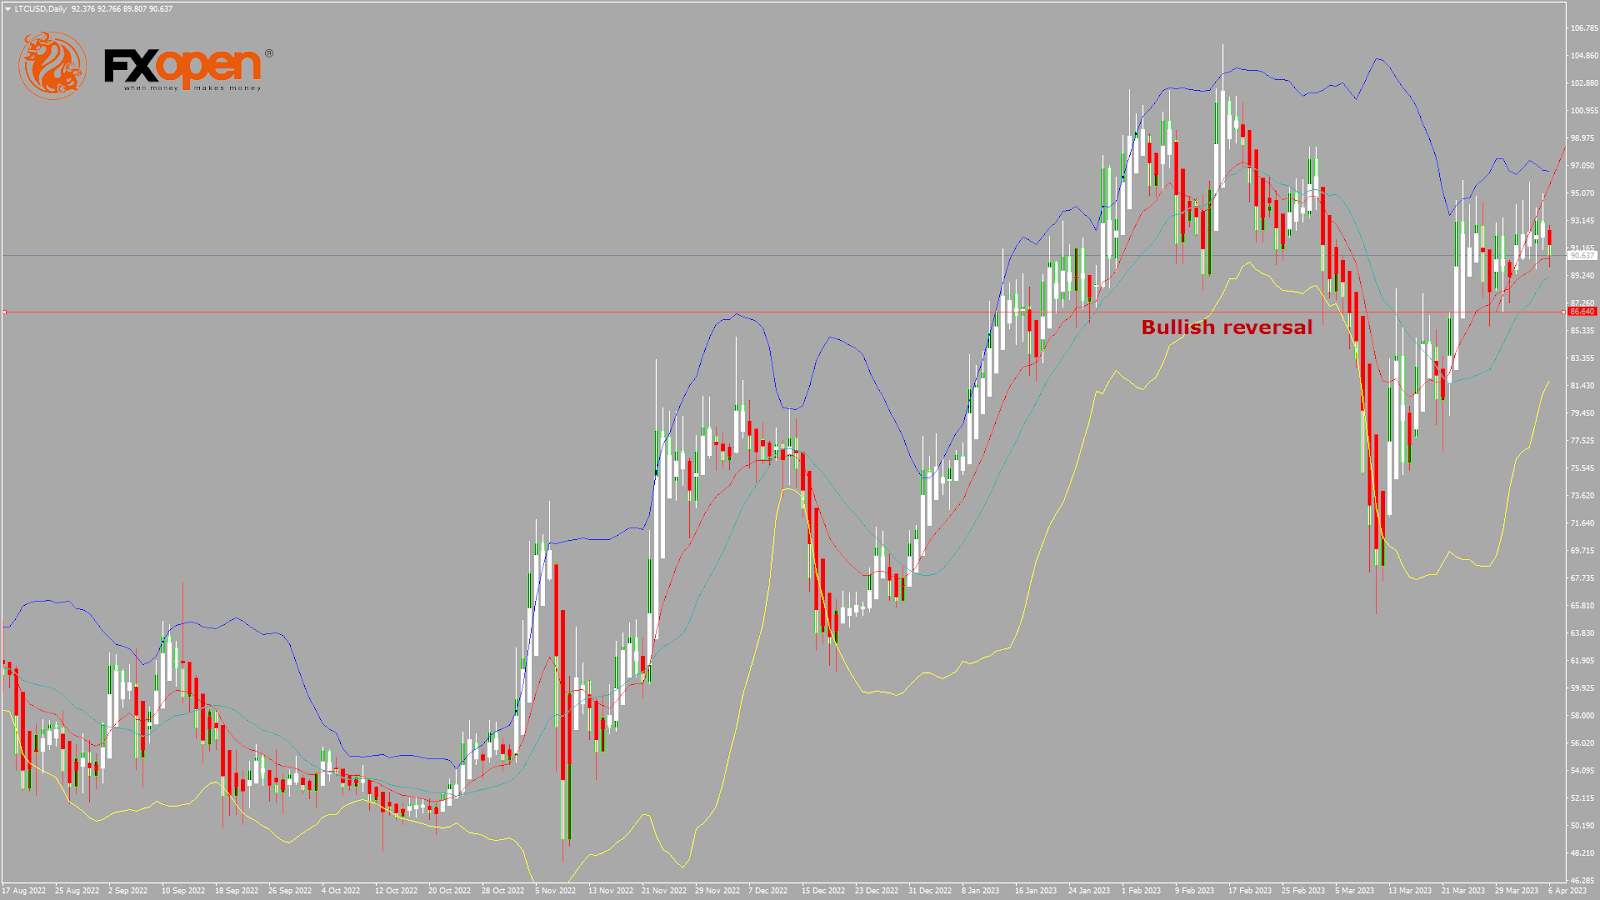
Litecoin Bullish Reversal Seen Above $86.64
The price of Litecoin continues to move in a mild bullish momentum above the $90 handle, but it entered a consolidation zone in the European trading session.
We can see the formation of a bullish crossover of 20-day and 50-day moving averages.
The price of LTCUSD is now facing its classic resistance levels of 94.68 and Fibonacci resistance levels of 96.69, after which the path towards $100 will get cleared.
Litecoin faces resistance at the $92.88 pivot point and $93.92.
Litecoin trading volume has increased by 0.01% compared to yesterday, which appears normal.
The Week Ahead
The price of Litecoin has been facing stiff resistance at $97 in the last 30 days. It’s moving into a consolidation phase, after which we can see fresh upsides towards $95 and $100.
Some of the technical indicators are signalling a neutral sentiment in the market.
Litecoin should stay above the important support level of $88.44, which is a 14 Day RSI at 50, and at $90.13, which is a 38.2% retracement from a 13-week high.
The short-term outlook for Litecoin has turned mildly bullish, the medium-term outlook is bullish, and the long-term outlook is neutral at present market conditions.
The weekly projection is $100, with a consolidation zone of $95.
RBA & RBNZ: Policy Divergence Down Under
Summary
- The Reserve Bank of Australia (RBA) paused its monetary tightening in April, holding its policy rate at 3.60%. The RBA also softened its guidance in regard to further rate hikes, stating that "some" further tightening of monetary policy "may well be needed".
- In holding policy steady, the RBA cited the cumulative tightening to date, evidence that inflation has peaked, and a cautious outlook for consumer spending. Household fundamentals suggest consumer spending trends will remain distinctly subpar given falling real household incomes and rising household interest costs.
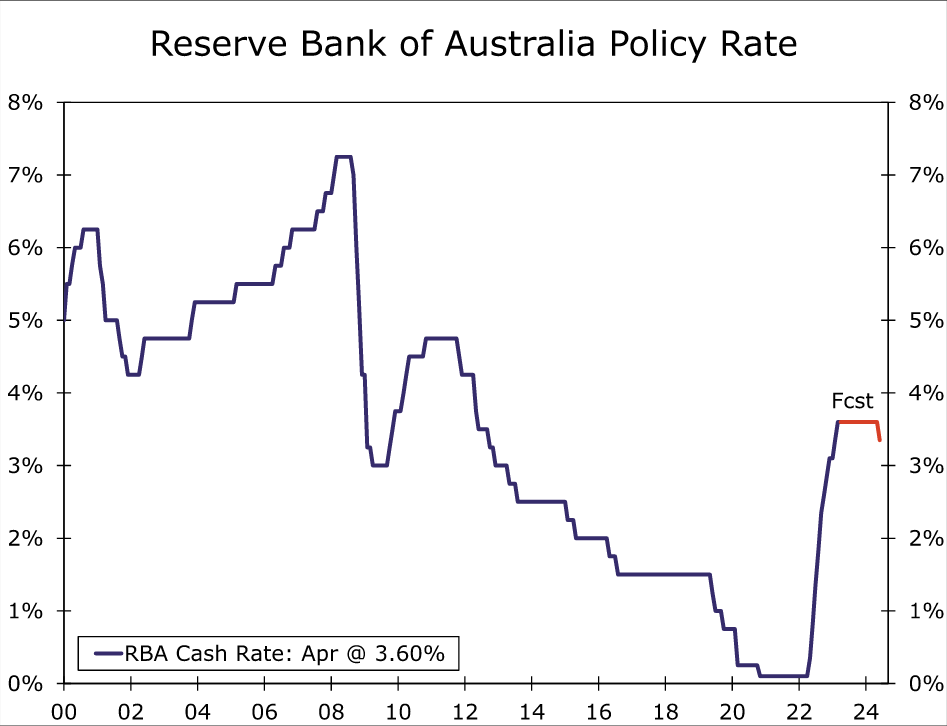
- After the RBA's pause, we believe the bar to resume rate hikes has risen. That is not a bar we expect to be met. Instead, we expect the current policy rate of 3.60% to be the peak for this cycle, and we do not expect the RBA to begin easing monetary policy until well into 2024.
- In contrast with the RBA, the Reserve Bank of New Zealand (RBNZ) was more hawkish than expected at its April monetary policy meeting, delivering a 50 bps rate hike to 5.25%. Policymakers said that inflation is still too high and persistent, while employment is beyond its maximum sustainable level.
- Taking into account the 500 bps of monetary tightening delivered so far in this tightening cycle, the RBNZ anticipates growth to slow in early 2023. Meanwhile on the inflation front, consumer prices have not yet shown signs of receding substantially.
- In our view, moderate growth and elevated inflation sets the backdrop for additional tightening from the RBNZ, although believe the central bank is near the end of its rate hike cycle. We forecast one last 25 bps rate hike in May, bringing the Official Cash Rate (OCR) to 5.50%. However, we would not rule out a larger increase, and note that the risks are tilted toward a 50 bps increase in May.
Reserve Bank of Australia Reaches a Rate Hike Pause
After some 350 bps of rate hikes since May of last year, the Reserve Bank of Australia (RBA) paused its monetary tightening at its April meeting, holding its Policy Rate steady at 3.60%. The RBA acknowledged that monetary policy operates with a lag and the full effect of the past rate increases has yet to be felt. In that context, the April pause offers the central bank additional time to assess the impact of the cumulative increase in interest rates so far.
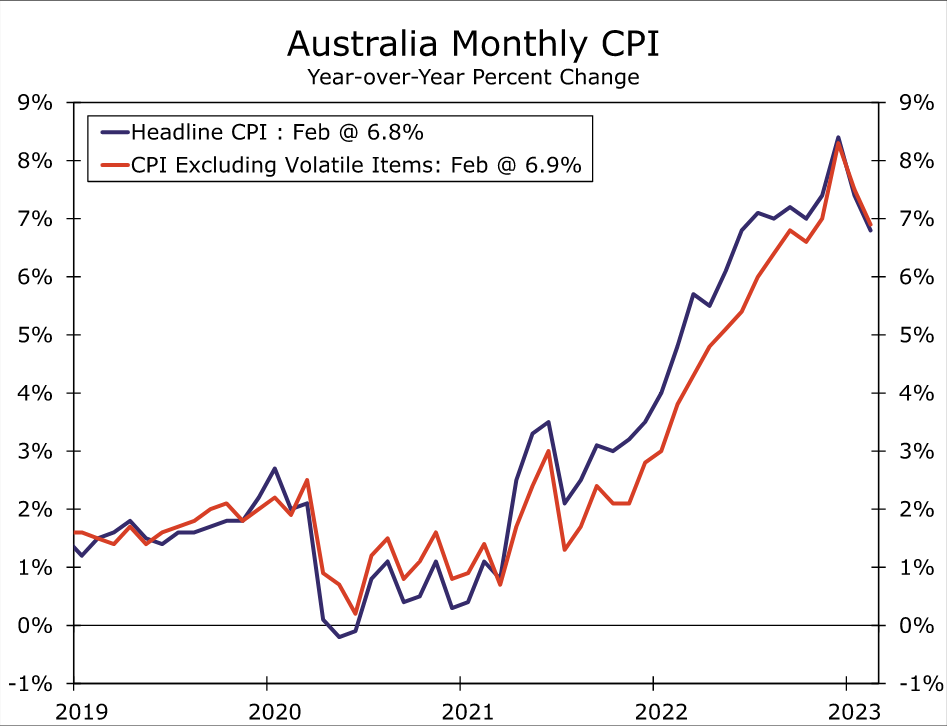
The RBA's announcement highlighted other factors that contributed to the pause at the April meeting as well. The central bank said there is growing evidence that inflation has peaked, and in particular highlighted the monthly CPI indicator. That measure saw CPI inflation slow to 6.8% year-over-year in February from a recent peak of 8.4% in December. The CPI excluding volatile items also slowed to 6.9%. While inflation is still elevated well above the RBA's medium-term target range of 2%-3%, the recent slowdown means it is nonetheless heading in the right direction. The RBA expects inflation to decline in 2023 and 2024, reaching around 3% by the middle of 2025.
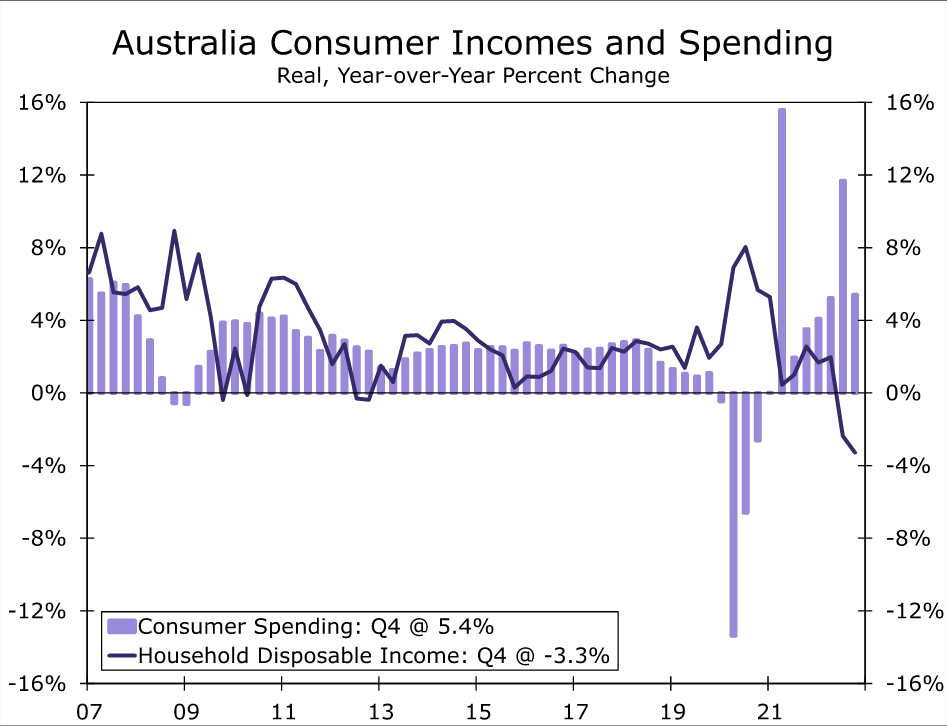
Another factor the RBA has focused on for a few months now and once again in April is trends in the outlook for consumer spending. The RBA said there is “further evidence that the combination of higher interest rates, cost-of-living pressures and a decline in housing prices is leading to a substantial slowing in household spending.” Certainly, our assessment of household sector fundamentals suggest that growth in consumer spending is likely to remain distinctly subpar. Although Australian employment trends have for the most part remained relatively steady and household incomes have risen, those income gains have not kept pace with the rate of inflation. As a result, after adjusting for higher prices, real household disposable incomes were actually down 3.3% year-over-year in Q4-2022. Those income trends are in contrast to trends in real consumer spending, which showed a gain of 5.4% in Q4. Given the underwhelming trends in real household incomes, some further slowing in consumer spending in the quarters ahead also appears likely.
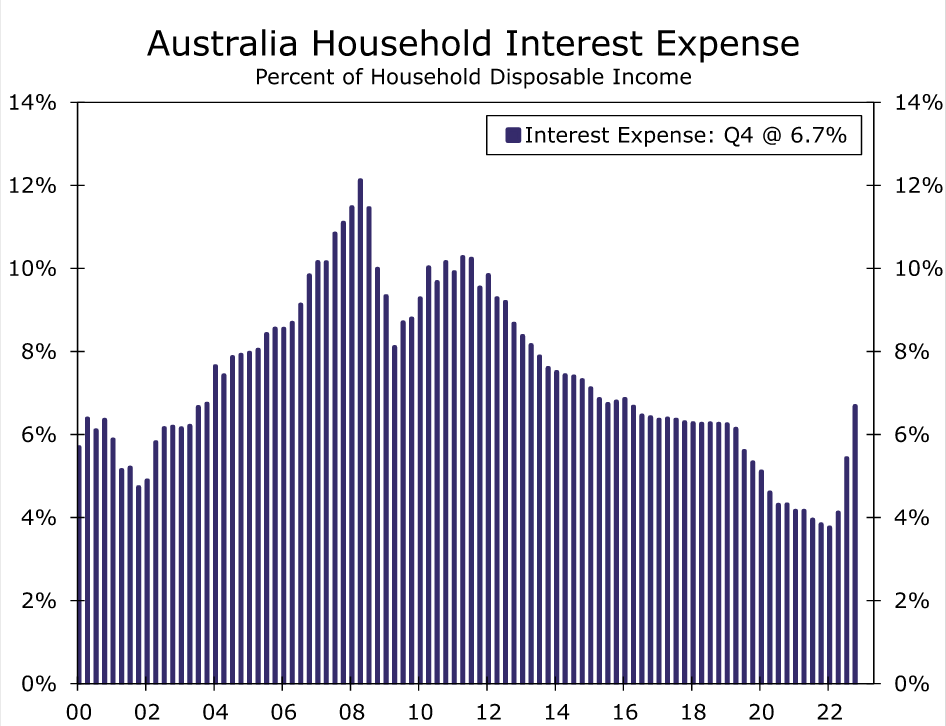
An additional factor that could be a headwind for consumer spending, as alluded to by the RBA, is the cumulative increase in interest rates so far. With a sizable portion of Australian mortgage borrowers on variable, rather than fixed rates, policy rate increases are flowing through fairly quickly to household budgets. Indeed, as a percent of disposable income, household interest expenses have already jumped to 6.7% by Q4-2022 from a low of 3.8% as recently as Q1-2022. With those interest expenses also squeezing household cash flows, they should also prove a restraining factor for consumer spending in the quarters ahead.
Overall, we believe a cautious consumer will be enough to keep the Reserve Bank of Australia on hold for the rest of 2023, at a minimum. To be fair, the RBA's April announcement also included some more hawkish elements. The central bank acknowledged that the labor market remains very tight and wage growth is firming. In addition, the RBA said it remains alert to the risk of a wage spiral and seeks to guard against higher inflation expectations becoming entrenched. In subsequent comments, RBA Governor Lowe offered comments both for and against further monetary tightening. He said “the decision to hold rates steady this month does not imply that interest rate increases are over,” but also said the RBA “is prepared to have a slightly slower return of inflation to target than some other central banks.” Overall however, after the RBA's pause and with the central bank having softened its further policy guidance to some extent, saying “some further tightening of monetary policy may well be needed to ensure that inflation returns to target”, we believe the bar is somewhat higher for the Reserve Bank of Australia to resume rate hikes. That is not a bar we expect to be met. Instead, we expect the current policy rate of 3.60% will be the peak for this cycle, and we do not expect the Reserve Bank of Australian to begin easing monetary policy until well into 2024.
Reserve Bank of New Zealand Hawkish But Nearing End of Tightening Cycle
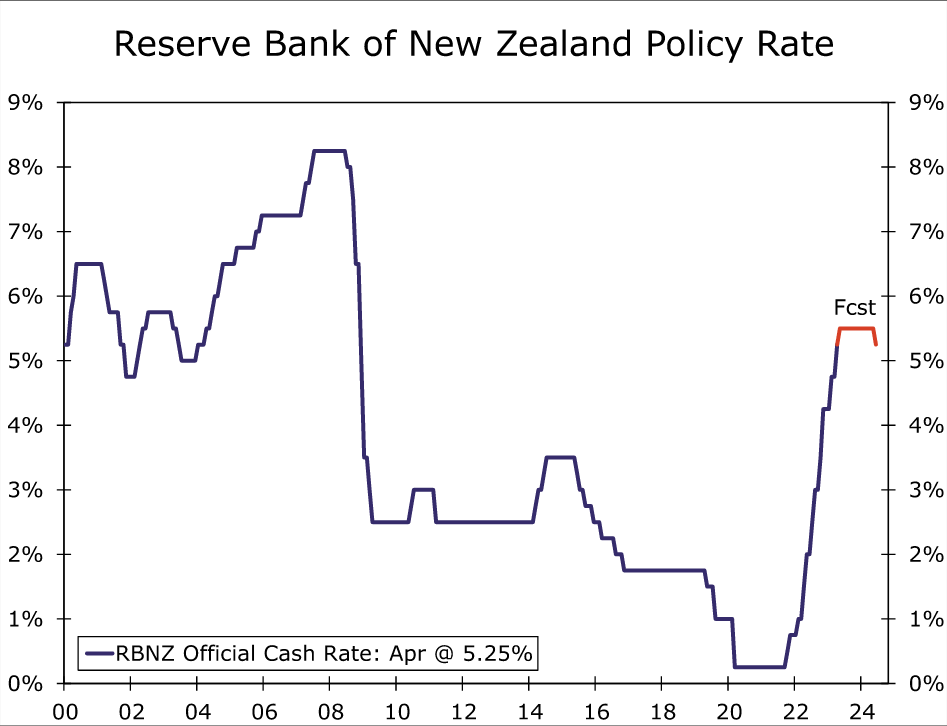
In contrast with the RBA, the Reserve Bank of New Zealand (RBNZ) was more hawkish than expected at its April monetary policy meeting. The RBNZ surprised market participants, delivering an unexpected 50 bps rate hike to 5.25%. Policymakers cited inflation is still too high and persistent, while employment is beyond its maximum sustainable level.
Taking into account the 500 bps of monetary tightening delivered so far in this tightening cycle, the RBNZ anticipates growth to slow in early 2023 but remain positive. Indeed, higher frequency monthly data for the first few months of the year has hinted at recovering growth after a negative GDP print in Q4-2022. For one, consumer spending appears to have rebounded early this year. More specifically, retail card spending, while flat in February, gained 2.6% month-over-month in January, while credit card spending jumped 5.5% and 2.7% month-over-month in January and February, respectively. In our view, resilient consumer spending should keep the economy intact enough to avoid recession this year, even as growth slows.
In addition, while sentiment indicators have not been stellar by any means, they have improved over the past few months. Business confidence, which tracks the general state of the economy as it relates to firms, increased to -43.4 in March from -70.1 in December of last year. Furthermore, PMI survey data has also improved compared to Q4. In encouraging news, the manufacturing PMI moved back into expansionary territory after spending all of Q4 in contraction, reaching 52.0 in February. Meanwhile, the services PMI remained expansionary, moving up to 55.8 from 52.0 in December.
Overall, in our view, steady growth trends in Q1 have set the backdrop for additional monetary tightening from the RBNZ. Notably, in the April announcement, the central bank said a slowdown in spending growth is necessary to return inflation to target over the medium-term. Even though recession is not the base case scenario, given the RBNZ expects a slowdown this year and also believes employment is currently beyond its maximum sustainable level, we do not think the RBNZ will shy away from hiking rates even if growth trends were to worsen.
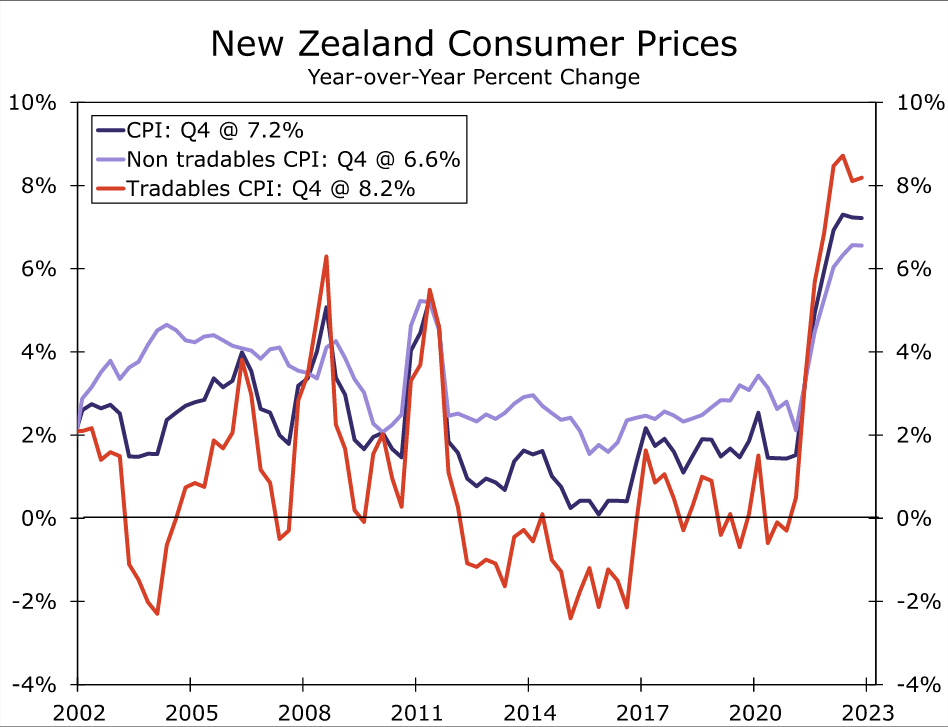
On the inflation front, consumer prices in New Zealand have not yet shown signs of receding substantially. Unlike in Australia, there is no monthly indicator for inflation, so the most recent data is from Q4-2022. At the end of last year, headline CPI remained persistently high at 7.2% year-over-year for the second quarter in a row, after peaking at 7.3% in Q2-2022. And while non-tradables (domestically-oriented) inflation was slightly more contained at 6.6%, tradables CPI was even higher than the headline rate at 8.2%, having ticked back up in Q4. With persistently high inflation in mind, the RBNZ decided on a larger-than-expected rate hike in April.
Policymakers acknowledged they are comfortable that current lending rates faced by businesses and households will help ensure core inflation and inflation expectations begin to moderate. With that said, they noted a risk scenario in which wholesale interest rates, which have fallen significantly in the last two months, could put downward pressure on these lending rates. This risk scenario led policymakers to go with a 50 bps rate hike over a 25 bps hike. In our view, this is a signal that the RBNZ is broadly comfortable with where rates are currently—and indeed, they have already noted that tightening to date implies policy is already contractionary—but they have a preference for maintaining a hawkish approach to ensure interest rates remain high enough to bring down inflation in the longer term. In essence, the central bank appears to be trying to prevent a premature pricing of monetary easing in the form of lower wholesale interest rates and ultimately lending rates for businesses and households.
All in all, we believe the RBNZ is nearing the end of its monetary tightening cycle. Looking forward, we forecast one last 25 bps rate hike in May, bringing the Official Cash Rate (OCR) to 5.50%. However, we would not rule out a larger magnitude hike, and note that the risks are tilted toward a 50 bps increase. Given the RBNZ is expecting to see continued slowing in domestic demand and a more meaningful decline in inflation, we will be closely watching the extent to which incoming growth and inflation data show signs of moderating in assessing the outlook for monetary policy beyond May.
Are Cracks Appearing in the US Labour Market? NFP Eyed for Further Evidence
We're seeing some cautious trading ahead of the jobs report on Friday, with today's jobless claims data offering signs of cracks appearing in the labour market.
That primarily came from revisions to previous figures that show a clear trend higher in claims, a trend that is likely to worsen as mass layoff announcements find their way into the data.
The next few months are likely to paint a very different picture of the labour market in the US and that could even be exacerbated by recent turbulence in the banking system.
Soon enough, the Fed will likely have an abundance of evidence that rate hikes have taken the heat out of the economy, perhaps too well. At which point the rate cuts later in the year that has been priced into markets may look increasingly likely and necessary.
Oil consolidates near winter highs
The surprise OPEC+ output cut continues to dominate price action in oil markets. The reduction was substantial but pre-emptive which has left traders questioning whether this was just a price issue or a belief that the global economy is heading for a difficult period. Crude prices have held onto the initial gains and have been in consolidation since having failed to break beyond the highs of the range they traded in from early December to mid-March.
There have been some bullish calls on oil prices but it’s worth remembering that there’s a reason oil prices were struggling to fully recover the losses in the aftermath of the banking turmoil. Tighter credit conditions mean a slower economy, even recession, and lower demand. The extent of that at this point isn’t clear though and only when it is can we properly judge what the price impact of the cuts is.
Record high ambitions for Gold bulls
The outlook for gold is closely tied to that of US yields which have fallen considerably in the aftermath of the banking turmoil and are falling once more as recession fears resurface. That’s helped propel gold above $2,000, a level above which it has only ever spent a handful of days. The yellow metal may have record-high ambitions having overcome that psychological resistance but that may depend on yields slipping further.
Whether that comes from recession fears, lower inflation, increasing labour market slack, or a combination of these, investors are becoming increasingly confident that the Fed is done and will be forced to reverse course a few times later in the year.
The Bitcoin consolidation continues
Bitcoin has been consolidating for a few weeks now after surging amid the banking mini-crisis. That it’s managed to hold those gains for this long is encouraging, even if the trigger for the initial rally isn’t particularly clear and certain explanations hopeful to put it lightly. Still, it continues to trade not far from $30,000 and a break above here would be a big psychological boost.
Dangerously Slow US Economy
This week’s PMI business activity figures were much weaker than expected, reflecting the impact of the sharpest monetary tightening in more than 40 years on the economy.
The ISM’s service sector data attracts the most interest from market participants as it represents the broadest sector of the economy. The index fell from 55.1 to 51.2 in March, against expectations for a drop to 54.3. Readings above 50 reflect an overall activity increase, but the pace of expansion has slowed sharply after a rise in January and February.
The index was dragged by a sharp fall in new orders: The export orders component fell by 18 points, while the New Orders component lost 10.4 points. Only the inventories component rose, but this is a questionable positive as it could reflect overstocking in the face of falling demand. And this hypothesis is supported by a sharp fall in new orders.
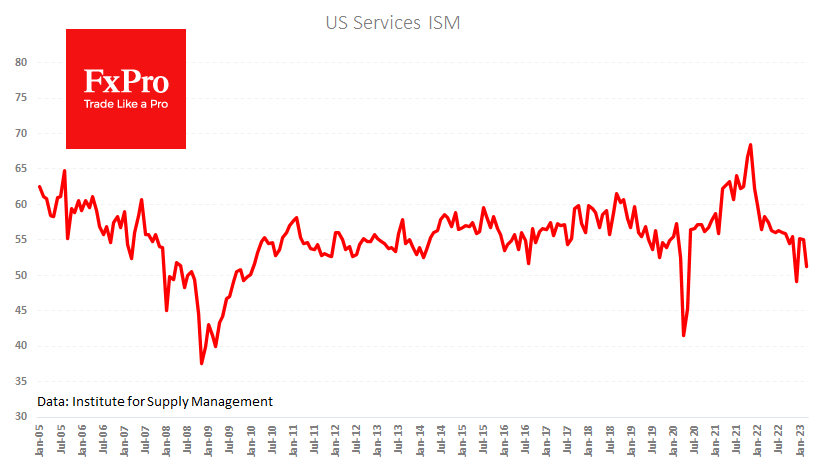
Ahead of the NFP, we also look at the employment component, which at 51.3, is also scrambling for growth territory.
The ISM manufacturing index published earlier in the week painted an even more dramatic picture, falling to a near three-year low of 46.3, with the employment component deepening further into contraction territory.
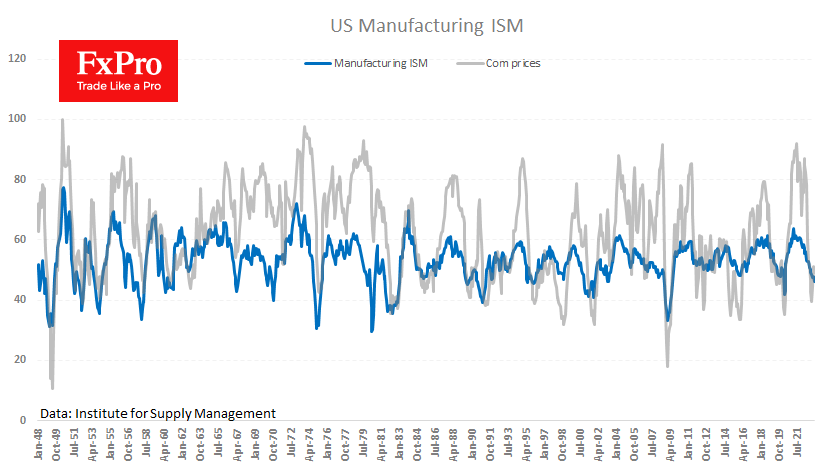
Both indices were much weaker than expected, as were the S&P Global PMI estimates. Such data does not provide a positive signal ahead of Friday’s NFP.
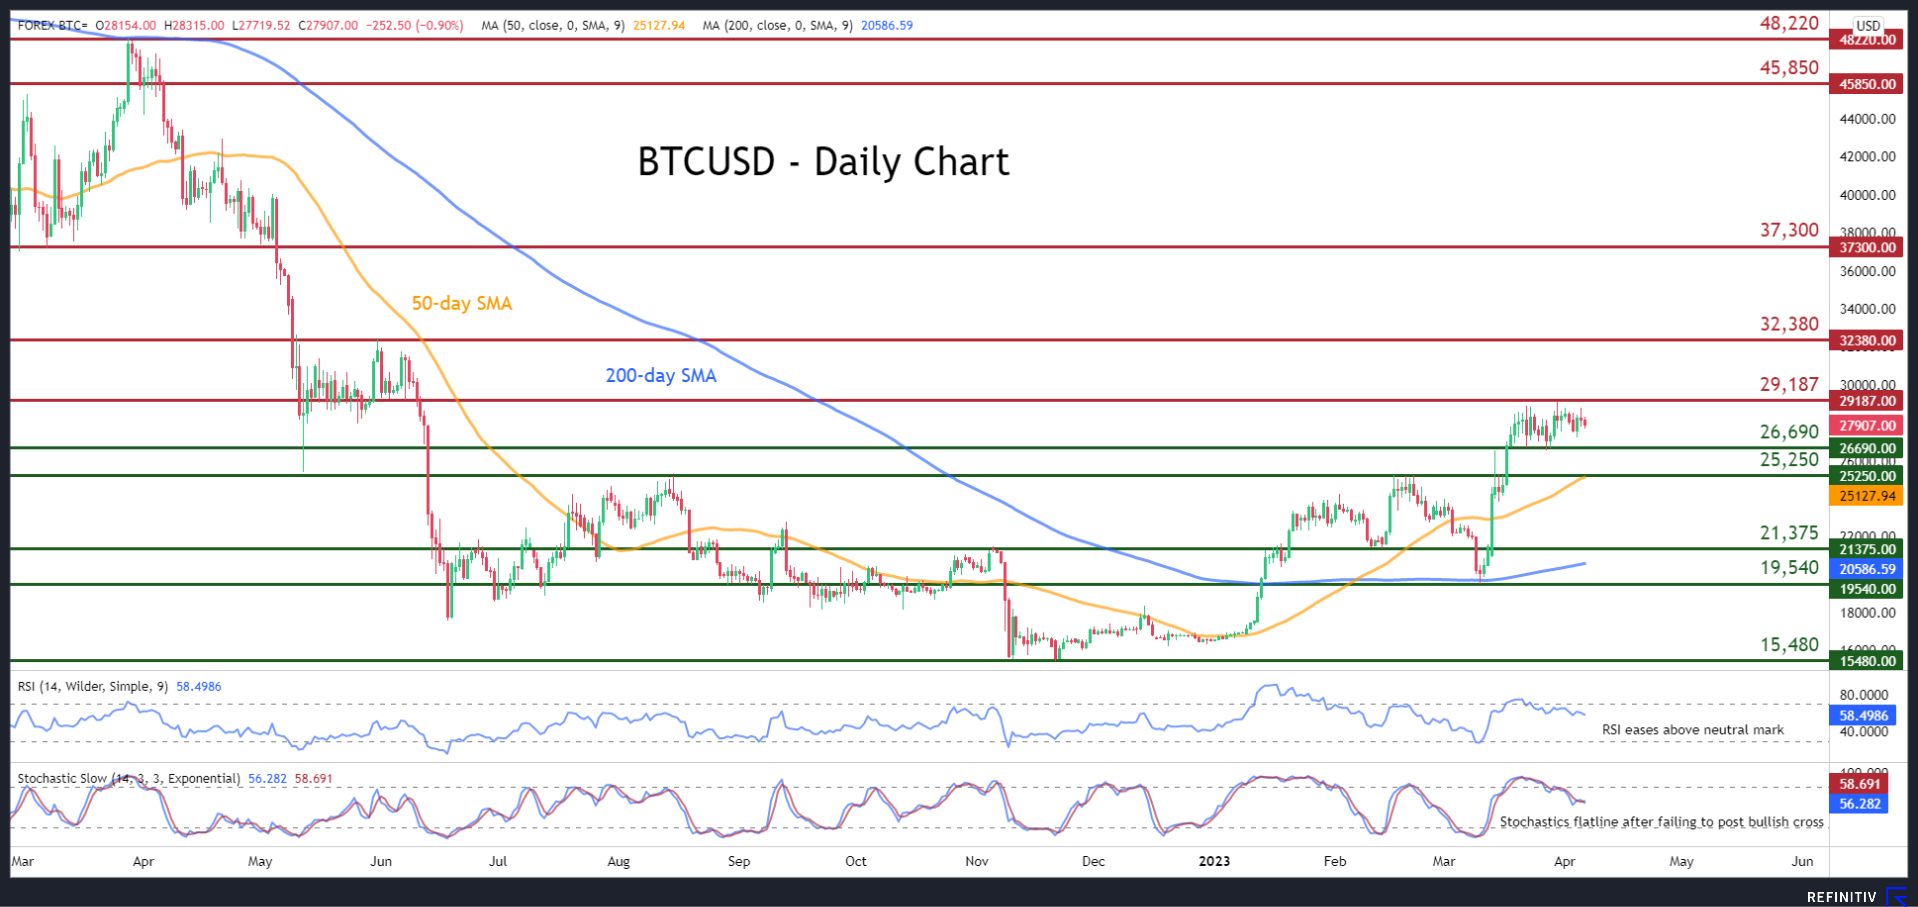
BTCUSD Extends Sideways Move Around 28,000
BTCUSD experienced a remarkable surge in 2023, storming to a fresh nine-month high of 29,187 in mid-March. However, the king of cryptocurrencies has repeatedly failed to advance higher, with the price trading within a tight range for the past 20 days.
The momentum indicators are currently reflecting a cautiously positive near-term tone. Specifically, the RSI is ticking downwards above its 50-neutral mark, while the stochastic oscillator has flatlined in the positive zone after failing to complete a bullish cross.
Should buying pressures persist, the price could initially test the nine-month high of 29,187. Surpassing that zone, the spotlight could turn to the May resistance of 32,380. Even higher, the 37,150 barrier could prove to be a tough obstacle for the price to overcome.
On the flipside, if sellers re-emerge and push the price lower, immediate support could be found at 26,690, which is the lower end of the recent rangebound pattern. Should that floor collapse, the bears could aim for the previous resistance of 25,250, which lies very close to the ascending 50-day simple moving average (SMA). A break below that level could open the door for the February bottom of 21,375.
In brief, BTCUSD appears to be in a consolidation phase, waiting for developments that could provide fresh directional impetus. Hence, a break above or below the tight range could be followed by a significant move in the same direction.
EUR/AUD Nearing August 2021 Highs Resistance
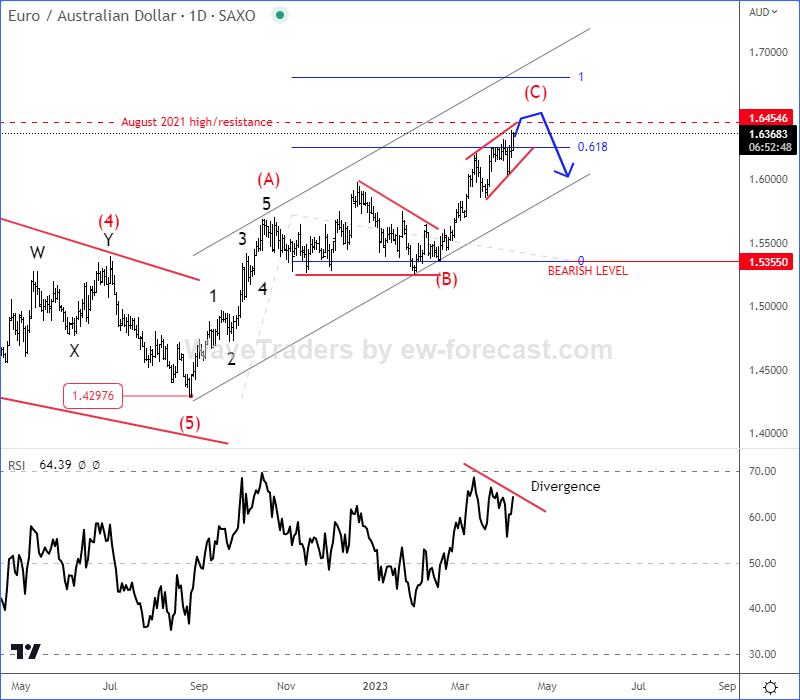
EURAUD is making a higher degree wave (A)-(B)-(C) corrective rally after potentially completing the leading diagonal at 1.43 area in summer 2022. We are actually already tracking wave (C) with room up to August 2021 highs and 1.64 - 1.68 area to complete a five-wave cycle of the lower degree, possibly even with an ending diagonal (wedge) pattern. So, resistance may not be far away, especially if we consider RSI bearish divergence. But, to confirm resistance in place and bears back in the game, we need to see sharp or impulsive reversal down back below 1.5355 bearish confirmation level.