Sample Category Title
EUR/CHF Daily Outlook
Daily Pivots: (S1) 0.9863; (P) 0.9897; (R1) 0.9925; More...
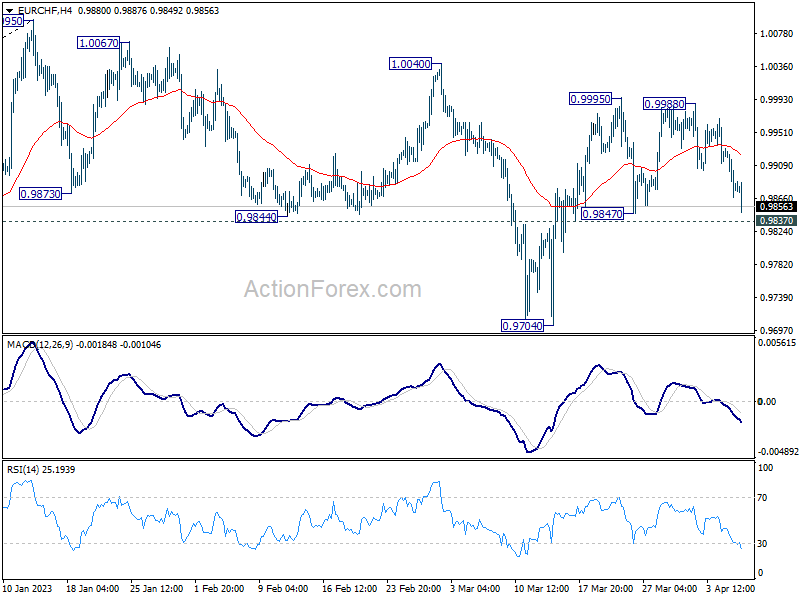
EUR/CHF is staying above 0.9837 minor support despite today's decline. Intraday bias stays neutral and another rise is in favor. Break of 0.9995 resistance will resume the rebound from 0.9704 to retest 1.0067 high. However, break of 0.9837 will dampen this bullish view and turn bias back to the downside for 0.9704 support instead.
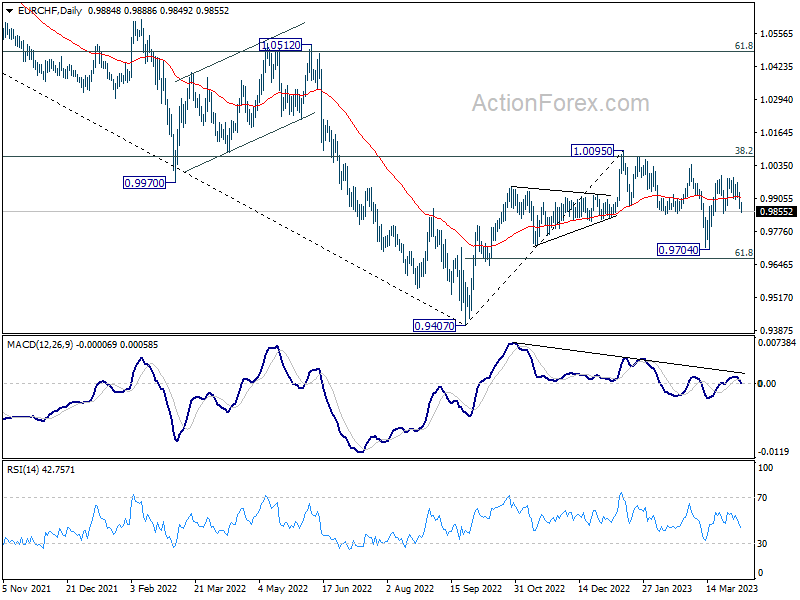
In the bigger picture, prior rejection by 55 week EMA (now at 1.1002) and 38.2% retracement of 1.1149 to 0.9407 at 1.0072 suggests that medium term outlook is staying bearish. That is, down trend from 1.2004 is not completed yet and is in favor to resume through 0.9407 at a later stage. However, decisive break of 1.0095 resistance will raise the chance of bullish trend reversal. Rise from 0.9407 should then target 1.0505 cluster resistance (2020 low at 1.0505, 61.8% retracement of 1.1149 to 0.9407 at 1.1484).
WTI Oil Futures Need to Breach $83 to Brighten Outlook
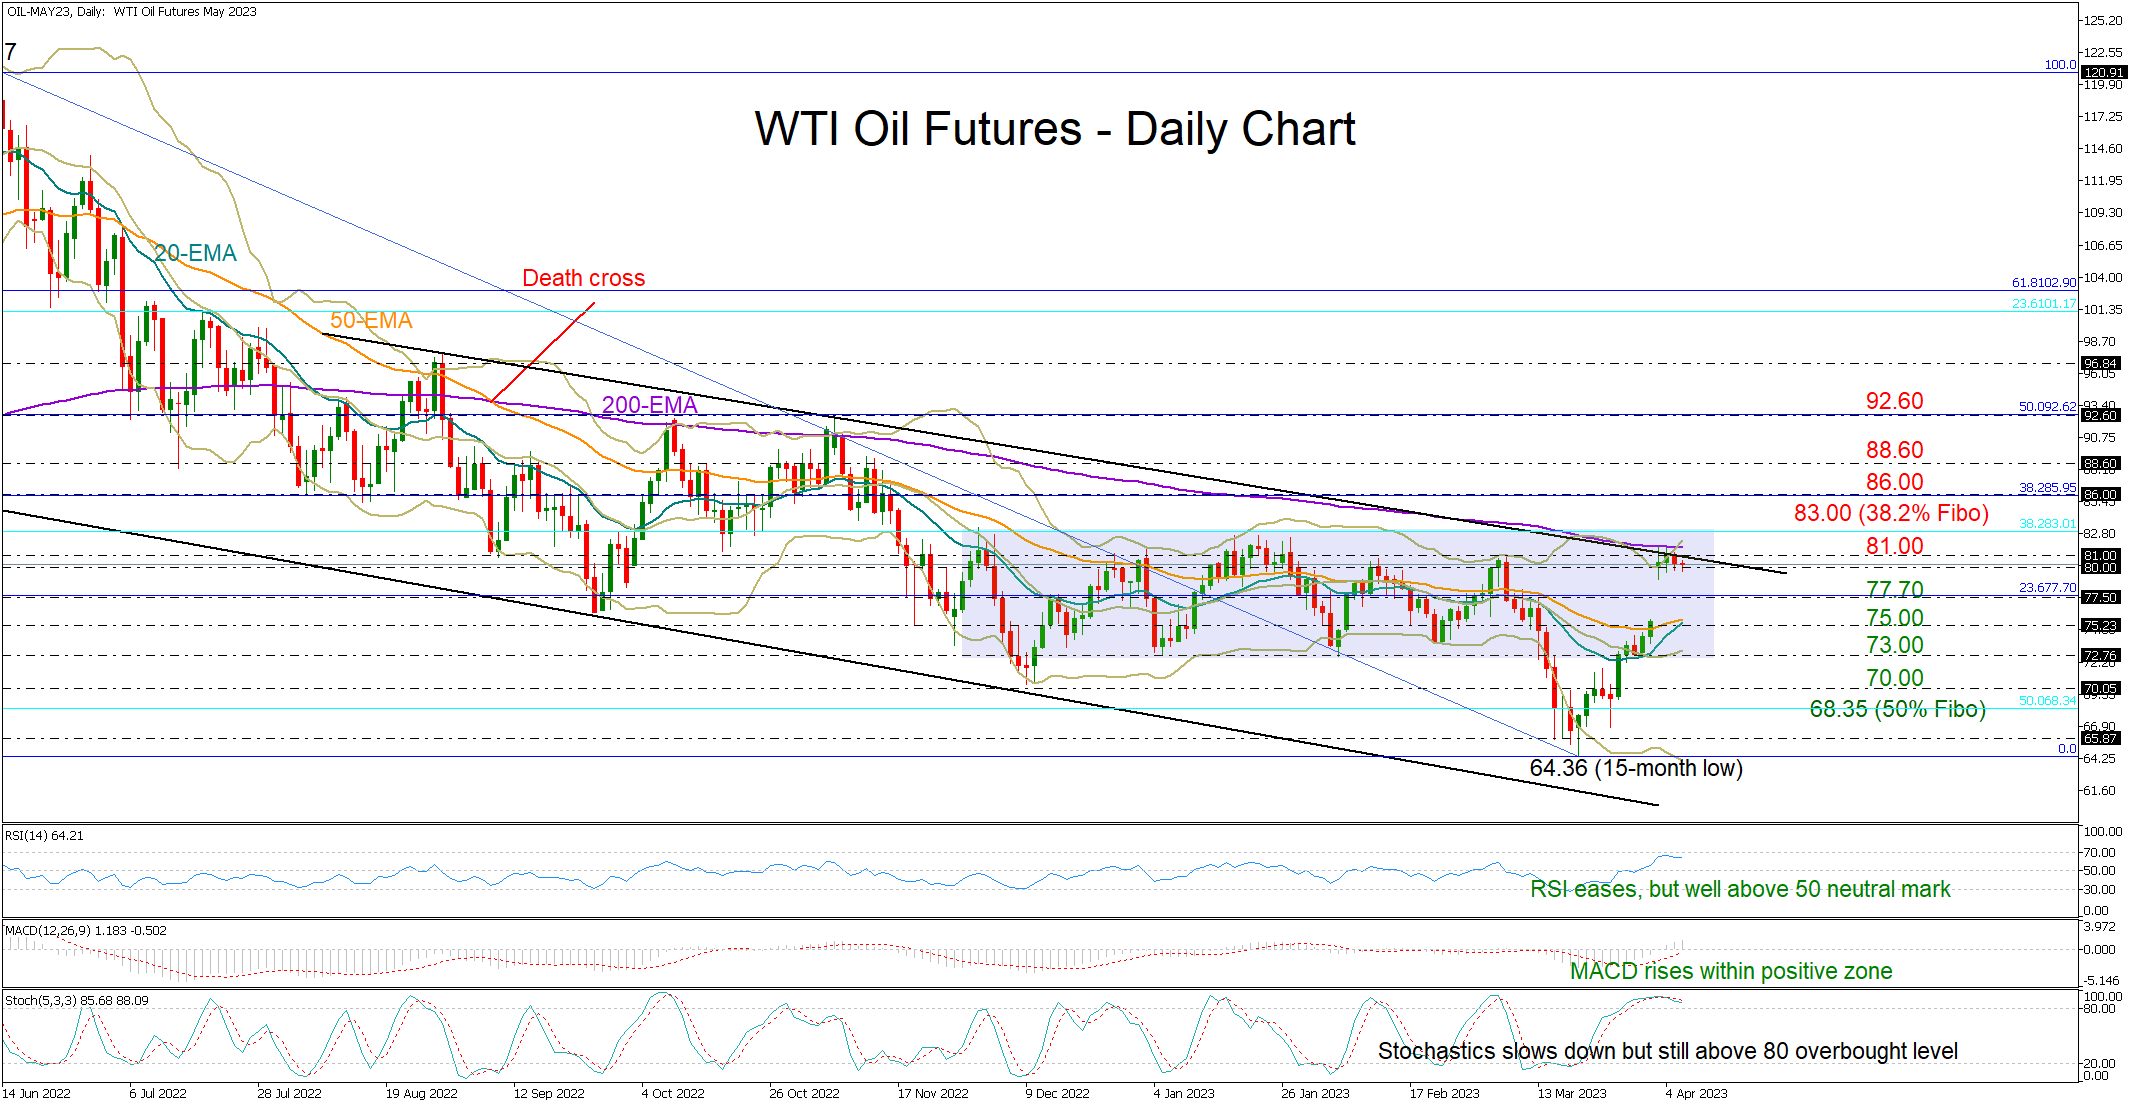
WTI oil futures have been tiptoeing sideways along the upper boundary of the seven-month-old bearish channel and within a tight range of $79.00-$81.00 so far this week.
The trend signals are still discouraging as the price has been struggling to post new higher highs above the $81.00-$83.00 ceiling since the start of the year, while the exponential moving averages (EMAs) have yet to print bullish crosses yet, endorsing the broad negative trajectory in the market.
On the other hand, the momentum indicators are in favor of the bulls. The slowdown in the stochastic oscillator is mirroring some weakness in buying appetite as the price is trading near the upper Bollinger band. Yet, the indicator has not slipped below its 80 overbought level yet, while the RSI and the MACD remain elevated within the bullish region, keeping the short-term bias on the positive side.
Should the bulls claim the $81.00-$83.00 zone, which encapsulates the 38.2% Fibonacci retracement of the 2020-2022 uptrend, the price could crawl up to the $86.00 barrier. An extension higher could find resistance near the $88.60 handle, while a steeper increase could head for the October-November bar of $92.60.
In the event sellers push below $80.00, support could initially develop around the former resistance zone of $77.70. Beyond that, the 20- and 50-day EMAs may attract some attention within the $75.00 territory before the focus turns again to the range’s bottom seen around 73.00.
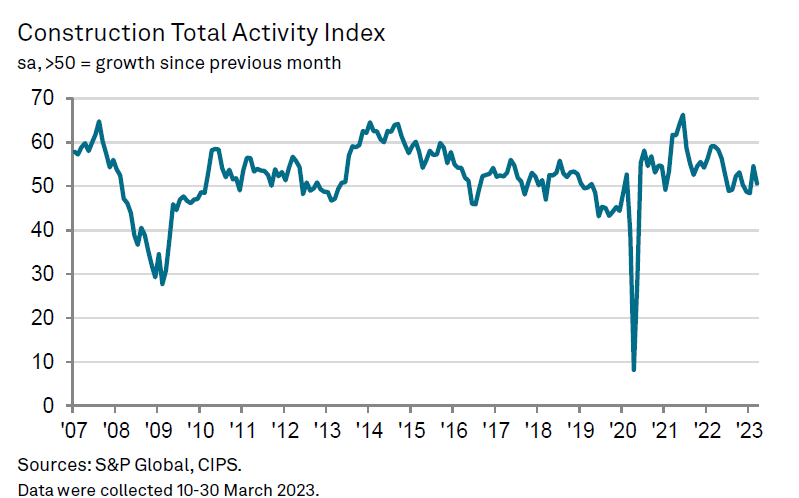
UK PMI construction dropped to 50.7, mixed fortunes in the sector
UK PMI Construction dropped from 54.6 to 50.7 in March, below expectation of 53.6, indicating a mixed picture for the industry.
Tim Moore, Economics Director at S&P Global Market Intelligence, explained that civil engineering and commercial projects saw a sustained rebound in output levels and improved tender opportunities, leading to the strongest rate of job creation in five months.
However, a sharp decline in house building raised concerns, as subdued demand and rising interest rates contributed to the steepest fall in housing activity in almost three years.
Despite these challenges, overall expectations for construction output in the coming year remain positive, with survey respondents citing improved availability of construction inputs and expectations for moderating purchasing price inflation.
USD/CAD Daily Outlook
Daily Pivots: (S1) 1.3428; (P) 1.3455; (R1) 1.3485; More....
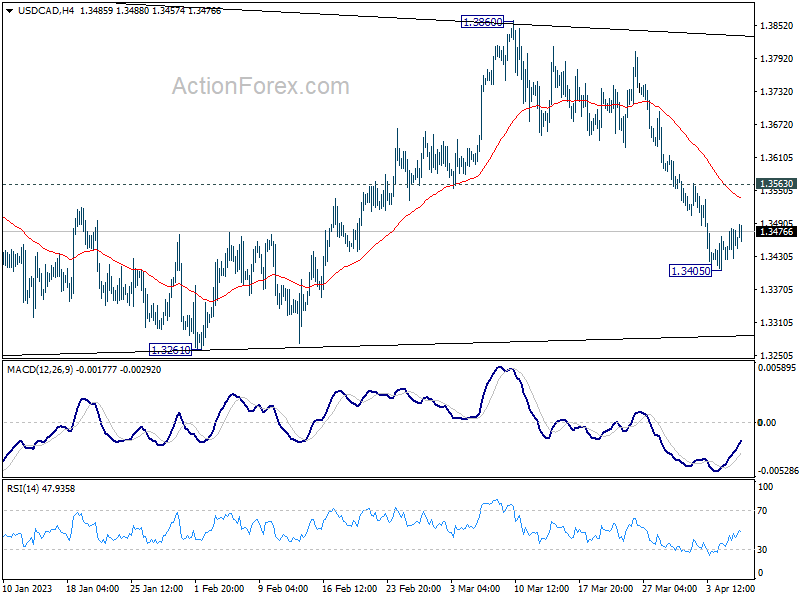
Intraday bias in USD/CAD remains neutral for consolidation above 1.3405 temporary low. Upside of recovery should be limited by 1.3563 resistance to bring another fall. Break of 1.3405 will resume the decline from 1.3860, as the third leg of the corrective pattern from 1.3976, to 1.3224/61 support zone. Strong support should be seen around there to bring rebound.
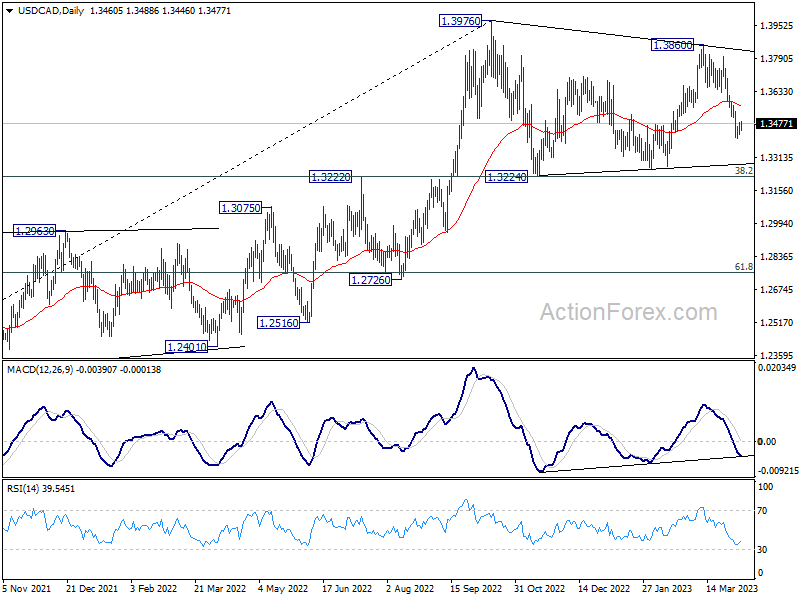
In the bigger picture, the up trend from 1.2005 (2021 low) is still in progress. Break of 1.3976 will confirm resumption and target 61.8% projection of 1.2401 to 1.3976 from 1.3261 at 1.4234. Firm break there will pave the way to long term resistance zone at 1.4667/89 (2016, 2020 highs). On the downside, sustained break of 55 week EMA (now at 1.3282) is needed to confirm medium term topping. Otherwise, outlook will remain bullish even in case of deep pull back.
AUD/USD Daily Report
Daily Pivots: (S1) 0.6674; (P) 0.6724; (R1) 0.6771; More...
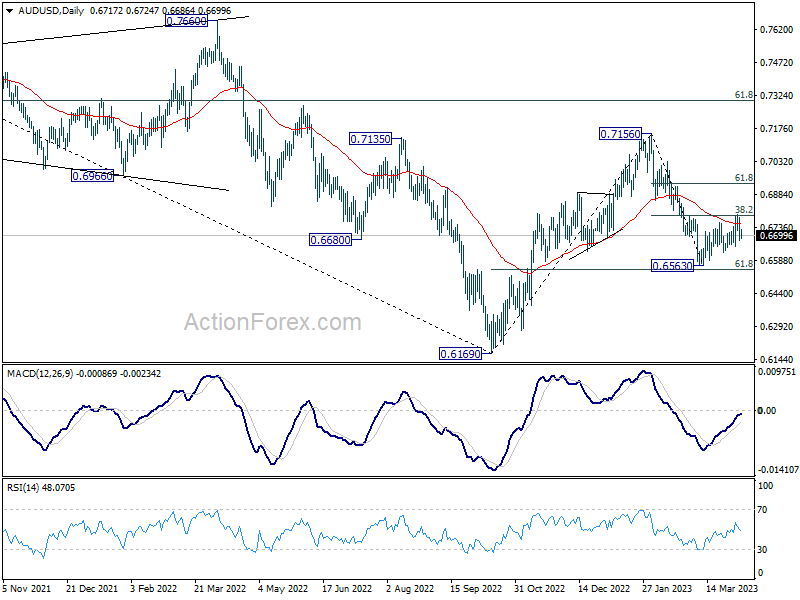
Intraday bias in AUD/USD remains neutral for the moment. On the upside, sustained break of 38.2% retracement of 0.7156 to 0.6563 at 0.6790 will pave the way to 61.8% retracement at 0.6929. However, break of 0.6650 support will turn bias back to the downside for 0.6563 low again.
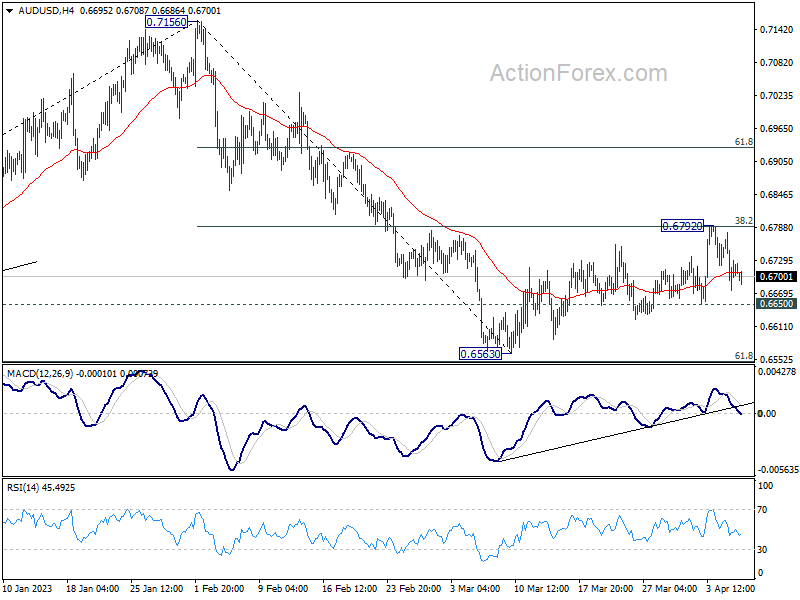
In the bigger picture, as long as 61.8% retracement of 0.6169 to 0.7156 at 0.6546 holds, the decline from 0.7156 is seen as a correction to rally from 0.6169 (2022 low) only. Another rise should still be seen through 0.7156 at a later stage. However, sustained break of 0.6546 will raise the chance of long term down trend resumption through 0.6169 low.
EUR/USD Daily Outlook
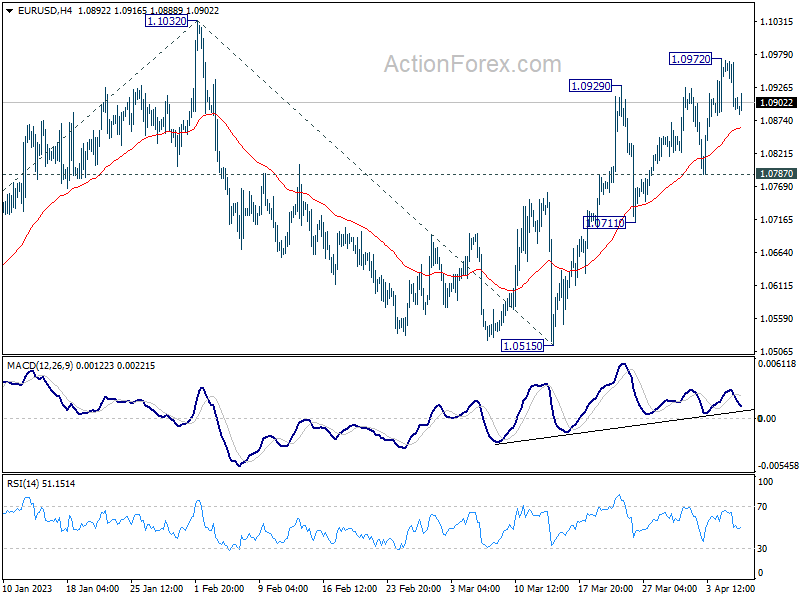
Daily Pivots: (S1) 1.0875; (P) 1.0923; (R1) 1.0954; More...
A temporary top was formed at 1.0972 and intraday bias in EUR/USD is turned neutral first. Further rise is expected as long as 1.0787 support holds. Above 1.0972 will resume the rally from 1.0515 to retest 01.1032 high. Firm break there will resume larger up trend from 0.9534. However, break of 1.0787 will turn bias back to the downside for 1.0711 support instead.
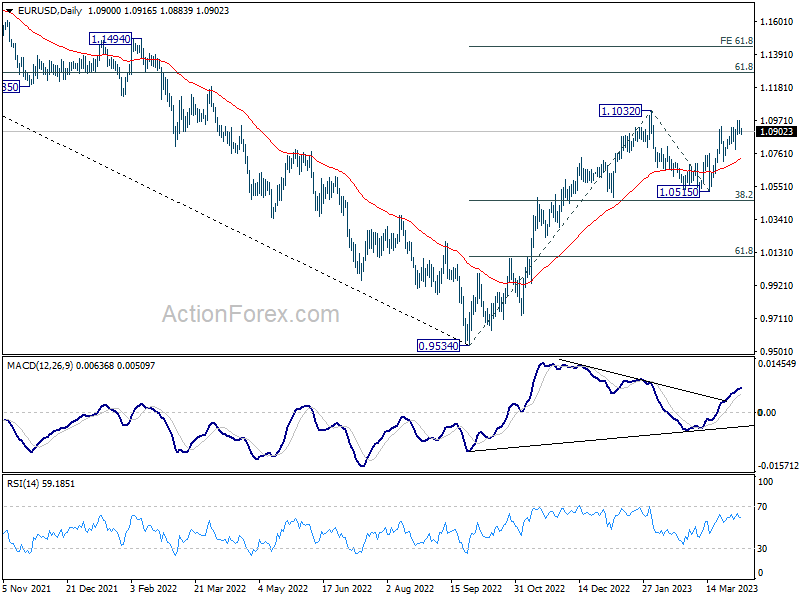
In the bigger picture, rise from 0.9534 (2022 low) is in progress with 38.2% retracement of 0.9534 to 1.1032 at 1.0460 intact. The strong support from 55 week EMA (now at 1.0625) was also a medium term bullish sign. Next target is 61.8% retracement of 1.2348 (2021 high) to 0.9534 at 1.1273. Sustained break there will solidify the case of bullish trend reversal and target 1.2348 resistance next (2021 high).
GBP/USD Daily Outlook
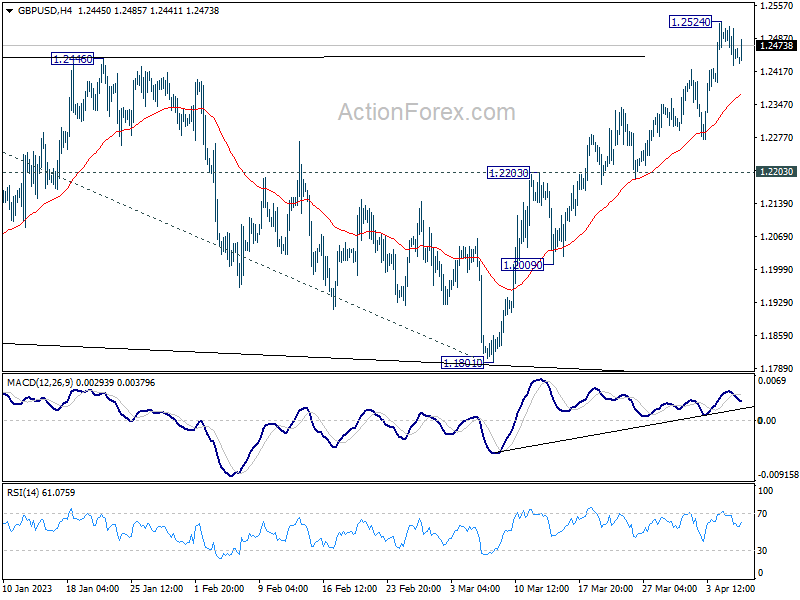
Daily Pivots: (S1) 1.2425; (P) 1.2469; (R1) 1.2506; More...
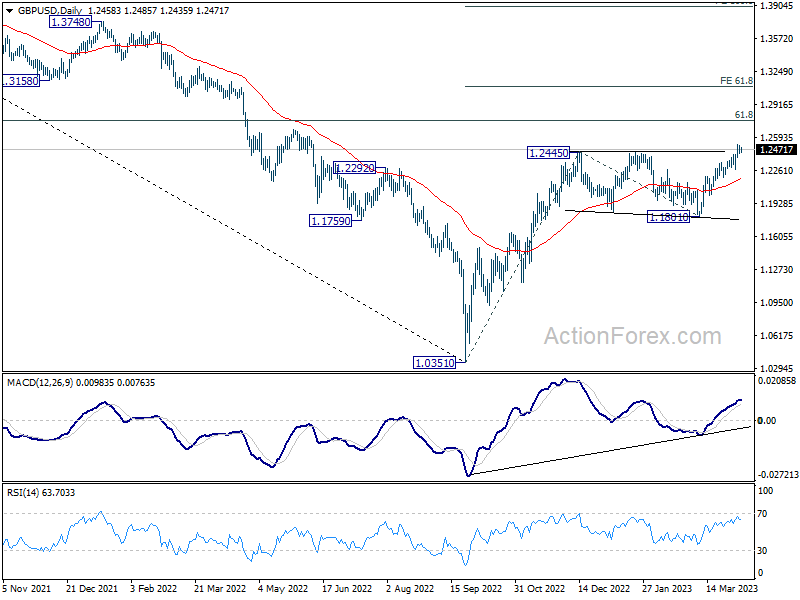
A temporary top is formed at 1.2524 and intraday bias in GBP/USD is turned neutral first. Some consolidations would be seen but downside of retreat should be contained above 1.2203 resistance turned support to bring another rally. Break of 1.2524 will target 1.2759 fibonacci level first. Firm break there will target 61.8% projection of 1.0351 to 1.2445 from 1.1801 at 1.3095.
In the bigger picture, the rise from 1.0351 medium term term bottom (2022 low) is in progress for 61.8% retracement of 1.4248 (2021 high) to 1.0351 at 1.2759. Sustained break there will add to the case of long term bullish trend reversal. Further break of 61.8% projection of 1.0351 to 1.2445 from 1.1801 at 1.3095 could prompt upside acceleration to 100% projection at 1.3895. For now, this will remain the favored case as long as 1.1801 support holds, even in case of deep pull back.
USD/CHF Daily Outlook
Daily Pivots: (S1) 0.9029; (P) 0.9053; (R1) 0.9090; More...
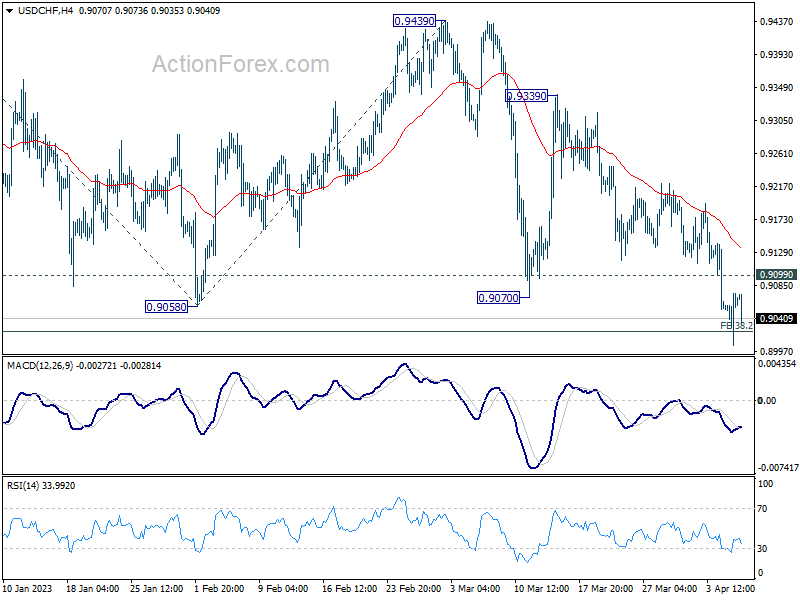
Intraday bias in USD/CHF remains on the downside for the moment. Sustained trading below 38.2% projection of 1.0146 to 0.9058 from 0.9439 at 0.9023 will extend the down trend from 1.0146 to 61.8% projection at 0.8767. On the upside, above 0.9099 minor resistance will turn intraday bias neutral and bring consolidations first, before staging another decline.
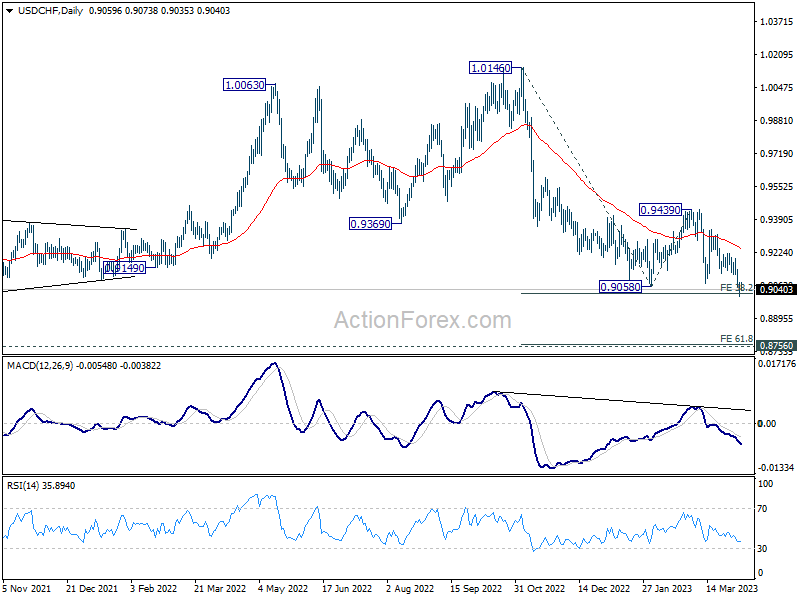
In the bigger picture, outlook will stay bearish as long as 0.9439 resistance holds, and fall from 1.1046 (2022 high) is still in progress. Prior rejection by 55 week EMA was a medium term bearish sign. Sustained of 0.9058 will resume such decline towards 0.8756 support (2021 low). But overall, this fall is still as a leg in the long term range pattern from 1.0342 (2016 high). So, downside should be contained by 0.8756 to bring reversal.
GBP/USD: Limited Dips Keep Larger Bulls Intact
Cable regained traction in early Thursday’s trading, underpinned by better than expected UK housing data, reducing immediate risk of deeper pullback after Wednesday’s close in red.
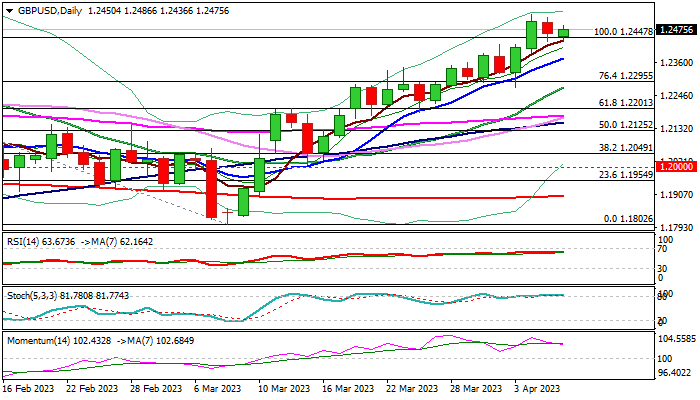
The pair hit new multi-week high (1.2525) following break of key resistance at 1.2447 (Dec 14 / Jan 23) on Tuesday, but overbought conditions temporarily slowed bulls.
Broken 1.2447 barrier reverted to solid support which is so far holding and keeping larger bulls intact, despite initial signals of correction (overbought stochastic / fading bullish momentum on daily chart).
Sterling enjoys strong support from weakening dollar, hit by much weaker than expected data from the US labor and services sectors, which further soured sentiment and added to expectations that the Fed would slow the pace of policy tightening.
Markets eye US weekly jobless claims (today) and non-farm payrolls (Friday) for more direction signals, with lower volumes on Good Friday holiday, likely to increase market volatility.
Bulls look for weekly close above 1.2447 pivot to confirm signal of bullish continuation, which would expose targets at 1.2659/66 (May 2022 double-top) and 1.2759 (Fibo 61.8% of 1.4249/1.0348 fall) in extension.
Caution on firm break of 1.2447 support which would signal pullback and sideline immediate bulls.
Res: 1.2525; 1.2535; 1.2600; 1.2694
Sup: 1.2447; 1.2394; 1.2373; 1.2354
Gold Continues Higher
NZD/USD seeks support
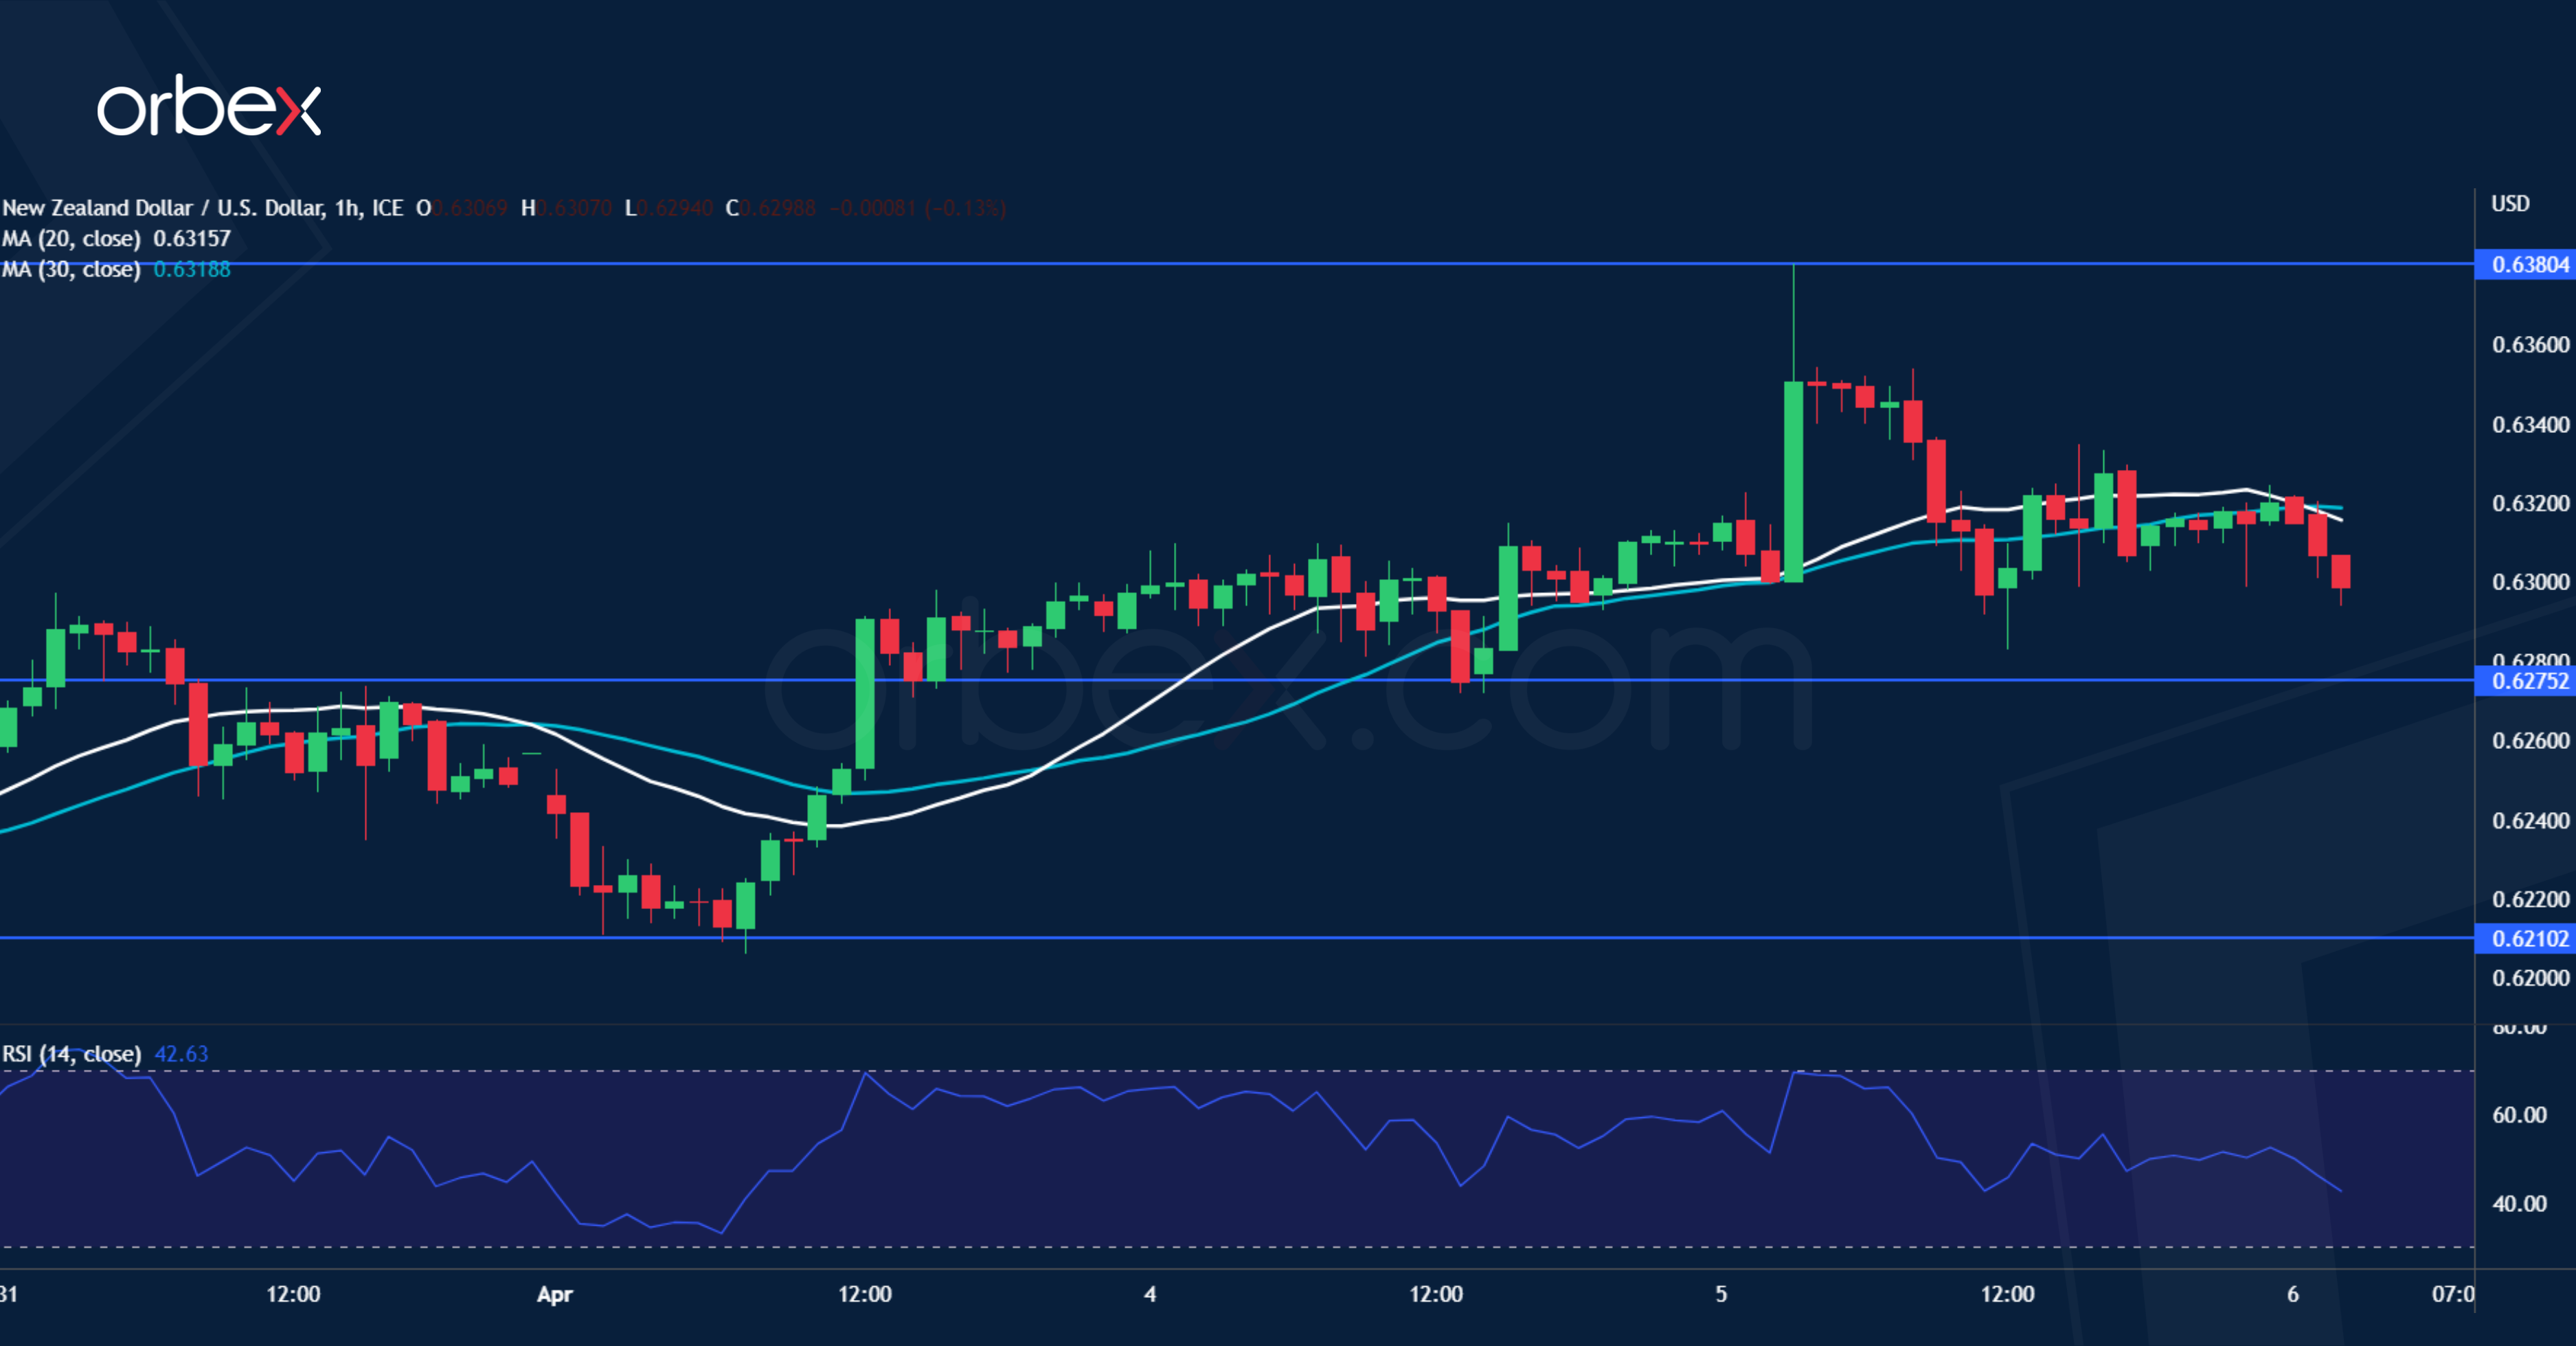
The New Zealand dollar jumped after an unexpected 50-basis point rate hike from the RBNZ. The latest surge came to a halt in the demand-turned-supply zone 0.6380-0.6390, suggesting that there is still strong enough selling pressure in spite of a choppy rally. Short-term buyers’ profit-taking has pulled the kiwi to 0.6275, a key support to keep the momentum going. Its breach would cause a revisit of 0.6210 on the 20- day SMA where a breakout could open the door to a bearish continuation in the medium-term.
XAU/USD aims at 13-month high
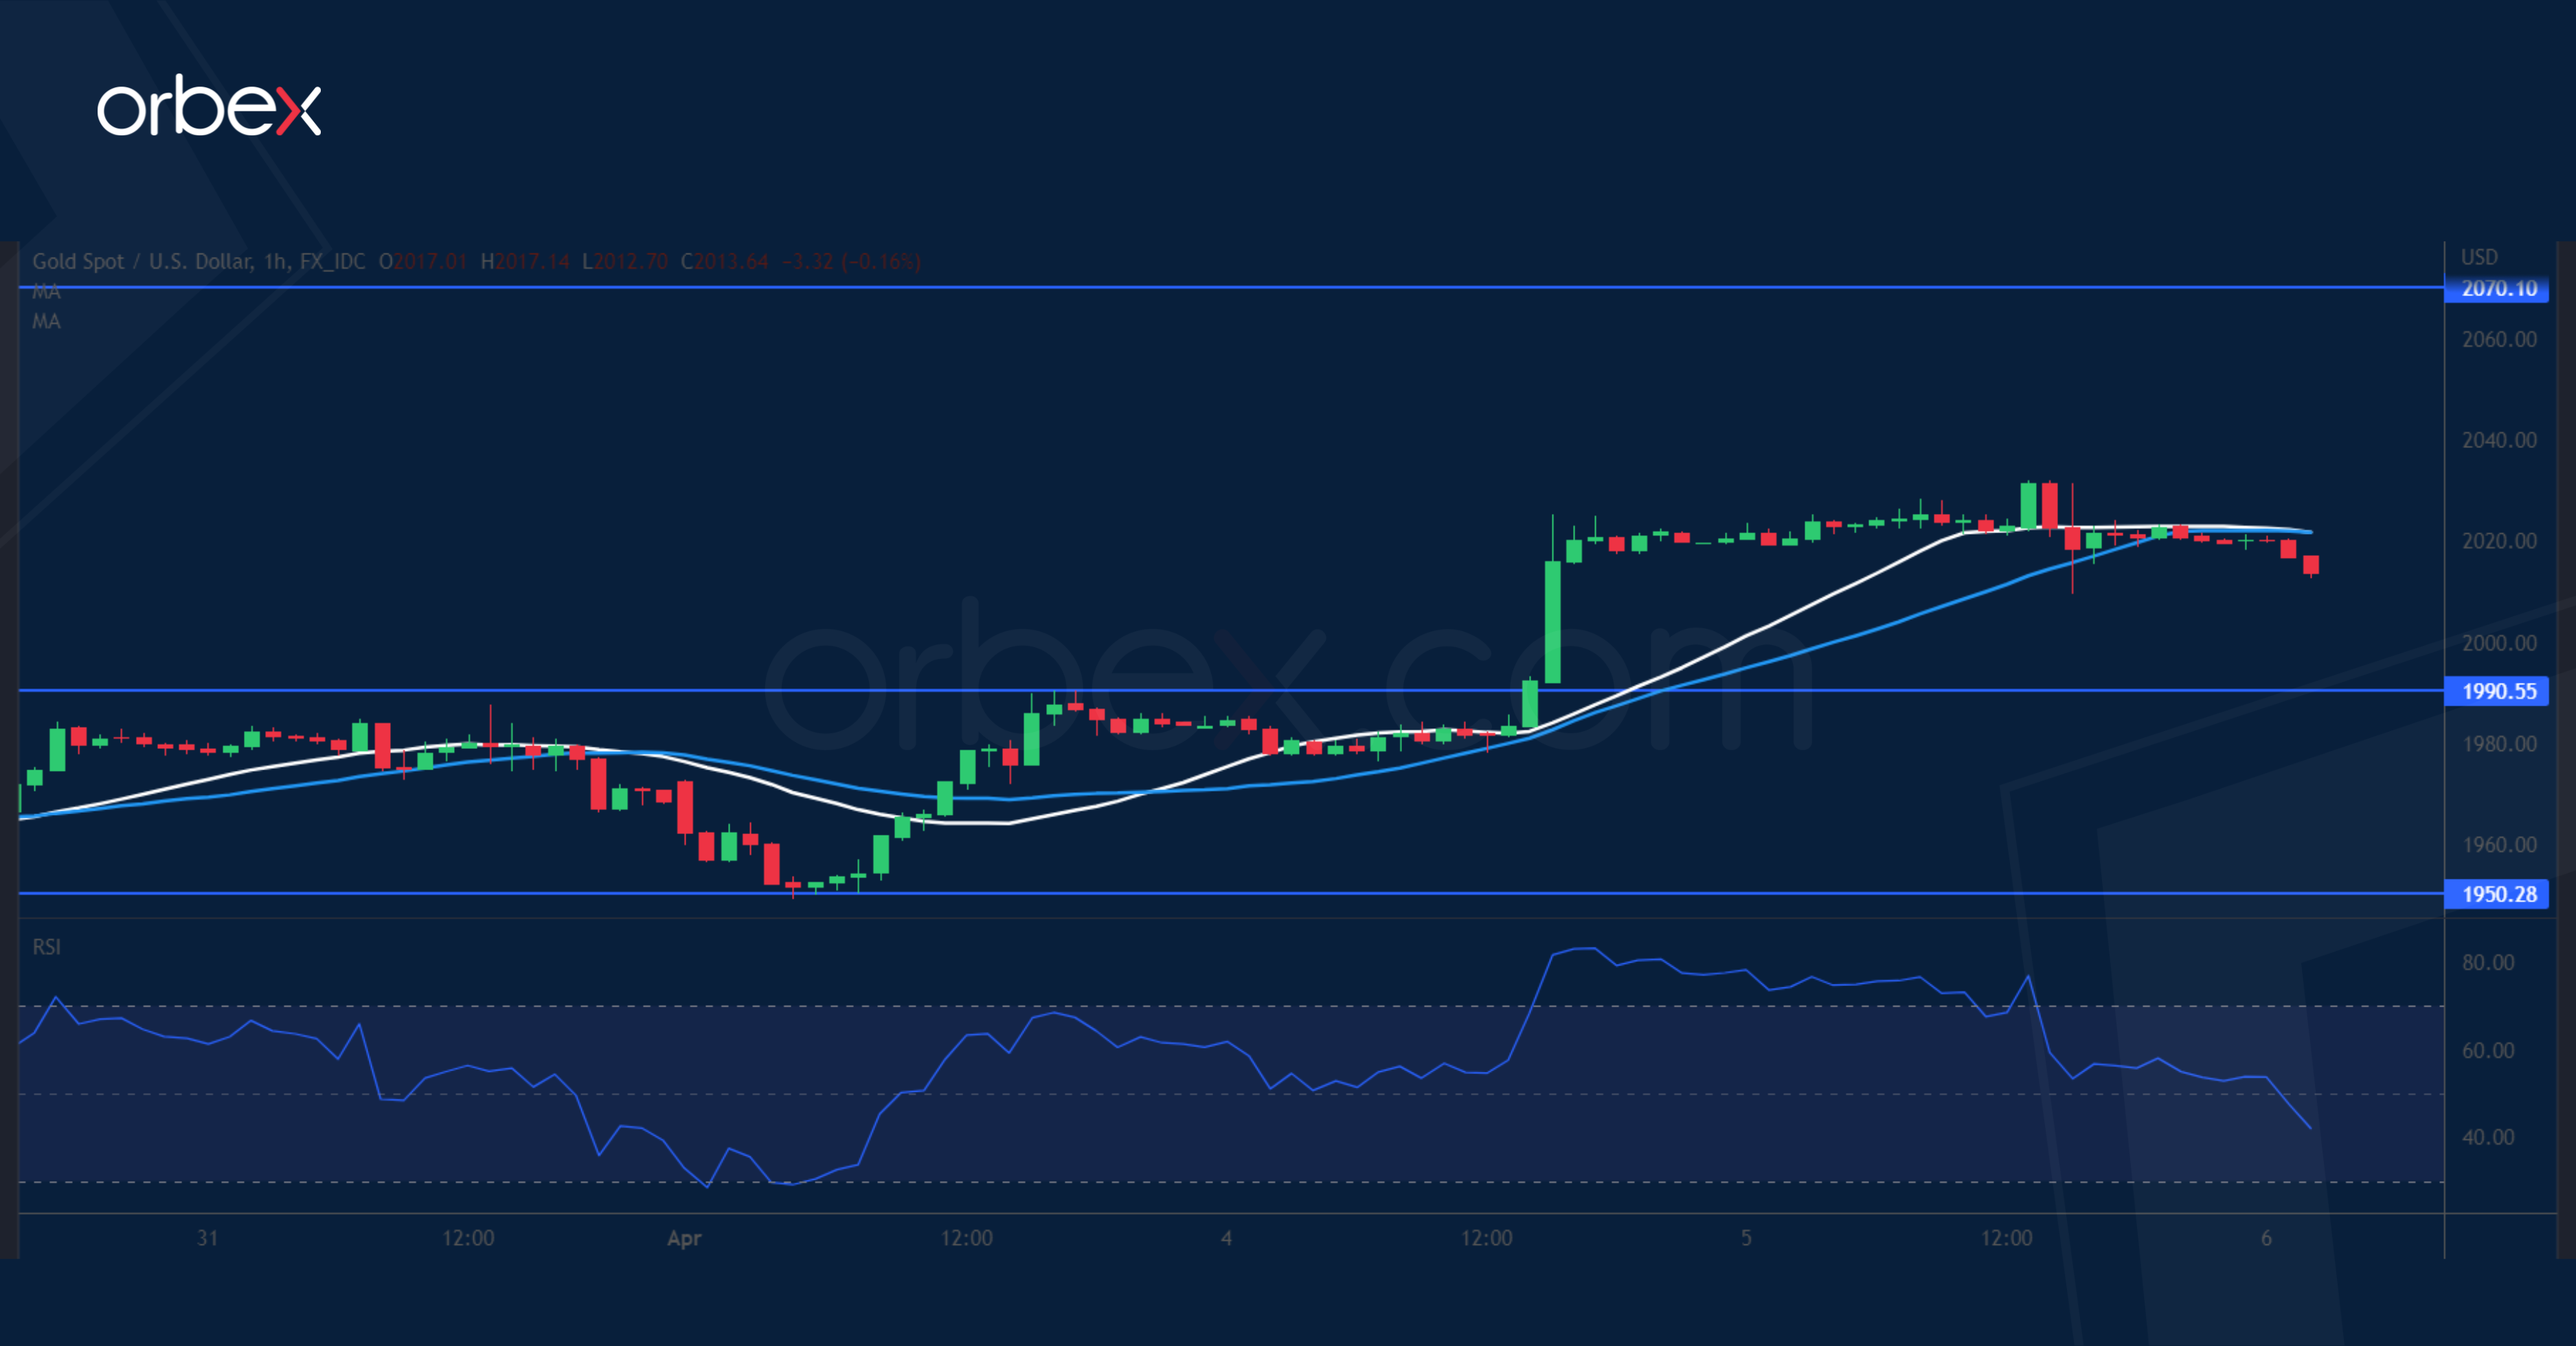
Safe haven gold rises on worries of an economic slowdown. Following a brief consolidation, a pop above the psychological level of 2000 started a new round of rally. As sentiment remains overwhelmingly bullish, the March 2022 high of 2070 would be the next target. The RSI’s overbought situation may temporarily drag the price down but more buyers could be looking to stake in near the previous supply zone around 1990-2000. 1950 on the 20-day SMA would be the bulls’ second line of defence in case of a deeper pullback.
UK 100 consolidates gains
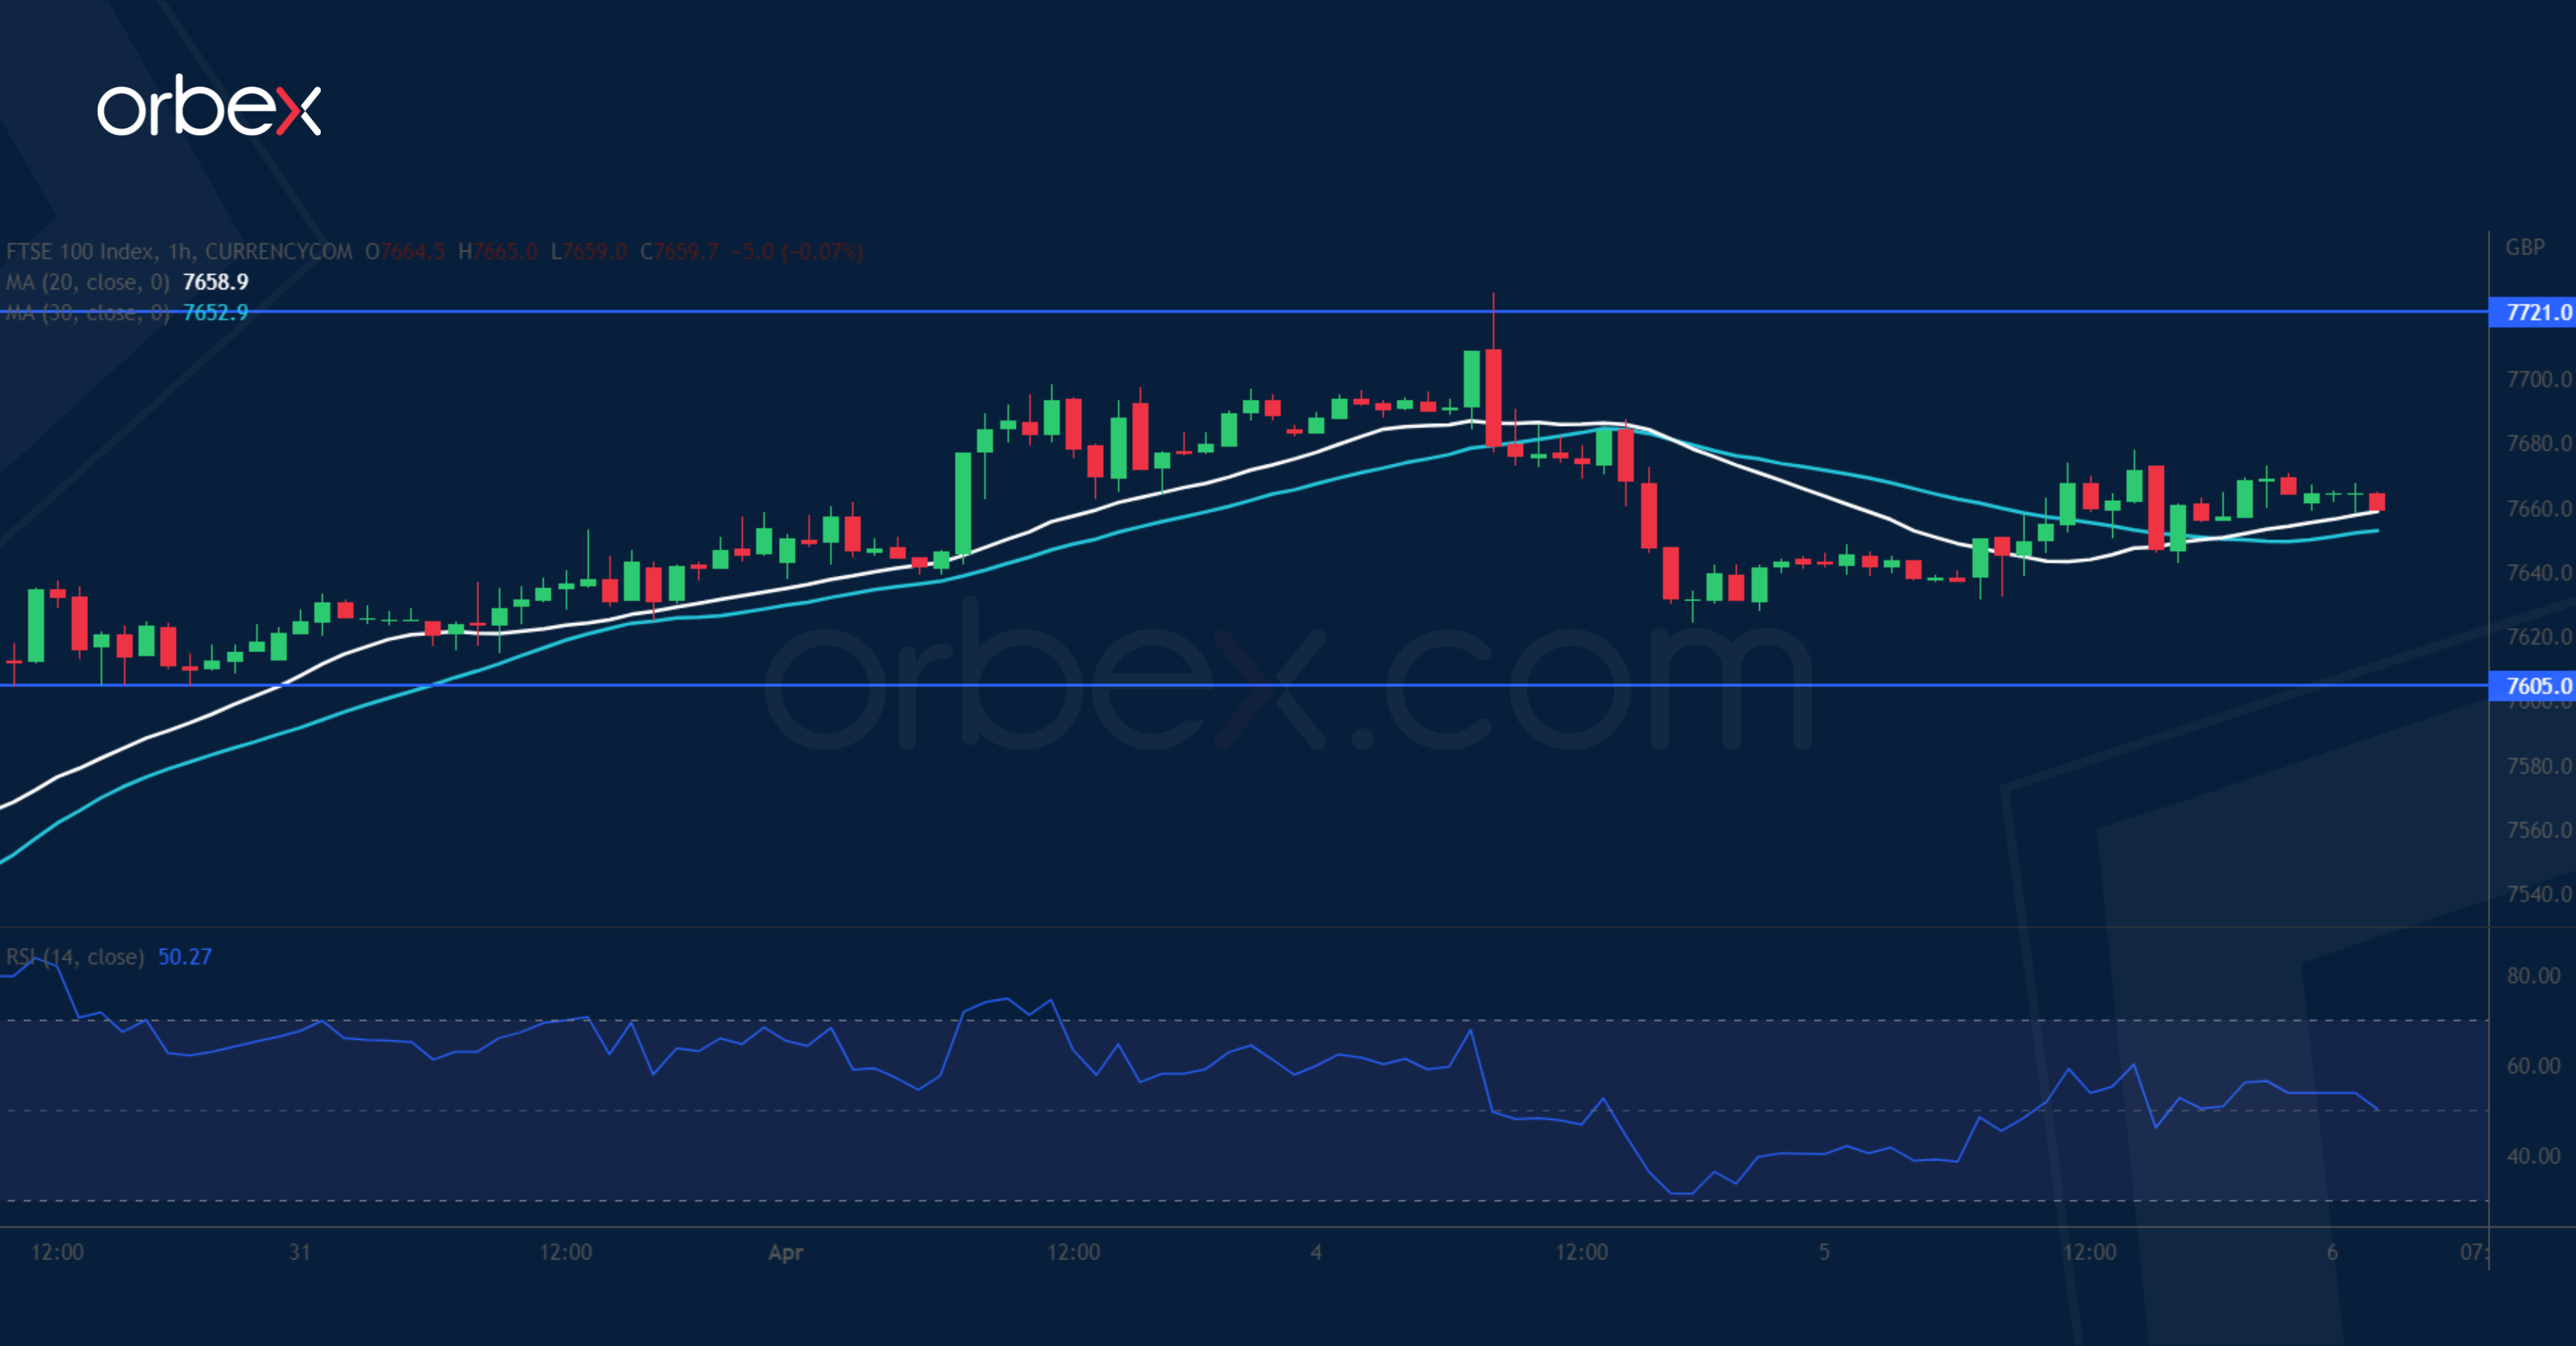
The FTSE 100 finds support from upbeat services PMI in March. As the index makes its way back to the previous daily support of 7770, growing resistance could be felt with a combination of profit-taking and renewed selling. 7720 is the immediate hurdle as the price turns south. 7605 is the closest level to see if the bulls will step in. Failing that, 7500 at the base of the breakout rally would be a major floor to test their commitment. On the upside, a close back above 7720 may resume the recovery above 7800.