Sample Category Title
USDCAD Recoups Some Losses after Decline Halts
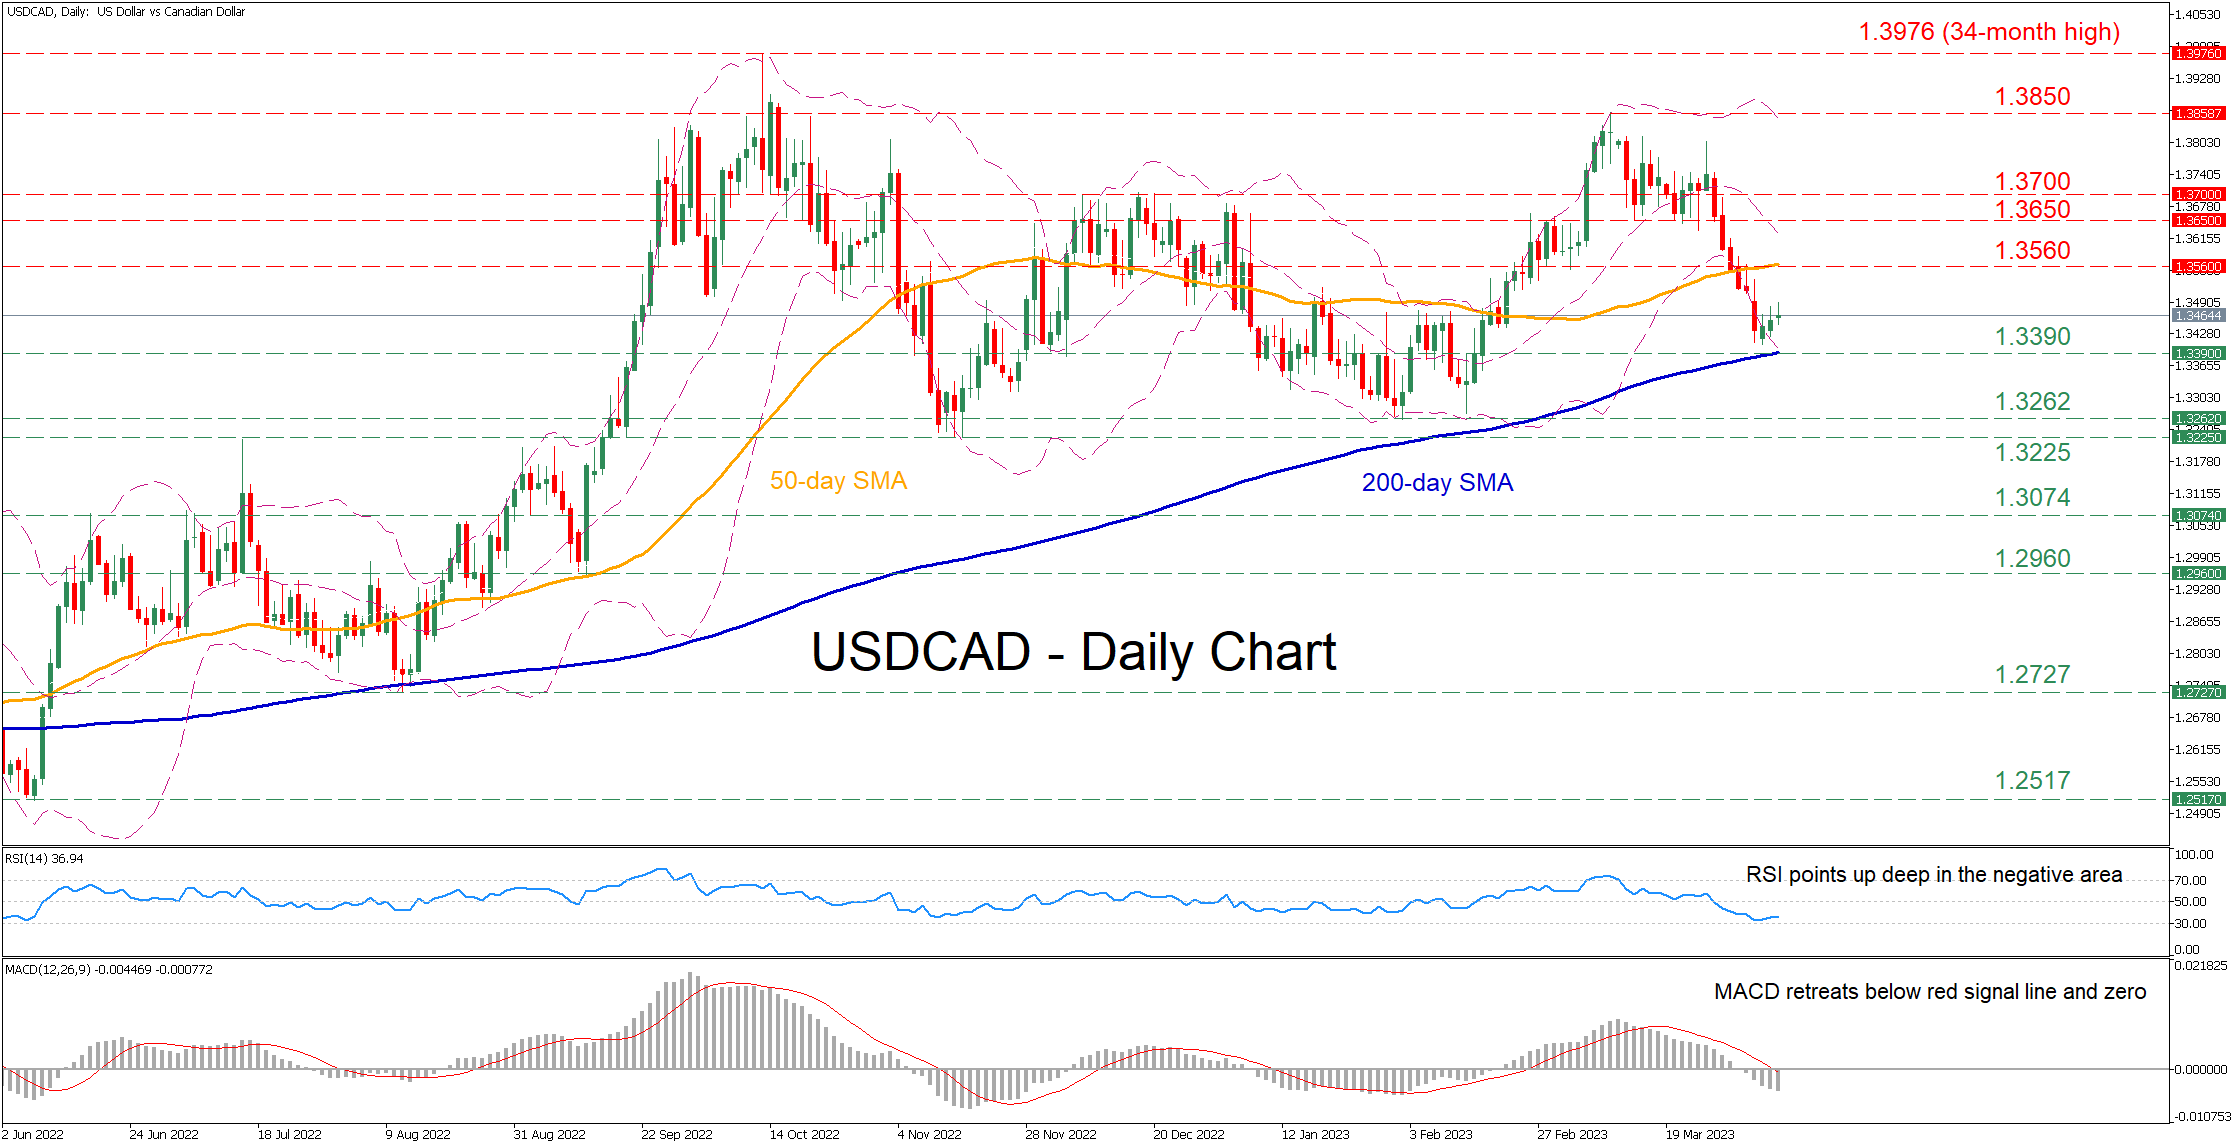
USDCAD has been in a steep downtrend after peaking at the 1.3850 region in mid-March. However, the pair managed to pause its retreat and pare some losses just shy of the 200-day simple moving average (SMA).
Despite the minor bounce, the short-term oscillators remain deep in their negative territories, suggesting that the bearish bias is intact. Specifically, the RSI is flatlining beneath its 50-neutral mark, while the MACD histogram is softening below both zero and its red signal line.
If the downtrend resumes, the price could encounter support at the 200-day SMA, currently at 1.3390. Sliding beneath that floor, the pair could descend towards the 2023 low of 1.3262. Further retreats could then cease at the November 2022 bottom of 1.3225.
On the flipside, should the price reverse higher, initial resistance might be found at the 1.3560 hurdle, which overlaps with the 50-day SMA. Conquering this barricade, the bulls could target 1.3650 before the November-December resistance zone of 1.3700 comes under examination. A break above the latter could set the stage for the 2023 peak of 1.3850.
In brief, USDCAD seems to have temporarily paused its selloff, but near-term risks remain tilted to the downside. Hence, for the downtrend to continue, the price must initially overcome the ascending 200-day SMA.
WTI Oil: Oil Steadies Above $80 after Monday’s Sharp Rise
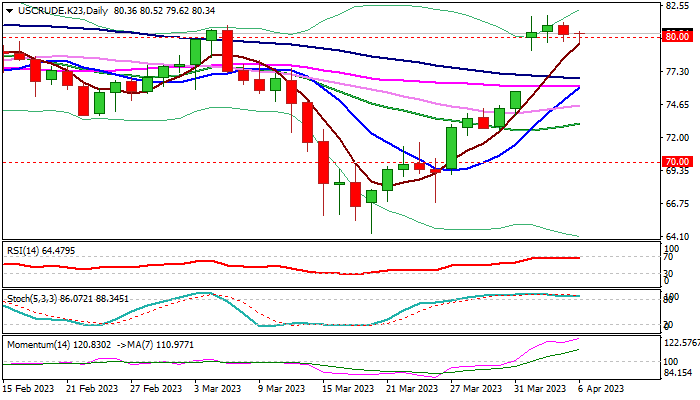
WTI oil keeps firm tone and holding above broken $80 barrier, now reverted to support, for the fourth straight day.
Near-term action is holding near new nine-week high, posted after Monday’s opening with large gap-higher and subsequent bullish extension, sparked by surprise decision by OPEC+ group to further reduce output.
The significance of cartel’s decision kept the price inflated during past few days and mainly offset expected negative impact from growing fears over global economic growth, boosted by the latest much weaker than expected US data.
Fresh drop in US crude inventories also contributed to positive signals for oil, keeping the action within narrow consolidation under new high and mainly above $80 level, in past few sessions.
The WTI contract is on track for the fourth consecutive daily close above psychological $80 support that adds to positive outlook, despite overbought daily studies.
Multiple bull-crosses, created by daily MA’s in full bullish configuration and very strong positive momentum, add to bullish signal, which would be verified on weekly close above $80.
This would keep bulls firmly in play for extension towards next targets at $82.64 (2023 high) and $83.32 (Nov 2022 top) which also mark a multi-week lower platform.
The recent narrow range after strong jump in the price suggests that traders look for fresh direction signals, as fundamentals remain positive but technical studies warn of correction.
In case of loss of $80 support, limited dips should not be harmful for larger bulls as long as Monday’s gap remains unfilled.
Res: 81.21; 81.76; 82.64; 83.32.
Sup: 80.00; 78.98; 77.65; 76.78.
AUD/USD: Bears Look for Confirmation on Break of Trendline Support/Daily Kijun-sen
Australian dollar extends weakness into third straight day, deflated by prospects that the RBA’s tightening cycle is likely at the end.
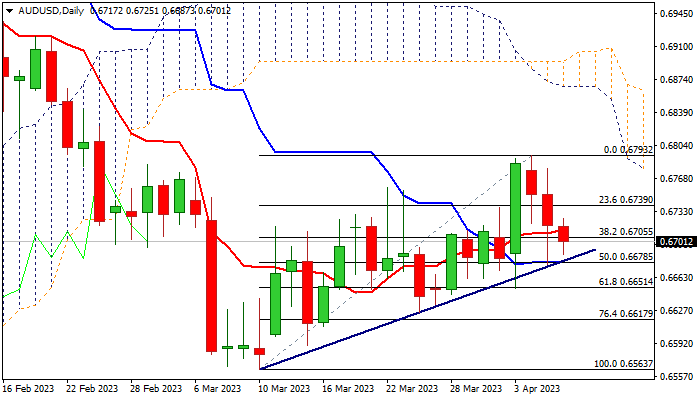
Weaking technical studies on daily chart contribute to negative near-term outlook, as 14-d momentum is about to break into negative territory and thickening daily cloud continues to weigh, though bears need daily close below cracked daily Tenkan-sen (0.6713) to boost signal.
Pivotal support at 0.6678 (daily Kijun-sen/bull-trendline off 0.6563 low/50% retracement of 0.6563/0.6793 upleg) is under pressure and firm break here is needed to confirm bearish signal and open way for further easing towards Fibo levels at 0.6651/0.6617 (Fibo 61.8% and 76.4% respectively) as well as signal top at 0.6793 (Apr 4).
Session high (0.6725) reinforced by 5DMA, marks initial resistance, followed by broken Fibo 23.6% (0.6739) and 200DMA (0.6747) with break of the latter to sideline bears.
Res: 0.6725; 0.6739; 0.6747; 0.6779.
Sup: 0.6678; 0.6651; 0.6617; 0.6589.
GER40 Cash Index Consolidates Below Early April Highs
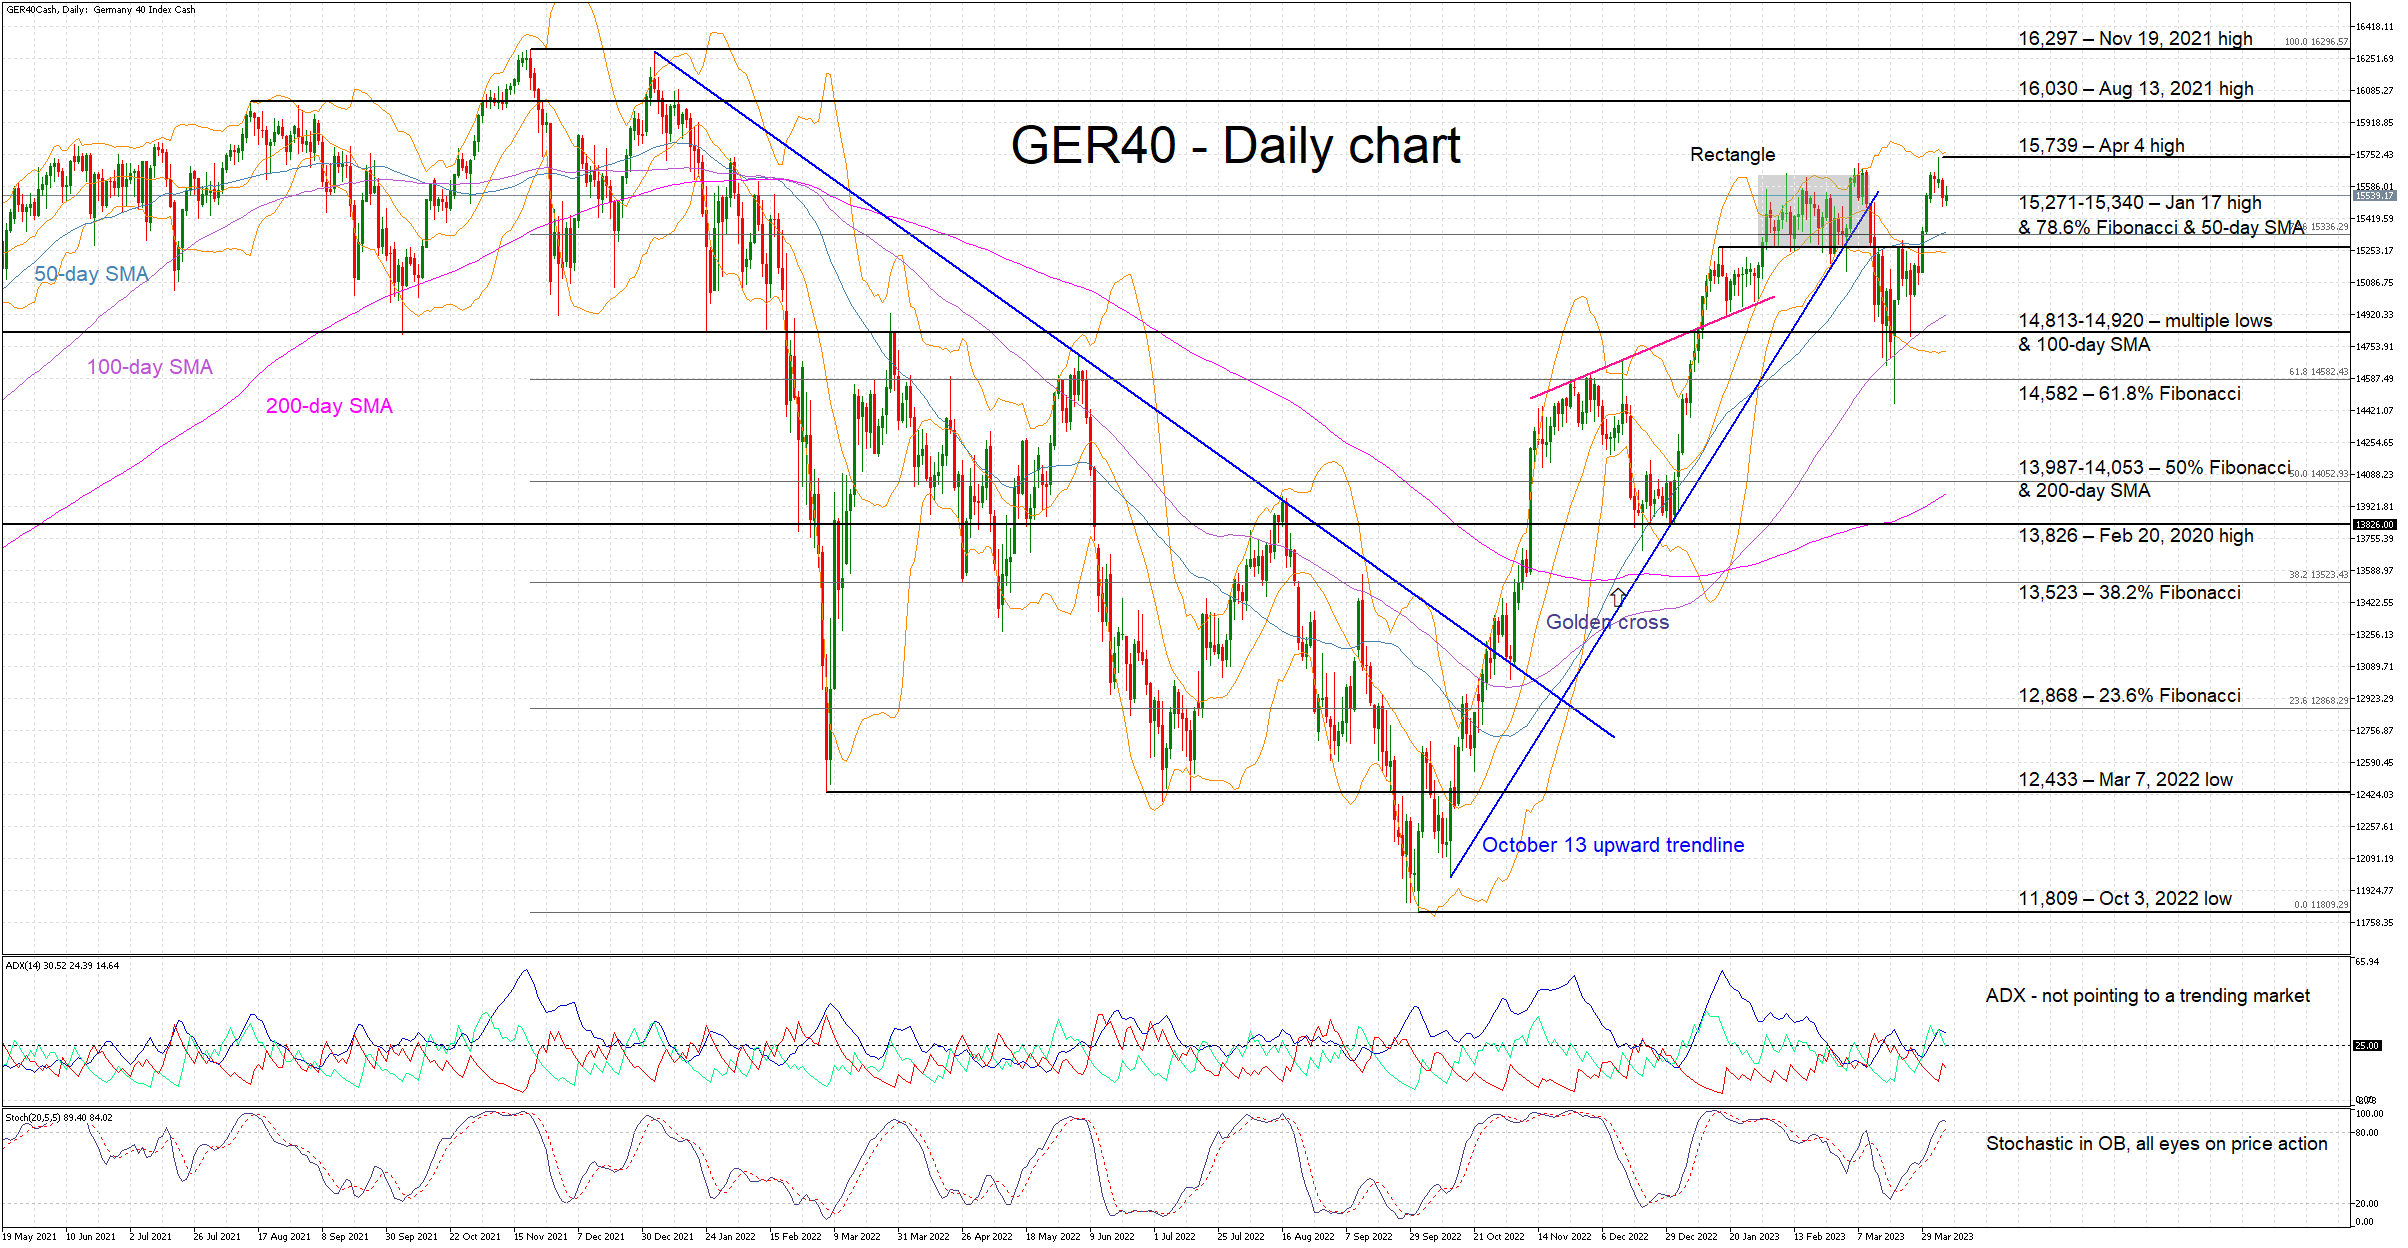
The GER40 cash index managed to make a higher high on April 4, reaching the highest point since January 2022 and potentially kicking off a party at the bulls’ camp. However, the situation is more complicated than it appears. The failure, up to now, to hold above the upper lower boundary of the January-March 2023 rectangle could be a sign that the market is not mature enough to stabilize at these elevated levels. To be fair, the move higher since the March 20 low of 14,458 has been too vigorous, even from the bulls' perspective.
Having said that, the bulls are trying to find their rhythm before attempting another charge higher. Unfortunately for them, both the Average Directional Movement Index (ADX) and stochastic oscillator are not joining their party at this stage. The former is slightly above its 25-threshold, but the overall impression is that there is not a clear trend in the market. Additionally, the stochastic is hovering at its overbought territory, where it can stay for a considerable amount of time. To add a twist in the current technical picture, the current set-up is pointing to a developing double top structure. However, a sizeable drop towards the March 20 low is necessary for the pattern to be seen as valid.
The bulls would clearly love to post another higher high, above the April 4 high of 15,739. This could encourage them to pursue higher targets with the next resistance level set at the August 13, 2021 high of 16,030.
On the other hand, the first target for the bears could come at the busy 15,271-15,340 area, populated by the January 17 high, the 78.6% Fibonacci retracement level of the November 19, 2011 – October 3, 2022 downtrend and the 50-day simple moving average (SMA). This is a key area for market sentiment and if successfully broken, the bears would aim for the 14,813-14,920, defined by multiple lows and the 100-day SMA.
To sum up, the bulls would love another break higher, but they need external support. The overall technical picture is not favourable at this juncture and a push lower could quickly reverse market sentiment.
Resting Bitcoin
Market picture
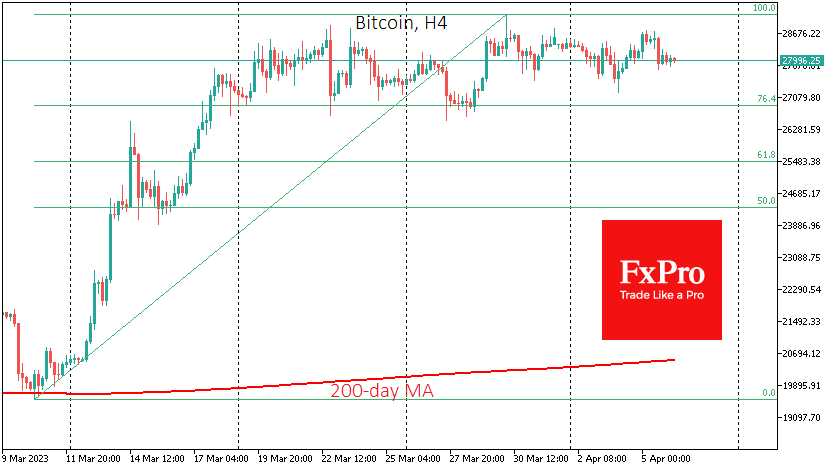
The crypto market lost 1.4% overnight to $1.19 trillion. Bitcoin, down 1.6% at $28K, once again underperformed the market. Ethereum fell just over 1% to $1890. This Bitcoin dynamic can be attributed to its outperformance in the March episode of capital flight from banks. That money is now neatly parked elsewhere while Bitcoin is “resting”.
Bitcoin’s recent pullback has confirmed that the trading range of the past two weeks remains in place. The first cryptocurrency does not see any significant obstacles on the way down to levels near $27K. The deepening drawdown could be influenced by negative sentiment in traditional financial markets.
MicroStrategy additionally bought 1,045 bitcoins for approximately $29.3 million at an average price of $28,016 per BTC, according to company founder Michael Saylor. MicroStrategy now owns 140,000 BTCs worth $4.17 billion at an average price of $29,803.
According to Kaiko, the correlation index between bitcoin and gold has reached 50%. Meanwhile, BTC’s dependence on the US stock market has fallen to 20%.
News background
The total capitalisation of gold-linked tokens has exceeded $1 billion. There are two major players in the market, PAX Gold, and Tether Gold, which account for 99% of gold tokenisation.
According to Lookonchain, the crypto whales, who control more than 10,000 ETH, are preparing to sell and have already started adding to exchange wallets. A coin reset is likely to take place when the altcoin exceeds $2,000.
Swiss state-owned bank PostFinance, the fifth largest by assets, has announced that it will offer a “full range of cryptocurrency services” to its 2.5 million customers.
According to Morning Consult, a majority of Latin American adults, unlike Americans, believe cryptocurrencies will become legal tender.
ECB Lane: Appropriate to hike further if baseline holds up
In an interview with Cyprus News Agency, ECB Chief Economist Philip Lane stressed the importance of being data-dependent and scientific in deciding on a potential interest rate hike at the May meeting. He explained, "if the baseline we developed before the banking stress holds up, it will be appropriate to have a further increase in May. However, we need to be data-dependent about the assessment of whether that baseline still holds true at the time of our May meeting."
Lane highlighted three factors that will influence the May decision: the inflation outlook, assessing the underlying dynamic of inflation, and the speed at which interest rate increases are restricting the economy and bringing down inflation. He urged focusing on understanding every data point instead of predicting the decision, stating, "rather than asking me what the next interest rate decision will be, the focus should be on understanding every data point that comes in."
Responding to a question regarding OPEC's production, the ECB Chief Economist note that the movement in oil prices should be weighed against the context of a large drop in recent months and a significant ongoing reduction in gas prices. Lane emphasized the importance of monitoring how the rest of the economy responds to the energy dynamic and analyzing the incoming data until the day of the May meeting.
GBP/JPY Daily Outlook
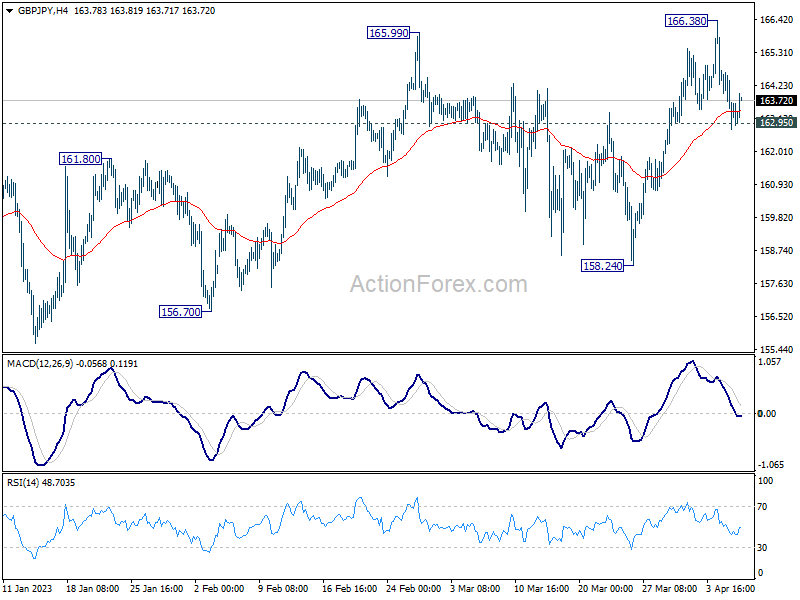
Daily Pivots: (S1) 162.67; (P) 163.67; (R1) 164.57; More...
Intraday bias in GBP/JPY remains neutral first. On the upside, sustained break of 165.99 resume the whole rebound from 155.33 to 169.26 resistance next. On the downside, however, break of 162.95 minor support will mix up the outlook and turn intraday bias to the downside for 158.24 support instead.
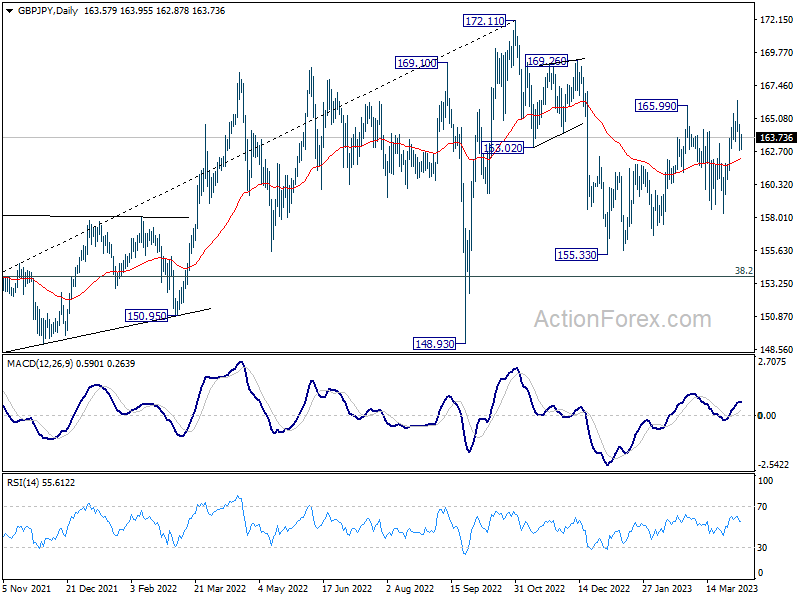
In the bigger picture, as long as 38.2% retracement of 123.94 (2020 low) to 172.11 (2022 high) at 153.70 holds, medium term bullishness is retained. That is, larger up trend from 123.94 (2020 low) is still in progress. Break of 172.11 high to resume such up trend is expected at a later stage.
EUR/JPY Daily Outlook
Daily Pivots: (S1) 142.41; (P) 143.43; (R1) 144.18; More....
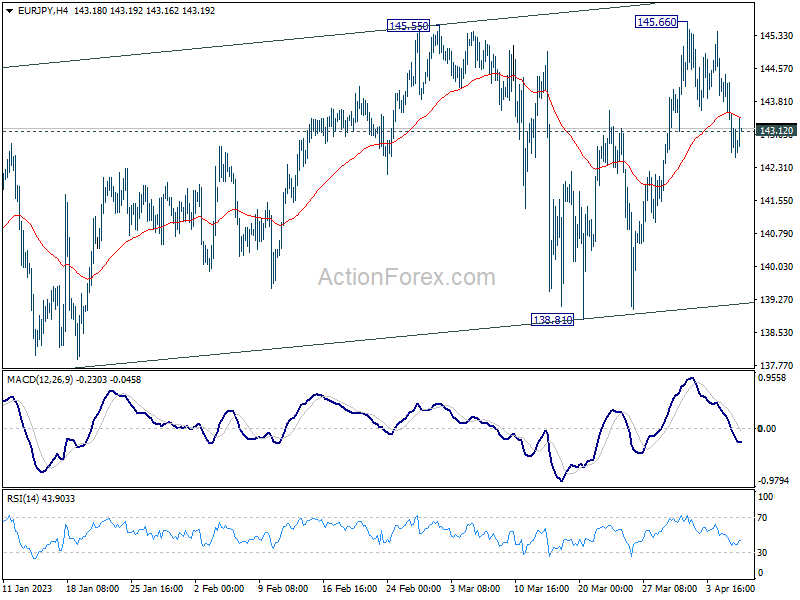
EUR/JPY's break of 143.12 support argues that rise from 138.81 has completed at 145.66. Intraday bias is back on the downside. Sustained trading below 55 day EMA (now at 142.80) will target 138.81 support. On the upside, break of 145.66 will resume recent rebound from 137.37 instead.
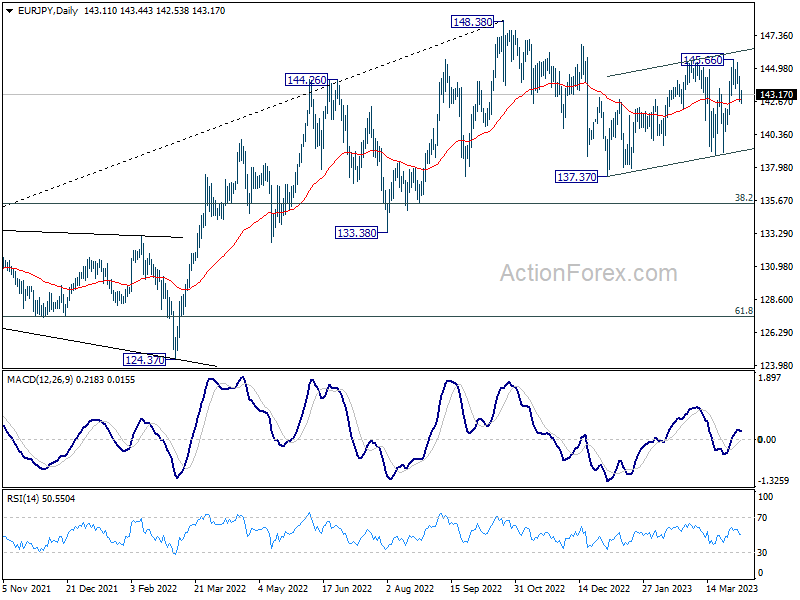
In the bigger picture, as long as 55 week EMA (now at 139.78) holds, larger up trend from 114.42 (2020 low) is still in progress for 149.76 long term resistance. However, sustained break of 55 week EMA will bring deeper fall to 38.2% retracement of 114.42 to 148.38 at 135.40. Decisive break there will raise the chance of trend reversal, and target 61.8% retracement at 127.39.
EUR/GBP Daily Outlook
Daily Pivots: (S1) 0.8737; (P) 0.8761; (R1) 0.8778; More...
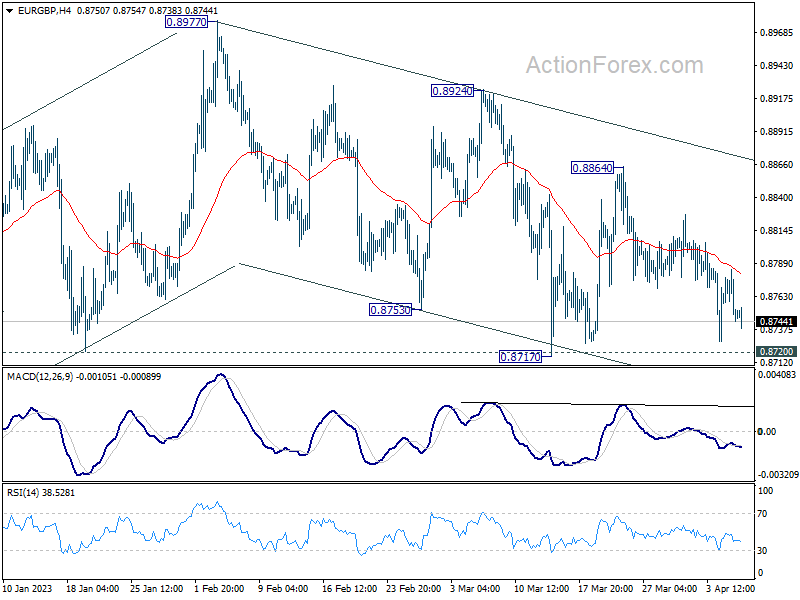
Intraday bias in EUR/GBP remains neutral for the moment. On the upside, break of 0.8864 will target 0.8924 resistance first. Firm break there should resume larger rise from 0.8545 through 0.8977 high. However, decisive break of 0.8717 support will resume the decline from 0.8977 instead.
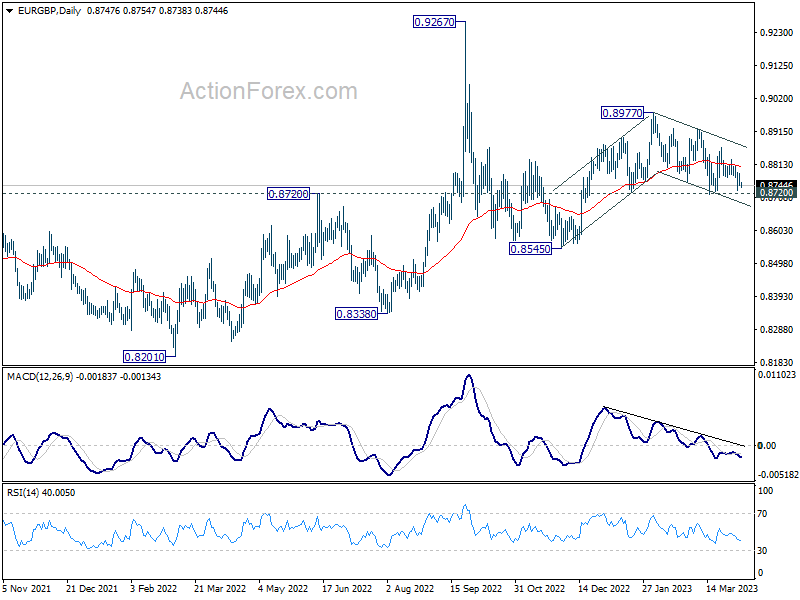
In the bigger picture, outlook remains rather mixed for now, except that price actions from 0.9267 (2022 high) are part of the long term range pattern from 0.9499 (2020 high). With 0.8720 support intact, rise from 0.8545 is in favor to continue through 0.8977. However, firm break of 0.8720 will argue that such rebound has completed, and open up deeper fall through this support level.
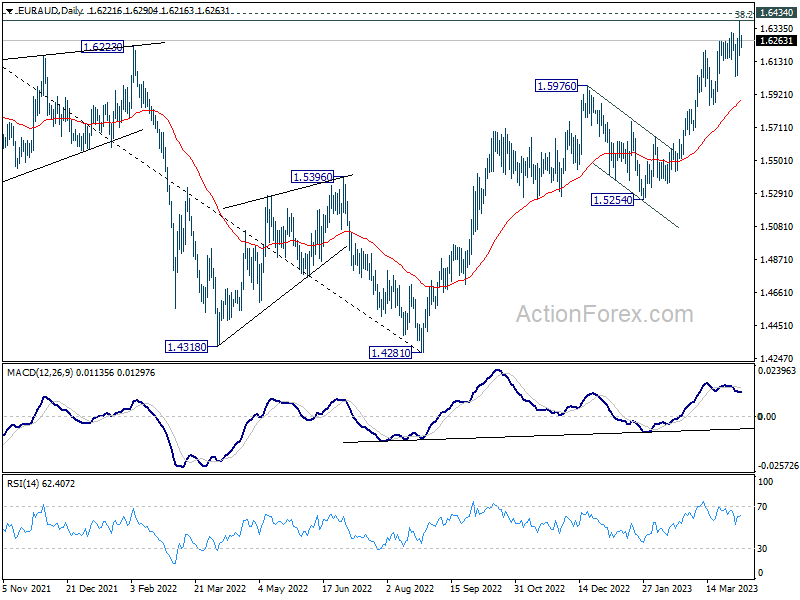
EUR/AUD Daily Outlook
Daily Pivots: (S1) 1.6145; (P) 1.6267; (R1) 1.6349; More...
Further rise is expected in EUR/AUD with 1.6033 support intact. Decisive break of 0.6389/6434 cluster resistance zone will carry larger bullish implications. However, firm break of 1.6033 support will confirm short term topping, after rejection by the mentioned resistance. Intraday bias will be turned back to the downside for 1.5848 support and possibly below.
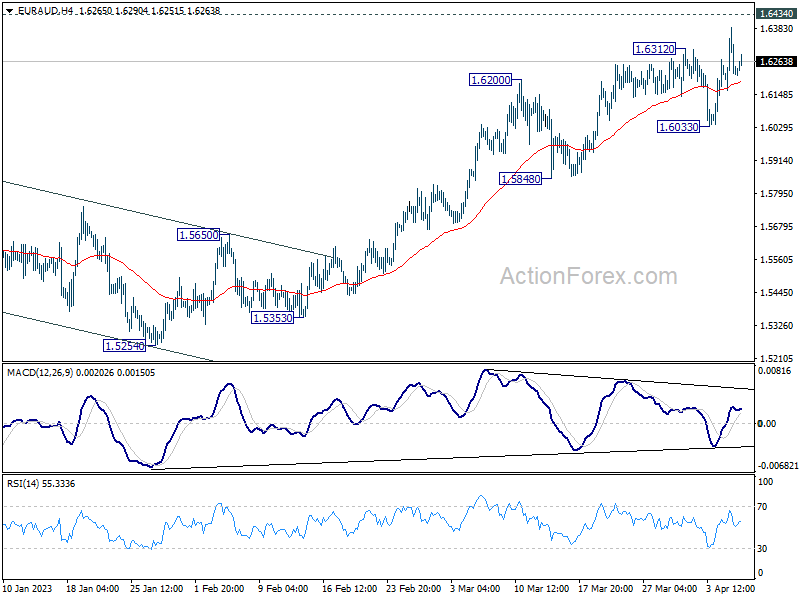
In the bigger picture, focus stays on 1.6389/6434 cluster resistance (38.2% retracement of 1.9799 to 1.4281 at 1.6389). Sustained break there should confirm that whole down trend from 1.9799 (2020 high) has completed. Further rally should then be seen to 61.8% retracement at 1.7691. However, rejection by this cluster resistance will make medium term outlook neutral at best.