

Sample Category Title
Markets Aren’t Too Worried About Future Inflation Risks
Markets
Three in a row. Yesterday’s scenario on core bond markets was another repeat from Monday and Tuesday: consolidation during European dealings, before taking a step higher after early US eco releases. ADP employment increased by 145k in March following an upwardly revised 261k in February, but fell short of expectations (210k). After the ADP report, markets also had to stomach a disappointing services ISM (51.2 from 55.1 vs 54.4 expected). Details showed a broad-based setback. Business activity fell slightly from 56.3 to 55.4, but big declines in new orders (52.2 from 62.6) and new export orders (43.7 from 61.7) don’t bode well for coming months. The backlog of orders fell below the 50 boom/bust mark for the first time since end 2020 (48.5 from 52.8). Employment growth slowed from 54 to 51.3. Supplier deliveries (45.8 from 47.6) fell to the lowest level since 2009 in a sign that supply chain bottlenecks are something from the past. Moderating demand and smoother supply chains pull prices paid from 65.6 to 59.5, the slowest pace of price increases since July 2020. The loss of momentum added to market pressure that the Fed is probably done with tightening. A full percentage point of rate cuts is discounted by January 2024, reflecting markets’ bearish outlook on the US economy with financial stability risks adding to uncertainty. We stick to the view that the Fed will very unlikely follow such path given the inflation outlook. Giving in to such easing pressure now risks becoming the bigger policy mistake, allowing inflation to claw back in the second half of the year. Markets aren’t too worried about future inflation risks and bank on short term economic support from the Fed, something they got used to over the past decade. US Treasury yields ended 4.5 bps (2-yr) to 1.8 bps (5-yr) lower. Intraday swings had been larger, but for the first time this week yields managed to close some bps above intraday lows. This might point to some fatigue with technical support levels at play as well. The US 2-yr yield tested the March lows between 3.55% and 3.71% but avoided a new closing low (close at 3.78%). The US 5-yr yield tested the 3.3%/3.23% support zone before closing at 3.37%. The US 10-yr yield tested 3.29%/3.28% support and closed at 3.31%. If anything, it shows that volatility remains very high. It also means that above-mentioned support zones are still at risk of giving away with jobless claims (today), payrolls (tomorrow) and US CPI inflation (Wednesday) lining up. Erring on the dovish side of expectations going into the Easter weekend might be another motive. The jury is still out with Fed members at the moment not providing sufficient counterweight. We don’t expect them to call for many more rate hikes, but at least to put the notion of rate cuts to bed. Recall that the March dot plot (Mar 22; after SVB turmoil) showed unanimity on keeping rates stable and even above 5% (17 out of 18) for the remainder of the year. US stock markets for the first time this week lost ground despite lower yields with doom and gloom scenario’s at play. Bearish engulfing patterns suggest more downside. The dollar profited in the same vein with EUR/USD back below 1.09 from an open around 1.0950.
News and views
The National Bank of Poland kept its policy rate unchanged yesterday at 6.75%. The NBP sees weakening of activity around the world and in Poland even as unemployment remains low. Polish inflation remained elevated in March but decreased to 16.2% Y/Y (from 18.4%). Lower commodity prices, a slowdown in PPI, weakening economic activity and the effects of earlier strong monetary tightening suggest a further decline in inflation in coming months. The NBP repeats its previous assessment that the decrease in inflation would be faster if it were to be supported by an appreciation of the zloty consistent with the fundamentals of the Polish economy. It may intervene in the FX market to limit fluctuations of the zloty that are inconsistent with the direction of monetary policy. NBP governor Glapinski gives a press conference this afternoon. PLN underperformed HUF and CZK, closing near EUR/PLN 4.687
The Reserve Bank of India this morning surprisingly left its policy rate unchanged at 6.5% instead of hiking by 25 bps. The RBI is ready to take further action against inflation if needed. Its policy stance is still labelled as ‘withdrawal of accommodation’. The central bank raised its policy rate by 250 bps this cycle and wants to evaluate the impact. Inflation is judged to moderate from 6.44% in February to 5.2% in the FY starting in April (inflation target 2%-6%). The RBI slightly raised its growth forecast to 6.5% from 6.4%, but risks have increased after recent events. The Indian rupee initially weakened slightly, but currently trades little changed near USD/INR 81.9.
Treasuries Up, Stocks Down on Mounting Recession Odds
Yesterday was a typical risk-off day in the financial markets. The US treasuries rallied, the yields fell, and the stocks fell as well, as the latest set of economic data from the US showed further weakness.
The latest US ISM data revealed that the slowdown in US services was slower than expected – although services still grew in March, growth in employment and new orders slowed sharper than expected. The trade deficit grew, and the ADP report showed that the US economy added around 145K new private jobs last month, versus around 200K penciled in by analysts.
The soft data spurred the expectation that the Federal Reserve (Fed) could soon be done with the interest rate hikes. The US 2-year yield dipped below the 3.70% level, and the 10-year yield is now below 3.30%. The dollar index hit a fresh 2-month low before rebounding in Asia, and the probability of a 25bp hike for May FOMC meeting is now given around a 50-50 chance when looking at the activity on Fed funds futures.
And if the probability of no rate hike is not much higher, the Fed’s Mester has certainly a finger in it. She said that the Fed should move the rates above 5% this year – come hell or high water – to fight inflation. Her words have also been reinforced by a surprise 50bp hike from the Reserve Bank of New Zealand (RBNZ) earlier this week.
Mind the vol
Today, we don’t have an important data release from the US – as the US decided, for a reason that we don’t know – to release the latest jobs data on Good Friday! The expectation is that the US economy may have added around quarter of a million new nonfarm jobs last month, the unemployment rate is seen steady at a multi-decade low of 3.6% and earnings may have grown slightly stronger on a monthly basis, but slower on a yearly basis.
The combination of a sufficiently weak NFP figure, and a sufficiently weak salaries growth should further cement the idea that the Fed should stop hiking further and let the nearly 500bp hike since last year work its way through the economy, along with some tightening in credit conditions due to the bank stress. If the data is stronger-than-expected, which is not the base case scenario, the pricing of a 25bp hike should slightly improve, but investors won’t run to conclusions before next week’s inflation release.
PS: The fact that the US jobs data – which is the most watched data point in the entire world - is scheduled on Good Friday is disquieting. With many traders from developed economies out of office, many stock markets will be closed. And for those markets that will still be up and running, the trading volumes will be thin, therefore the price action posterior to the data will likely be exacerbated by the lack of volumes.
And the higher the gap between the expectation and the data, the wilder the price action could be.
What to expect?
Soft jobs data from the US will likely send the short-term yields to levels that were tested when the Silicon Valley Bank (SVB) collapsed last month, and the dollar index to a fresh year-to-date low.
Unfortunately for the stock markets, the softer yields will likely not be a catalyzer of a further rally, as the recession fears should weigh on earnings expectations and the latter should weigh on the valuations and outweigh the positive impact of softer yields.
For the S&P500, a downside correction below the 4000 handle, and into the 200-DMA is reasonable.
Unless we see a significant improvement in US inflation, stock traders don’t have a strong foundation to build a sustainable rally on. The economic data is weak, and we don’t know how fast inflation will slow. A consensus of analysts’ expectations on Bloomberg suggests that inflation remained steady in March at around 6% for the headline figure and around 5.5% for the core figure, with a slight improvement on a monthly basis for both figures.
But we know that the downward path in inflation is at risk, now that OPEC is actively fighting the softening oil prices, which will, in the coming months, have a boosting effect on inflation figures.
The barrel of crude oil jumped nearly 30% since the second half of March – as energy traders brushed off the banking stress, and OPEC cut production by more than a million barrels per day.
Good news is that the oil rally must be coming to exhaustion at around the $80/82 range, as the weak economic data and the rising recession worries will likely act as a solid resistance to the post-OPEC rally. Released yesterday, the 3.7-mio-barrel decline in US crude inventories could hardly find buyers above the $80pb level. So, the chances are that the barrel could be returning toward the 50-100-DMA levels, around $75/76 in the short run.
Think long-dated, inflation protected
What’s happening right now - increased appetite for sovereign bonds and decreased appetite for equities due to the rising recession positioning - is exactly what we thought would happen this year.
In this context, one of the most interesting plays could be long positioning in long-dated and inflation protected US papers; they will likely outperform your regular long-dated papers, given that we don’t know when and by how much inflation will ease, but we guess that at the current state of things, most of the treasury selloff is likely done.
Technical Outlook and Review
DXY:
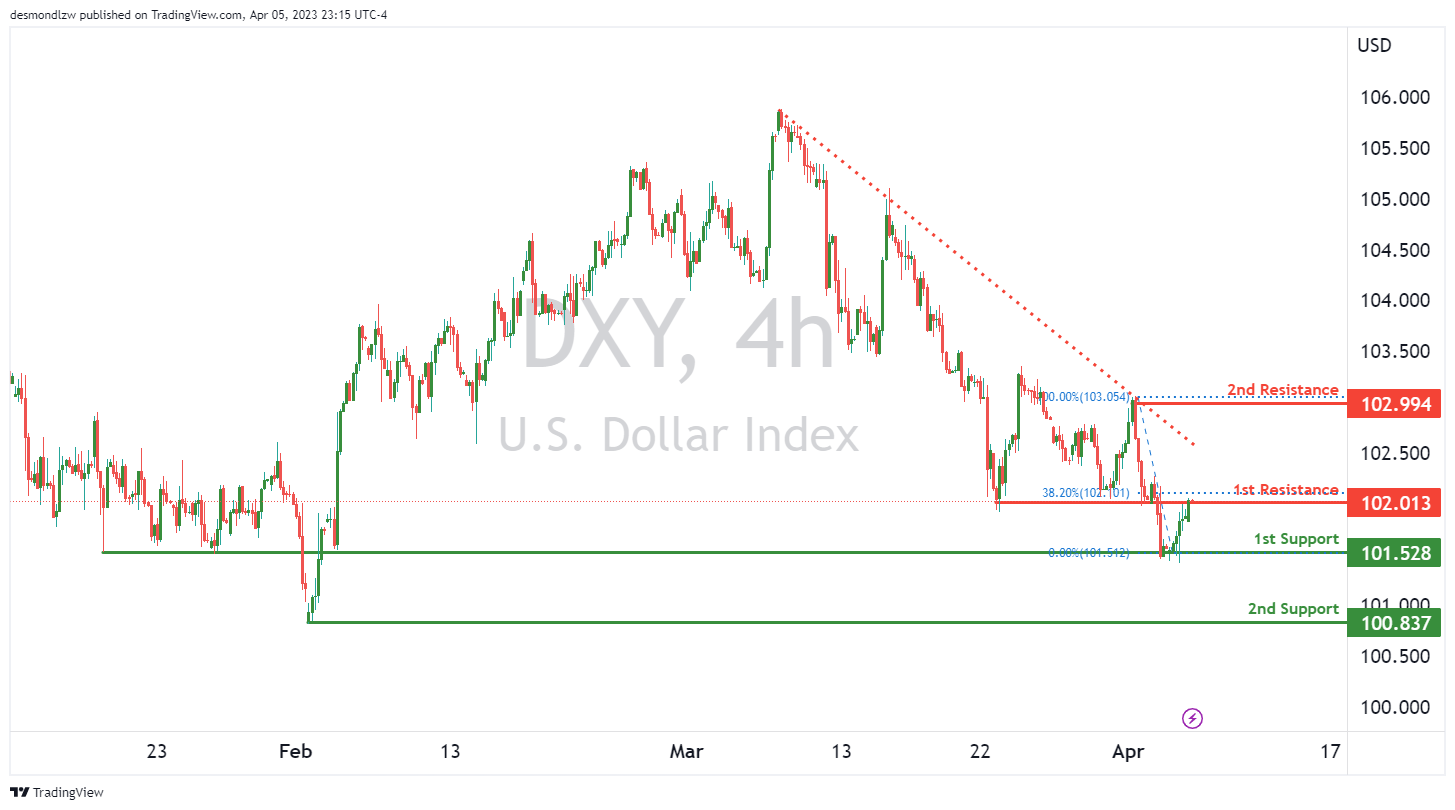
The DXY chart is currently showing strong bearish momentum, with price below a major descending trend line, indicating that further bearish momentum may be in the cards.
Looking at the chart, it is possible that price may make a bearish reaction off the 1st resistance level and drop towards the 1st support level at 101.52. This level is a pullback support, which has been significant in the past and could potentially provide a strong support level.
Moving lower, the 2nd support level is at 100.83, which is a swing low support level. This level has also been significant in the past and is likely to provide support if the price were to drop further.
On the other hand, the 1st resistance level is at 102.01, which is a swing high resistance level. This level coincides with a 38.20% Fibonacci retracement, adding further significance to its potential as a resistance level. If the price were to break through this level, it may lead to a potential rise towards the 2nd resistance level at 102.99, which is another swing high resistance level.
EUR/USD:
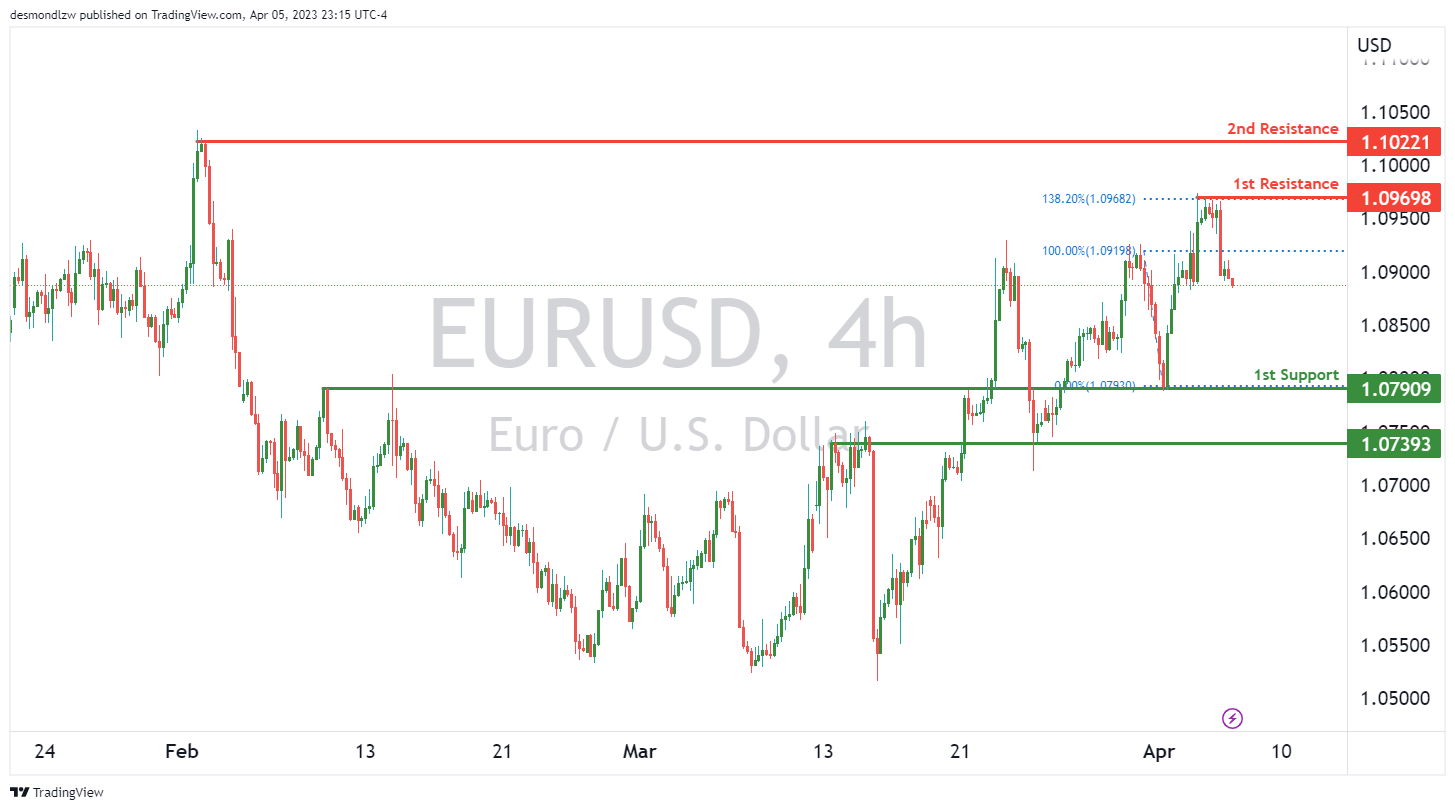
The EUR/USD chart is currently showing bearish momentum, with the potential for further downside towards the 1st support level at 1.0790. This support level is significant as it represents an overlap support, meaning that it has been tested multiple times in the past and is likely to provide a strong level of buying interest. Additionally, there is a secondary support level at 1.0739, which is also an overlap support and may act as a potential downside target if price were to break below the 1st support.
On the other hand, the chart shows that there is resistance at the 1st resistance level of 1.0969. This level has been tested multiple times in the past and is a multi-swing high resistance, indicating that it is likely to provide strong selling interest. Furthermore, this resistance level aligns with the 138.20% Fibonacci Extension level, adding more significance to its potential as a strong resistance level. There is also a secondary resistance level at 1.1022, which is a swing high resistance and may act as a potential upside target if price were to break above the 1st resistance.
GBP/USD:
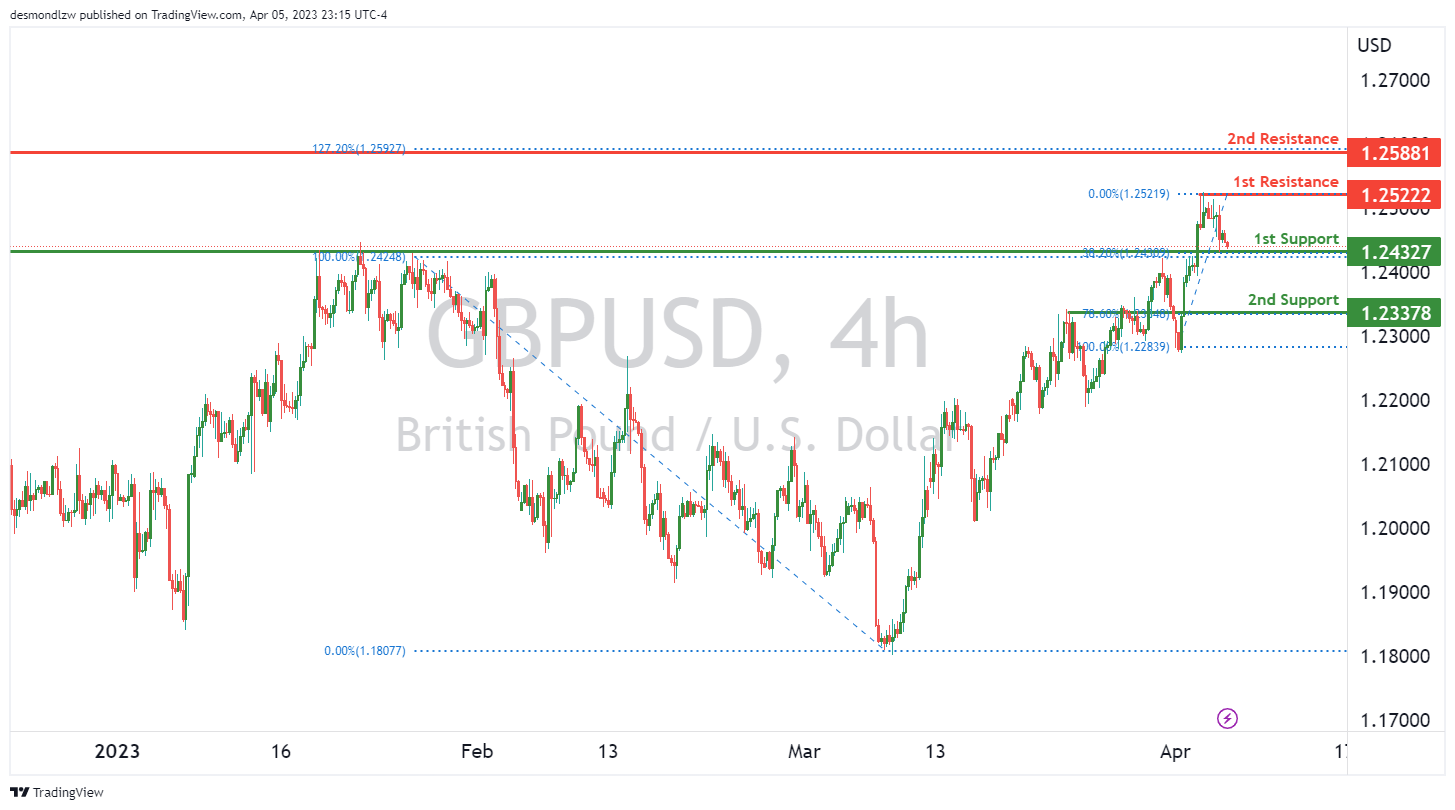
The GBP/USD chart is currently showing bearish momentum, with potential for a bearish break off the 1st support level and a drop towards the 2nd support.
The 1st support level is at 1.2432, which is a strong overlap support level that also happens to line up with a 38.20% Fibonacci retracement. This makes it a good level for potential buying opportunities, but if the price were to break below this level, it could trigger further bearish momentum.
The 2nd support level is at 1.2337, which is a pullback support level that coincides with a 78.60% Fibonacci retracement. This level has also been a previous support level that the price has bounced off of in the past, making it another potential buying opportunity.
In terms of resistance levels, the 1st resistance level is at 1.2522, which is a multi-swing high resistance level that lines up with a 138.20% Fibonacci extension. This level may prove difficult for the price to break above, and a reversal might occur to push prices back down towards the 1st support level.
The 2nd resistance level is at 1.2588, which is a swing high resistance level. If the price were to break above this level, it could potentially lead to further bullish momentum.
USD/CHF:
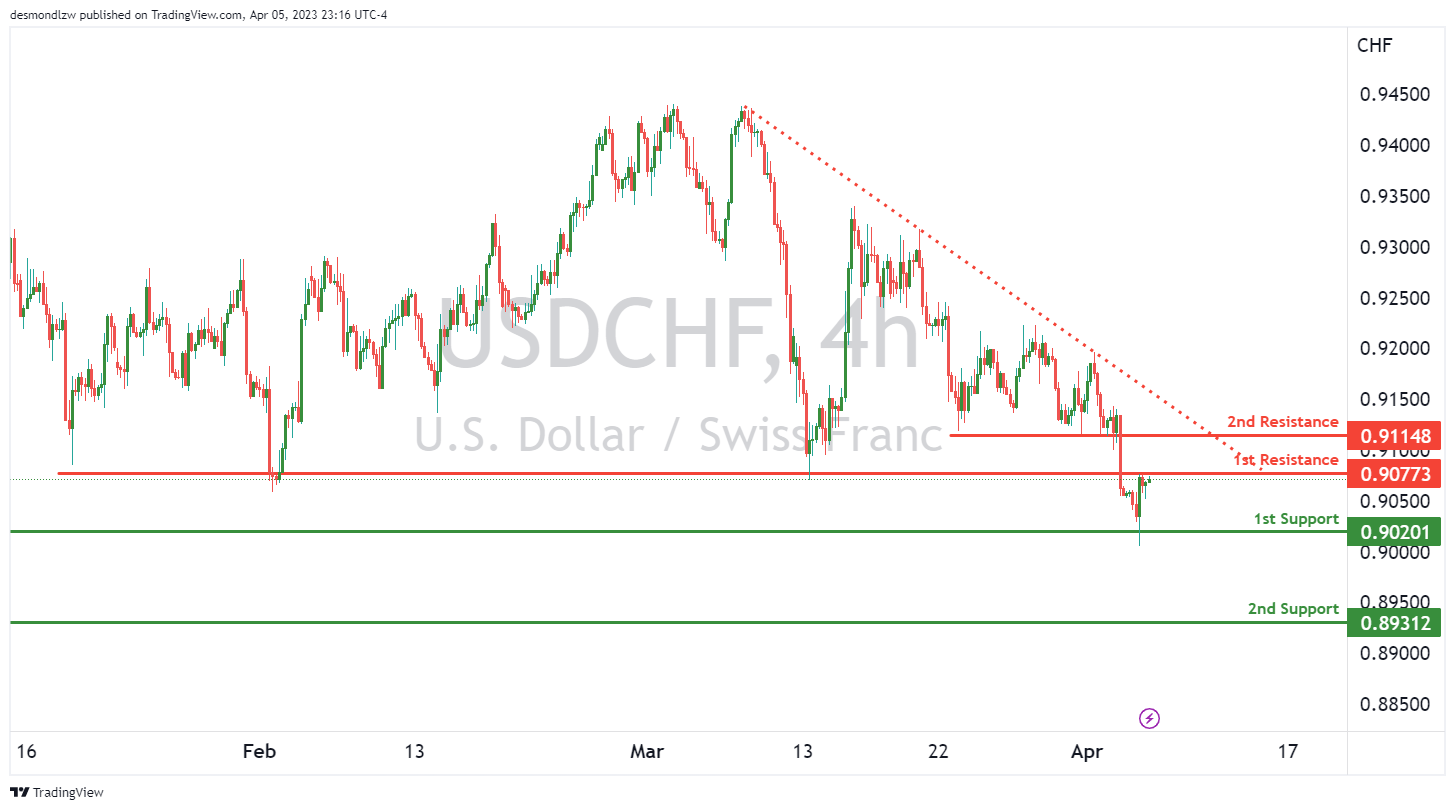
The USD/CHF chart is currently showing bearish momentum, with price below a major descending trend line which suggests the possibility of further downside movement.
Looking at the potential price movement, there is a chance for a bearish reaction off the 1st resistance level, which could result in a drop towards the 1st support.
The 1st support level is located at 0.9020, and is a swing low support level that could potentially hold and cause price to bounce back up. If the 1st support level does not hold, the next support level is at 0.8931, which is another swing low support level that has previously held and could potentially do so again.
On the resistance side, the 1st resistance level is at 0.9077 and is an overlap resistance level. If price were to break above this level, it could potentially continue to rise towards the 2nd resistance at 0.9114, which is a pullback resistance level.
USD/JPY:
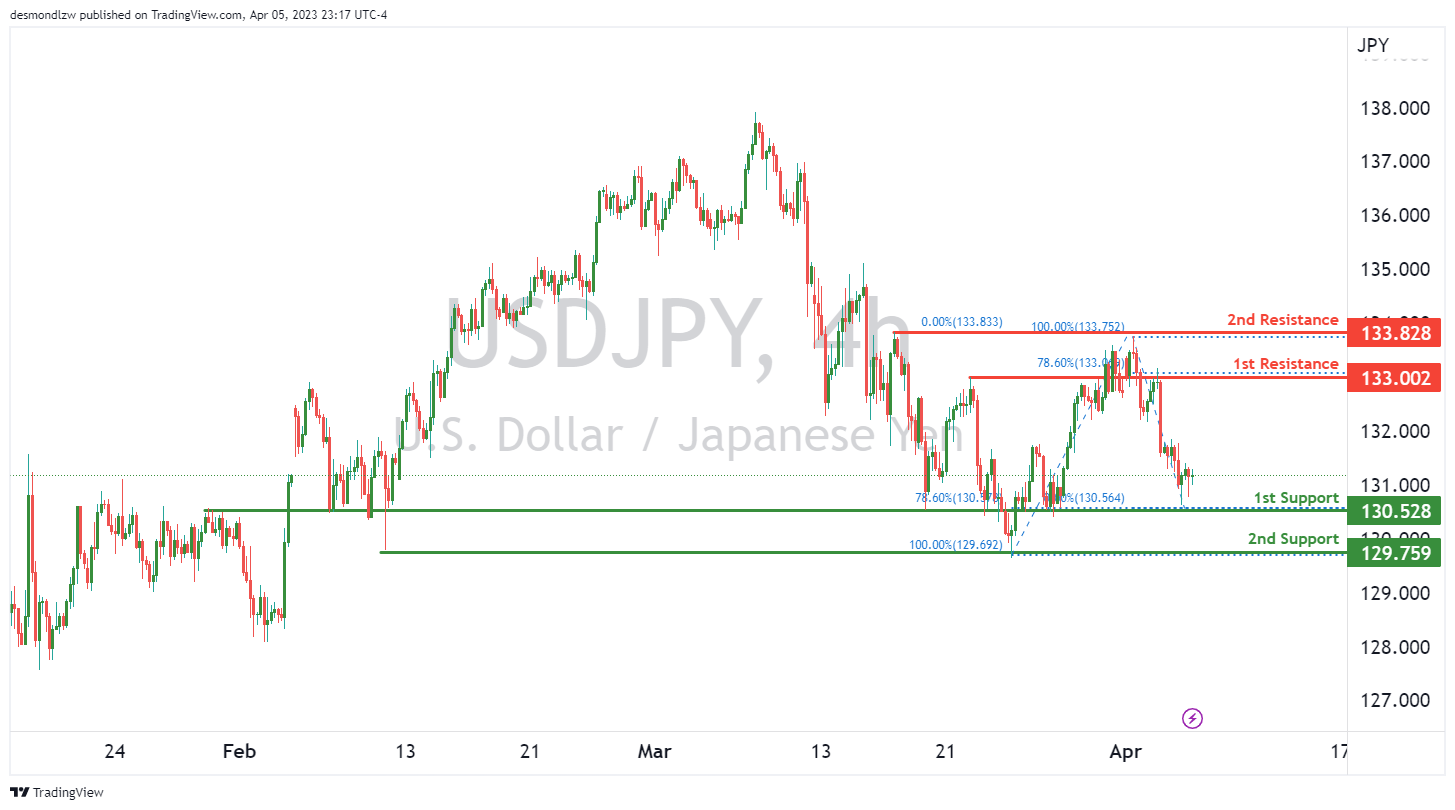
The USD/JPY chart has an overall bullish momentum, indicating that prices are likely to continue to rise. There are no specific factors contributing to the momentum at the moment.
Price could potentially continue to rise towards the 1st resistance level at 133.00. This level is a pullback resistance and is supported by a 78.60% Fibonacci retracement. If price manages to break through this resistance, it could potentially rise towards the 2nd resistance at 133.82 which is a multi-swing high resistance.
On the other hand, if the price were to decline, it could find support at the 1st support level of 130.52. This level is a strong overlap support and is also supported by a 78.60% Fibonacci retracement. If the price bounces off this support level, it could rise towards the 1st resistance level.
If the 1st support level fails to hold, the price could drop towards the 2nd support level at 129.75. This level is a multi-swing low support that the price has bounced off multiple times in the past.
Overall, the USD/JPY chart has a bullish bias, and the price could potentially rise towards the 1st resistance level at 133.00. However, if the support levels fail to hold, the price could drop towards the 2nd support level at 129.75.
AUD/USD:
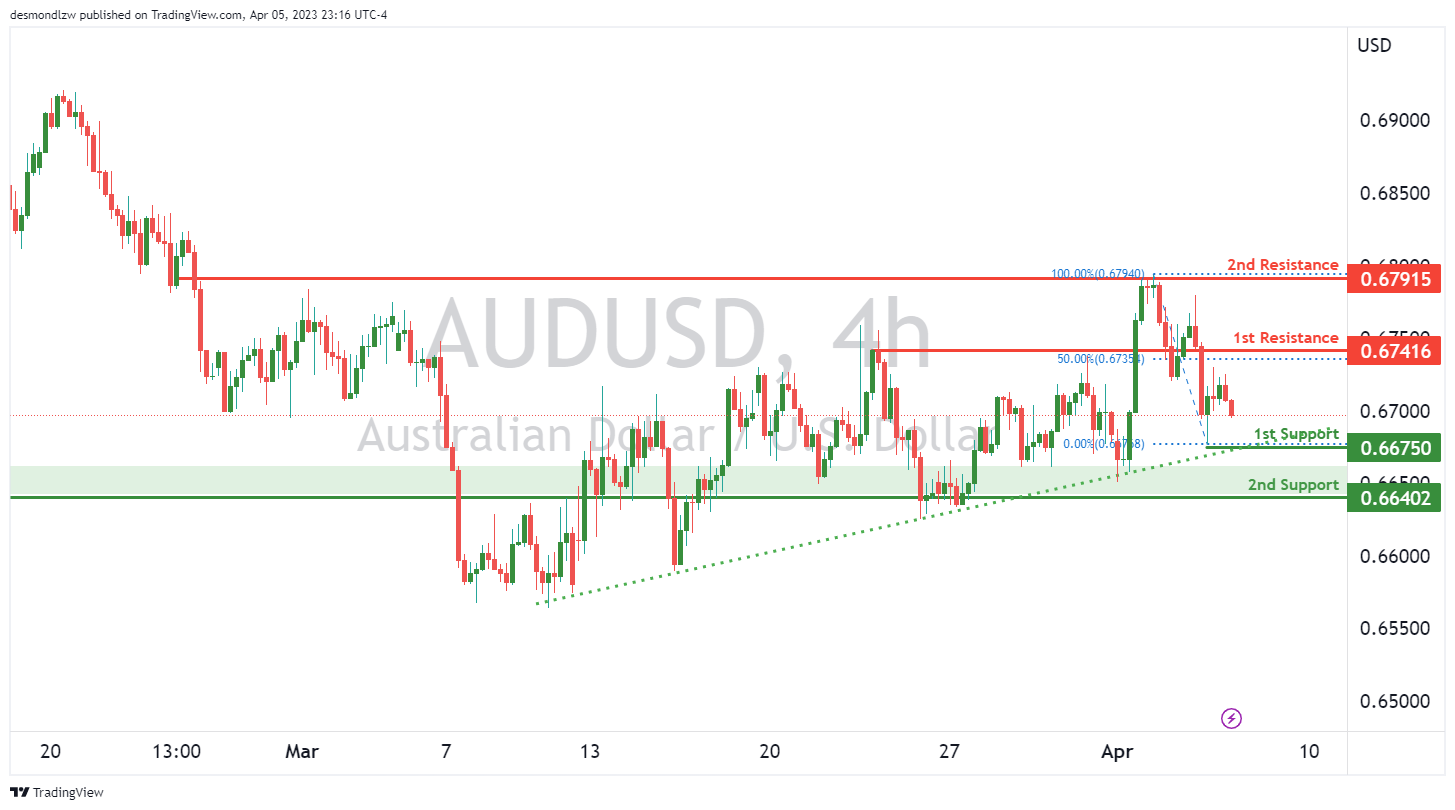
The AUD/USD chart has an overall bearish momentum, with price potentially continuing to drop towards the first support level. However, it’s worth noting that price is currently above a major ascending trend line which suggests further bullish momentum in the future.
If price were to continue downwards, it could potentially find support at the first support level of 0.6675. This level is a strong swing low support that has held in the past. If price were to break below this level, the next support level to look out for would be the second support level at 0.6640. This level is also an overlap support level and could provide additional support for price.
On the upside, there is a first resistance level at 0.6741 which coincides with a pullback resistance and the 50% Fibonacci retracement level. If price were to bounce off the first support level and continue to rise, it could potentially reach this level. The second resistance level is at 0.6791 and is a multi-swing high resistance level. If price were to break above this level, it could signal a shift in momentum towards a more bullish direction.
NZD/USD:
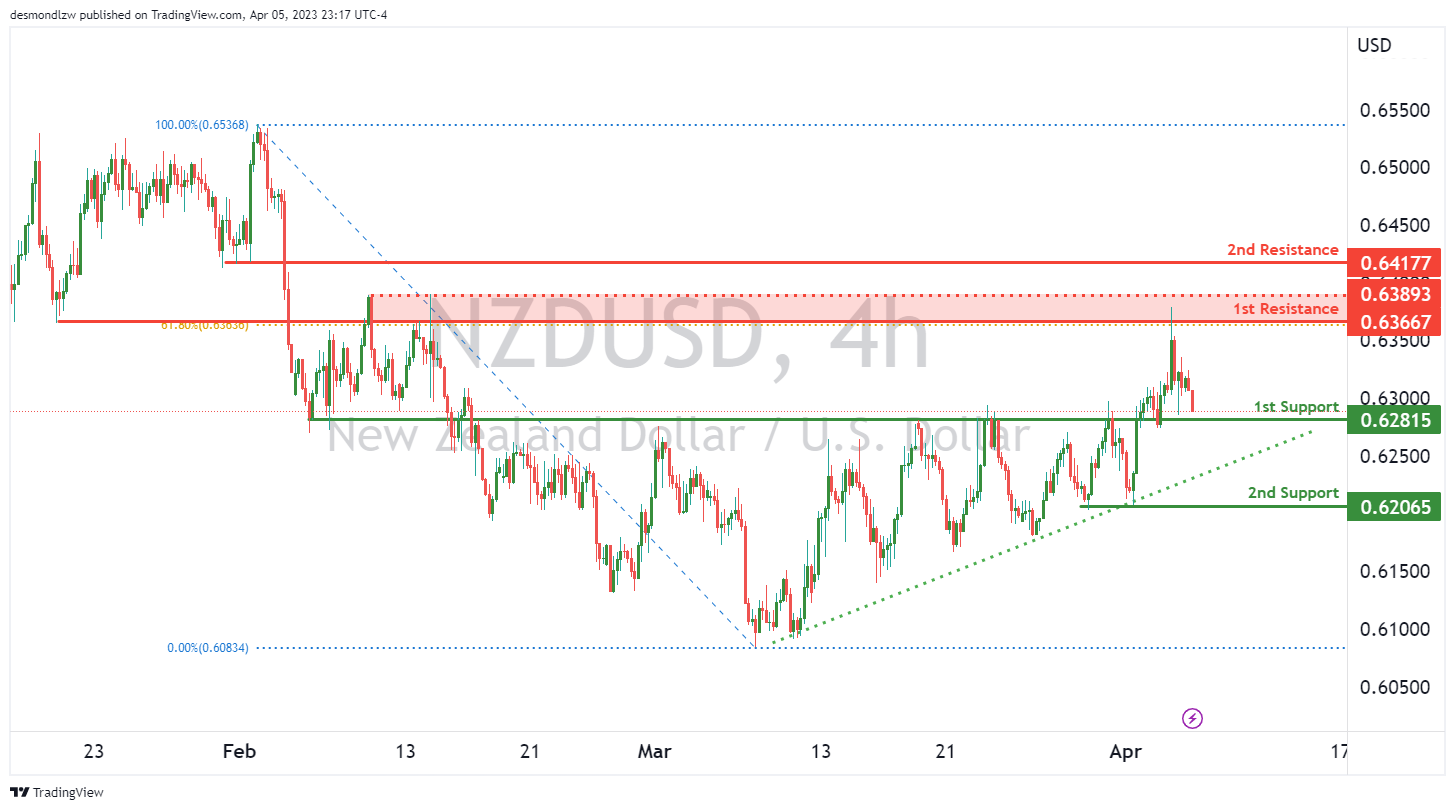
The NZD/USD chart is currently showing bearish momentum with the possibility of further downside potential. Price is currently above a major ascending trend line which could suggest bullish momentum, but other factors seem to suggest otherwise.
Price could potentially make a bearish continuation towards the 1st support level at 0.6281. This level is considered an overlap support and may offer some level of support to price. If the 1st support level is broken, the next support level to watch is the 2nd support at 0.6206. This support level has previously acted as a multi-swing low support and may offer stronger support to price.
On the resistance side, the 1st resistance level is at 0.6366. This level is considered a pullback resistance and coincides with a 61.80% Fibonacci retracement level. If price were to rise and break through the 1st resistance, the next level to watch is the 2nd resistance at 0.6417, which is also a pullback resistance level.
USD/CAD:
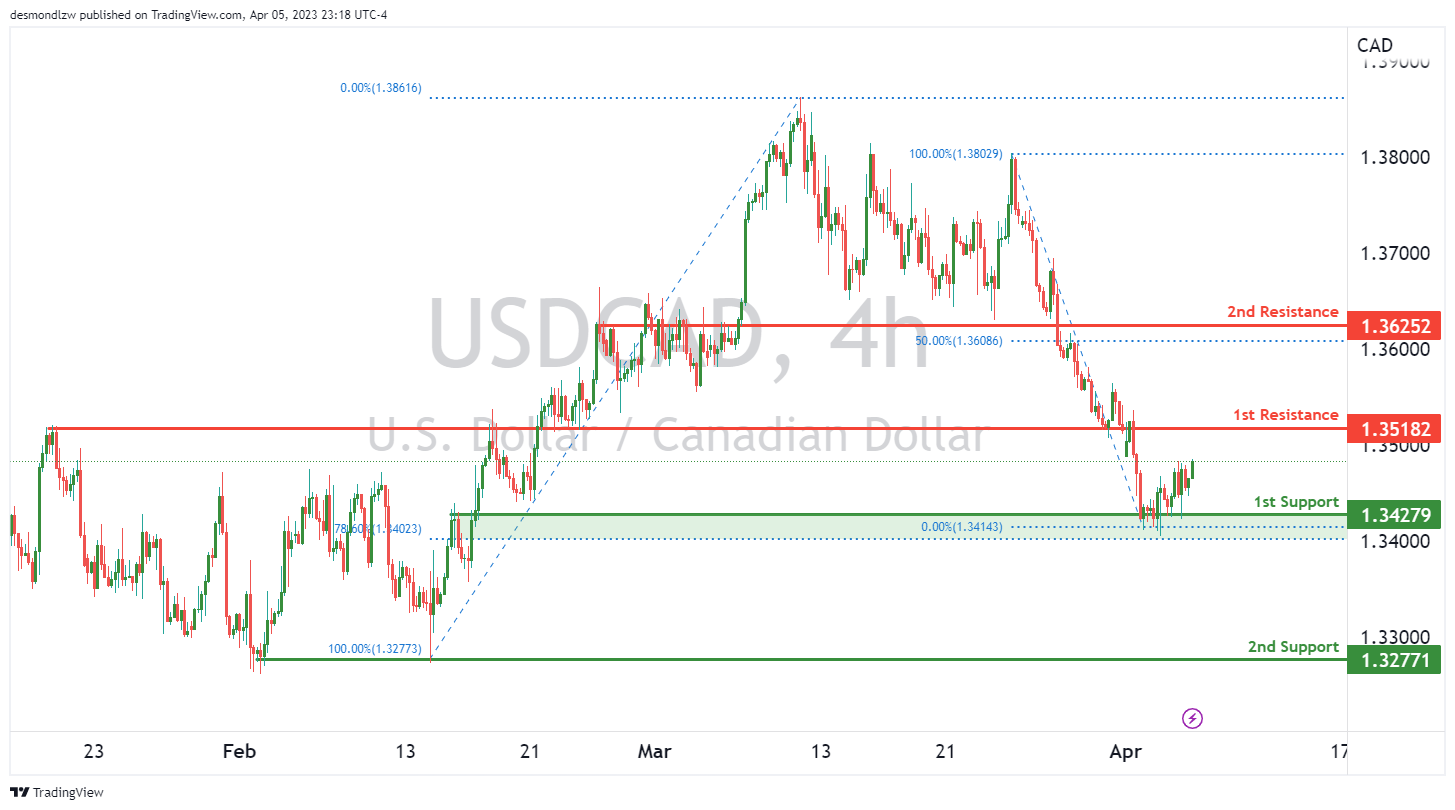
The USD/CAD chart is currently showing bullish momentum, indicating that the price of the pair might continue to rise in the near future. There are no clear factors contributing to the momentum at the moment.
The price could potentially make a bullish continuation towards the 1st resistance level, which is at 1.3518. This level is a pullback resistance level. If the price breaks through this level, it could potentially rise towards the 2nd resistance level at 1.3625. This level is a pullback resistance level and coincides with the 50% Fibonacci retracement.
On the other hand, if the price were to drop, it could potentially find support at the 1st support level of 1.3427. This level is an overlap support level and has a 78.60% Fibonacci retracement lining up with it. If the price breaks through the 1st support level, it could potentially drop towards the 2nd support level at 1.3277. This level is a multi-swing low support level.
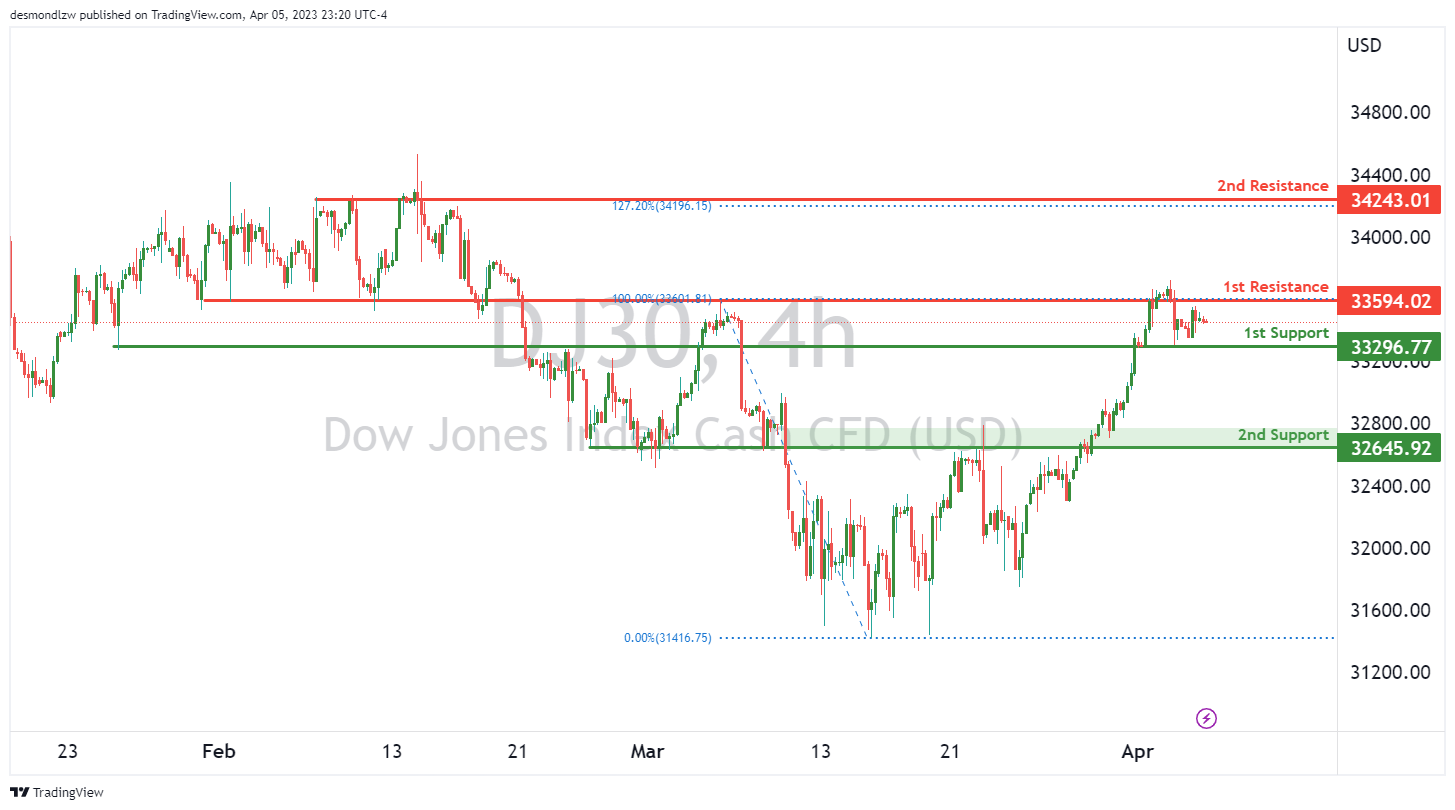
DJ30:
The Dow Jones Industrial Average (DJ30) is currently exhibiting bearish momentum, and there are several factors contributing to this. The price is currently below a major descending trend line, which suggests that bearish momentum is likely to continue.
In terms of potential price movement, there is a possibility of a bearish continuation towards the first support level of 33296.77, which is a strong overlap support. If the price were to break this level, it could drop to the second support level of 32645.92, which is a pullback support.
On the other hand, the first resistance level of 33594.02 is an overlap resistance, and if the price were to rise, it could potentially reach this level before encountering any significant resistance. If the price breaks above the first resistance level, the next resistance level is at 34243.01, which is a multi-swing high resistance.
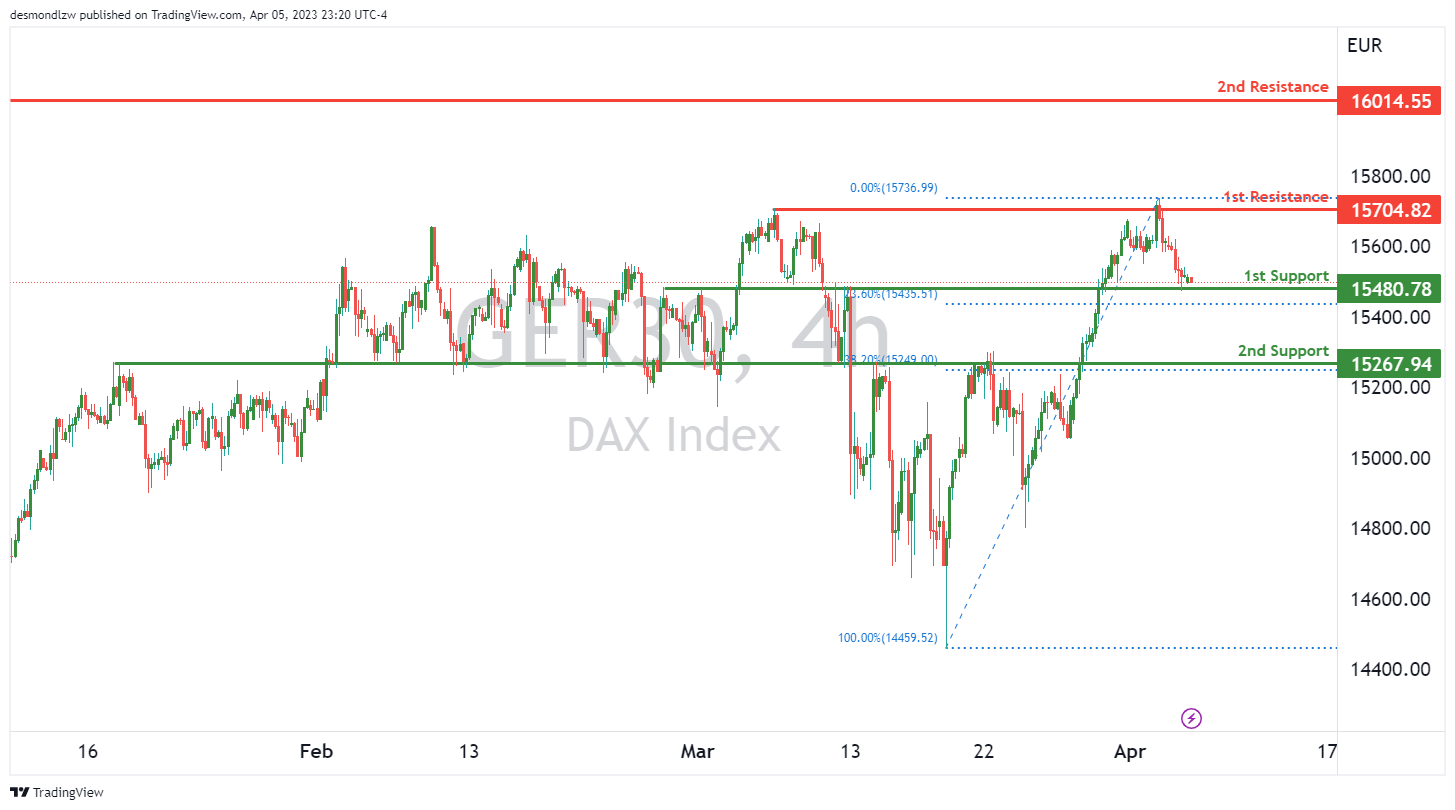
GER30:
The GER30 chart is currently showing bullish momentum, with potential for a bullish bounce off the 1st support and a move towards the 1st resistance. The 1st support level at 15480.78 is an overlap support and lines up with a 23.60% Fibonacci retracement, making it a strong level to watch. If the price were to bounce off this support, it could rise towards the 1st resistance at 15704.82 which is a multi-swing high resistance.
In case the price breaks the 1st support level, the next support to watch out for is the 2nd support at 15267.94 which is another overlap support and has a 38.20% Fibonacci retracement lining up with it.
The 1st resistance level at 15704.82 is a strong level to watch out for, as it is a multi-swing high resistance level. If the price were to break this resistance, it could potentially rise towards the 2nd resistance level at 16014.55 which is a swing high resistance.
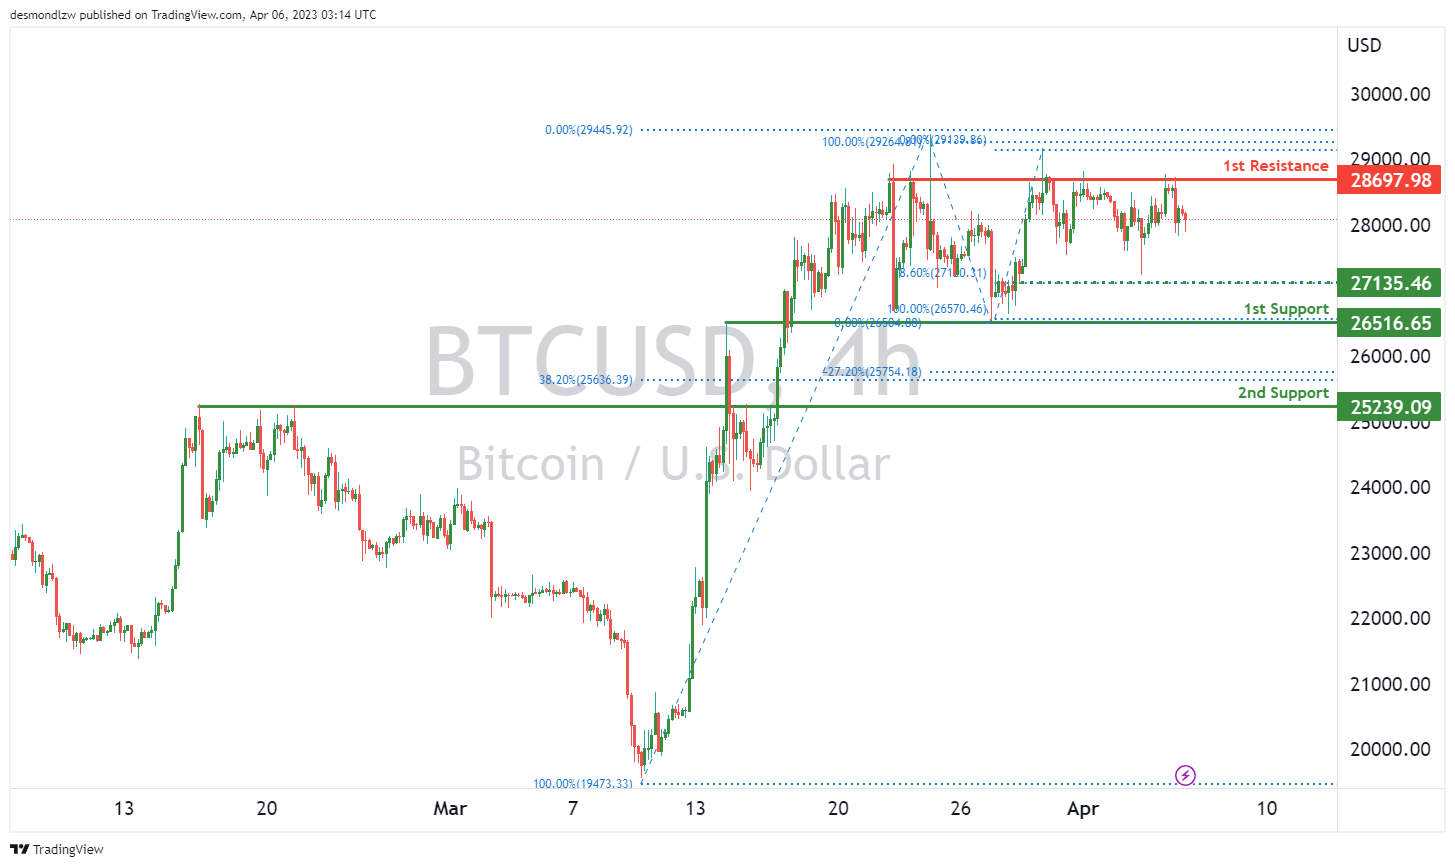
BTC/USD:
BTC/USD chart is currently showing a bearish momentum. The price has potential to continue its bearish movement towards the 1st support level at 26516.65. This level is a good pullback support and could help the price bounce back up. If the price breaks below the 1st support, the next support level to watch out for is the 2nd support at 25239.09 which also coincides with a pullback support.
On the other hand, if the price bounces off the 1st support level, it could potentially rise towards the 1st resistance at 28697.98 which is a multi-swing high resistance level. However, there is an intermediate support level at 27135.46 which is a swing low support. If the price breaks below this intermediate support, it could trigger a strong bearish acceleration towards the 2nd support level.
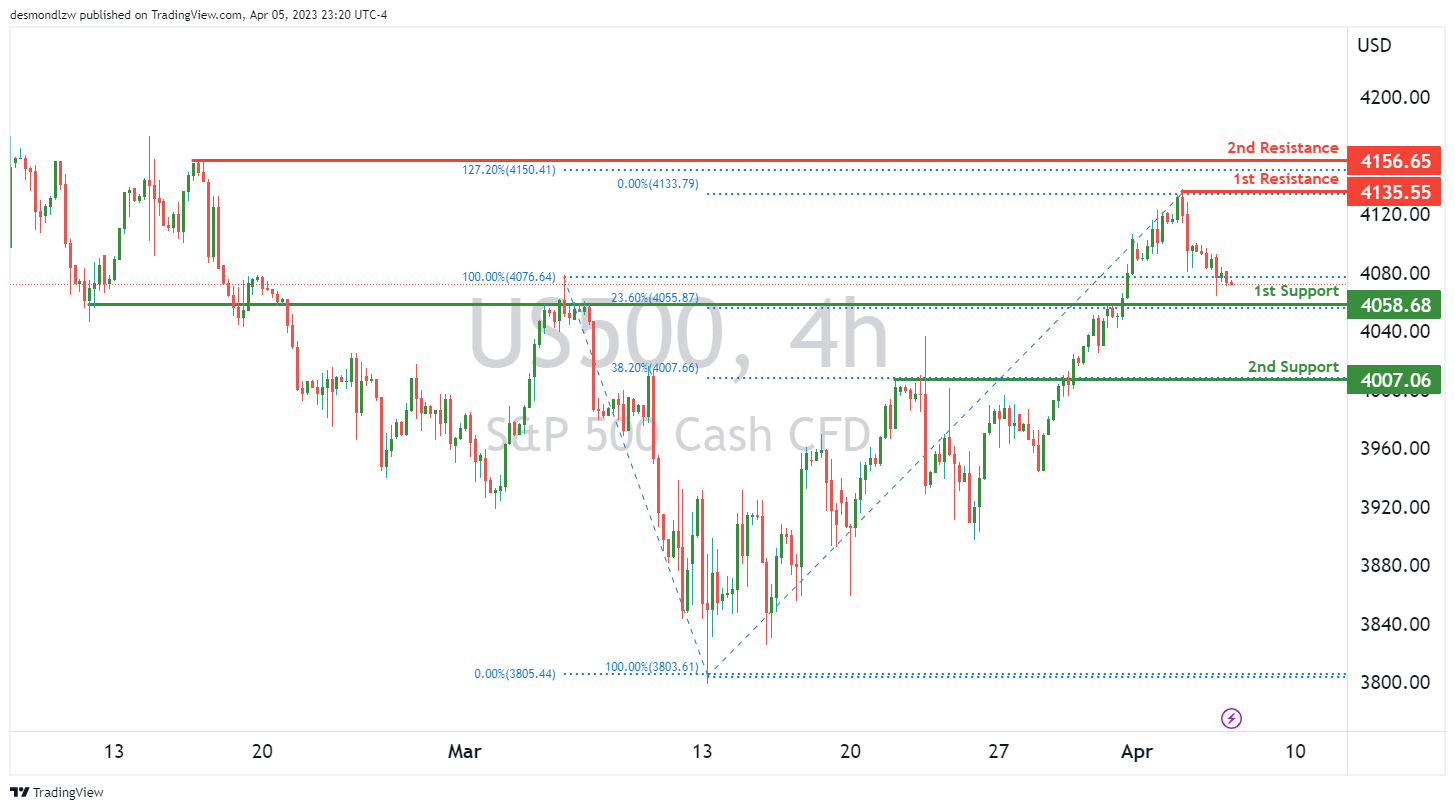
US500
The US500 chart shows a bearish momentum, with potential for a continued drop towards the first support level. The first support level is at 4058.68, and it is a pullback support with a 23.60% Fibonacci retracement. If price were to break this level, it could drop further towards the second support level at 4007.06, which is also a pullback support with a 38.20% Fibonacci retracement.
On the other hand, if price were to bounce from the first support level, it could rise towards the first resistance level at 4135.55, which is a swing high resistance. The second resistance level is at 4156.65, which is also a swing high resistance and coincides with a 127.20% Fibonacci extension.
It is worth noting that the chart is currently showing a bearish momentum, and the descending trend line is suggesting further bearish momentum could be on the cards. If price were to break below the first support level, it could trigger a stronger bearish acceleration towards the second support level. However, if price were to break above the first resistance level, it could trigger a stronger bullish acceleration towards the second resistance level.
ETH/USD:
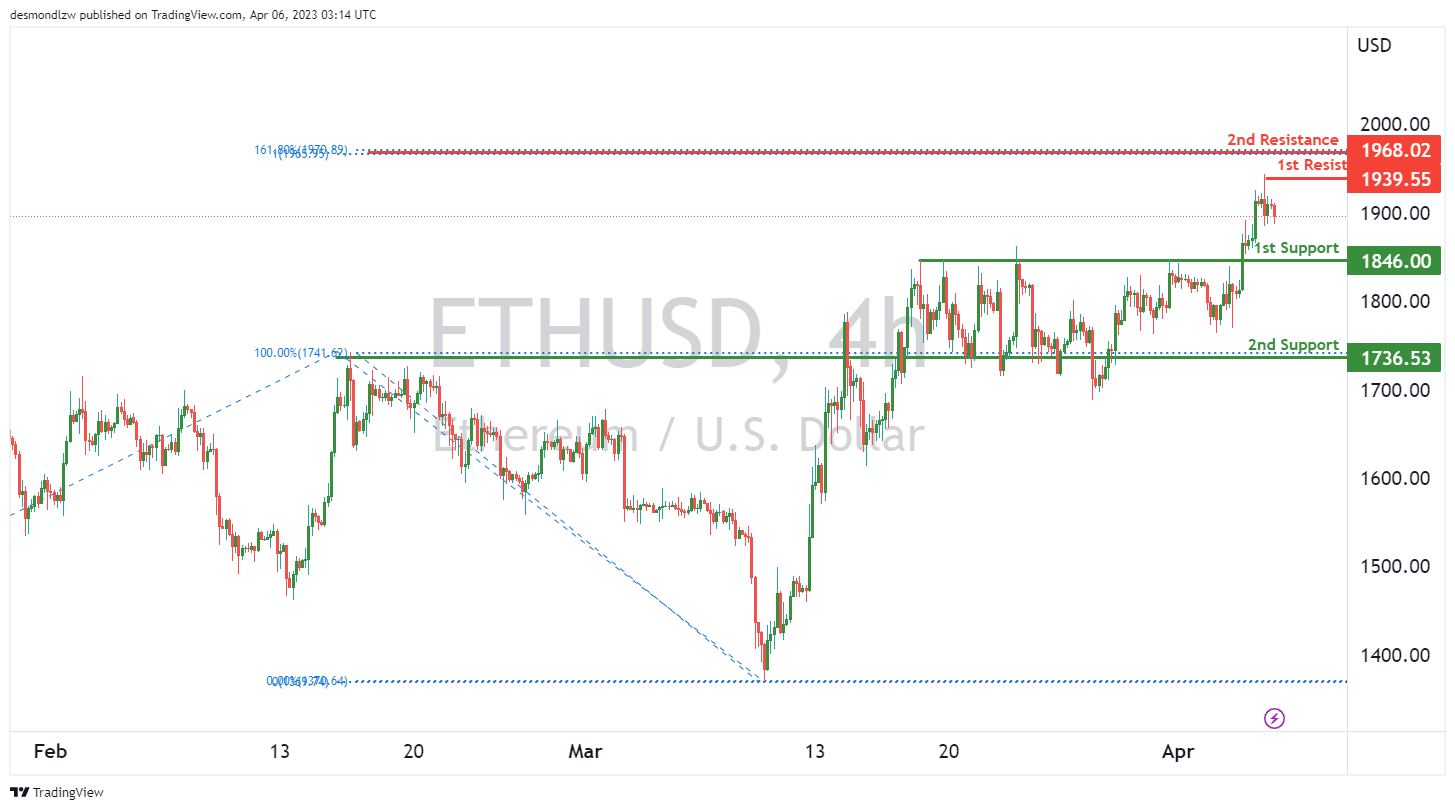
The overall momentum of ETH/USD chart is bearish, which suggests that the price may continue to decrease. The first support level is at 1846.00, which is a pullback support and is located at the 23.60% Fibonacci retracement level. This support level is significant as it could potentially provide a bounce to the price.
The second support level is at 1736.53, which is another pullback support level. This level is also important as it has previously acted as a support level in the past.
The first resistance level is at 1939.55, which is a swing high resistance level. This resistance level is significant as it has previously acted as a barrier to prevent the price from moving higher.
The second resistance level is at 1968.02, which is a swing high resistance level and is located at the 161.80% Fibonacci extension level. This resistance level is also significant as it could potentially act as a strong barrier to prevent the price from moving higher.
WTI/USD:
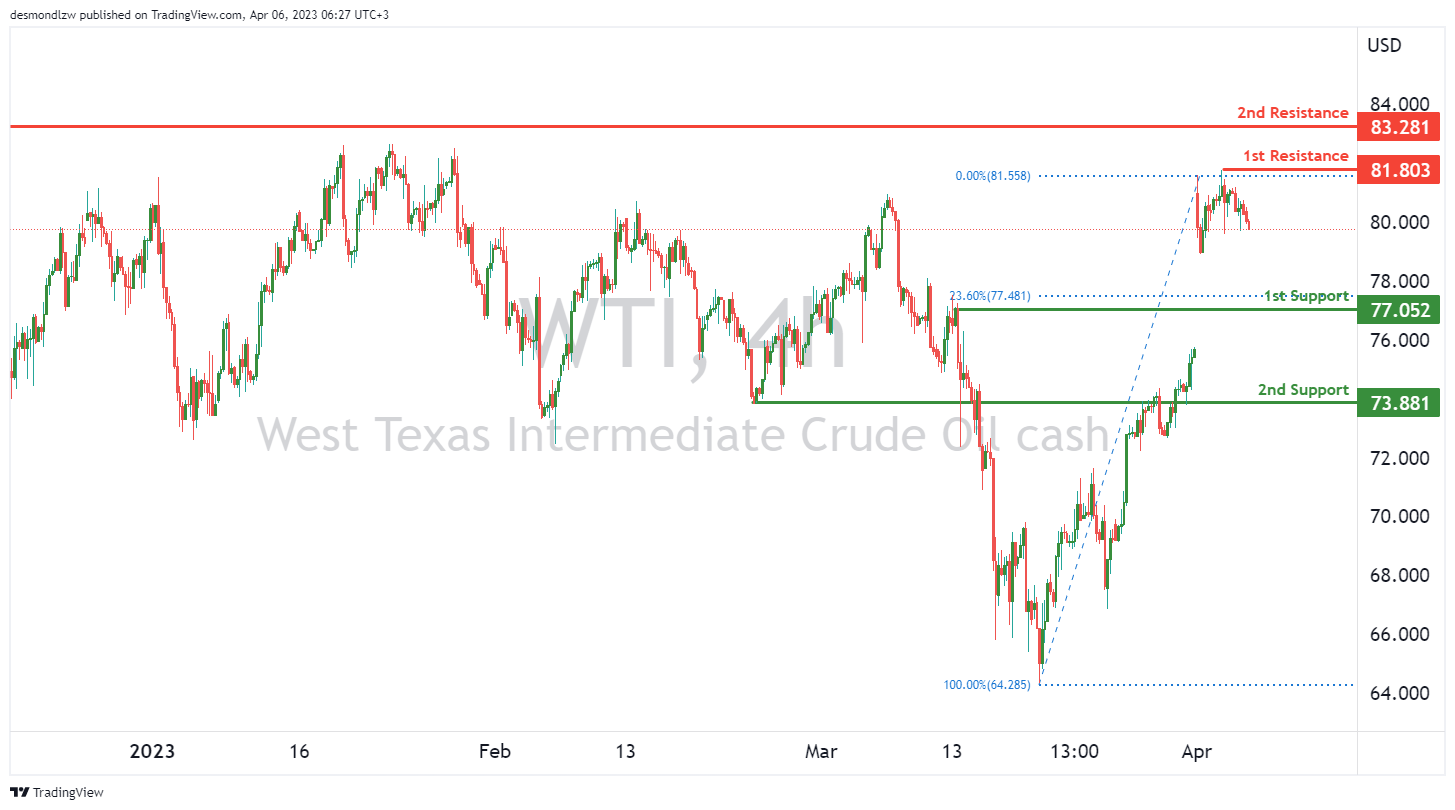
WTI crude oil has been experiencing bearish momentum recently, with the price potentially making a bearish continuation towards the first support level. Currently, the overall momentum of the chart is bearish.
The first support level to watch is at 77.05, which is a pullback support level and also the 23.60% Fibonacci retracement level. This is a key level as a break below it could potentially signal a continuation of the bearish momentum. The second support level to watch is at 73.88, which is an overlap support level.
On the resistance side, the first level to watch is at 81.80, which is a swing high resistance level. If the price manages to break above this level, it could potentially signal a reversal of the bearish momentum. The second resistance level to watch is at 83.28, which is another swing high resistance level.
XAU/USD (GOLD):
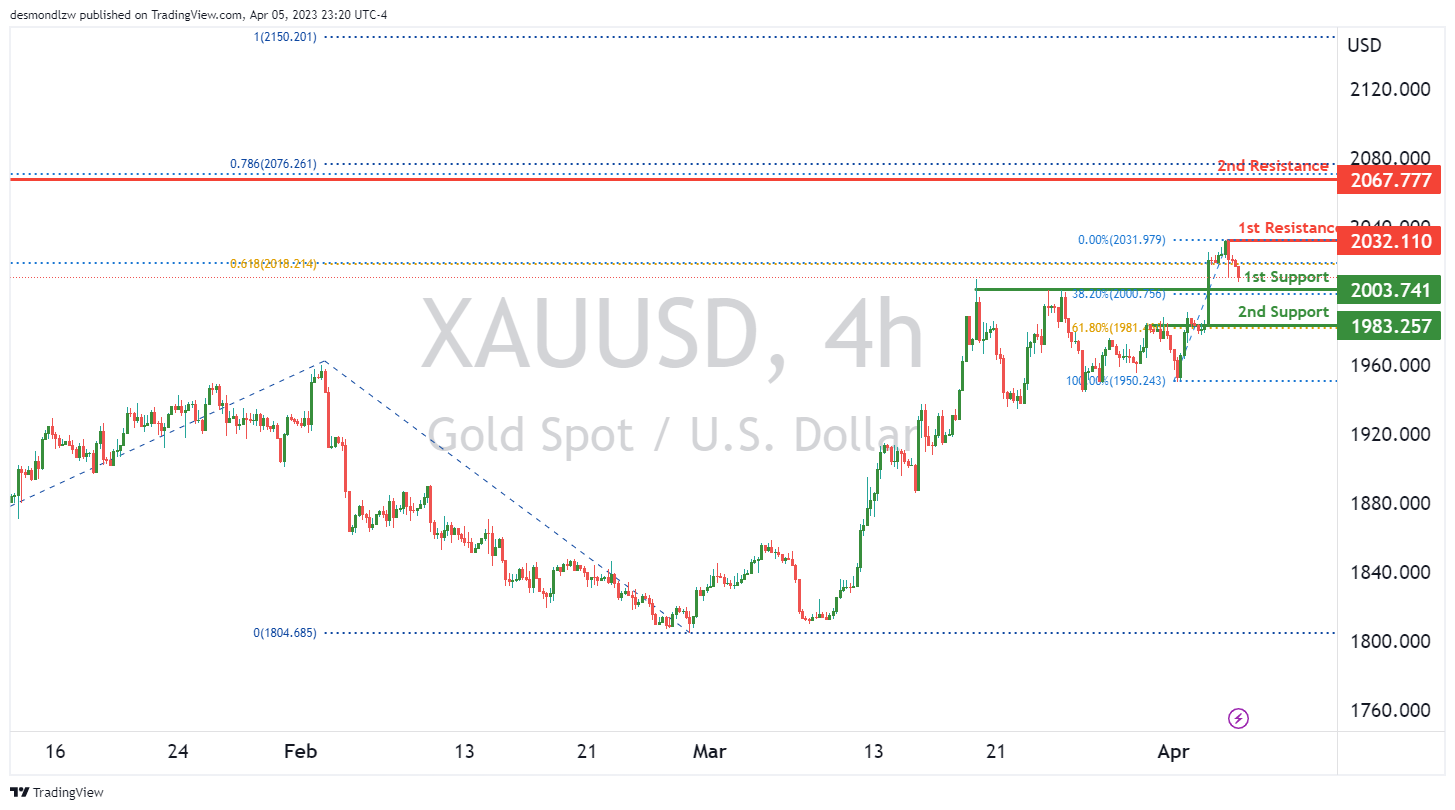
Gold prices have been on a bearish trend recently, with the overall momentum of the XAU/USD chart pointing in a downward direction. This suggests that prices could potentially continue to decline in the near future.
If the bearish trend continues, the price could potentially make a move towards the first support level at $2003.74. This level is a good support zone, as it aligns with the 38.20% Fibonacci retracement level.
If the price breaks below the first support level, it could potentially continue to drop towards the second support level at $1983.25. This level is also a good support zone, as it aligns with the 61.80% Fibonacci retracement level.
On the other hand, if there is a bullish reversal, the price could potentially move towards the first resistance level at $2032.11. This level is a good resistance zone, as it aligns with a previous swing high.
If the bullish momentum continues, the price could potentially move towards the second resistance level at $2067.77, which is also a good resistance zone as it aligns with a previous swing high.
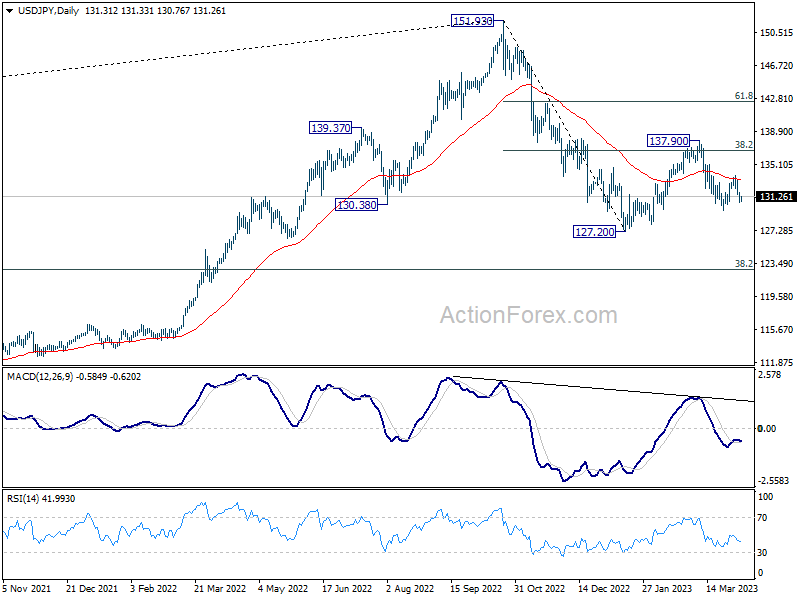
USD/JPY Daily Outlook
Daily Pivots: (S1) 130.70; (P) 131.27; (R1) 131.91; More...
Intraday bias in USD/JPY remains on the downside for 129.62 support. Break there will resume the whole decline form1 37.90 to retest 127.20 low. On the upside, however, above 133.74 resistance will turn bias back to the upside for another rise. Overall, eventual downside break out is expected as long as 137.90 resistance holds.
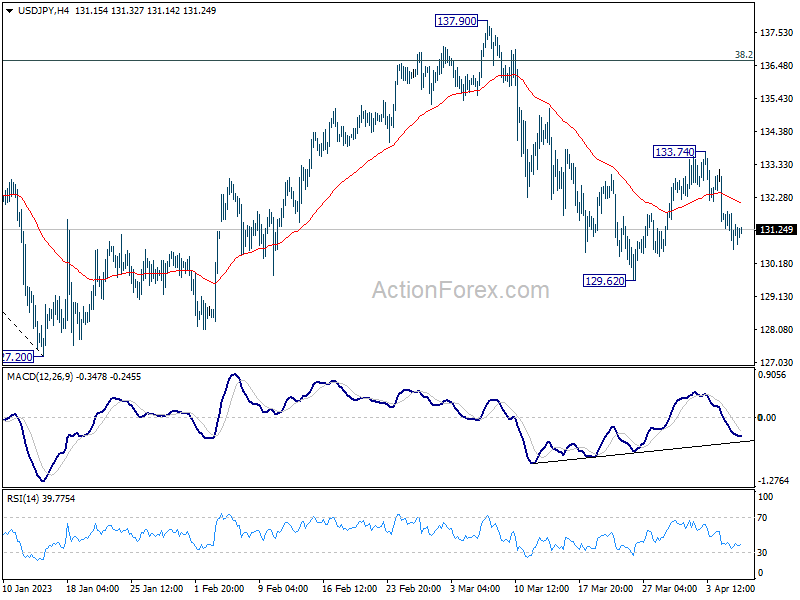
In the bigger picture, corrective pattern from 127.20 might be extending. But after all, down trend from 151.93 is expected to resume at a later stage. Break of 127.20 will resume this down trend and target 61.8% projection of 151.93 to 127.20 from 137.90 at 122.61. This will now be the favored case as long as 137.90 resistance holds.
Yen Rises on Declining Benchmark Yields, Focus Turns to Canadian Job Data
Yen is extending this week's rebound in Asian session, with help from extended decline in US and European benchmark yields. Investors were showing signs of worries of a sharper slowdown in US economy after much weaker than expected economic data. Dollar is recovering on mild risk aversion too, but remains the worst performer of the week. The US markets will be keenly awaiting tomorrow's non-farm payroll data to adjust their forecasts on the economy, Fed's rate path, and next moves in the markets.
But for today, Canadian employment data will be a focus first. The lift from oil prices this week has so far faded, with WTI crude oil still struggling around 80 handle. As for BoC monetary policies, there is little reason for a piece of data to take the central out of the pause in tightening. Nevertheless, there are still speculations of at least one more hike by BoC this year, which will be heavily data-dependent.
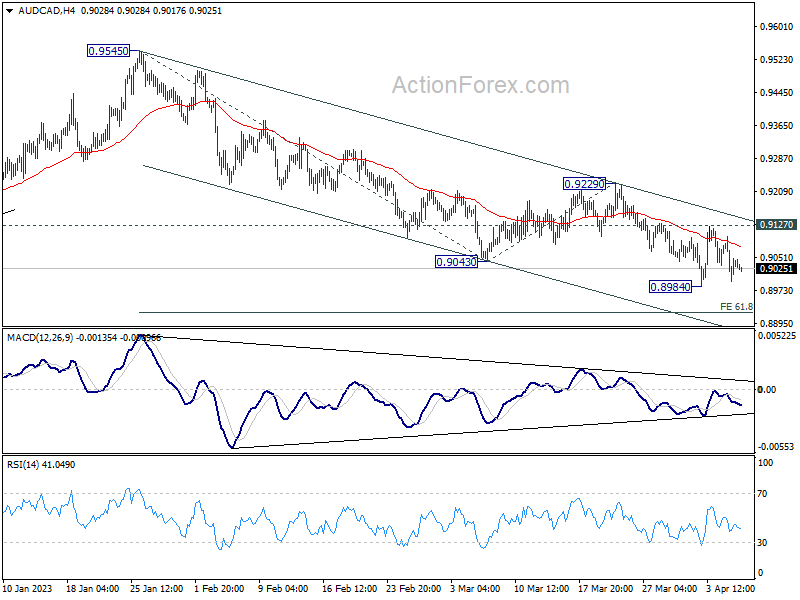
AUD/CAD would be a pair to watch today. Aussie is among the worst performer for the week after RBA's rate pause. Strong job data from Canada could push AUD/CAD through 0.8984 support. The down trend from 0.9545 would then resume and target 61.8% projection of 0.9545 to 0.9043 from 0.9229 at 0.8919. Overall, outlook will stay bearish as long as 0.9127 resistance holds, in case of a rebound.
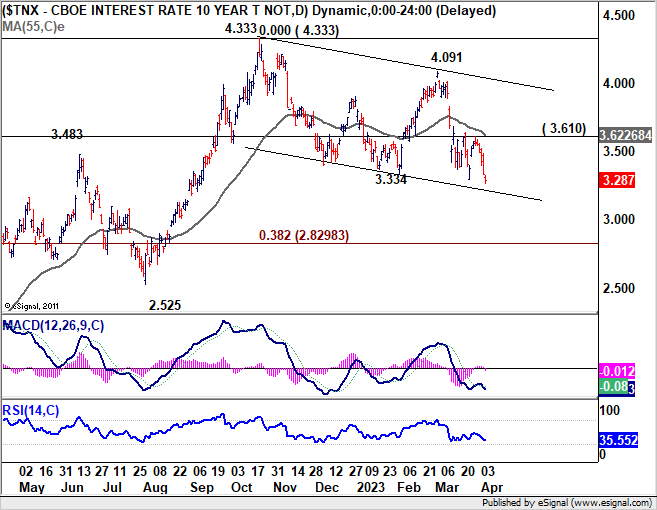
In Asia, at the time of writing, Nikkei is down -1.35%. Hong Kong HSI is down -0.38%. China Shanghai SSE is down -0.01%. Singapore Strait Times is down -0.66%. Japan 10-year JGB yield is down -0.0053 at 0.464. Overnight, DOW rose 0.24%. S&P 500 dropped -0.25%. NASDAQ dropped -1.07%. 10-year yield dropped -0.050 to 3.287.
US 10-year yield plunges to 7-month low on worries of sharper slowdown
Following weaker-than-expected private job data and services PMI, US 10-year yield dropped to its lowest level in seven months overnight. Despite these signs of a potential cooling in the economy, which could prompt the Fed to ease up on tightening measures, major stock indexes closed mixed, suggesting that investors may be more concerned about a sharper slowdown on the horizon.
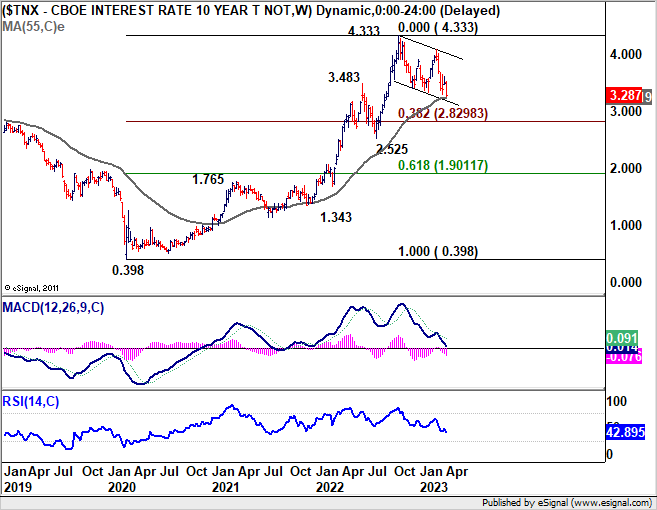
Technically, 10-year yield is approaching a critical support level at 55 week EMA (now at 3.237). A rebound around the EMA, followed by a break of 3.61 resistance, would initially signal a short-term bottoming. More importantly, this would argue that price fluctuations from 4.333 are merely a medium-term corrective pattern.
However, firm break of the 55 week EMA could indicate that 10-year yield is already correcting the whole uptrend that began at 0.398 (2020 low). In this scenario, a deeper decline through the 3% handle to 38.2% retracement of 0.398 to 4.333 at 2.829 could occur before finding sufficient support for a sustainable bounce.
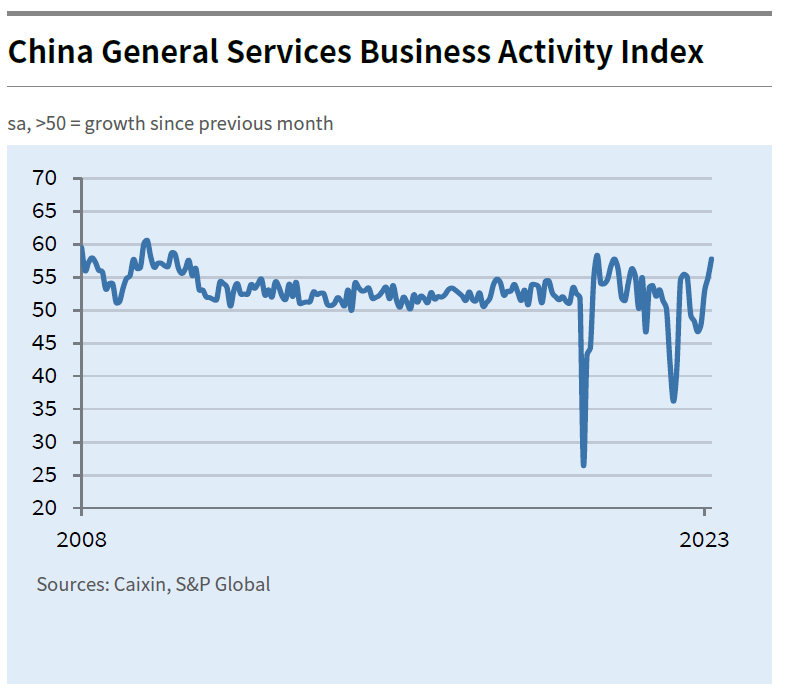
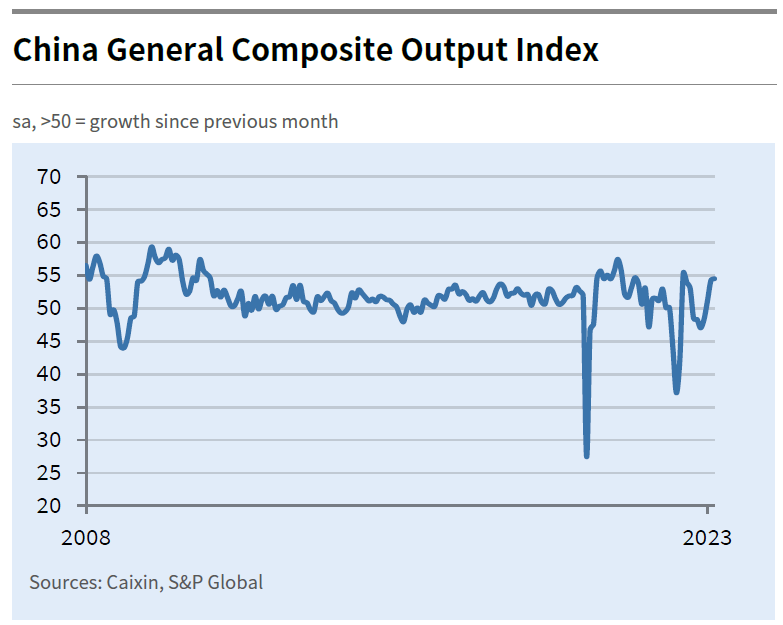
China Caixin PMI services rose to 57.8, highest since Nov 2020
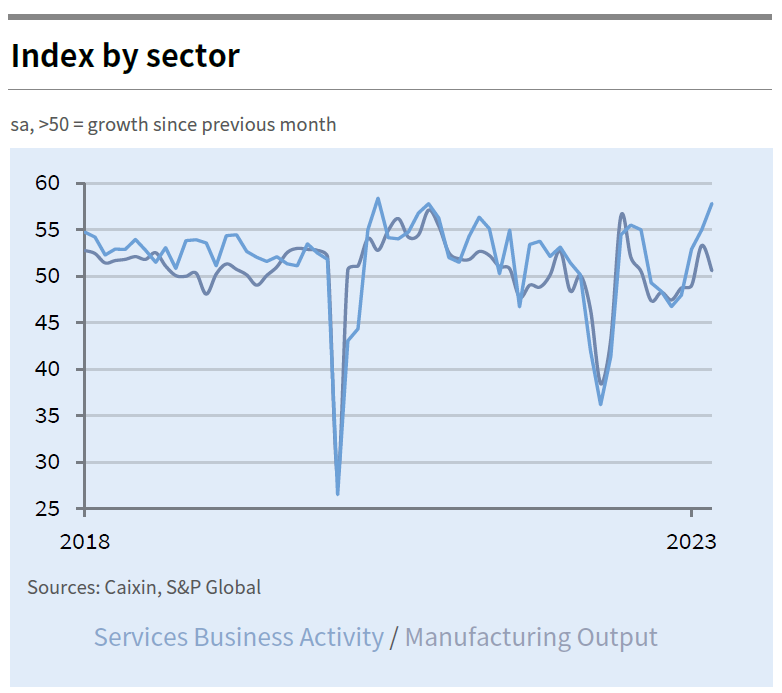
China's Caixin PMI Services index exceeded expectations in March, rising from 55.0 to 57.8, marking the highest level since November 2020. The data revealed sharp increases in activity, sales, and employment, with the services sector showing stronger expansion compared to the manufacturing sector. Business confidence remained historically strong, while input price inflation reached a seven-month high. The PMI Composite also experienced a slight increase from 54.2 to 54.5, reaching its highest point since June 2022.
Wang Zhe, Senior Economist at Caixin Insight Group said: "Production, demand and employment all grew, with the services sector showing a stronger expansion, whereas manufacturing activity turned comparatively sluggish. Input costs and prices charged remained stable, and businesses were highly optimistic."
Looking ahead
Swiss unemployment rate and foreign currency reserves, Germany industrial production and UK PMI construction will be released in European session. Later in the day, Canada employment will take center stage, while US will release Challenger job cuts and jobless claims.
USD/JPY Daily Outlook
Daily Pivots: (S1) 130.70; (P) 131.27; (R1) 131.91; More...
Intraday bias in USD/JPY remains on the downside for 129.62 support. Break there will resume the whole decline form1 37.90 to retest 127.20 low. On the upside, however, above 133.74 resistance will turn bias back to the upside for another rise. Overall, eventual downside break out is expected as long as 137.90 resistance holds.
In the bigger picture, corrective pattern from 127.20 might be extending. But after all, down trend from 151.93 is expected to resume at a later stage. Break of 127.20 will resume this down trend and target 61.8% projection of 151.93 to 127.20 from 137.90 at 122.61. This will now be the favored case as long as 137.90 resistance holds.
Economic Indicators Update
| GMT | Ccy | Events | Actual | Forecast | Previous | Revised |
|---|---|---|---|---|---|---|
| 01:30 | AUD | Trade Balance (AUD) Feb | 13.87B | 11.12B | 11.69B | 11.27B |
| 01:45 | CNY | Caixin Services PMI Mar | 57.8 | 55 | 55 | |
| 05:45 | CHF | Unemployment Rate Mar | 1.90% | 1.90% | 1.90% | |
| 06:00 | EUR | Germany Industrial Production Feb | -0.40% | 3.50% | ||
| 07:00 | CHF | Foreign Currency Reserves (CHF) Mar | 771B | |||
| 08:30 | GBP | Construction PMI Mar | 53.6 | 54.6 | ||
| 11:30 | USD | Challenger Job Cuts Mar | 410.10% | |||
| 12:30 | USD | Initial Jobless Claims (Mar 31) | 200K | 198K | ||
| 12:30 | CAD | Net Change in Employment Mar | 10.2K | 21.8K | ||
| 12:30 | CAD | Unemployment Rate Mar | 5.10% | 5.00% | ||
| 14:00 | CAD | Ivey PMI Mar | 52 | 51.6 | ||
| 14:30 | USD | Natural Gas Storage | -20B | -47B |
US 10-year yield plunges to 7-month low on worries of sharper slowdown
Following weaker-than-expected private job data and services PMI, US 10-year yield dropped to its lowest level in seven months overnight. Despite these signs of a potential cooling in the economy, which could prompt the Fed to ease up on tightening measures, major stock indexes closed mixed, suggesting that investors may be more concerned about a sharper slowdown on the horizon.
Technically, 10-year yield is approaching a critical support level at 55 week EMA (now at 3.237). A rebound around the EMA, followed by a break of 3.61 resistance, would initially signal a short-term bottoming. More importantly, this would argue that price fluctuations from 4.333 are merely a medium-term corrective pattern.
However, firm break of the 55 week EMA could indicate that 10-year yield is already correcting the whole uptrend that began at 0.398 (2020 low). In this scenario, a deeper decline through the 3% handle to 38.2% retracement of 0.398 to 4.333 at 2.829 could occur before finding sufficient support for a sustainable bounce.
China Caixin PMI services rose to 57.8, highest since Nov 2020
China's Caixin PMI Services index exceeded expectations in March, rising from 55.0 to 57.8, marking the highest level since November 2020. The data revealed sharp increases in activity, sales, and employment, with the services sector showing stronger expansion compared to the manufacturing sector. Business confidence remained historically strong, while input price inflation reached a seven-month high. The PMI Composite also experienced a slight increase from 54.2 to 54.5, reaching its highest point since June 2022.
Wang Zhe, Senior Economist at Caixin Insight Group said: "Production, demand and employment all grew, with the services sector showing a stronger expansion, whereas manufacturing activity turned comparatively sluggish. Input costs and prices charged remained stable, and businesses were highly optimistic."
Cliff Notes: Asia Shows its Strength as US Growth Prospects Dwindle
Key insights from the week that was.
In Australia, the RBA was the key focus of market participants. Offshore, the RBNZ asserted their hawkish resolve while US data weakened noticeably.
The RBA decided to leave the cash rate unchanged at 3.60% in April, a decision that was in line with Westpac’s forecast. In accordance with the decision, the Governor’s statement incorporated a subtle change in guidance, suggesting that further tightening “may well be needed” versus “will be needed” in March. While this certainly still qualifies as a tightening bias, clearly the Board is increasingly wary of the need to assess the full spectrum of risks having delivered 350bps of interest rate increases over the last ten months.
In our view, the evolution of underlying inflation pressures is of critical importance for the near-term path for policy. Westpac anticipates that annual trimmed mean inflation will print 6.6% in Q1, a result which the RBA should deem as uncomfortably high in the context of a historically tight labour market, thereby warranting a policy response. Hence, we continue to forecast one final 25bp rate hike in May, raising the cash rate to a peak of 3.85% where we expect it to remain over the rest of 2023. As economic momentum continues to slow and inflation risks abate, a series of interest rate cuts will be able to be implemented through 2024 and 2025 to bring policy back towards neutral, facilitating a recovery in activity growth.
In terms of domestic data, this week’s housing updates were generally mixed. Most notably, the CoreLogic home value index seems to be indicating some form of stabilisation in house prices, rising by 0.8% in March after a mild dip of just 0.1% in February. The pace of monthly declines in housing finance approvals meanwhile continued to moderate in February; but, broadly speaking, this gauge continues to point towards a further significant slowing in housing credit growth as interest rate headwinds build. Meanwhile, monthly updates on dwelling approvals remain hostage to its own seasonalities: coming off extreme volatility in high-rise approvals and now with emerging issues around processing delays, February’s modest 4.0% rise looks to be concealing an underlying softening in the trend, as evinced by the 30% decline in approvals over the last year. On balance, we remain confident in the assessment that broadening headwinds, particularly with regards to interest rates and the wider economic outlook, will remain a material drag on the housing sector over this year, but we are alert to the possibility of a sustained stabilisation emerging.
Turning then to New Zealand and the RBNZ, their decision to hike by 50bps this week caught the market by surprise, the consensus expectation being a 25bp move. The tone of the statement was also hawkish, the RBNZ clearly wary of the potential inflation consequences of the post-cyclone rebuild given the economy is already stretched. As explained by our New Zealand team led by Chief Economist Kelly Eckhold, the RBNZ’s focus looks to be on quickly achieving the outright level of policy they believe is required to bring inflation back to target. The RBNZ also noted that the recent decline in wholesale funding costs could lower borrowing costs across the economy; the 50bp move was then seen as a way to help “maintain the current lending rates faced by businesses and households”. This situation highlights the tension which is building between monetary policy in New Zealand and the rest of the developed world where policy is seen at or very near peak levels. Our New Zealand economics team now expect a 25bp hike in May to 5.50% and for the RBNZ to retain a tightening bias thereafter, pending further information.
Turning to the US, three data releases stood out this week: the ISMs and JOLTs job openings.
Both the ISM manufacturing and ISM service PMIs surprised materially to the downside in March, with the manufacturing contraction accelerating (the headline index coming in at 46.3) and the services measure almost stalling at 51.2. Also of significance is that new orders amongst manufacturers were particularly weak (the index declining to 44.3), while those for service firms fell sharply (the orders index down 10pts to 52.2).
Not only do these outcomes point to persistent weakness in activity ahead, but also clear risks around employment for which the starting point is a contractionary read for manufacturing and only a marginally positive level for services. A sharp drop in JOLTS job openings in February provided further evidence of building downside risks for employment, available positions declining to 9,931k in February from a downwardly revised 10,563k in January and the 2022 peak of 12,027k. While highly volatile and often off the mark as a lead for nonfarm payrolls (due Friday night), ADP private payrolls was also soft in March.
We have long highlighted the risks for the US economy from tighter policy and the shock to household finances from high inflation. These concerns led us to remain of the view that the US is likely to experience a lengthy period of stagnation, with an output gap in the order of 3.0% by end-2024. As discussed last week, given recent developments in the US banking sector, the risks to this view are skewing to the downside. Most significant is the potential for US GDP growth to get stuck at a rate below potential beyond 2024. This is why we see need for the FOMC to act aggressively on policy in 2024, once inflation risks have abated; but also why it is necessary banking sector regulatory reform occur with haste to restore confidence amongst both borrowers and lenders. If the latter is delayed, the benefit of 2024’s monetary easing could be offset.
Our April Market Outlook will be released later today on Westpac IQ. A key theme of our economic forecasts is the opportunity present in Asia. We also see the region’s cyclical rebound and ongoing structural development as a source for sustained gains in risk appetite, benefitting the currencies of the region over the forecast period, including the Australian dollar.
Gold Price Rallies Further Above $2K, Dollar Struggles
Key Highlights
- Gold price gained pace above the $2,000 resistance.
- It broke a major contracting triangle with resistance near $1,985 on the 4-hours chart.
- EUR/USD started a consolidation phase above the 1.0880 zone.
- USD/JPY is slowly moving lower toward the 129.50 support.
Gold Price Technical Analysis
Gold price remained well-bid above the $1,950 support zone against the US Dollar. The price started a fresh increase above the $1,980 resistance.
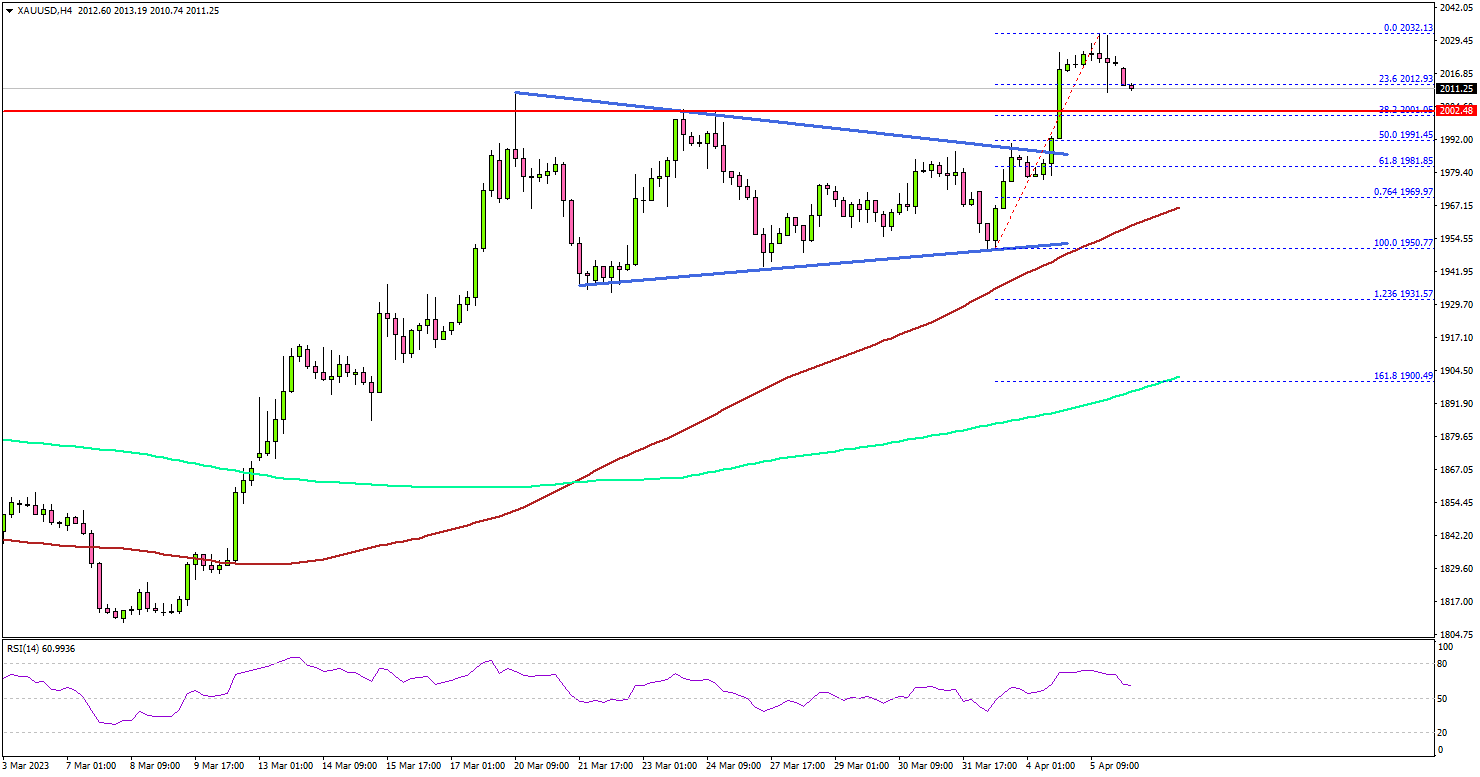
The 4-hours chart of XAU/USD indicates that the price cleared many hurdles near the $1,980 and $1,988 levels. It even settled above the 100 Simple Moving Average (red, 4 hours), and the 200 Simple Moving Average (green, 4 hours).
Besides, the price broke a major contracting triangle with resistance near $1,985 on the same chart. Finally, there was a clear move above the $2,000 resistance zone.
It tested the $2,030 zone before the bears appeared. Immediate resistance near the $2,035 level. The next major resistance is near the $2,050 level. Any more gains might send the price toward the $2,065 level.
On the downside, initial support is near the $2,000 level. The next major support is near the $1,980 level, below which there is a risk of a move toward the $1,965 level.
The next major support is near the $1,950 level, below which gold price might struggle to stay above the $1,932 zone. In the stated case, gold price could slide towards the $1,910 support.
Looking at EUR/USD, the pair failed to test the 1.1000 resistance zone and recently started a consolidation phase.
Economic Releases to Watch Today
- US Initial Jobless Claims - Forecast 200K, versus 198K previous.
- Canada’s employment Change for March 2023 – Forecast 12K, versus 21.8K previous.
- Canada’s Unemployment Rate April 2023 - Forecast 5.1%, versus 5.0% previous.
Elliott Wave Projects GBPUSD Pullback Should Continue to Find Support
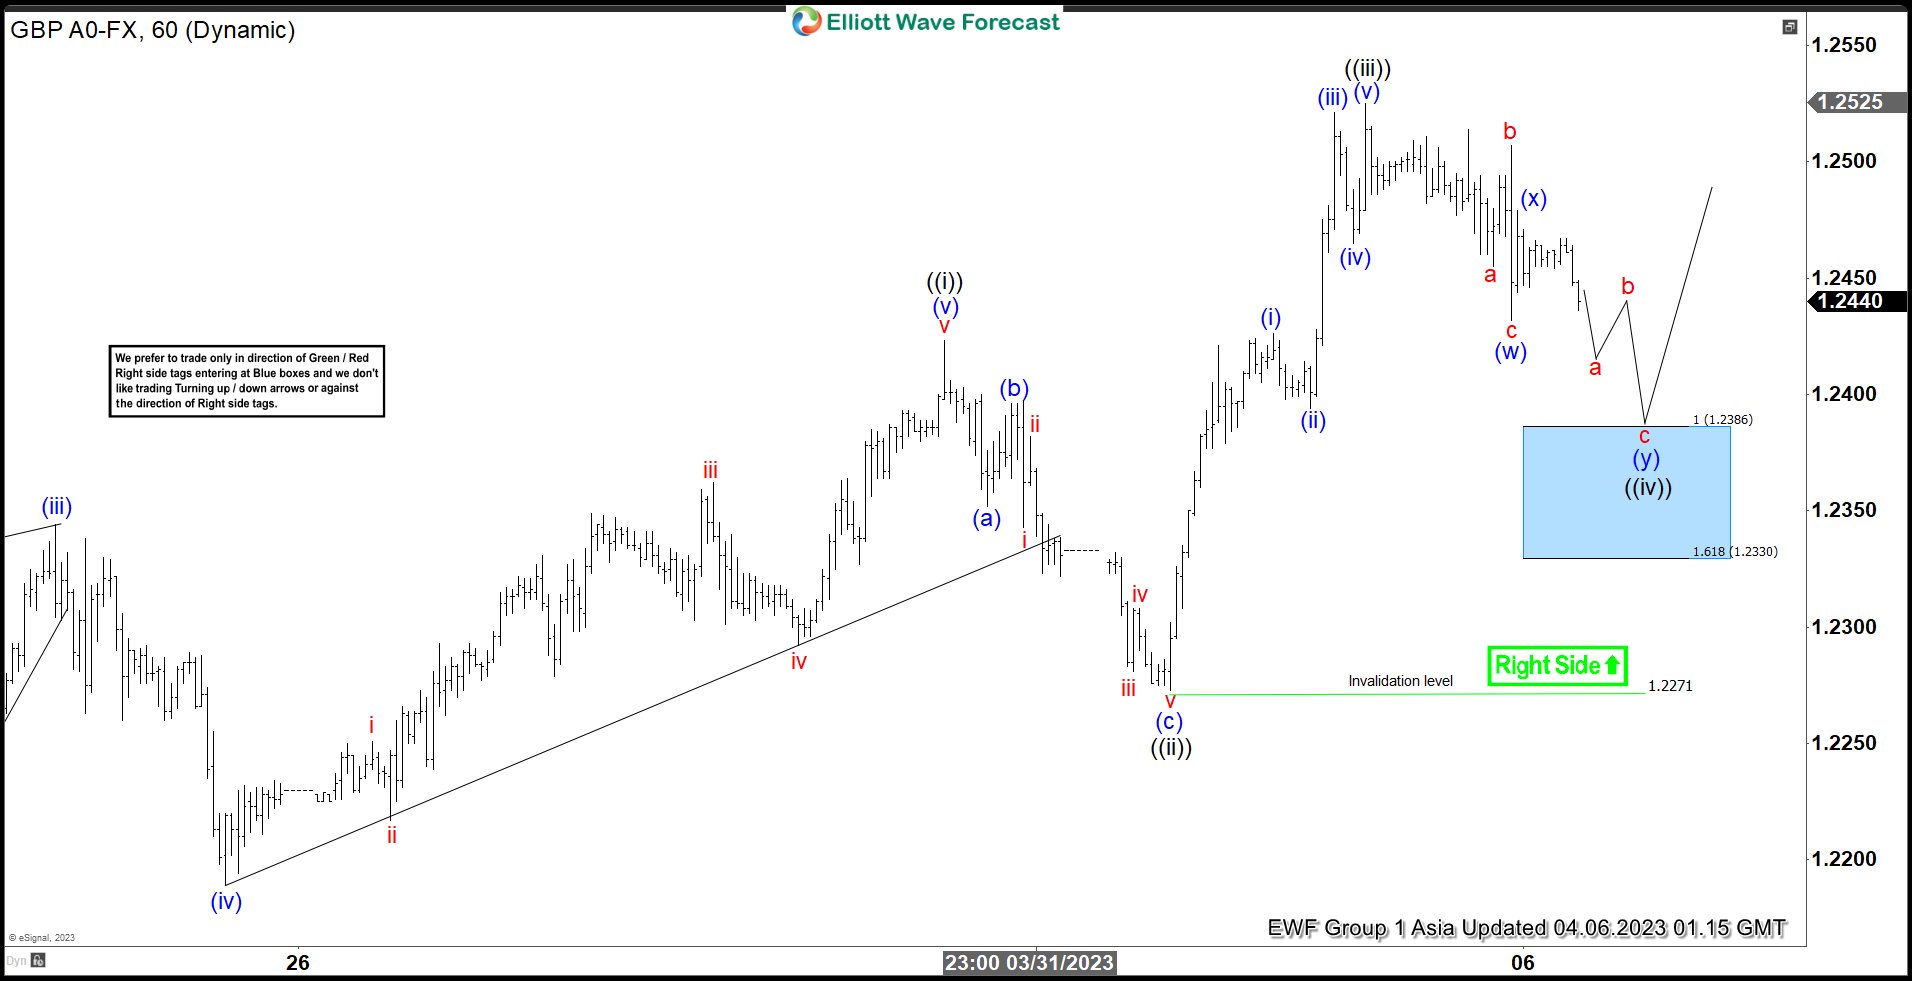
GBPUSD broke above previous peak on 1.23.2023 high at 1.2448 and now shows a bullish sequence from 9.26.2022 low. Cycle from 3.8.2023 low is currently in progress as a 5 waves impulse Elliott Wave structure. Up from 3.8.2023 low, wave (i) ended at 1.2204 and pullback in wave (ii) ended at 1.2009. Pair extends higher in wave (iii) towards 1.2344, and dips in wave (iv) ended at 1.2189. Final leg higher wave (v) ended at 1.2423 which completed wave ((i)).
Wave ((ii)) pullback ended at 1.2271 as the 1 hour chart below shows with internal subdivision as a zigzag. Down from wave ((i)), wave (a) ended at 1.2352, wave (b) ended at 1.2397 and wave (c) lower ended at 1.2271. Pair has resumed higher in wave ((iii)) towards 1.2525 as an impulse. Up from wave ((ii)), wave (i) ended at 1.2426 and wave (ii) ended at 1.2394. Wave (iii) ended at 1.2521, pullback in wave (iv) ended at 1.2465, and final leg wave (v) ended at 1.2525 which completed wave ((iii)). Pullback in wave ((iv)) is in progress as a double three structure. Down from wave ((iii)), wave (w) ended at 1.243 and wave (x) ended at 1.2479. Expect wave (y) to extend lower to 1.233 – 1.2386 blue box area where buyers should appear for further upside.
GBPUSD 60 Minute Elliott Wave Chart
GBPUSD Elliott Wave Video
https://www.youtube.com/watch?v=dEMw8_WdPwM