Sample Category Title
Ethereum’s Overtaking
Market picture
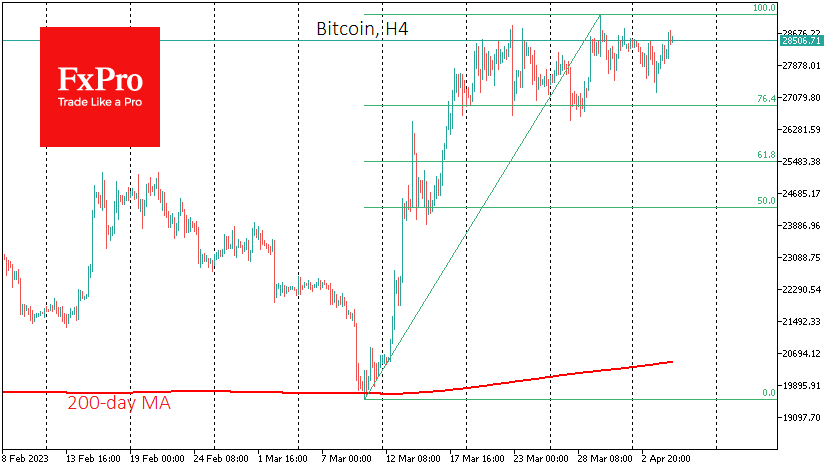
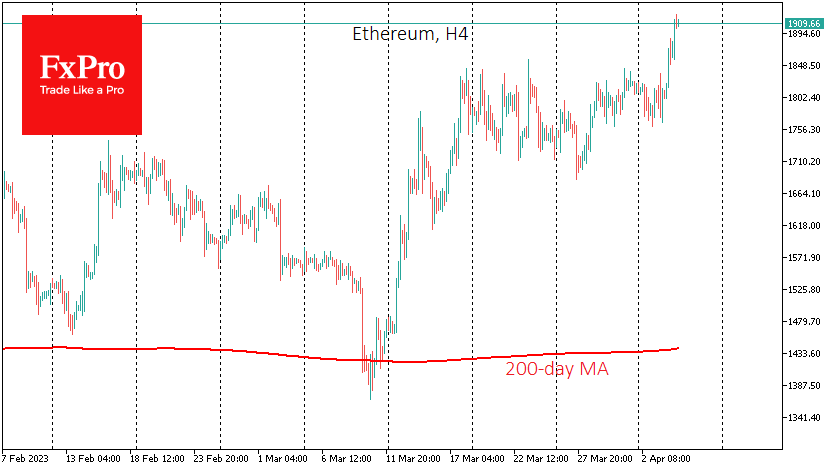
The cryptocurrency market has gained over 3% in the last 24 hours, reaching $1.21 trillion. Interestingly, Bitcoin has yet to keep pace with the overall crypto market growth, adding 2.3% to $28.55K over the same period. Ethereum, on the other hand, has risen by 5.5% to $1910.
The first cryptocurrency is stuck in local highs, above which it has been unable to consolidate since 19th March. This prolonged consolidation sets the stage for the next big move. The resolution of this consolidation is likely to be linked to the market’s reaction to Friday’s Non-Farm Payrolls. Technically, a pullback to the $27k level to correct the rally of the 10th of March is likely.
A more bullish scenario is offered by Ethereum, which broke through resistance in a sharp move yesterday and continues to gain traction, reaching an 8-month high. The dynamics within the Fibonacci theory suggest that a target near $2150 could be considered.
News background
According to Kaiko estimates, Binance’s share of the spot crypto market fell by 16% to 54% in the first quarter. The decline was facilitated by removing commission-free trading on several instruments and the CFTC lawsuit.
The CFTC’s lawsuit against Binance did not result in a significant outflow of users from the platform and reduced investor confidence in BTC, Glassnode noted. The transitional structure of the Bitcoin market continues to take shape after a bearish period. The number of addresses holding at least one BTC is approaching 1 million.
According to Brown Brothers Harriman (BBH) research, nearly 3/4 of institutional investors surveyed said they were “extremely or very interested” in cryptocurrency ETFs. Meanwhile, only 25% of respondents plan to increase their investments over the next year.
The US Department of Justice reported seizing $112 million in digital assets from cryptocurrency fraud and money laundering perpetrators.
AUD/USD: Aussie Dollar Under Increased Pressure on Expectations that Interest Rate Has Peaked
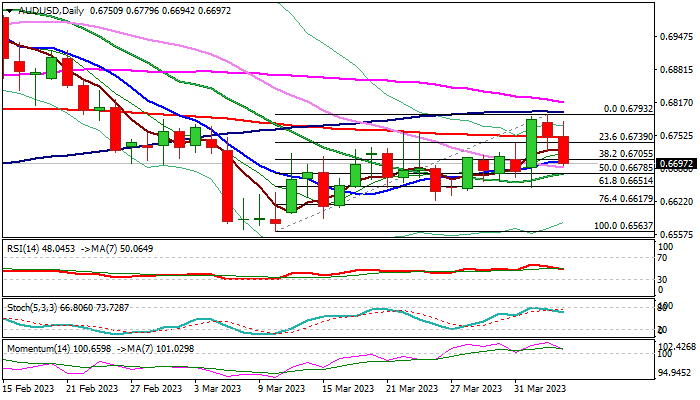
Australian dollar remains in red for the second consecutive day, with bearish acceleration in early Wednesday, generating an initial signal of reversal, after recovery leg from 0.6563 Mar 10 low, stalled under 100DMA (0.6797).
The Aussie came under increased pressure after the Reserve Bank of Australia stayed on hold on Tuesday, keeping its cash rate unchanged at 3.6% after ten consecutive rate hikes and was further deflated on today’s comments from National Australia Bank.
NAB said it expects that Australia’s interest rate has peaked at 3.6%, from previous forecast of 3.85% which was revised last week from 4.1%, with strong downward revisions within a short period of time.
Economists expects inflation to moderate in coming months that would keep the central on hold, probably until the first half of 2024, when the first rate cut is expected.
Technical picture on daily chart is weakening as 14-d momentum is in steep descend and approaching the centreline and thickening falling daily cloud after yesterday’s twist, increases downside pressure.
Break of 200DMA (0.6748) generated initial negative signal, which was boosted by violation of next pivots at 0.6705/00 (Fibo 38.2% of 0.6563/0.6793 / 10DMA), with close below these levels required to confirm signal.
Bears eye immediate target at 0.6678 (20DMA / 50% retracement), ahead of more significant 0.6651 (Fibo 61.8% / Monday’s low) break of which would confirm an end of 0.6563/0.6793 corrective phase.
Near term bias is expected to remain with bears while the price action stays below 200DMA, which guards upper pivot at 0.6797 (100DMA).
Res: 0.6705; 0.6739; 0.6748; 0.6797
Sup: 0.6678; 0.6651; 0.6617; 0.6589
Technical Outlook and Review
DXY:
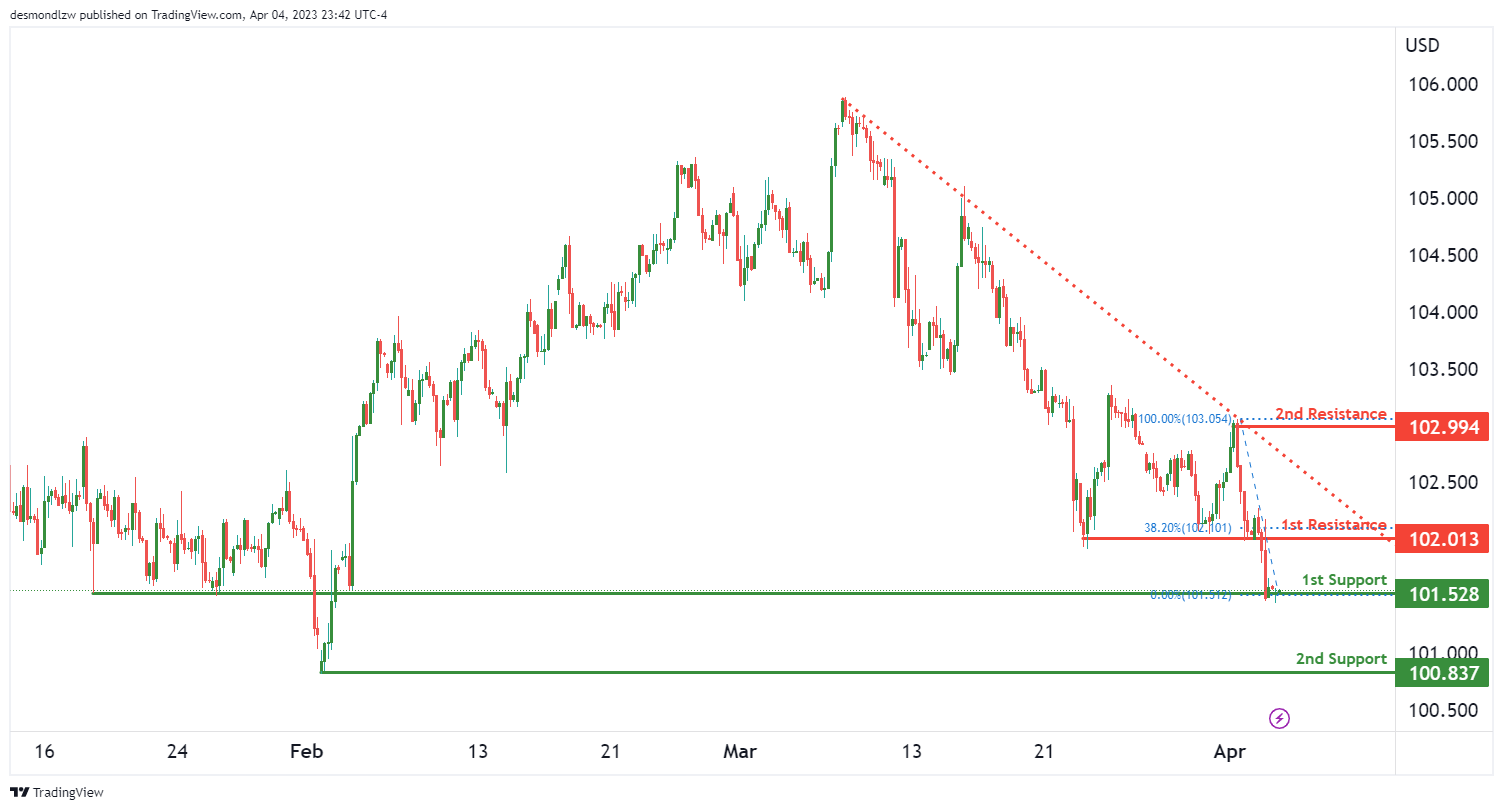
The DXY chart is currently showing a bearish momentum, with several factors contributing to the downward pressure. Firstly, price is below a major descending trend line, which suggests that bearish momentum is likely to continue in the near future.
Looking at the support and resistance levels, we can see that price could potentially make a bearish break off the 1st support and drop towards the 2nd support. The 1st support level is at 101.52, and it is a good level of support as it is an overlap support. On the other hand, the 2nd support level is at 100.83, and it is a swing low support, making it another strong level of support.
In terms of resistance levels, the 1st resistance level is at 102.01. This level is a pullback resistance and also has a 38.20% Fibonacci retracement lining up with it, which makes it a strong level of resistance. The 2nd resistance level is at 102.99, and it is a swing high resistance.
It is worth noting that the overall momentum of the chart is bearish, which suggests that prices are likely to continue to decline. Furthermore, the fact that price is below a major descending trend line reinforces this bearish bias.
EUR/USD:
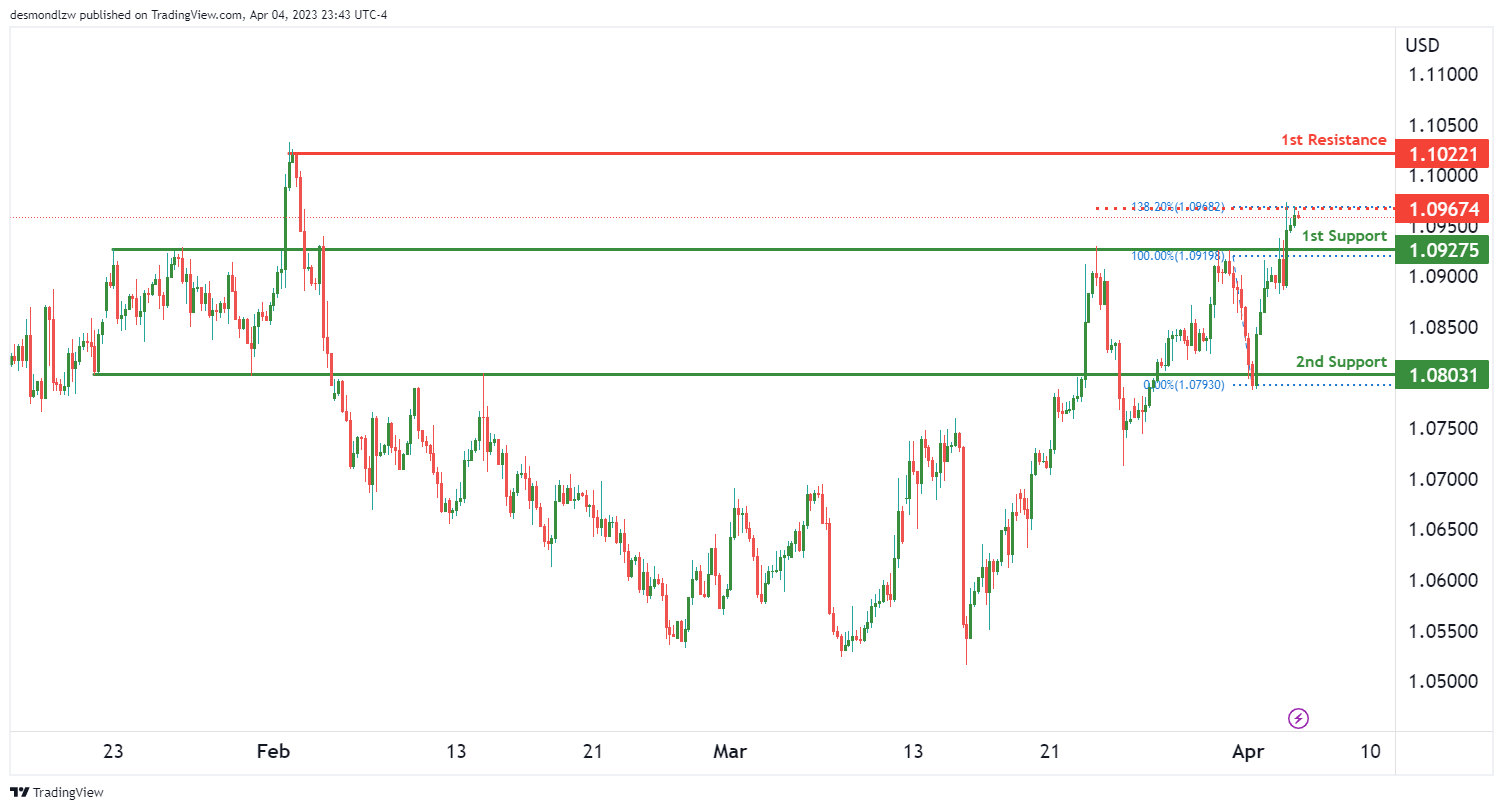
The EUR/USD chart is currently showing a bullish momentum, with potential for a bullish continuation towards the 1st resistance level.
Looking at the support levels, we can see that the 1st support level is at 1.0927, which is an overlap support and a good level of support. The 2nd support level is at 1.0803, and it is also an overlap support, making it another strong level of support.
In terms of resistance levels, the 1st resistance level is at 1.1022, which is a swing high resistance and a good level of resistance. Additionally, there is an intermediate resistance level at 1.0967, which is a swing high resistance and has a 138.20% Fibonacci extension lining up with it, making it another strong level of resistance.
The overall momentum of the chart is bullish, which suggests that prices are likely to continue to rise. Given the potential for a bullish continuation towards the 1st resistance level, it is possible that prices could reach this level soon.
GBP/USD:
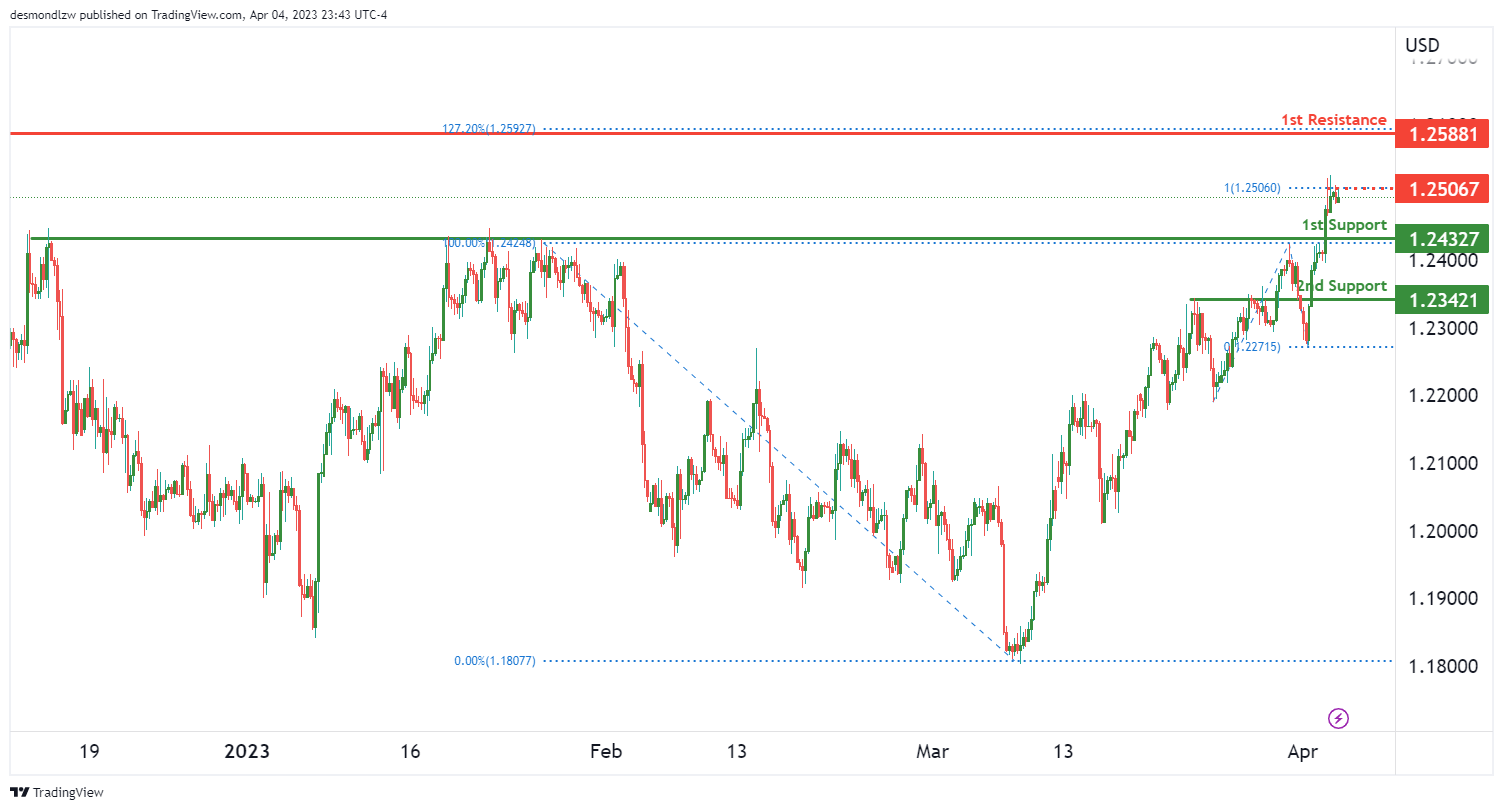
The GBP/USD chart is currently showing a bullish momentum, with potential for a bullish continuation towards the 1st resistance level.
Looking at the support levels, we can see that the 1st support level is at 1.2432, which is a pullback support and a good level of support. The 2nd support level is at 1.2342, and it is also an overlap support, making it another strong level of support.
In terms of resistance levels, the 1st resistance level is at 1.2588, which is a swing high resistance and a good level of resistance. Additionally, there is an intermediate resistance level at 1.2506, which is also a swing high resistance and another strong level of resistance.
USD/CHF:
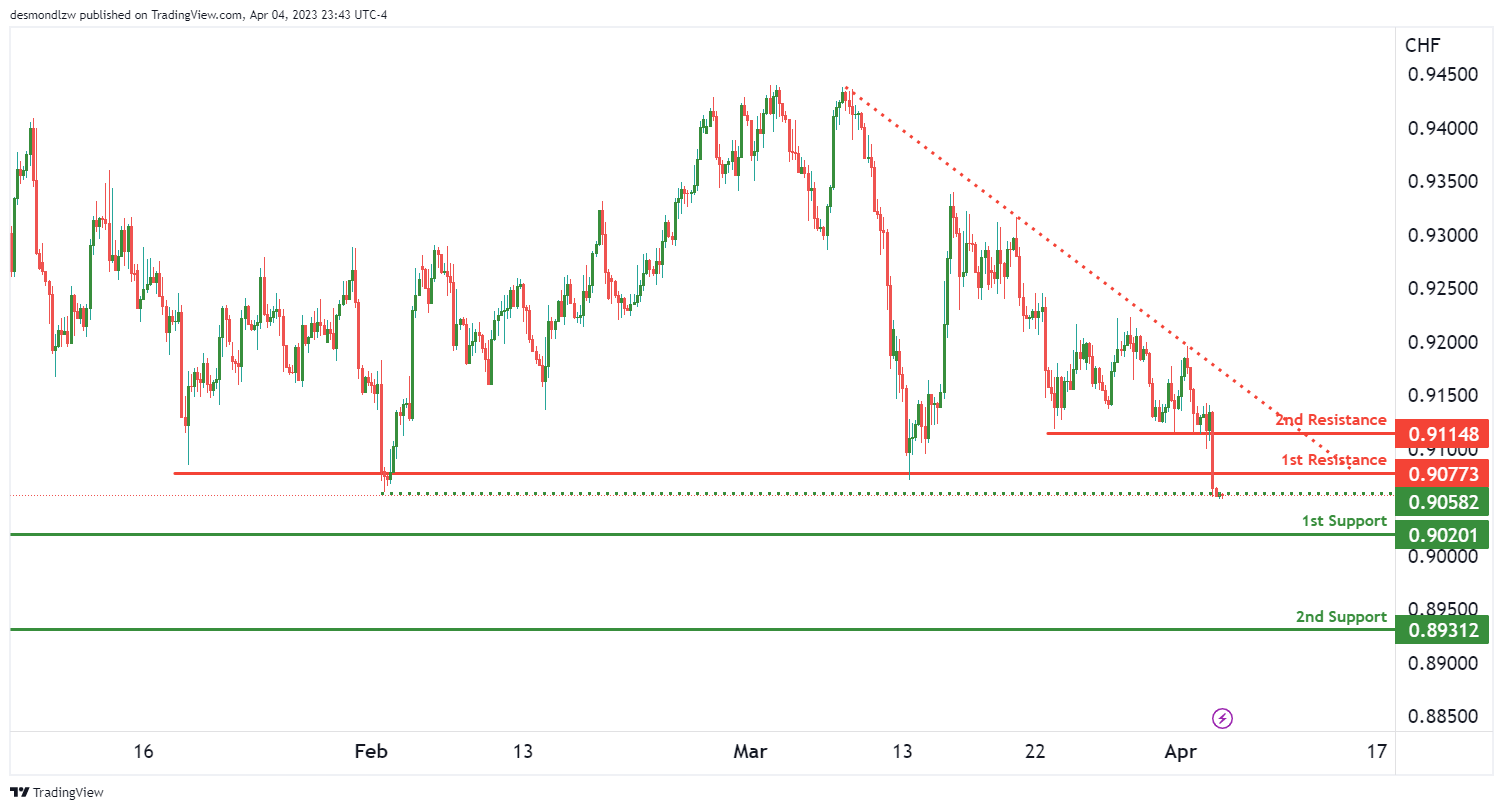
The USD/CHF chart shows bearish momentum as prices are below a major descending trend line, indicating that a continuation of the bearish trend is likely. The first support is at 0.9020, which is a swing low support level. Additionally, the second support at 0.8931 is also a swing low support level. On the other hand, the first resistance at 0.9077 is a pullback resistance level, and there is an intermediate resistance at 0.9114 that is also a pullback resistance level. There is an intermediate support at 0.9058, which is a multi-swing low support level.
Given the bearish momentum, price could potentially continue to drop towards the first support at 0.9020. If price were to break through this level, it could potentially reach the second support at 0.8931. On the other hand, if there is a reversal, price could potentially rise towards the first resistance at 0.9077. It’s important to keep an eye on the intermediate levels at 0.9114 and 0.9058 as they could potentially act as resistance and support respectively.
USD/JPY:
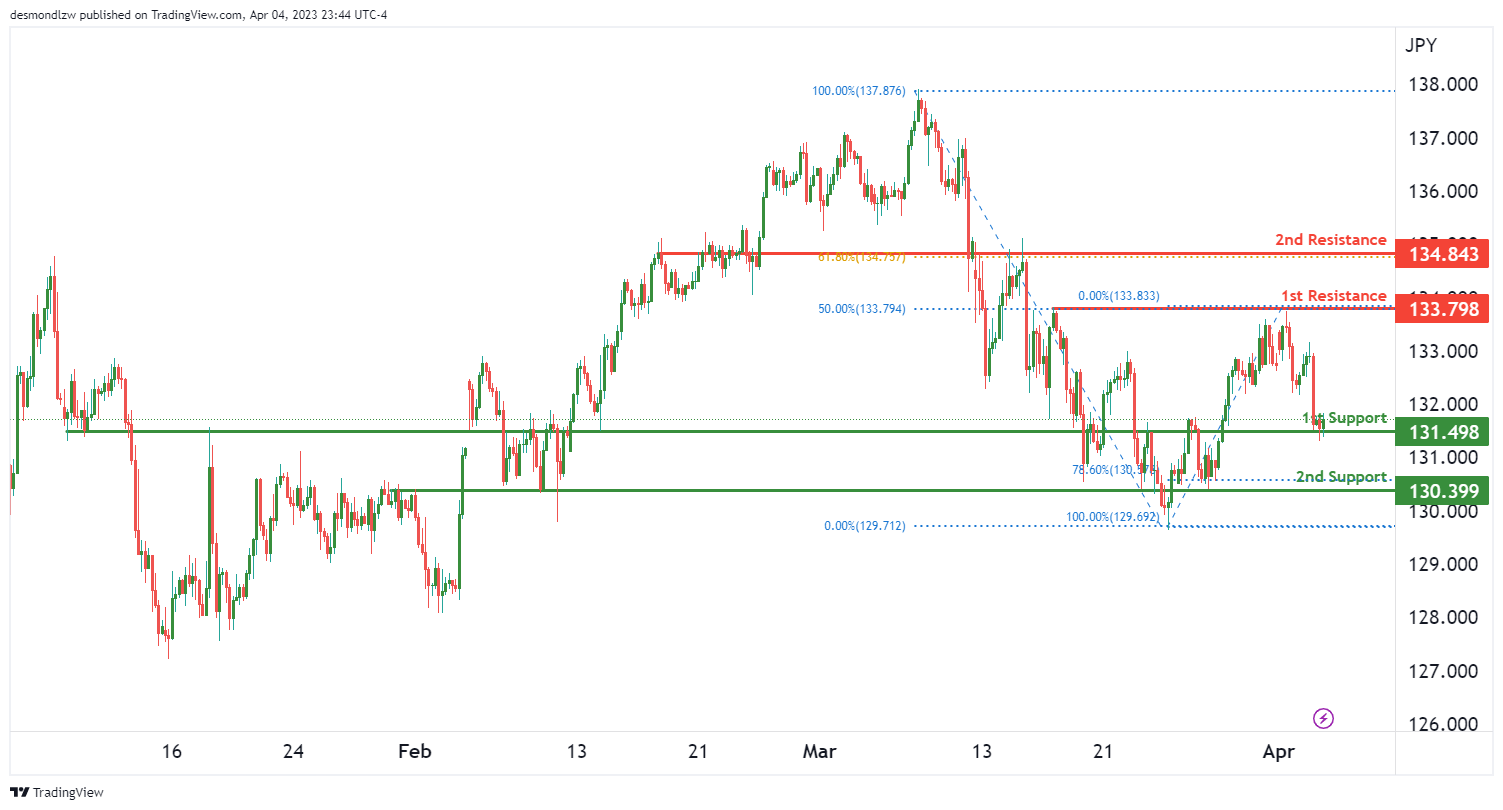
The overall momentum of the USD/JPY chart is bullish, supported by the fact that price is currently above the Ichimoku cloud. Looking at the chart, there are multiple factors contributing to the bullish momentum, including an ascending trend line and multiple overlap supports.
If the bullish momentum were to continue, the price could potentially reach the 1st resistance level at 133.79, which is a multi-swing high resistance level that also coincides with a 50% Fibonacci retracement.
In terms of support levels, the 1st support level is at 131.49, which is an overlap support level and a good potential area for prices to bounce back up. The 2nd support level is at 130.39, which is another overlap support level that also coincides with the 78.60% Fibonacci retracement level, making it a strong level to watch.
There is also a 2nd resistance level at 134.84, which is an overlap resistance level and coincides with the 61.80% Fibonacci retracement level. This level could potentially act as a barrier for prices to rise further towards the upside.
It’s worth noting that if price were to break the 1st support level, the next support level to watch for would be the 2nd support level at 130.39. However, if price were to break the 1st resistance level, it could potentially rise towards the 2nd resistance level at 134.84.
AUD/USD:
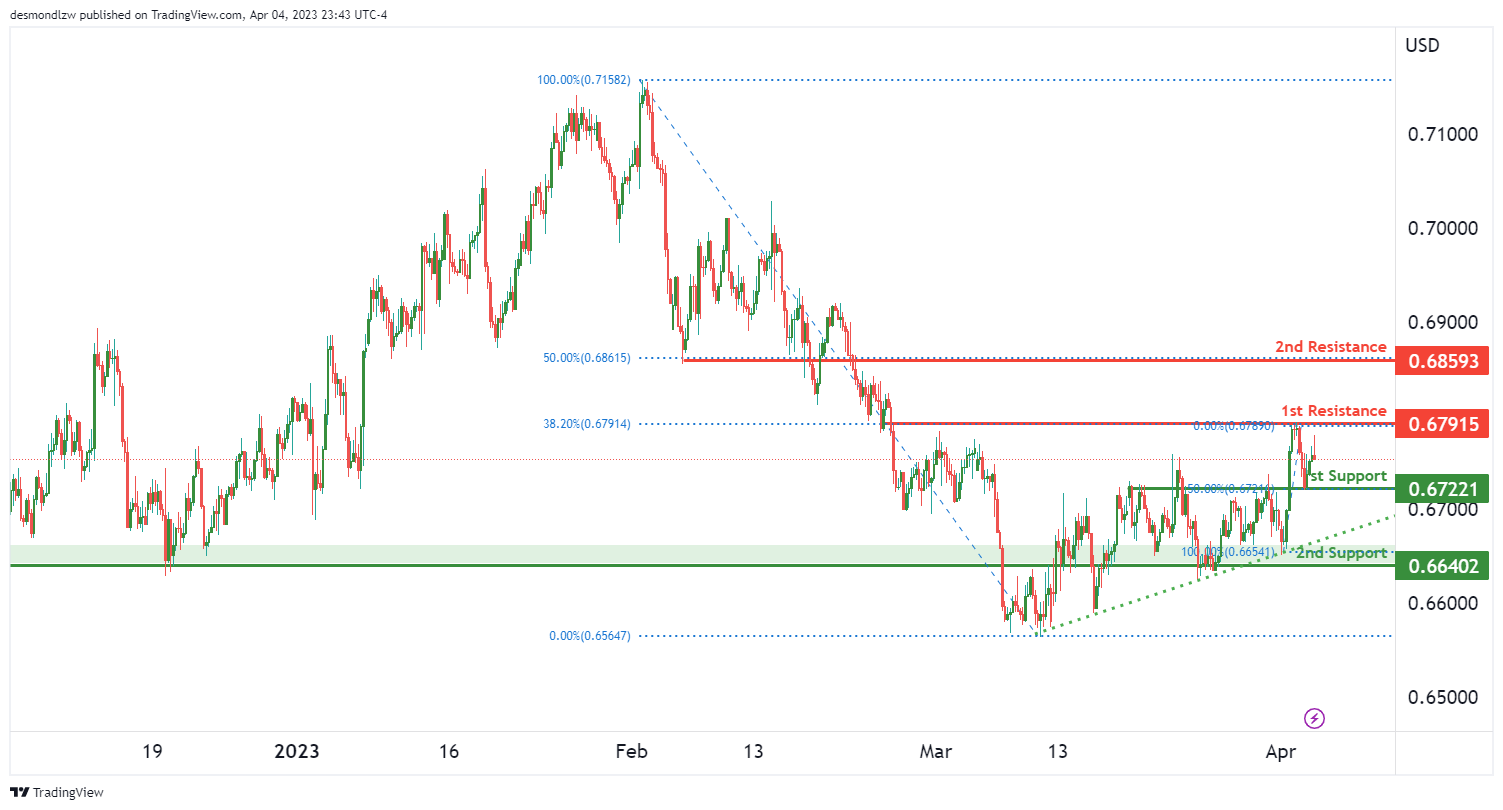
The AUD/USD chart is showing strong bullish momentum, with prices potentially continuing to rise towards the 1st resistance. The overall bias is bullish, with the price above the Ichimoku cloud and no significant resistance in the way of a potential uptrend.
Currently, the 1st support level is at 0.6722, which is an overlap support level and also lines up with a 50% Fibonacci retracement. This level has been tested multiple times in the past and could provide strong support if the price were to drop.
If the price were to bounce from the 1st support, it could rise towards the 1st resistance at 0.6791. This level is also an overlap level, but this time it coincides with a 38.20% Fibonacci retracement. A breakthrough of this resistance could potentially lead to a bullish acceleration towards the 2nd resistance level at 0.6859, which is also an overlap resistance and a 50% Fibonacci retracement level.
The 2nd support level at 0.6640 is another overlap support level and could potentially provide additional support if the price were to drop further.
NZD/USD:
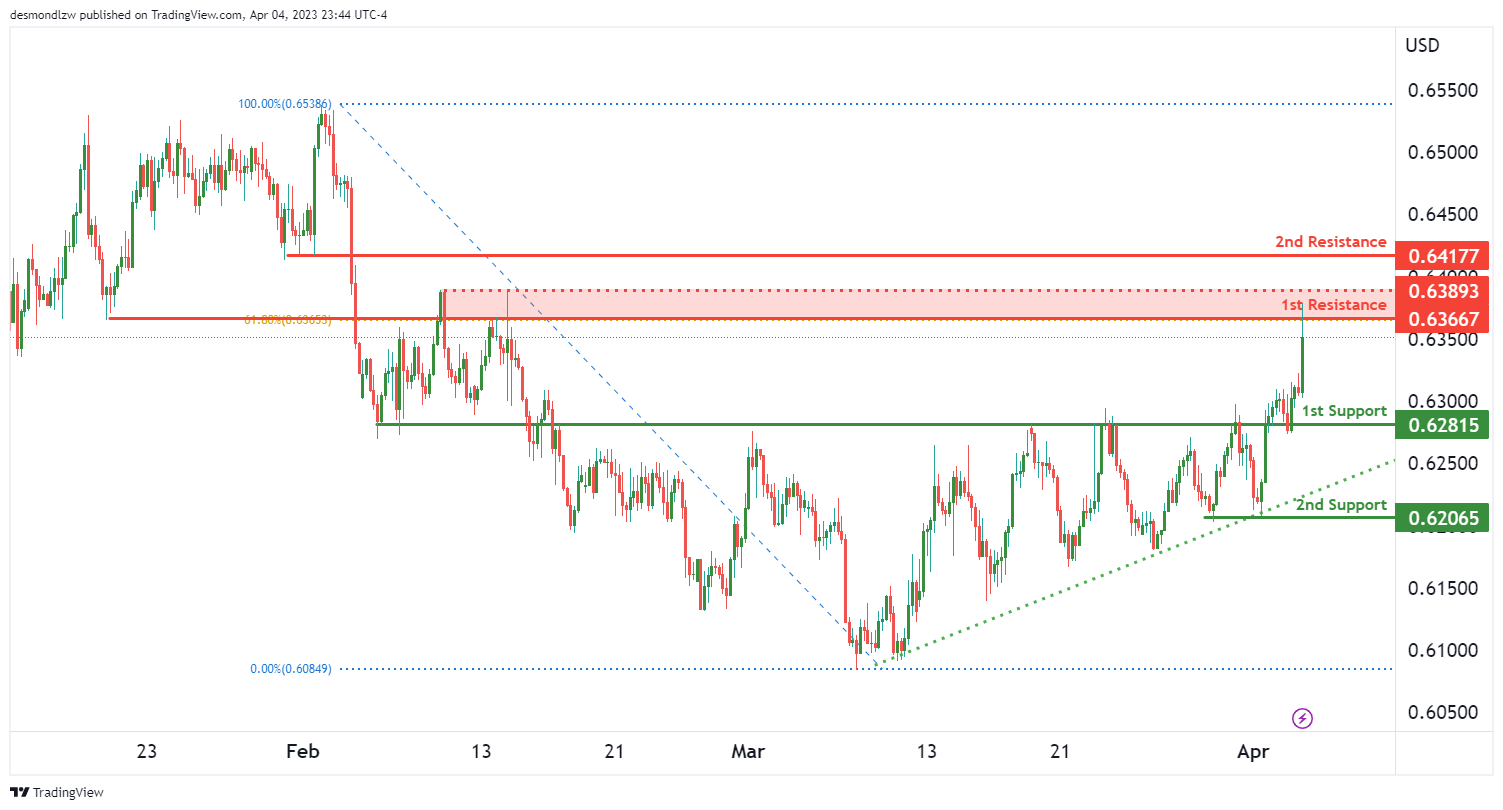
The NZD/USD pair continues to show bullish momentum as it remains above a major ascending trend line, suggesting further bullish momentum is on the cards. If price continues to move higher, it could potentially make a bullish continuation towards the 1st resistance level at 0.6366.
On the downside, the 1st support level is located at 0.6281, which is a strong overlap support and could provide a level of buying interest if prices were to drop. The 2nd support level is located at 0.6206, which is a multi-swing low support that could also attract buyers if the pair were to experience a pullback.
On the upside, the 1st resistance level is at 0.6366, which coincides with a 61.8% Fibonacci retracement level and is a strong overlap resistance. If price were to break through this level, it could trigger a move towards the 2nd resistance level at 0.6417, which is a pullback resistance.
USD/CAD:
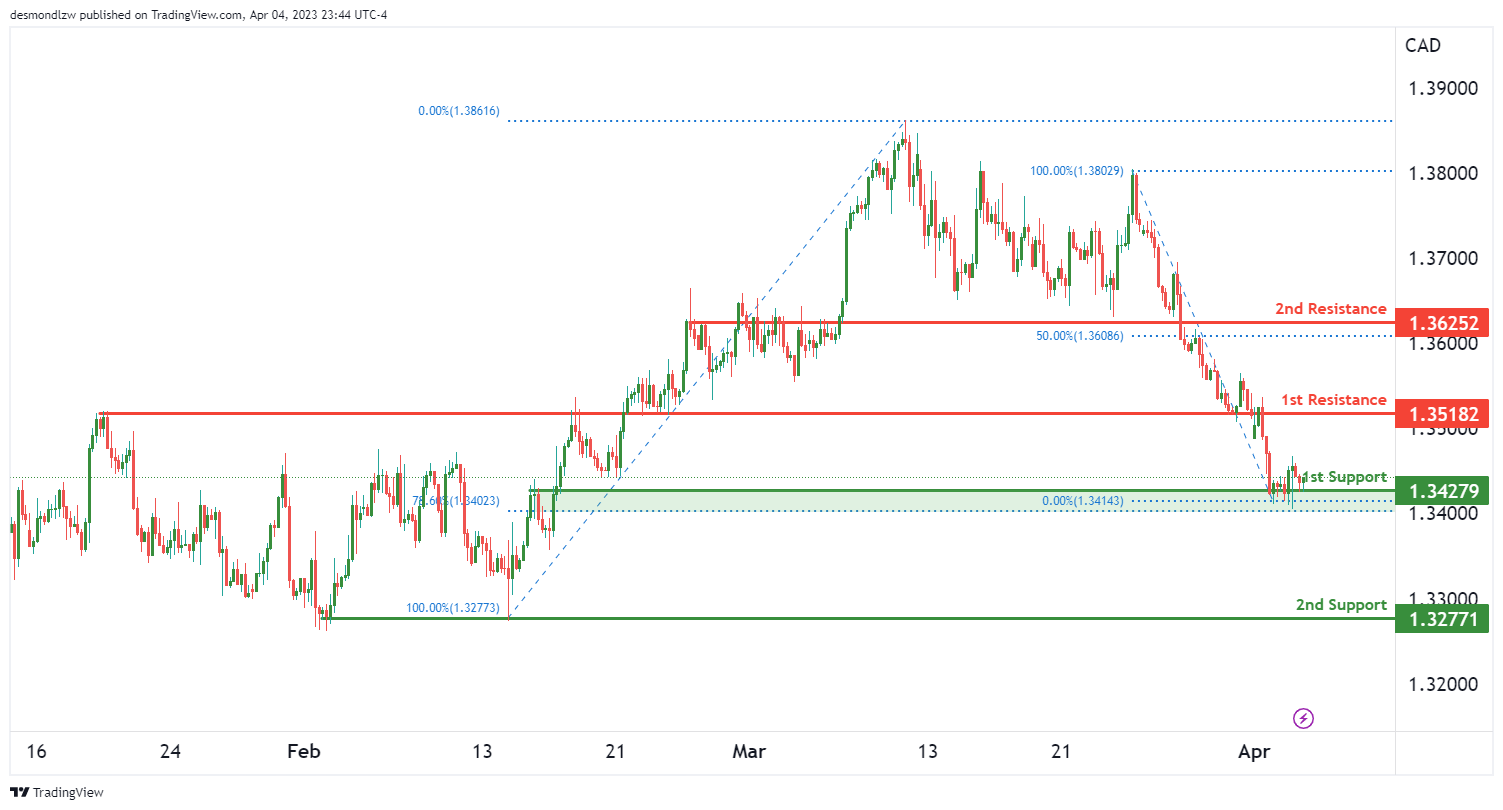
USD/CAD is showing bullish momentum with potential for further upward movement, supported by an overall bullish bias. Price is currently above a major ascending trend line, adding to the potential for continued bullishness.
The first support level for USD/CAD is at 1.3427, which is an overlap support and also lines up with a 78.60% Fibonacci retracement. If price were to bounce from this level, it could potentially rise towards the first resistance level at 1.3518, which is another overlap resistance.
However, if price were to break below the first support level, it could potentially drop to the second support at 1.3277, which is a multi-swing low support.
Looking at resistance levels, the first resistance level at 1.3518 is a good one as it coincides with an overlap resistance. Meanwhile, the second resistance level at 1.3625 is another good one as it is also an overlap resistance and lines up with a 50% Fibonacci retracement.
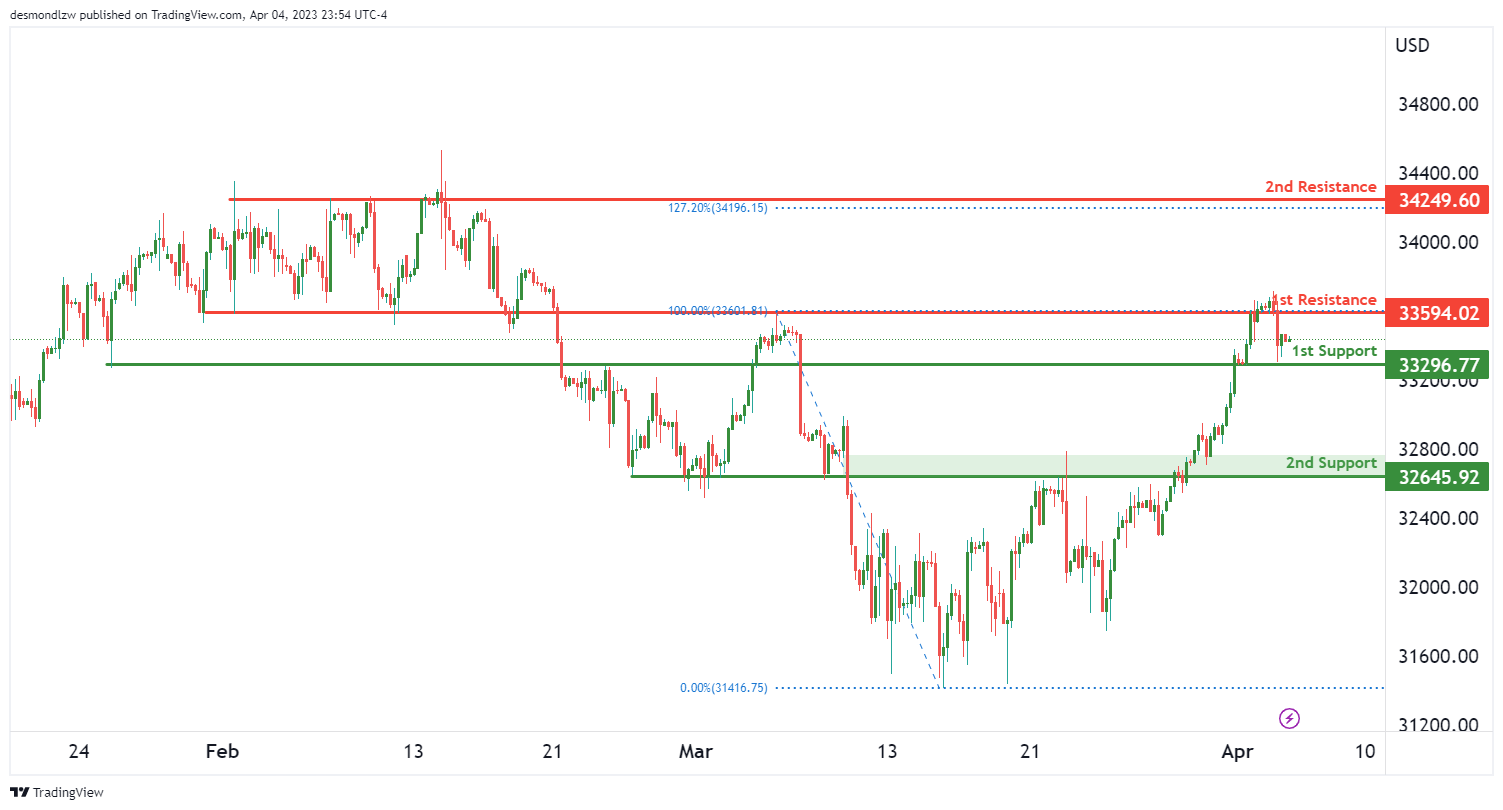
DJ30:
The DJ30 chart is currently showing strong bullish momentum with potential for a bullish bounce off the 1st support level towards the 1st resistance level.
The 1st support level is located at 33296.77 and is a strong overlap support. Additionally, the 2nd support level at 32645.92 is a multi-swing low support, further bolstering its potential as a strong support level.
On the other hand, the 1st resistance level is located at 33594.02 and is a strong overlap resistance. Moving higher, the 2nd resistance level is located at 34249.60 and is a multi-swing high resistance. This level coincides with the 127.20% Fibonacci extension, adding further significance to its potential as a resistance level.
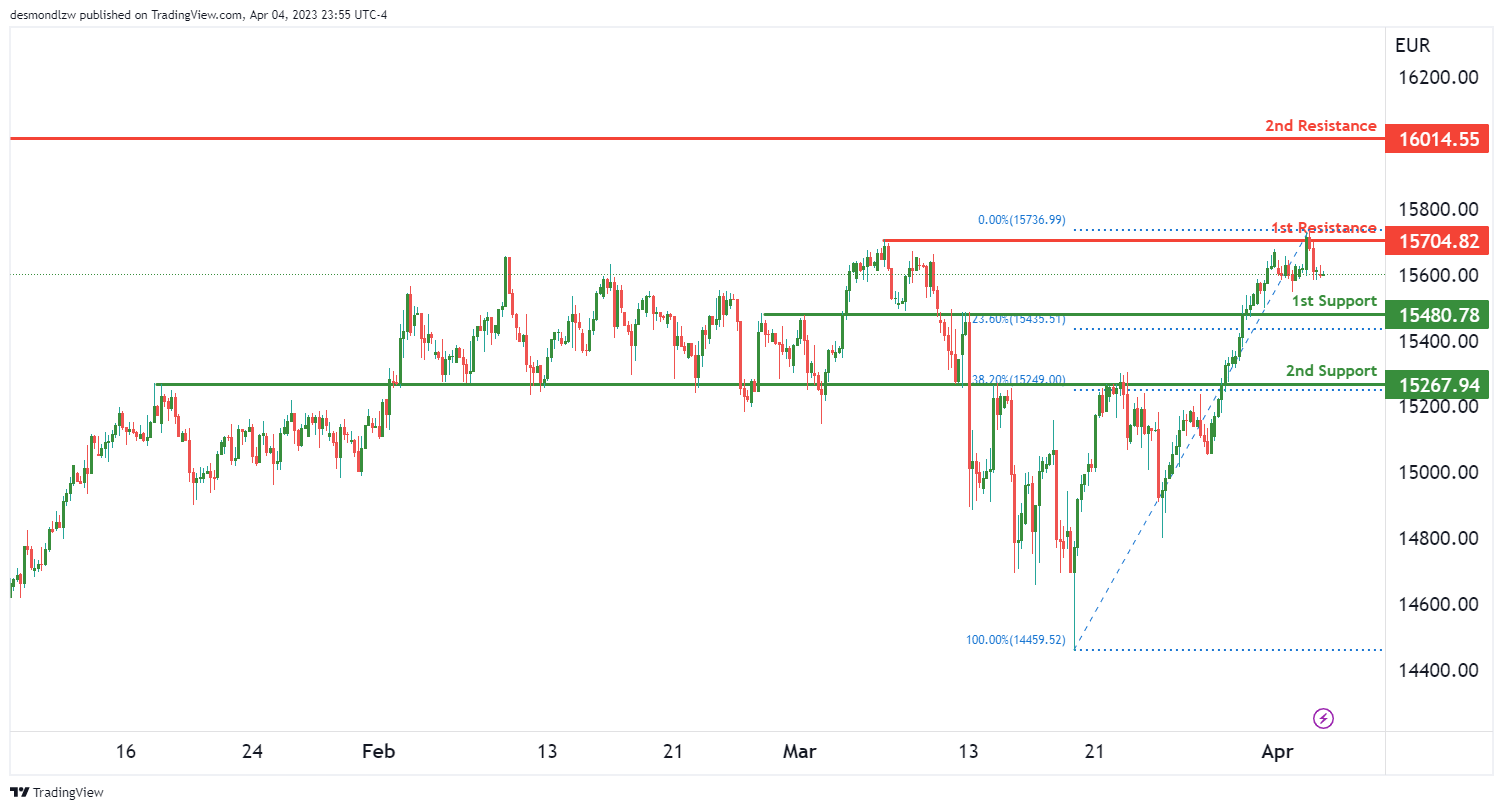
GER30:
The GER30 chart is currently showing strong bearish momentum with potential for a bearish continuation towards the 1st support level.
The 1st support level is located at 15480.78 and is a strong overlap support. Additionally, the 2nd support level at 15267.94 is an overlap support that coincides with the 38.20% Fibonacci retracement, further bolstering its potential as a strong support level.
On the other hand, the 1st resistance level is located at 15704.82 and is a multi-swing high resistance. Moving higher, the 2nd resistance level is located at 16014.55 and is a swing high resistance. These resistance levels indicate potential areas where the bearish momentum could potentially stall.
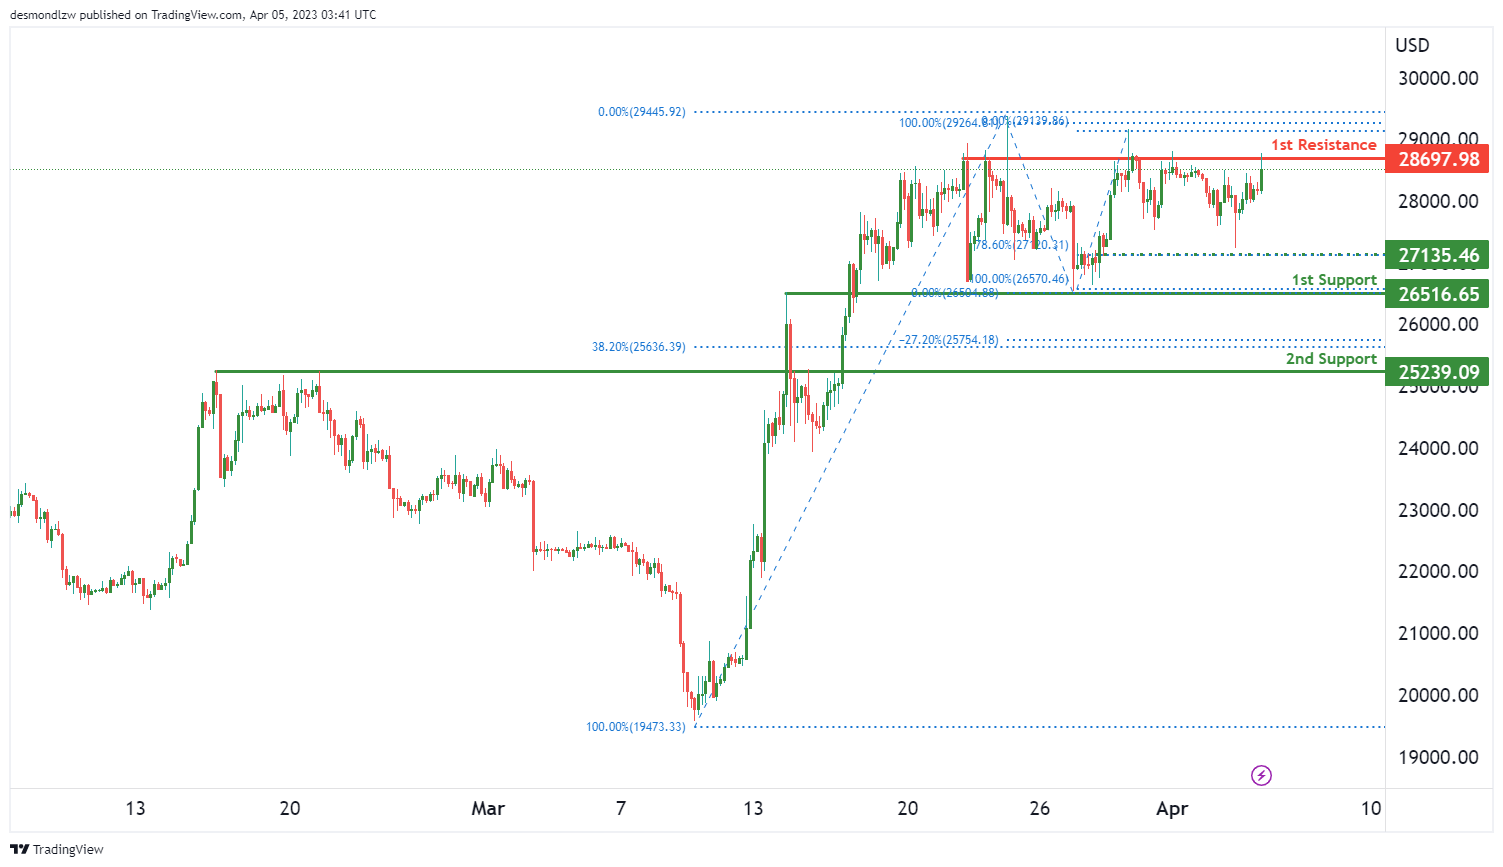
BTC/USD:
The BTC/USD chart currently indicates a strong bearish momentum with potential for a bearish break off the 1st support level towards the 2nd support level.
The 1st support level is located at 26516.65 and is a strong overlap support, however, if it were to break, the price could drop towards the 2nd support level at 25239.09 which is also an overlap support and coincides with the 38.20% Fibonacci retracement, further strengthening its potential as a support level.
On the other hand, the 1st resistance level is located at 28697.98 and is a multi-swing high resistance. There is also an intermediate support level at 27135.46 which is a swing low support, providing additional support for the price in case of any pullback.
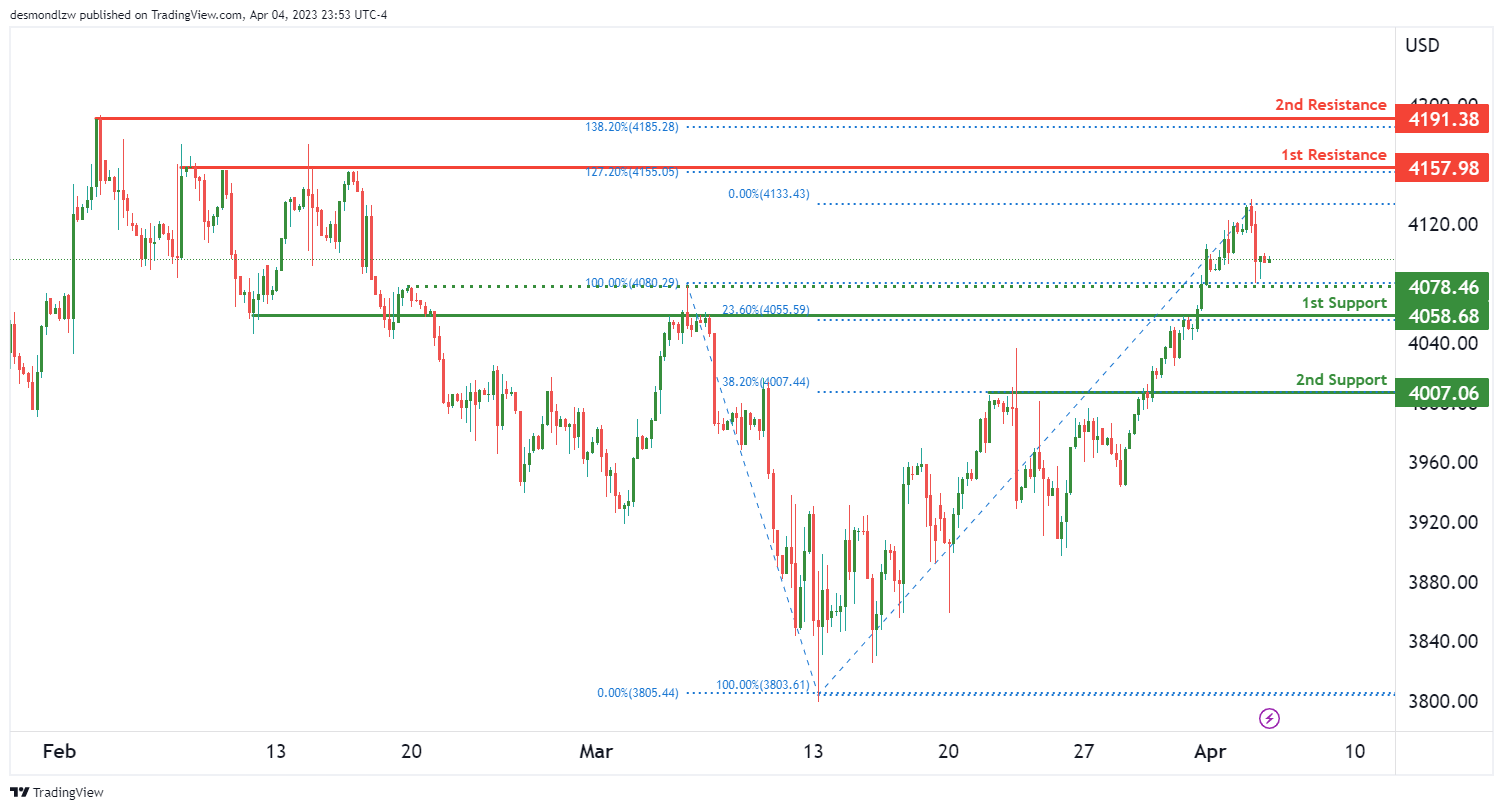
US500
The US500 chart currently shows strong bearish momentum with the potential for a bearish continuation towards the 1st support level.
The 1st support level is located at 4058.06 and is a strong overlap support. Additionally, the 2nd support level at 4007.06 is a pullback support and coincides with the 38.20% Fibonacci retracement, further strengthening its potential as a strong support level.
On the other hand, the 1st resistance level is located at 4157.98 and is a multi-swing high resistance. Moving higher, the 2nd resistance level is located at 4191.38 and is a swing high resistance. These levels coincide with the 127.20% and 138.20% Fibonacci extensions, respectively, adding further significance to their potential as resistance levels.
In between the support and resistance levels, there is an intermediate support level located at 4078.46, which is a swing low support. This level could potentially act as a support if price were to drop further.
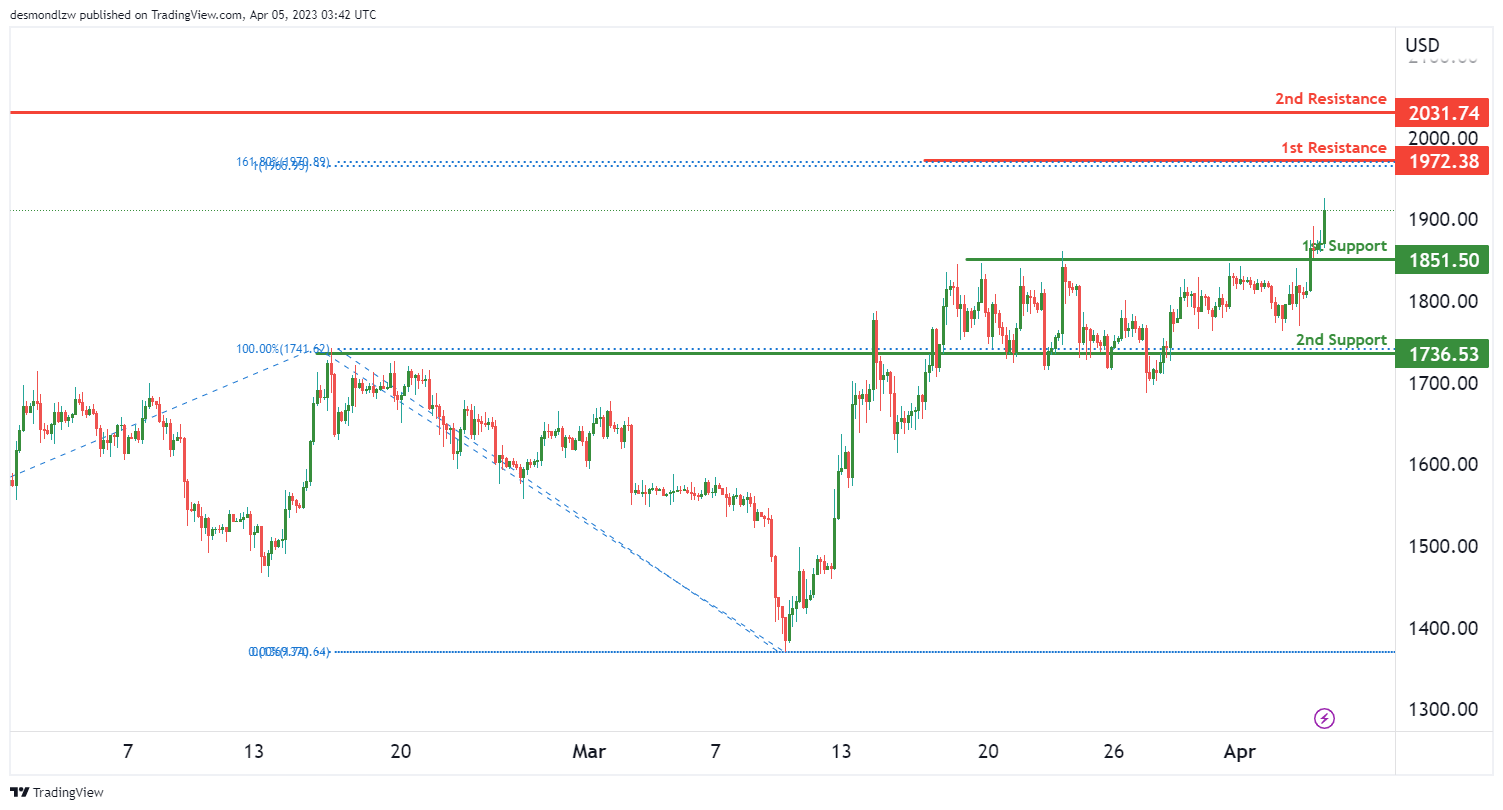
ETH/USD:
The ETH/USD chart is currently showing strong bullish momentum, with the potential for a continuation towards the 1st resistance level.
The 1st support level is located at 1851.50 and is a pullback support, which adds significance to its potential as a strong support level. Additionally, the 2nd support level at 1736.53 is an overlap support, which further confirms its potential as a support level.
On the other hand, the 1st resistance level is located at 1972.38 and is a swing high resistance. Moving higher, the 2nd resistance level is located at 2031.74 and is a swing high resistance. These levels suggest that there may be some selling pressure at these levels, which could limit price appreciation.
WTI/USD:
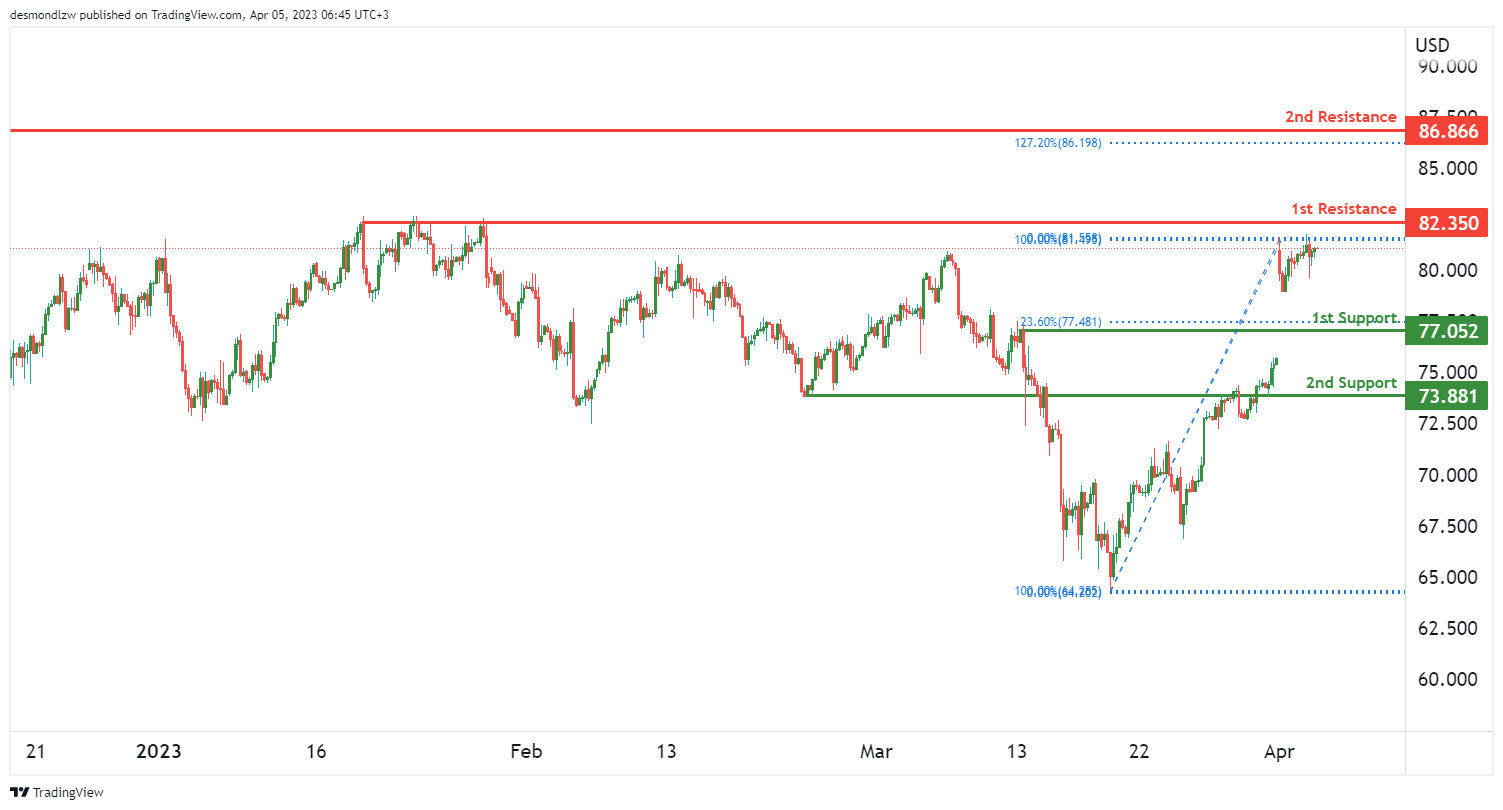
WTI’s chart shows strong bullish momentum with a potential for a break through the 1st resistance level and rise towards the 2nd resistance level.
The 1st support level is located at 77.05 and coincides with the 23.60% Fibonacci retracement. Additionally, the 2nd support level at 73.88 is a pullback support, further reinforcing its potential as a strong support level.
On the other hand, the 1st resistance level is located at 82.35 and is a multi-swing high resistance. Moving higher, the 2nd resistance level is located at 86.86 and is a swing high resistance. These levels are significant because they can act as barriers to further price increases.
XAU/USD (GOLD):
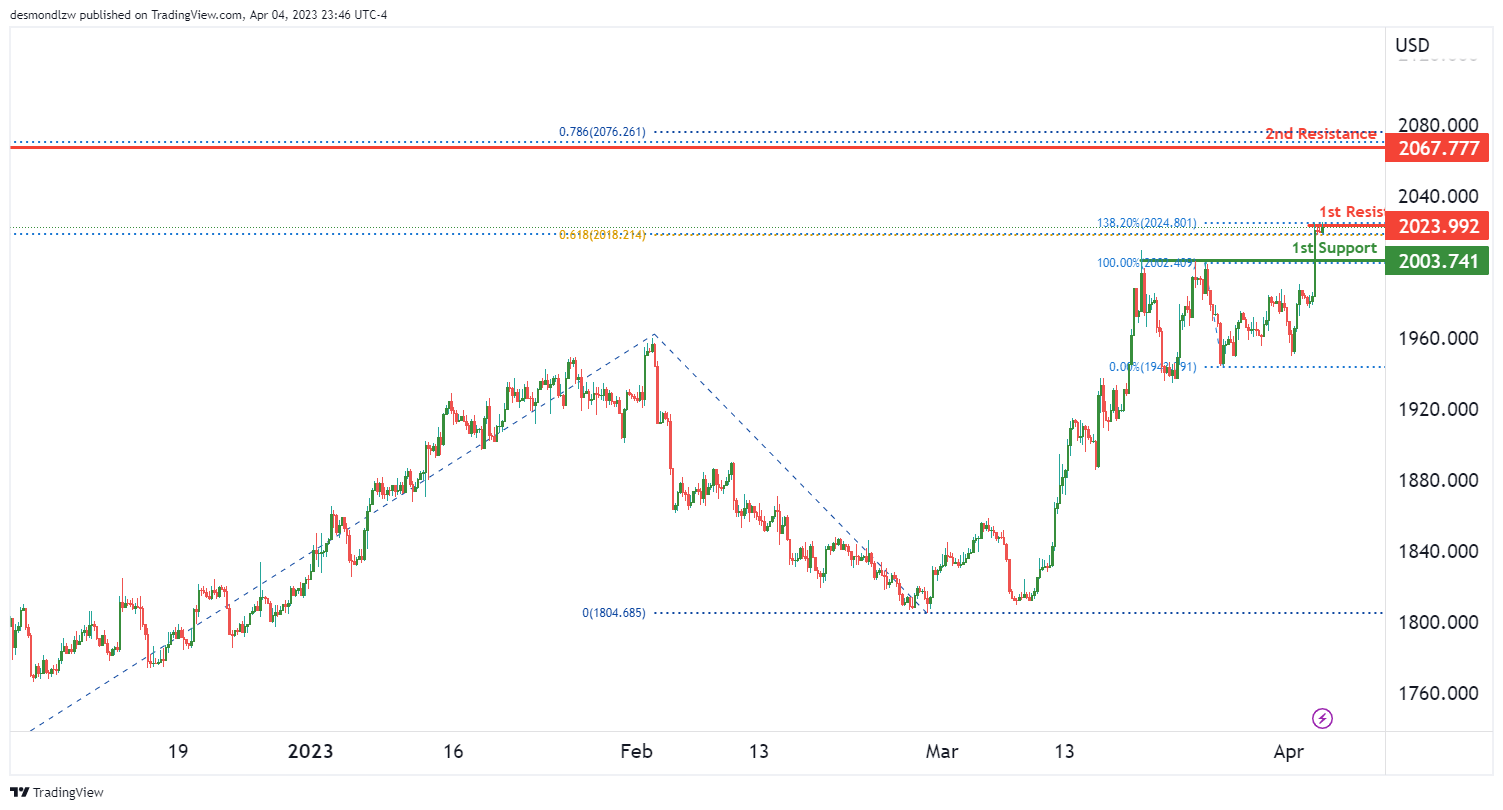
Gold has been showing strong bullish momentum with potential for a bullish break through of the 1st resistance level and rise towards the 2nd resistance level. The overall bias is bullish, with price above an ascending trend line indicating further bullish momentum is on the cards.
The 1st support level is located at 2003.00 and is a pullback support. This level is significant as it has provided support in the past and is likely to do so again.
Moving higher, the 1st resistance level is located at 2023.00 and is a swing high resistance. This level coincides with the 138.20% Fibonacci extension, adding further significance to its potential as a resistance level. A break through this level could trigger a rise towards the 2nd resistance level located at 2067.00.
The 2nd resistance level is a swing high resistance and coincides with the 78.60% Fibonacci expansion. This level has been significant in the past and is likely to provide resistance once again.
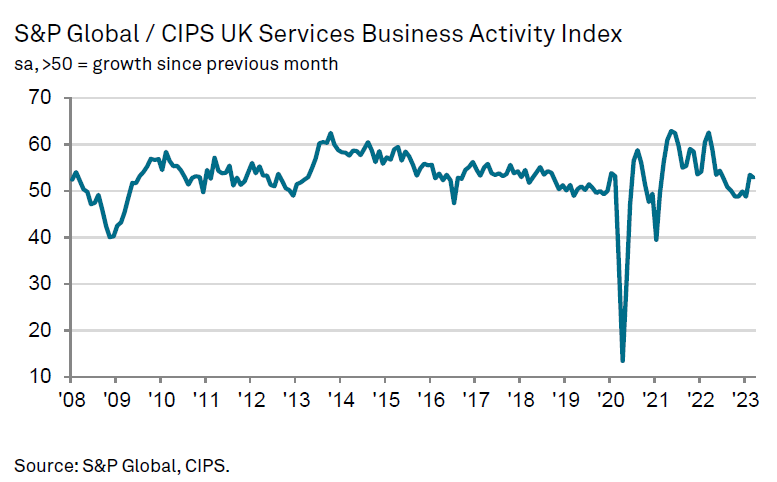
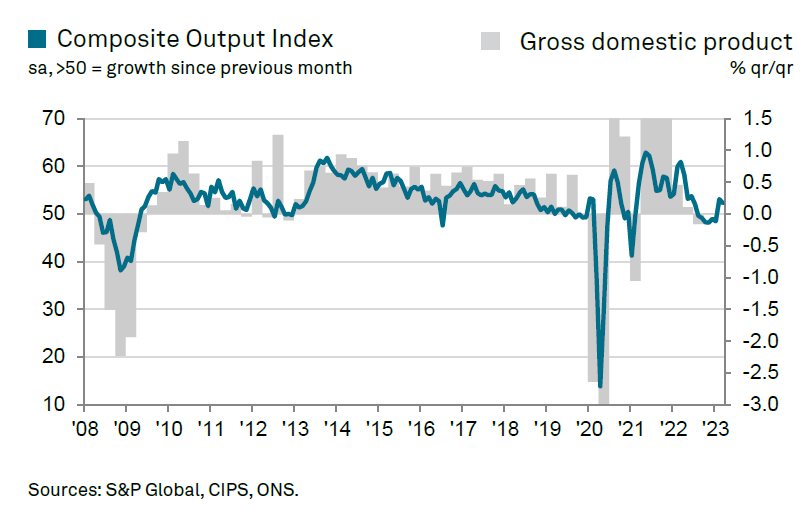
UK PMI services finalized at 52.9, composite at 52.2
UK PMI Services was finalized at 52.9 in March, down from February's 53.5. PMI Composite was finalized at 52.2, down from prior month's 53.1.
Tim Moore, Economics Director at S&P Global Market Intelligence, noted that the UK service sector returned to growth in Q1 2023 due to improved business and consumer confidence, as well as a sustained rebound in new orders. Export sales also boosted the service economy, with the fastest rise in new orders from abroad in over eight years.
Moore highlighted that prices charged by service sector businesses increased at the weakest rate in 19 months, signaling that competitive pressures and improved supply conditions would likely reduce consumer price inflation in the coming months.
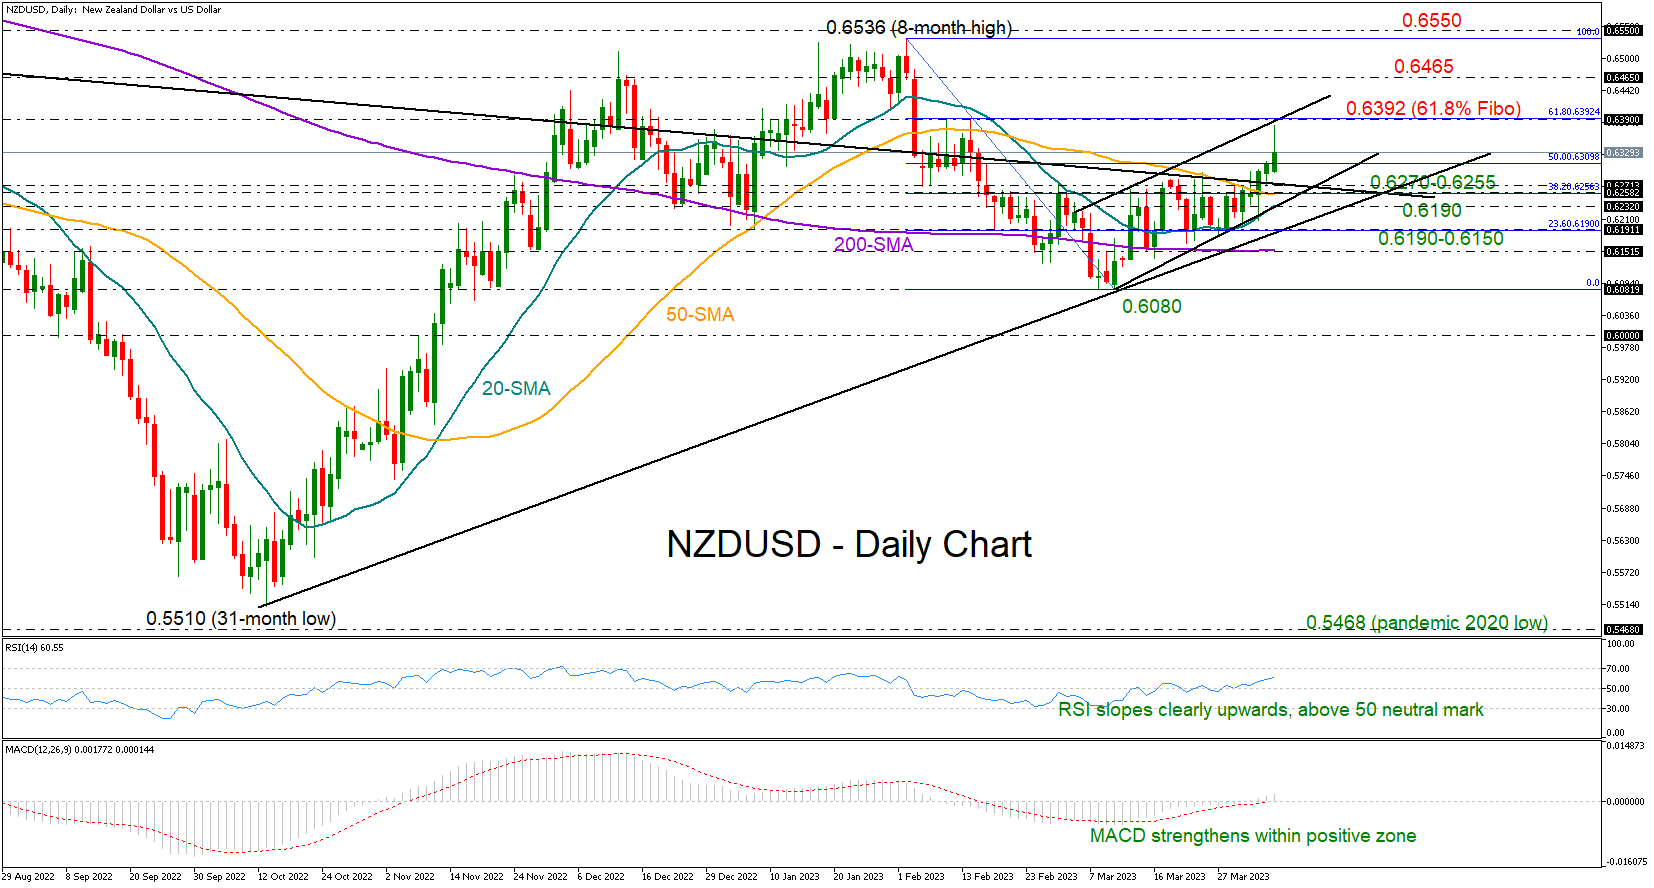
NZDUSD Points to Bullish Continuation
NZDUSD advanced to a seven-week high of 0.6378 in the wake of a bolder-than-expected 50bps rate hike by the Reserve Bank of New Zealand early on Wednesday.
The pair has been developing northwards within a bullish channel since the drop to 0.6083 on March 10th, having already climbed above its simple moving averages (SMAs). Encouragingly, the RSI and the MACD are sending clear positive signals at the moment, with the former trending up confidently above its 50 neutral mark and the latter gaining ground within the positive region.
The next hassle could be the channel’s upper boundary, which overlaps with the 61.8% Fibonacci retracement of the latest downleg at 0.6392. A successful move higher could retest the 0.6465 constraining zone ahead of the 2023 top of 0.6536. Should the bulls push for new highs, the door would open for the long-term resistance trendline drawn from the 2021 high of 0.7463.
If selling pressures resurface, the price may initially seek support within the key 0.6270-0.6255 region, where the 50-day SMA, the 38.2% Fibonacci level, and the falling constraining line from March 2021 lows are located. The channel’s lower boundary and the 20-day SMA are within a breathing distance at 0.6233, while the tentative ascending trendline from March lows could also come under consideration near the 23.6% Fibonacci of 0.6190 before the focus turns to the 200-day SMA at 0.6155. Another failure here could squeeze the price towards the previous low of 0.6080.
In a nutshell, NZDUSD is positively charged in the short-term picture. A decisive extension above 0.6392 could renew bullish pressures.
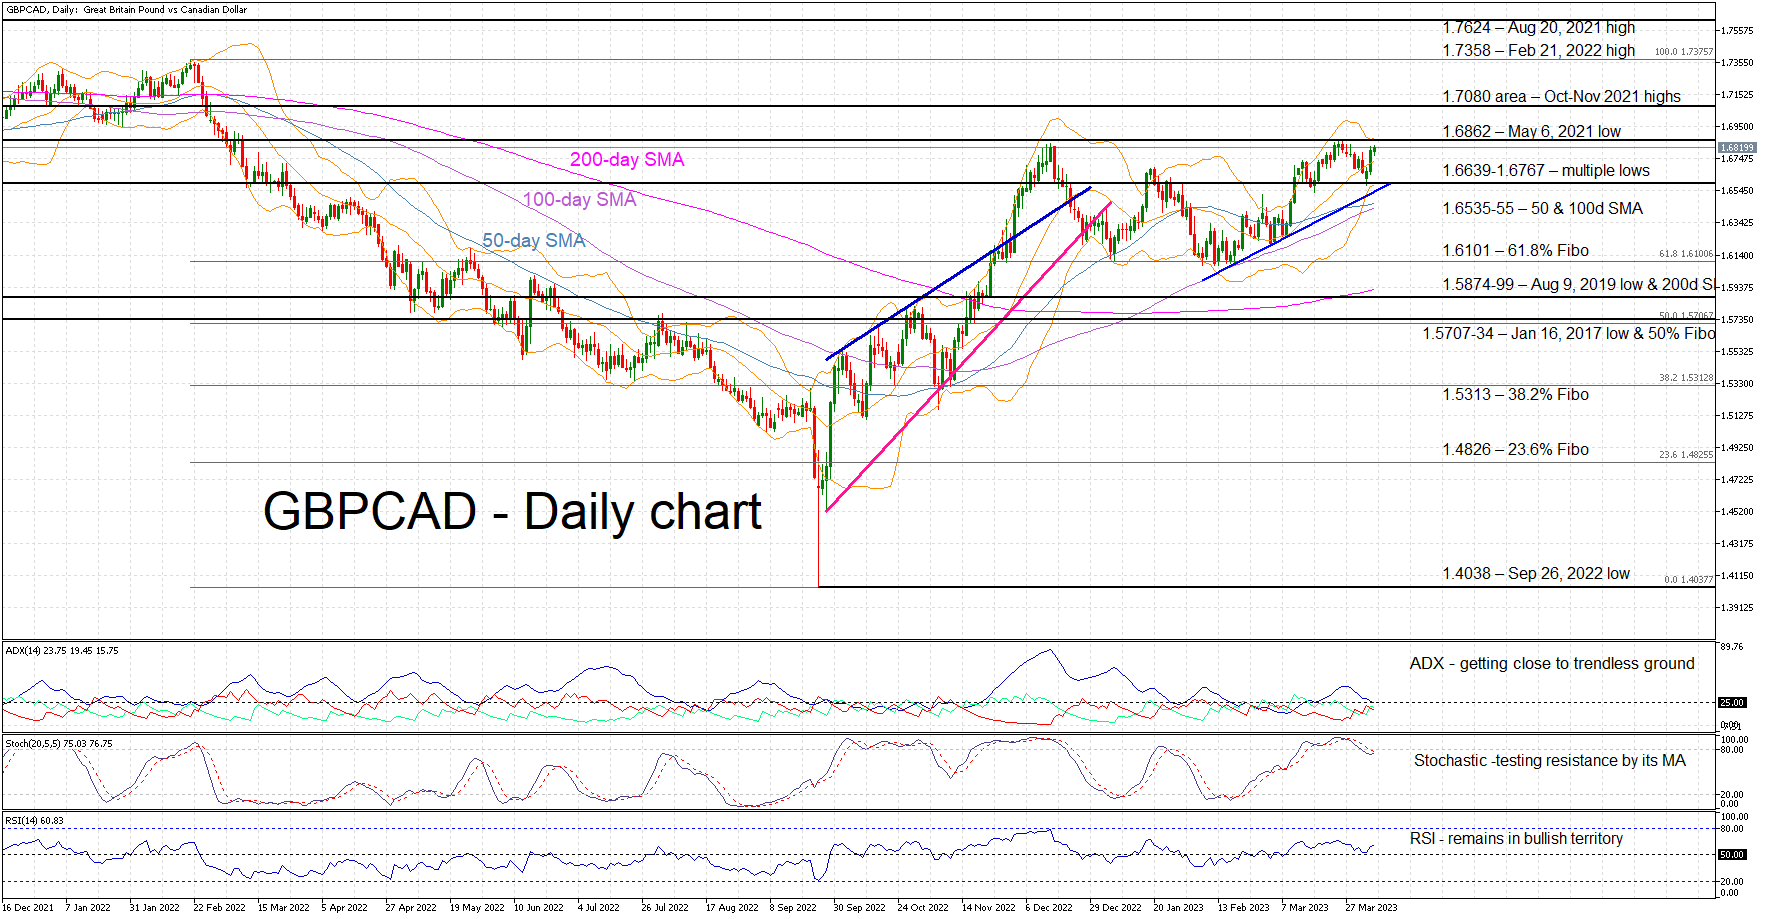
GBPCAD at Tight Range, Bulls on Their Toes
GBPCAD has been hovering inside the rather tight 1.6535-1.6862 rectangle since mid-March. The first test of the upper boundary was unsuccessful, but the bulls appear determined to make another attempt. They have been holding all the cards since the September 26, 2022 low of 1.4038, achieving an impressive 20% rally despite the BoE’s measured approach.
The bulls are actively looking for sufficient evidence to stage another upleg. However, the momentum indicators appear to be less enthusiastic about this prospect. The Average Directional Movement Index (ADX) is pointing to a trendless market, which can also be deemed as preparing the ground for the next move.
In the meantime, the RSI is exhibiting some bullish tendency and the stochastic oscillator is trying to find its direction. The latter is hovering below its overbought territory and the resistance set by its moving average (MA). A failure to break above its MA could be seen as a bearish signal. Having said that, the convergence of the 50- and 100-day simple moving averages (SMAs) and the tightness of the Bollinger Bands probably means that a sizeable move is imminent.
If the bulls maintain control of the market, their immediate target would be to break the much-talked May 6, 2021 high of 1.6862. Τhe path would then be clear until the 1.7080 area defined by the October-November 2021 highs. Even higher, the bulls would like to test the resistance posed by the February 21, 2022 high of 1.7358.
If the bears manage to take over the reins, their first target could be the lower boundary of the current rectangle at 1.6535. The dynamic 50- and 100-day SMAs at the 1.6535-1.6555 range could prove tougher to crack. If successful, the bears would be faced with the 1.6100 level, where the 61.8% Fibonacci retracement of the February 21 – September 26 downtrend currently resides.
To sum up, the market has reached a short-term balance. Bulls appear to have the upper hand but need support from momentum indicators to achieve a break above 1.6862.
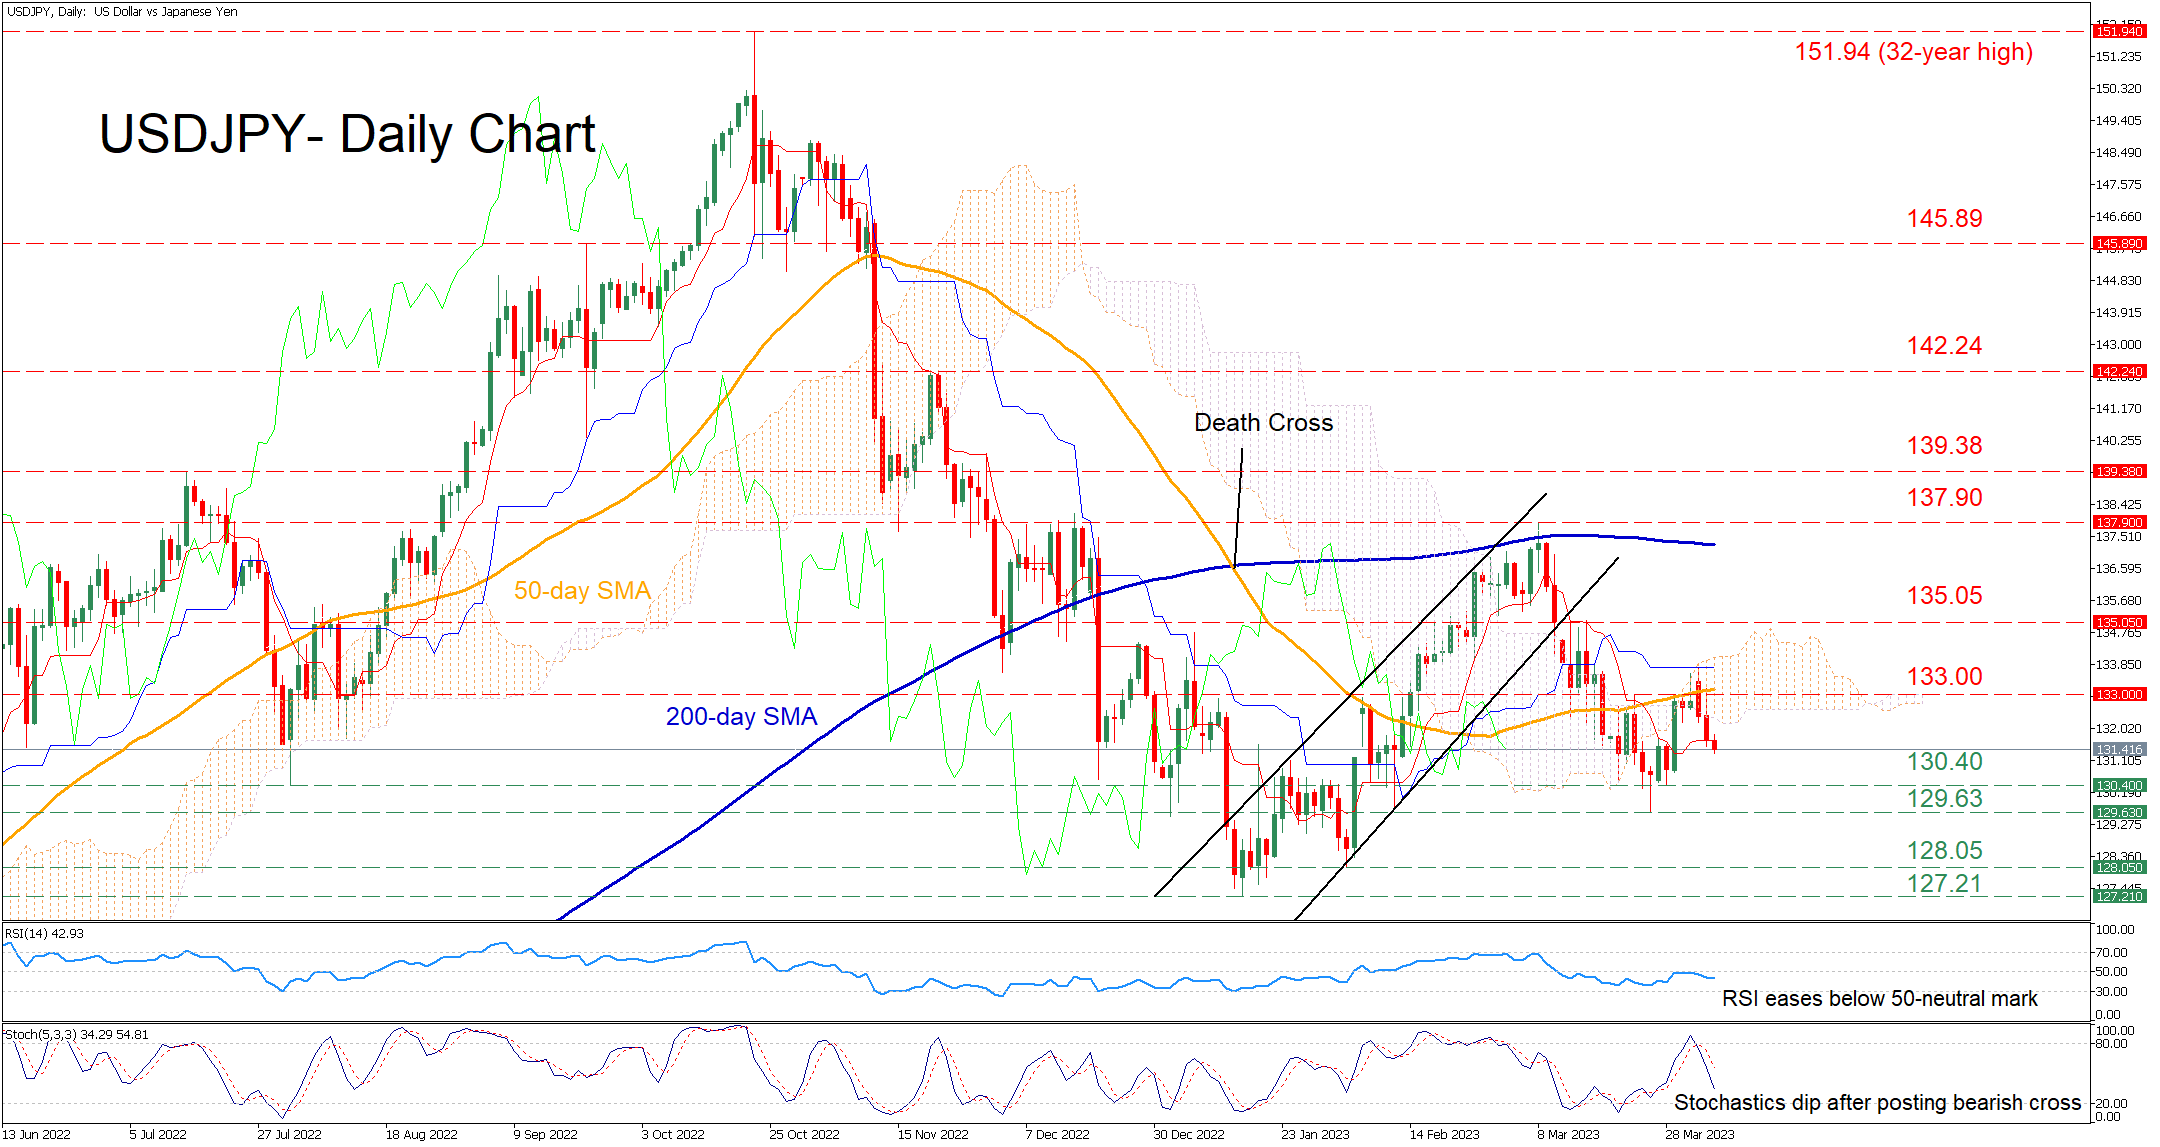
USDJPY Dips After Failing to Jump Above Ichimoku Cloud
USDJPY had been trending lower since its upward sloping channel broke to the downside in early March. Although the pair attempted a rebound, it is now on the retreat again after the congested region that includes the 50-day simple moving average (SMA) and the upper Boundary of the Ichimoku cloud rejected further advances.
The momentum indicators currently suggest that near-term risks are tilted to the downside. Specifically, the RSI has flatlined below its 50-neutral mark, while the stochastic oscillator is falling after posting a bearish cross.
If negative tendencies persist, the price could initially challenge the 130.40 support. Sliding beneath that floor, the pair may descend towards the March low of 129.63 before the 128.05 hurdle gets in the way. A break below the latter could set the stage for the 2023 bottom of 127.21.
Alternatively, should the positive momentum strengthen, immediate resistance could be met at the 50-day SMA, currently at 133.00. Piercing through that ceiling, the price might test the 135.05 resistance zone. If that barricade fails, the bulls could then target the 2023 high of 137.90.
Overall, USDJPY seems to be experiencing another round of weakness after its latest bounce faltered. Nevertheless, a lower low is required for the pair to extend its downtrend.
US Jobs Report Eyed as Weaker JOLTS Data Signal Slack Appearing in Labour Market
Equity markets are treading water in the middle of the week as investors weigh up what is next for the Fed following the surprise decline in JOLTS job openings, how much further the RBNZ will go in light of today's decision and what the OPEC+ cut means for oil prices and inflation.
There's been a lot to take on board over the last few days and it's been a real mix of good and bad news. The JOLTS data yesterday could be the first signs of weakness in the US labour market and that is huge. Without it, the Fed will find it very hard to make the argument that it is pausing the tightening cycle. Now it needs to be backed up and the jobs report on Friday could start that process.
RBNZ not done with tightening despite huge rate hikes over the last year
The RBNZ is clearly not of the view that it is close to being able to pause its tightening cycle, despite having raised rates extremely aggressively over the last year or so. The central bank surprised markets by raising the OCR by 50 basis points and there's likely to be more to come. As we're seeing elsewhere, New Zealand has its own issues with inflation, most notably an extremely tight labour market. There may be some economic pain ahead as the central bank tries to get to grips with that.
Oil holds gains after OPEC+ cut but remains around recent highs
Oil prices are consolidating after the early week surge in the aftermath of the OPEC+ announcement. The decision to cut output has proven to be very controversial, much like the two million barrel reduction in October, but just like that, there's no guarantee it will lead to dramatically higher prices.
In fact, at this stage crude is only trading around the highs of the last four months and it's tested these levels on a number of occasions. A break above here could be a bullish signal but at this point, we are still seeing plenty of resistance. Recent stress in the banking system has led to weaker economic expectations and lower interest rate forecasts and the cut could simply be a response to that.
At this point, the only thing that's clear is that OPEC+ has no appetite for Brent prices below $80 a barrel. That could make any future foray below there challenging as the group has now shown not only will it cut production, it will do so without warning. That is clearly the message they wanted to send.
Gold edging ever closer to record highs
Gold smashed through $2,000 on Tuesday as the latest JOLTS data showed openings declining and significantly so, in one of the first signs of the labour market cooling. It's still very early days but the data will be a little encouraging for the Fed, especially if paired with a softer jobs report on Friday.
We've heard a number of announcements of mass layoffs in tech and banking in recent months but that hasn't yet been reflected in the data and it could be that we now start to see slack appearing. It comes at a good time as the Fed could do with a reason to pause the tightening cycle and the response we saw in yields and gold yesterday suggests investors believe it may now get that.
For gold, it's only traded at this level on two days ever so that doesn't leave much guidance in terms of technical levels, beyond the all-time highs around $2,070. A weaker jobs report on Friday could see that tested, especially in what will likely be extremely thin trade given the bank holiday.
What will be the next bullish catalyst for Bitcoin?
We're continuing to see choppy trade in bitcoin but importantly, pullbacks have been small and brief which may reassure the crypto crowd that there's more to come. It's just hard to know at this point whether the rebound is sustainable, what the next bullish catalyst will be, or even how it will respond to Friday's jobs report if it is at the weaker end of the spectrum. Whatever happens, it promises to be a fascinating one to follow.
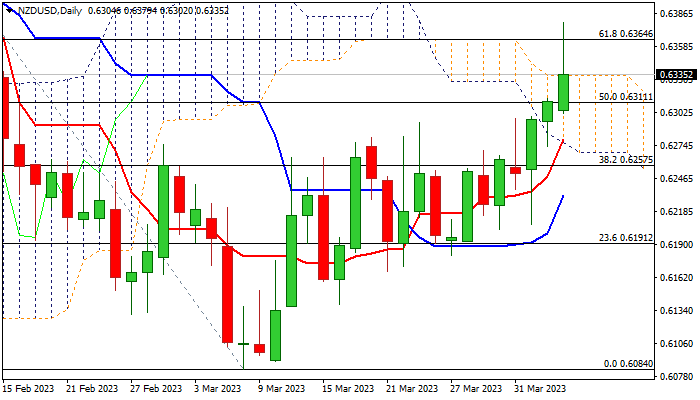
NZD/USD: Kiwi Jumps after RBNZ Surprise, But Bulls Face Headwinds
The Kiwi dollar rose around 80 pips in early Wednesday, after the Reserve Bank of New Zealand, in its policy meeting today, surprised markets by increasing its official cash rate by 50 basis points, against widely expected 25 basis points raise.
The latest decision pushed the interest rate to 5.25%, the highest in over 14-years, as the central bank raised rates by 500 basis points in total since October 2021.
RBNZ’s argued its hawkish stance by the fact that inflation is still too high and persistent that leaves the door open for further hikes, on their way to put inflation under control and push it towards central bank’s 1-3% target.
Economists expect the RBNZ to push towards estimated 5.5% terminal rate, which would be an initial signal of an end of tightening cycle, based on the central bank’s expectations that inflation, which hit 7.2% in the fourth quarter, will start to ease after recent drastic increase in borrowing cost starts to show stronger results.
However, the central bank will remain ready to act more if inflationary pressures persist, as upside risks are still high.
The NZDUSD pair jumped to a seven week high after the RBNZ’s decision and pressure pivotal barriers at 0.6390 (Feb 9/14 double top) after the rally emerged above falling and thickening daily Ichimoku cloud (cloud top lays at 0.6334) and also probed above Fibo resistance at 0.6364 (61.8% of 0.6538/0.6084).
Bulls faced headwinds on approach to 0.6390 target, where strong offers are seen, though remain in play, underpinned by bullish daily studies.
Consolidation should ideally stay above daily cloud top, with deeper dips to be contained at 0.6300 zone (broken Fibo 50% / 100DMA) to keep bulls in play for attack at 0.6390 pivot and possible acceleration higher on break.
Caution on loss of 0.6300 zone handle, which would risk violation of lower pivots at 0.6277/68 (daily Tenkan-sen / daily cloud base.
Res: 0.6346; 0.6379; 0.6390; 0.6430.
Sup: 0.6311; 0.6297; 0.6268; 0.6257.
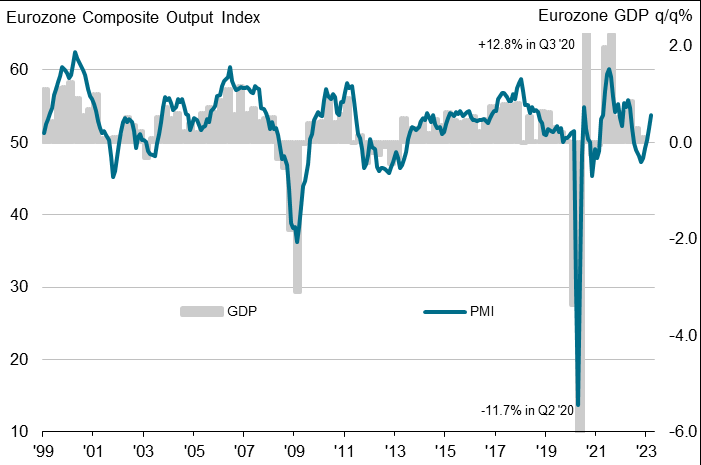
Eurozone PMI composite finalized at 10-month high, but growth varies across countries
Eurozone PMI Services was finalized at 55.0 in March, up from Februar's 52.7. PMI Composite was finalized at 53.7, up from prior month's 52.0. Both indexes were at their 10-month highs.
Looking at PMI Composite of some member states, improvements were seen in Spain (58.2, 16-month high), Italy (55.2, 16-month high), France (52.7, 10-month high), and Germany (52.6, 10-month high). Ireland dropped to 52.8, 2-month low.
Joe Hayes, Senior Economist at S&P Global Market Intelligence said eurozone economy is rebounding from the slowdown seen in late 2022, and for now, appears to be clear of a recession.
He noted that March's economic activity increase was driven by strong growth in the service sector, but highlighted that growth varies across countries, with significant contributions from Spain and Italy. However, modest activity levels in Germany and France suggest a more conservative outlook for the eurozone's overall economic health.
Hayes also mentioned that the case for further interest rate hikes remains strong, as inflation rates, though cooling from their peaks, continue to run high, especially in the service sector.