Sample Category Title
RBNZ hikes 50bps after considering a 25bps move too
In an unexpected move, RBNZ raised the Official Cash Rate by 50bps to 5.25%, doubling the anticipated 25bps hike. This bold step reflects the central bank's concerns about persistently high inflation and employment levels.
The RBNZ statement highlighted that "inflation is still too high and persistent, and employment is beyond its maximum sustainable level." Despite lower-than-expected economic activity in the December quarter, demand continues to outstrip supply, exerting further pressure on annual inflation.
The statement also noted that severe weather events in the North Island have contributed to higher prices for some goods and services. This increased near-term CPI inflation poses a risk of inflation expectations remaining above the target range.
In the meeting minutes, the Committee emphasized the need to continue raising the OCR to bring inflation back to the 1-3% target and fulfill their remit. They discussed both 25 and 50 basis point increases, ultimately opting for the more aggressive 50 basis point hike. This decision aims to maintain current lending rates for businesses and households while supporting an increase in retail deposit rates, countering the downward pressure on lending rates caused by falling wholesale interest rates since the February Statement.
Fed Mester sees monetary policy turning more restrictive this year
In a speech yesterday, Cleveland Federal Reserve President Loretta Mester highlighted her expectation that monetary policy will move "somewhat further into restrictive territory this year," with the fed funds rate surpassing 5% and the real fed funds rate remaining in positive territory for an extended period.
Mester explained that the precise extent and duration of the federal funds rate hike will depend on how inflation and inflation expectations are affected by demand slowing, supply challenges being resolved, and price pressures easing. She noted that her forecast aligns with the modal forecasts of FOMC participants released two weeks ago, although she sees "somewhat more persistent inflation pressures than the median forecast among participants."
According to Mester, inflation will show a substantial improvement, as price pressures are expected to decline from their current 5% YoY increase to 3.75% by the end of 2023 and 2% by 2025. She also anticipates a slowdown in economic growth this year, followed by a rebound in 2023. In terms of unemployment, Mester projects a rise from the current 3.6% to a range of 4.5% to 4.75% by the conclusion of 2023.
(RBNZ) Official Cash Rate increased to 5.25 percent
The Monetary Policy Committee today increased the Official Cash Rate (OCR) by 50 basis points, from 4.75 percent to 5.25 percent.
The Monetary Policy Committee today increased the Official Cash Rate (OCR) by 50 basis points, from 4.75 percent to 5.25 percent.
The Committee agreed the OCR needs to increase, as previously indicated, to return inflation to the 1-3 percent target range over the medium term. Inflation is still too high and persistent, and employment is beyond its maximum sustainable level.
The level of economic activity over the December quarter was lower than anticipated in our February Monetary Policy Statement and there are emerging signs of capacity pressures in the economy easing. However, demand continues to significantly outpace the economy's supply capacity, thereby maintaining pressure on annual inflation.
The recent severe weather events in the North Island have led to higher prices for some goods and services. This higher near-term CPI inflation increases the risk that inflation expectations persist above our target range.
Over the medium term, the Committee anticipates economic activity to be supported by rebuilding efforts in the aftermath of the weather events. The demand on resources is expected to add to inflation pressure by more than assumed in the February Monetary Policy Statement.
Global growth is expected to be below average, contributing to lower demand for New Zealand's key commodity exports. Continued growth in New Zealand's service exports, in particular tourism, is assumed to provide some offset to this drop in export revenue.
New Zealand's economic growth is expected to slow through 2023, given the slowing global economy, reduced residential building activity, and the ongoing effects of the monetary policy tightening to date. This slowdown in spending growth is necessary to return inflation to target over the medium-term.
The Committee agreed that the OCR needs to be at a level that will reduce inflation and inflation expectations to within the target range over the medium term. The Committee agreed that maintaining the current level of lending rates for households and businesses is necessary to achieve this, along with a rise in deposit rates. New Zealand's financial system is well positioned to manage through a period of slower economic activity.
Monetary Policy Committee Record of Meeting
The Monetary Policy Committee discussed developments affecting the outlook for inflation and employment in New Zealand. On balance, recent data, including a fall in GDP in the December 2022 quarter, suggest the level of economic activity is lower than assumed in the February Statement. Committee members observed that inflation is nevertheless still too high and persistent, and employment is beyond its maximum sustainable level. The Committee agreed it must continue to increase the Official Cash Rate (OCR) to return inflation to the 1-3 percent target and to fulfil its Remit.
The Committee discussed recent developments in international financial markets and their implications for New Zealand. Recent banking stress in the United States and Europe has resulted in lower wholesale interest rates and an increase in credit spreads. This reflects, to some degree, the potential for tighter global credit conditions and a weaker outlook for global demand.
New Zealand's financial system (including banks, other deposit takers and insurers) is well placed to keep supporting New Zealanders through a time of global financial market volatility and a slowdown in domestic economic activity. New Zealand's banks are well capitalised, profitable, and have strong liquidity positions, with plenty of cash on hand. They also have comparatively little exposure to interest rate risk on their balance sheets, and hedge or insure against such risks. New Zealand banks are also required to hold capital against this risk to the extent it exists, and are not as susceptible to a concentrated run on deposits, unlike in the US where some banks had very large deposits held by just a few savers.
The Committee's assessment is that there is no material conflict between lowering inflation and maintaining financial stability in New Zealand. In particular, credit conditions have not tightened substantially and while increasing, arrears on mortgages and other debts remain at low levels. In addition, the Reserve Bank has other policy tools available to address financial stability risks which can be used if needed, including providing liquidity to banks and supporting market functioning. Further to this, tightening monetary policy now to reduce inflation improves the outlook for financial stability by limiting the need for even higher interest rates in future.
The Committee discussed the global economic outlook. In many countries, headline inflation has steadied or begun to decline. However, core inflation remains high, reflecting significant broad-based capacity constraints. Global growth is expected to be below average through 2023. Weakening global growth is contributing to weaker demand for New Zealand's key commodity exports, such as dairy and meat. Continued growth in New Zealand's service exports, in particular tourism, is assumed to provide some offset to this drop in export revenue.
Committee members discussed the effects of recent severe weather events. Daily spending data show that these events resulted in a short-lived drop in household spending in affected areas, with a relatively quick bounce back to pre-event levels. At the same time, these events have resulted in an increase in some prices. Over the medium-term, the inflationary impacts of these events are likely to be somewhat larger than assumed at the time of the February Statement as more information has come to light about the scale of rebuild activity. The Committee considered the medium-term impact that these events will have on inflation and maximum sustainable employment when setting policy.
Housing market developments and domestic financial conditions were considered. It was noted that annual household credit growth has slowed significantly in recent months. It was noted that this is consistent with declining house prices and the transmission of past monetary tightening. The Committee noted current monetary policy settings would continue to put downward pressure on house prices, consistent with prices returning to more sustainable levels.
The Committee discussed recent domestic economic developments. There are early signs that growth in the domestic economy is beginning to slow. The economy contracted over the fourth quarter of 2022. Higher frequency indicators point to modest yet positive growth over the first quarter of 2023. Overall, the Committee's assessment is that the economy is starting from a slightly weaker position than assumed in the February Statement. However, demand continues to outpace supply, and this continues to be reflected in persistently high domestic inflation. In addition, near-term inflationary pressures have increased, boosted by short-term price pressures resulting from recent severe weather events and reflected in business survey indicators of costs and pricing intentions.
The Committee discussed the New Zealand labour market noting that it remains strong, with employment continuing to expand. Job advertisements have fallen, but remain at high levels. Net inward migration is rising rapidly from low levels last year, and will likely help fill worker shortages, subject to sufficiently matching current skill shortages.
The Committee considered updated economic projections. Economic growth in New Zealand is anticipated to slow through 2023. This reflects the impact of slowing global growth, the weaker housing market, and the effects of monetary tightening to date. Increased private and public sector activity associated with rebuilding following recent extreme weather events will provide a boost to activity and inflation, as will rising long-term net migration. The current projection assumes Government consumption and investment will fall as a share of the economy in coming years. However, members viewed the risks to inflation pressure from fiscal policy as skewed to the upside, particularly given the ongoing demand for government services in an environment of rising costs of provision. The economic impact of the Government response to recent severe weather events will depend on the scale of damage, fiscal reprioritisation decisions, timing of activity and how Government spending is funded.
Members agreed that the sooner supply and demand were better matched in the economy, the lower the overall cost of reducing inflation. The Committee discussed the extent of additional monetary tightening required to achieve its Remit. Members noted the rapid pace and extent of tightening to date implies monetary policy is now contractionary. The Committee agreed that the full impact of this monetary tightening is yet to be fully realised. Committee members agreed that the OCR needed to reach a level where the Committee could be confident it would reduce actual inflation to within the 1-3 percent target range over the forecast horizon.
The Committee agreed that a further increase in the OCR is needed at this meeting to ensure core inflation and inflation expectations begin to fall. The Committee discussed 25 and 50 basis point increases at this meeting. In aggregate, economic projections were little changed relative to the February Statement. The Committee was comfortable that current lending rates faced by businesses and households will help ensure core inflation and inflation expectations begin to moderate. However, wholesale interest rates have fallen significantly since the February Statement, and this could put downward pressure on lending rates. As a result, a 50 basis point increase in the OCR was seen as helping to maintain the current lending rates faced by businesses and households, while also supporting an increase in retail deposit rates.
Looking ahead, the Committee is expecting to see a continued slowing in domestic demand and a moderation in core inflation and inflation expectations. The extent of this moderation will determine the direction of future monetary policy.
On Wednesday 5 April, the Committee reached a consensus to increase the OCR by 50 basis points from 4.75% to 5.25%.
Attendees: Reserve Bank members of MPC: Adrian Orr, Christian Hawkesby, Karen Silk, and Paul Conway.
External MPC members: Bob Buckle, Peter Harris and Caroline Saunders.
Treasury Observer: Tim Ng.
MPC Secretary: Adam Richardson.
First Impressions: RBNZ Monetary Policy Review
The RBNZ delivered an unexpectedly large 50bp hike in the OCR, and a further 25bp rise seems on the cards for the May Monetary Policy Statement.
RBNZ Monetary Policy Review, April 2023
The Reserve Bank surprised by raising the OCR by 50 basis points to 5.25% at today’s review, rather than the 25bp that most were expecting.
In aggregate the RBNZ sees the overall profile for inflation pressures as relatively unchanged since February, when its projections showed that the OCR might need to move to 5.5% over the first half of 2023.
The RBNZ acknowledged the weaker starting point for GDP. But the downward impact this would have on their projections was balanced by upward shocks to prices in the wake of the recent flooding and Cyclone Gabrielle. The RBNZ remains concerned about the potential for inflation expectations to be unanchored by the currently high level of core and headline inflation.
The RBNZ acknowledged the recent financial stability pressures offshore, but did not see these as having any significant impact on financial conditions or financial stability in New Zealand. In any case the RBNZ affirmed that they have tools other than the OCR available to deal with financial stability pressures should they arise.
The bottom line is that the RBNZ seems intent on getting the OCR to the level they saw as sufficiently contractionary back in February – that is, an OCR of 5.50%. Any movements in the OCR beyond that point will be data-dependent, but it seems likely the base case will be for a further 25bp increase at the May Monetary Policy Statement.
Based on the tone of this release, it’s likely the RBNZ will retain a tightening bias that will be data-dependent and contingent on the economy and inflation pressures evolving as required to bring inflation expeditiously back towards the 1-3% target range.
Bitcoin Price Eyes Key Upside Break Above $30K
Key Highlights
- Bitcoin price is consolidating gains above the $27,500 support zone.
- BTC broke a key declining channel with resistance near $28,150 on the 4-hours chart.
- EUR/USD and GBP/USD climbed further higher above 1.0950 and 1.2420 respectively.
- The US ISM Services PMI could decline from 55.1 to 54.5 in March 2023.
Bitcoin Price Technical Analysis
Bitcoin price remained well bid above the $25,000 support zone. BTC/USD seems to be forming another bullish trend above the $26,000 pivot zone.
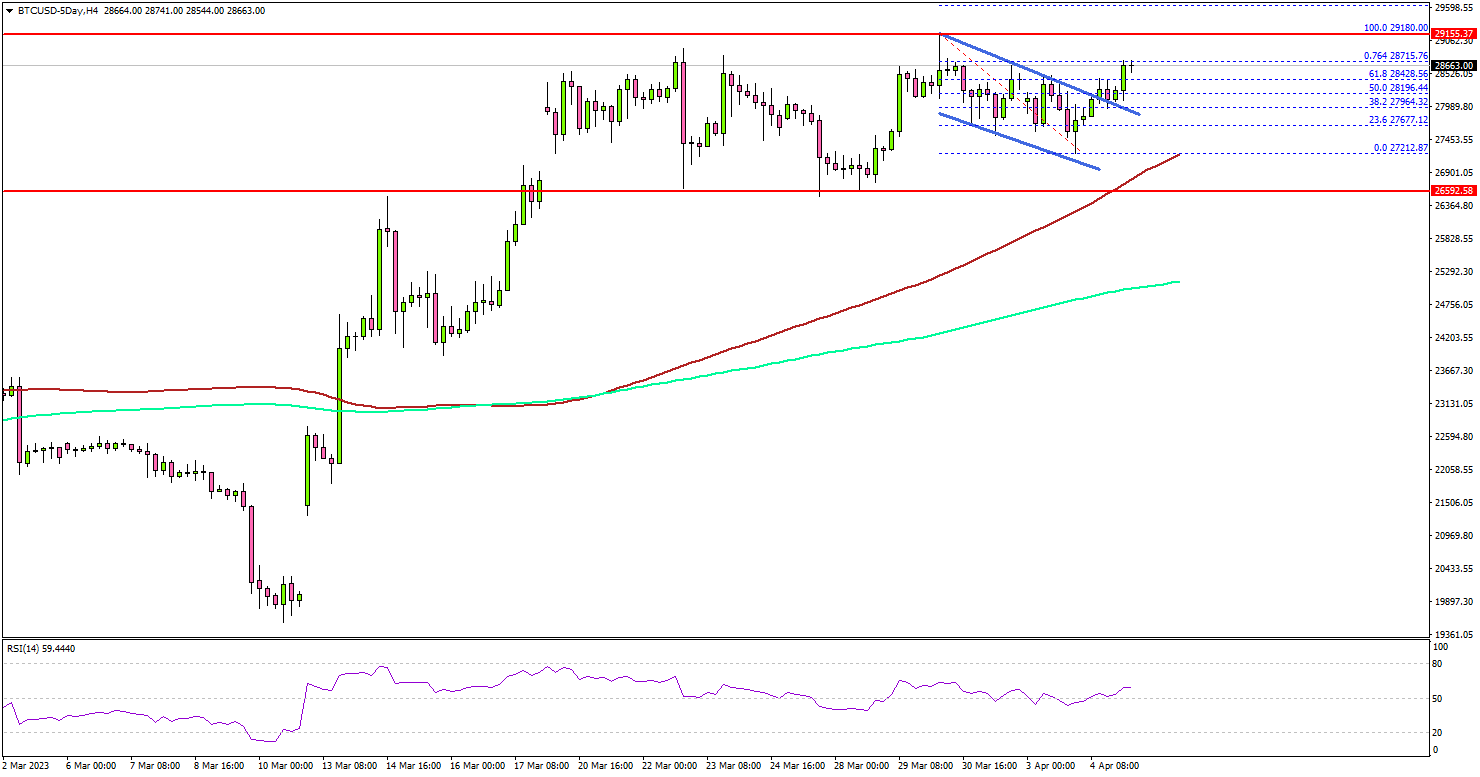
Looking at the 4-hours chart, the price started a fresh increase and was able to clear the $27,500 resistance zone. It broke a key declining channel with resistance near $28,150 to move further into a positive zone.
The price is now trading well above the 100 simple moving average (red, 4-hours) and the 200 simple moving average (green, 4-hours).
It is consolidating near the $28,500 resistance zone. The first major resistance is near the $28,800 level. A successful close above the $28,800 level might spark another bullish wave. In the stated case, the price may perhaps rise towards the $30,000 level.
Any more gains could set the pace for a larger increase to $32,000. On the downside, an initial support sits near the $27,500 level.
The main breakdown support sits near the $27,200 zone and the 100 simple moving average (red, 4-hours). If there is a downside break and close below $27,000, bitcoin might start another decline in the coming days.
In the stated case, it could revisit the $25,000 support or the 200 simple moving average (green, 4-hours). Any more losses might send the price towards $23,500.
Economic Releases
- Germany’s Services PMI for March 2023 - Forecast 53.9, versus 53.9 previous.
- Euro Zone Services PMI for March 2023 – Forecast 55.6, versus 55.6 previous.
- UK Services PMI for March 2023 – Forecast 52.8, versus 52.8 previous.
- US Services PMI for March 2023 – Forecast 53.8, versus 53.8 previous.
- US ISM Services PMI for March 2023 – Forecast 54.5, versus 55.1 previous.
Silver (XAGUSD) Breaks Higher and Forms Elliott Wave Bullish Sequence
Silver (XAGUSD) broke above the previous peak on 2.2.2023 high ($24.62). As a result, it now shows a bullish sequence from 9.1.2022 low favoring further upside. A 100% – 161.8% Fibonacci extension from 9.1.2022 low targets 26.91 – 31.23. Near term, cycle from 3.10.2023 low is in progress as a 5 waves nesting impulse Elliott Wave structure. Up from 3.10.2023 low, wave 1 ended at 22.71 and pullback in wave 2 ended at 22.12. The metal has resumed higher in wave 3 which subdivides into another 5 waves in lesser degree.
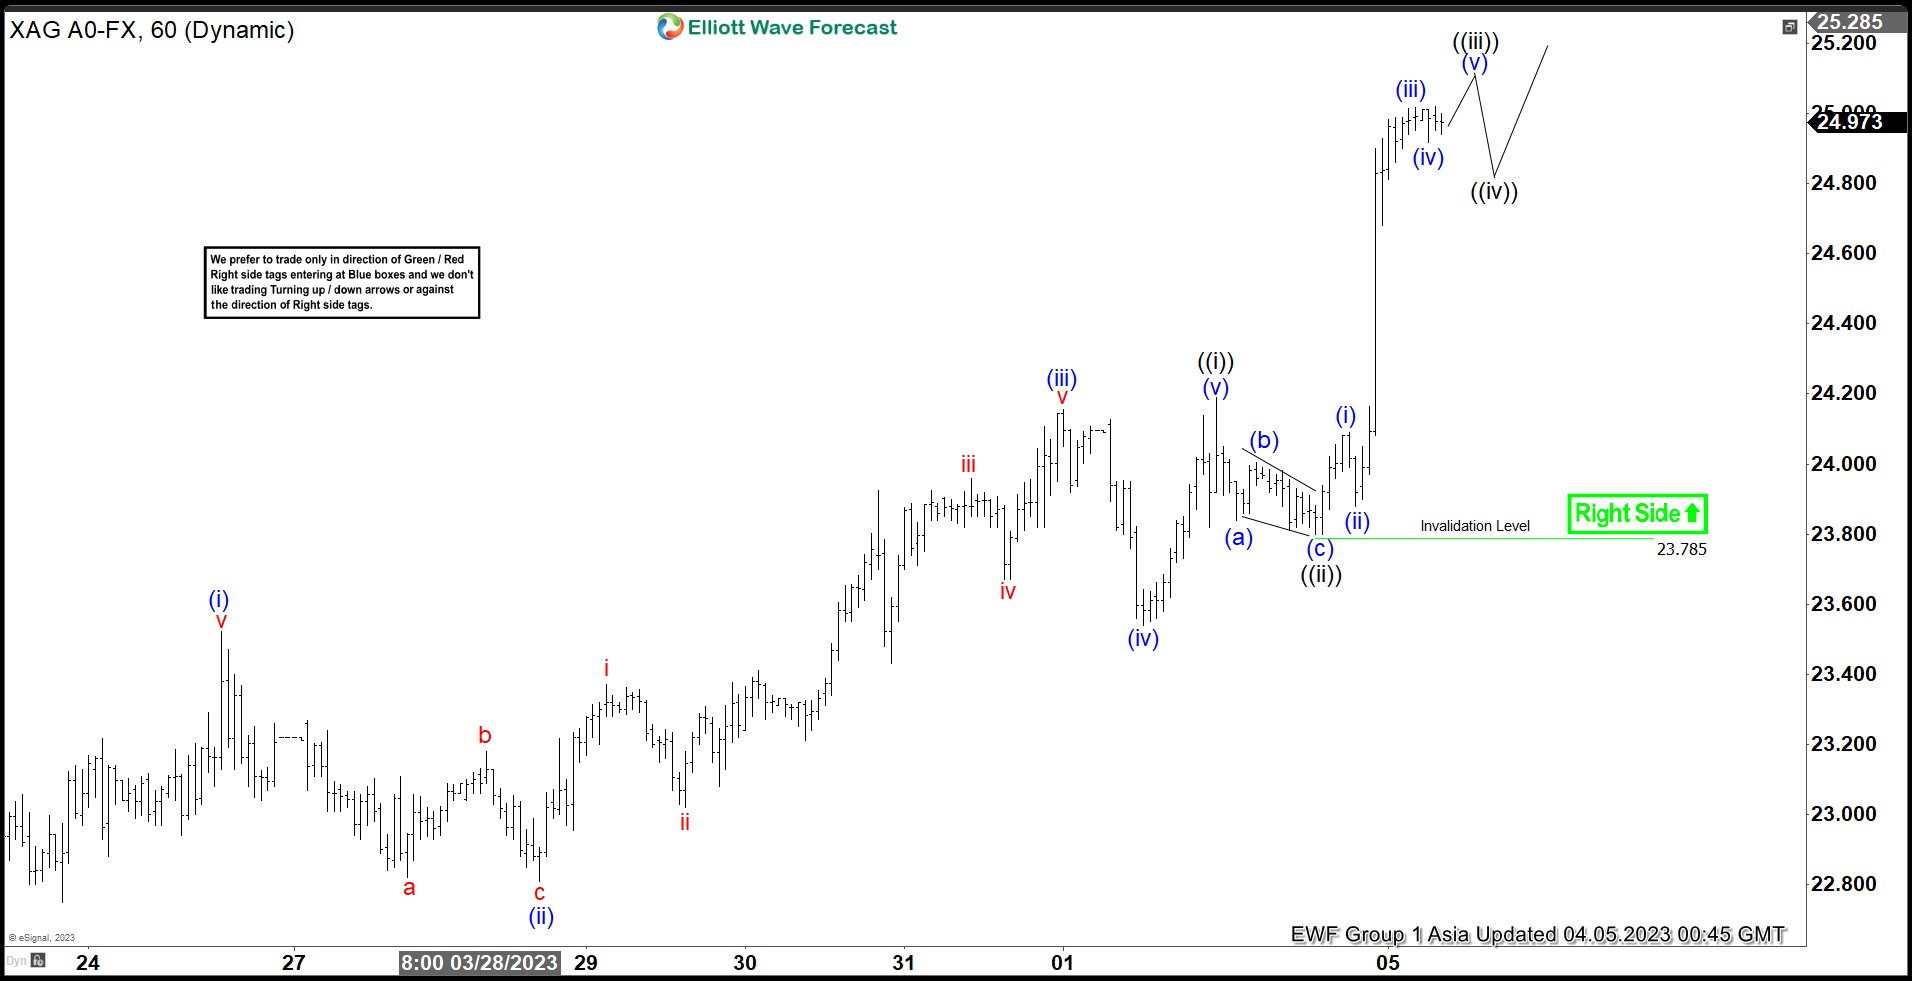
Up from wave 2, the 1 hour chart below shows wave (i) ended at 23.52 and wave (ii) ended at 22.8. Wave (iii) ended at 24.15, wave (iv) ended at 23.54, and wave (v) ended at 24.19 which completed wave ((i)). Pullback in wave ((ii)) ended at 23.78. The metal extends higher in wave ((iii)) and expected to complete soon. Afterwards, it should pullback in wave ((iv)) in 3, 7, or 11 swing before it resumes higher. Near term, as far as pivot at 23.78 low stays intact, expect dips to find support in 3, 7, or 11 swing for further upside.
Silver 60 Minute Elliott Wave Chart
Silver (XAGUSD) Elliott Wave Video
Silver (XAGUSD) broke above the previous peak on 2.2.2023 high ($24.62). As a result, it now shows a bullish sequence from 9.1.2022 low favoring further upside. A 100% – 161.8% Fibonacci extension from 9.1.2022 low targets 26.91 – 31.23. Near term, cycle from 3.10.2023 low is in progress as a 5 waves nesting impulse Elliott Wave structure. Up from 3.10.2023 low, wave 1 ended at 22.71 and pullback in wave 2 ended at 22.12. The metal has resumed higher in wave 3 which subdivides into another 5 waves in lesser degree.
Are the Bulls Back for Bitcoin?
Hey, have you heard about the latest news on de-dollarization? It's the process of shifting away from the US Dollar (USD) as the world's reserve currency for trading oil and other commodities. The USD has been facing many problems lately, such as rising inflation, declining geopolitical relations, and the erosion of trust in banks and the Federal Reserve. As a result, many countries are moving towards using their currencies instead. For instance, China has already signed agreements with Australia, Russia, Japan, Brazil, and Iran to use their national currencies for trade. Moreover, the BRICS member countries are discussing the possibility of creating their currency backed not by gold but by land and rare earth metals. This could significantly weaken the USD's presence in global economic activity and boost cryptocurrencies like Bitcoin. Exciting times are ahead for global currencies, don't you think?
BTCUSD - Weekly Timeframe
The weekly timeframe of BTCUSD is currently at a drop-base-drop supply zone. It is expected that we will get to see some minor initial reactions from the supply zone. The overall market direction, however, looks largely bullish based on the break above the previously marked highs. The trendline support and the 100-period moving average are in perfect alignment. Combining that with the drop-base-rally demand zone, we have credible confirmations of the bullish sentiment.
Analysts’ Expectations:
- Direction: Bullish
- Target: $37124
- Invalidation: $19506
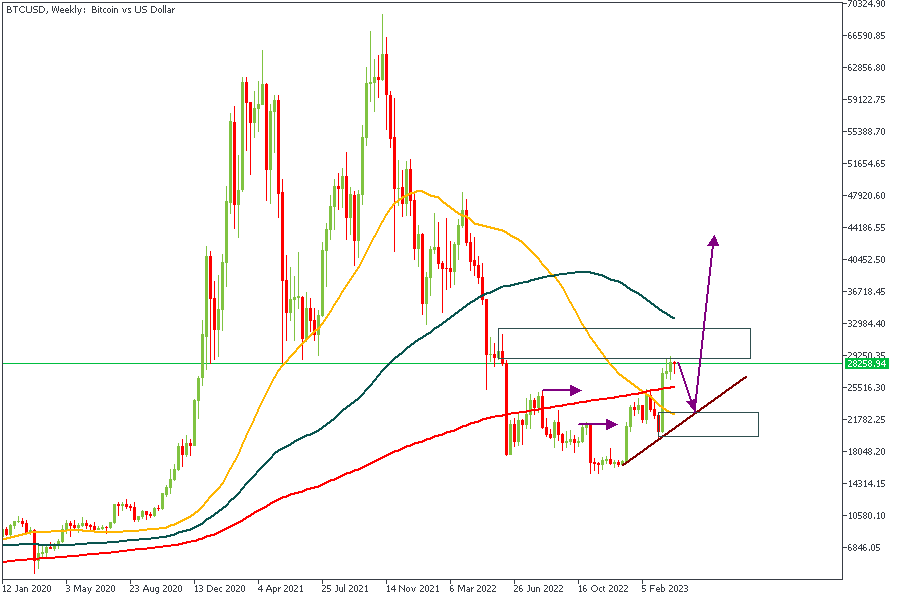
Based on the technical breakdown indicating a change in the market from a bearish to a bullish sentiment, it is safe to conclude that the Bulls might just be gearing up to resume the bullish movement once the retracement move is completed.
CONCLUSION
The trading of CFDs comes at a risk. Thus, to succeed, you have to manage risks properly. To avoid costly mistakes while you look to trade these opportunities, be sure to do your due diligence and manage your risk appropriately.
BTCUSD and XRPUSD Technical Analysis
BTCUSD – Hammer Pattern Is Above $26,529
Last week, the bearish momentum in Bitcoin price didn't sustain, and after touching the low of $26,529 on 27th March, the prices started to correct upwards against the US Dollar and touched the high of $29,171 on 30th March.
At the beginning of the week, Bitcoin is ranging near a NEW record 1-month high. We can clearly see a hammer pattern above $26,529, which signals a downtrend reversal.
Bitcoin touched an intraday low of $27,244 in the Asian trading session and an intraday high of $28,144 in the European trading session today.
The Williams percent range indicator is back over -50 in the daily timeframe, indicating a bullish trend.
Both the STOCH and STOCHRSI are reflecting overbought conditions, which means that in the immediate short term, a decline in the prices is expected.
The price is back over the pivot point in the daily timeframe, which stands for the bullish nature of the markets.
The relative strength index is near 53, which is a sign of a NEUTRAL demand for Bitcoin and a shift towards the consolidation phase in the markets.
Bitcoin is above a 200-hour simple moving average and above a 200-hour exponential moving average.
The average true range is indicating lower market volatility with a bullish momentum.
- Bitcoin bullish reversal is seen above $26,529.
- The RSI remains above 50, indicating a bullish market.
- The price is now trading above its pivot level of $28,028.
- Short-term range is moderate BULLISH.
- Some major technical indicators signal that the price may move to $28,500 and $29,000 soon.
Bitcoin Bullish Reversal Seen Above $26,529
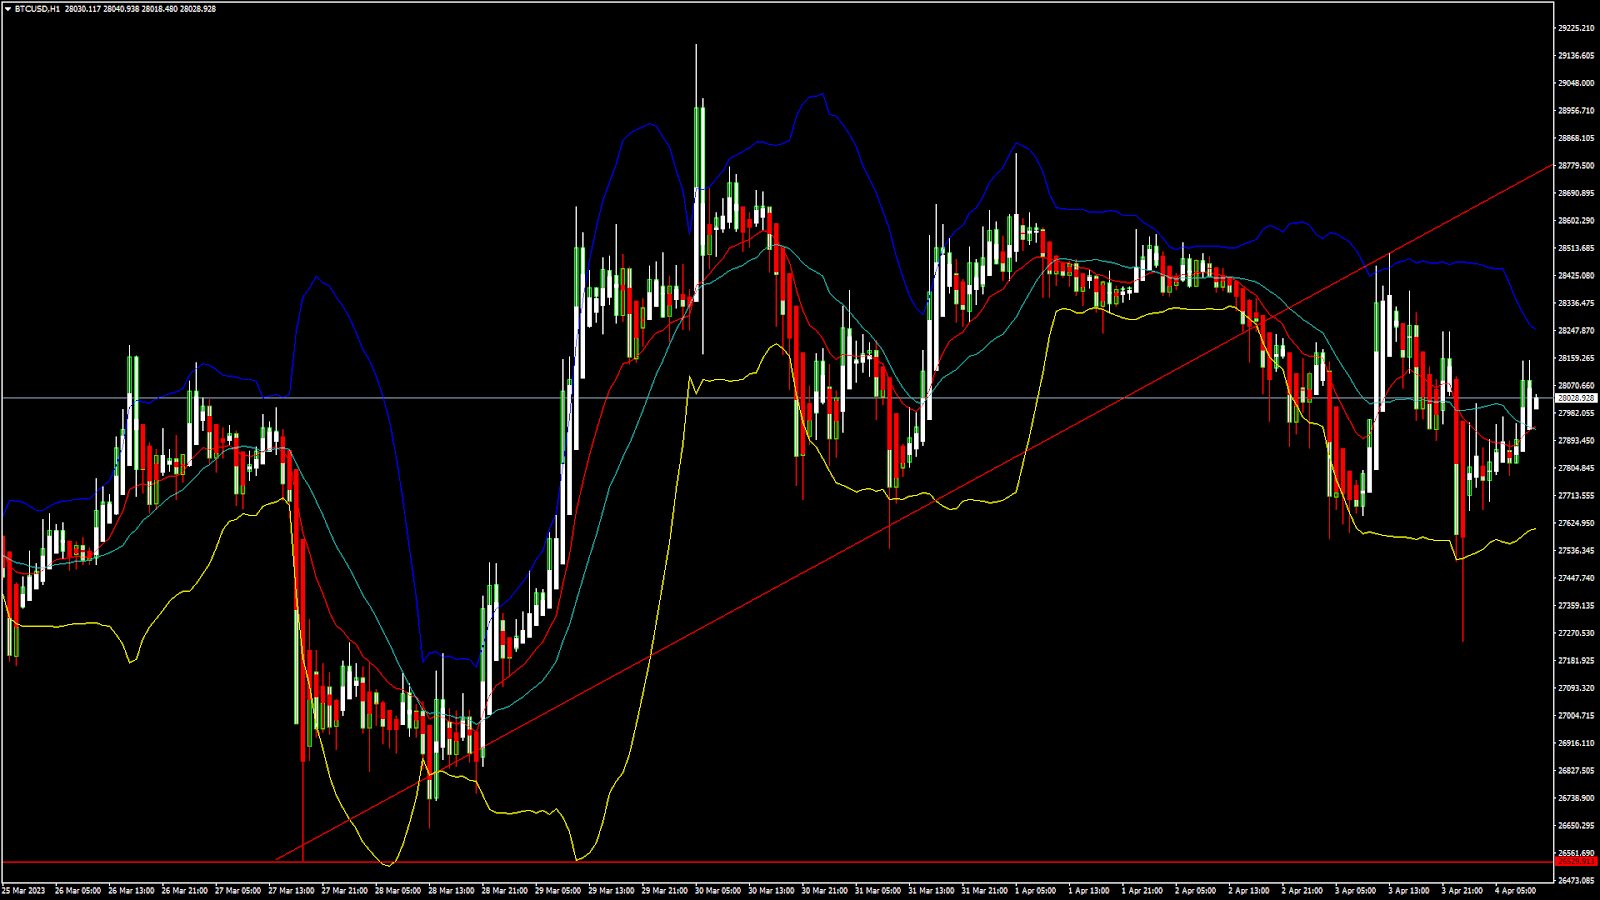
The prices of Bitcoin have been successful in crossing the $29,000 resistance, and now we are looking for fresh upsides in the range of $30,000 and $32,000.
With the continued support seen at lower levels, we can see the formation of an ascending channel which may push the prices of Bitcoin above $30,000.
There is also a bullish crossover pattern with the 20-period and 50-period adaptive moving averages in the 4-hour timeframe.
A support zone is located at $26,547, where the price crosses the 18-day moving average, and at $27,144, which is the first support of the pivot point indicator.
BTCUSD is now facing its classic resistance level of $28,188 and Fibonacci resistance level of $28,286, breaking which the price will be able to move to $29,000.
There is an increase of 31.90% in the daily trading volume, which is normal. The short-term outlook for Bitcoin is bullish, the medium-term outlook has turned bullish, and the long-term outlook remains neutral under present market conditions.
The Week Ahead
We can see that Bitcoin has now resumed its long-term uptrend with the current support at $16,538 formed on 1st January 2023, which marked the end of the crypto winter.
Now the price of Bitcoin is ranging near the triangle's support in the 1-hour chart, reflecting bullish sentiment.
The immediate expected target is $30,000, after which we may see some consolidation in the zone of the $29,500 level.
Daily RSI is at 59.72, which indicates a NEUTRAL demand for Bitcoin and the shift towards the consolidation phase in the medium-term range.
We can see the formation of a bullish trendline from $26,529 to $28,771.
The BTCUSD is now facing resistance at $29,147, which is a 13-week high, and at $30,471, which corresponds to a 14-day RSI at 70.
XRPUSD – Double Bottom Pattern Is Above $0.4548
Last week, the market sentiment turned bullish after Ripple touched a low of $0.4548 on 27th March and started to correct. On 29th March, it touched a high of $0.5846.
The market opened bearish this week. There is a double bottom pattern above the $0.4548 handle.
Ripple touched an intraday low of 0.4817 in the Asian trading session and an intraday high of 0.5020 in the European trading session today.
The MACD indicator is giving a bullish divergence signal in the 2-hour timeframe, which stands for the bullish nature of the market.
The relative strength index is at 61.43, which signifies a STRONG demand for Ripple at the current market prices and the continuation of the bullish phase in the market.
Moving averages signal an upward price movement at the current market level of 0.4955.
Both the STOCHRSI and CCI are in the overbought zones, which means the price may decline in the short-term phase.
Ripple is now trading just below its pivot level of 0.5109 and is now facing its classic resistance at 0.5813 and Fibonacci resistance at 0.5652, after which it will be able to move towards 0.6000.
Some of the major technical indicators are bullish.
- Ripple bullish reversal is seen above 0.4548.
- The price is below its pivot level.
- Average true range indicates HIGH volatility.
Ripple Bullish Reversal Seen Above $0.4548
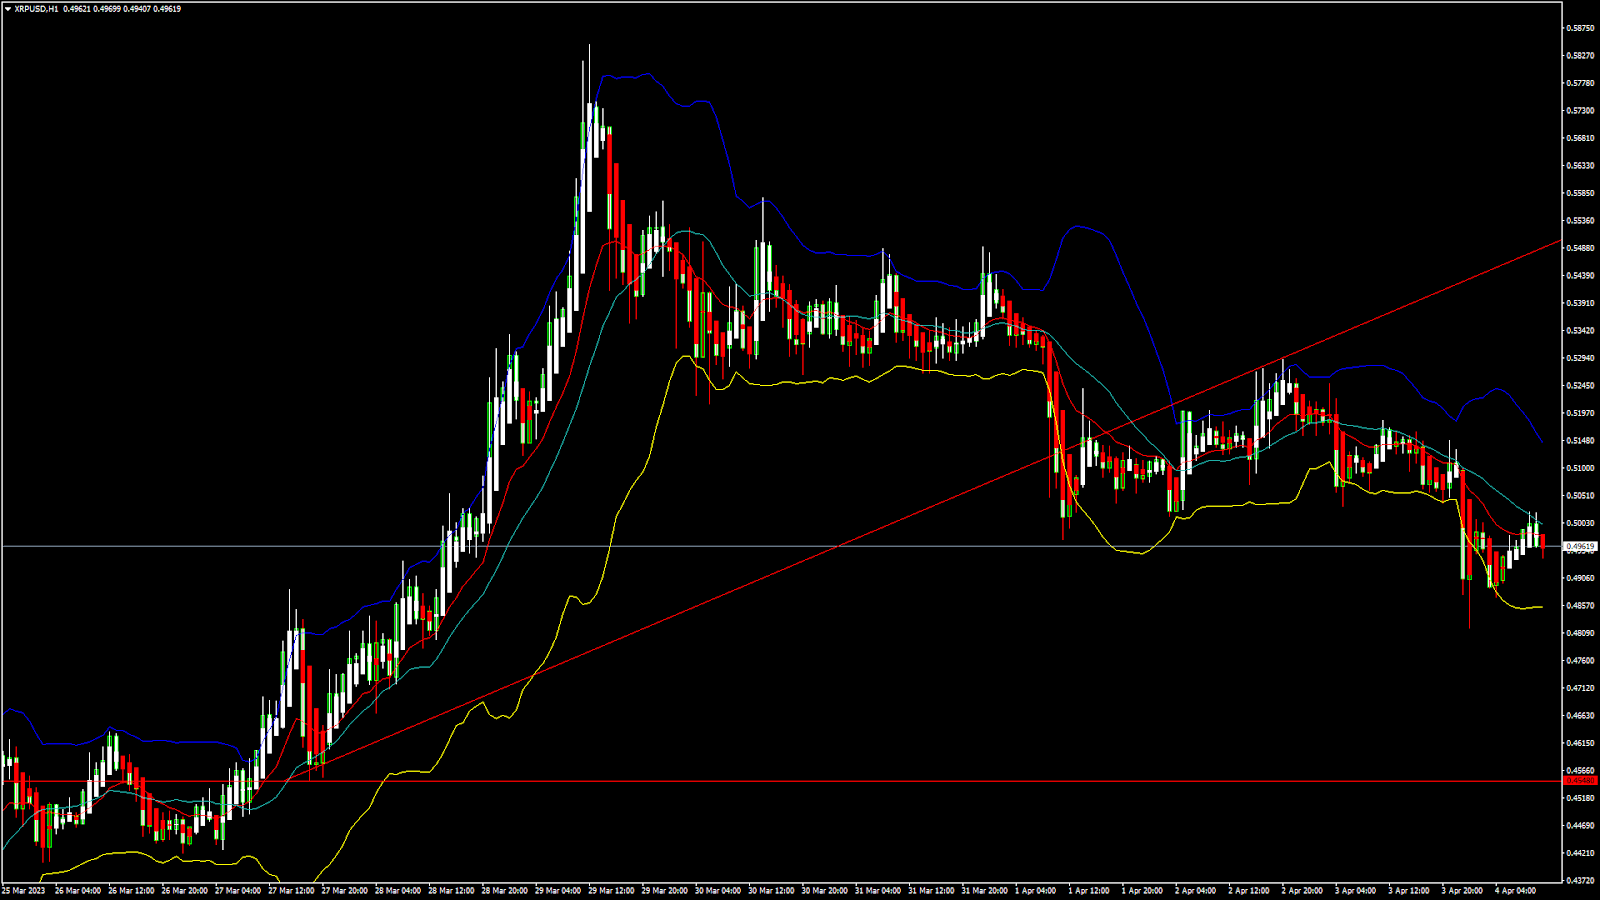
We can see that Ripple continues to move bullish, and further resistance levels are at 0.5500 and 0.6000.
The previous candle closed over Bollinger bands signalling a neutral sentiment in the weekly timeframe.
We can see the formation of the bullish trend reversal pattern with the 50-week Adaptive Moving Average in the weekly timeframe.
We have also detected a bullish price crossover with a 50-period moving average MA50 in the 15-minute timeframe.
The short-term outlook for Ripple has turned bullish, the medium-term outlook is bullish, and the long-term outlook is neutral.
We can see a decrease of 1.27% in the daily trading volumes of Ripple, which is an average value.
This Week Ahead
Ripple continues to move in a strong bullish momentum above the 0.4500 level. We are now looking for fresh upsides in the range of 0.5500 and 0.6000.
We saw a pullback after the price touched a high of $0.5846, which is expected to be short-term, and after the current phase of market consolidation gets over, we are looking for a fresh rally.
The resistance level is located at $0.5289, which is the first resistance pivot and at $0.5343.
We can see a continuous progression of a bullish trendline formation from $0.4548 to $0.5498.
The support level is located at $0.4866, which is a 38.2% retracement from the 13-week high, and at $0.4941, which is a 38.2% retracement from 4-week high.
The weekly outlook for Ripple is $0.6000 with a consolidation zone of $0.5500.
XAU/USD: Gold Surges to One-Year High
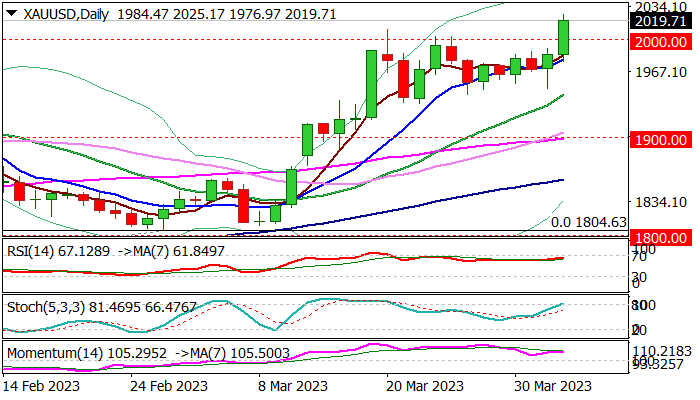
Gold was sharply up in early US trading on Tuesday, breaking through psychological $2000 level and hitting the highest since March 2022.
Fresh rally was sparked by weaker than expected US data which added to uncertainty and prompted traders from dollar into safety of the yellow metal
Today’s advance signals that extended consolidation under $2000 is likely over and the price is entering fresh bullish phase after a two-week pause.
Strong rise ($2025 peak reached so far and price holding there) adds to expectations that the latest break higher will be verified by close above broken $2000 level, which will generate bullish signal and unmask key targets at $2070 (Mar 2022 high) and $2074 (gold’s record high, posted on Aug 2020).
Overall environment is favorable for gold and improving, as the global economy remains fragile, weighed by persisting pressure from high energy prices, stubbornly high inflation, rising interest rates and continuous political and geopolitical tensions, which threaten to escalate.
Investors also sell dollar on growing speculations that the Fed may end its tightening cycle sooner than initially estimated, which also makes the greenback less attractive and adds support to gold.
Res: 2025; 2037; 2055; 2070
Sup: 2009; 2000; 1978; 1966