

Sample Category Title
Week Ahead – US CPI Data, Fed Minutes, and BoC Decision on Investors’ Radar
Next week starts on a quiet note as Monday is Easter Monday for most economies on our radar. That said, the calendar becomes heavier as the days pass by, with the spotlight probably falling on the US CPI numbers for March, the minutes from the latest FOMC gathering, and the BoC decision. The US data will probably constitute another piece of information in the riddle of whether the Fed should hit the hike button one last time in May, while the BoC decision may reveal whether this will be the major central bank to hit the cut button first.
Will the US CPIs and Fed minutes corroborate the pivot view?
At the start of this week, investors timidly started tilting the scale towards another rate hike by the Fed at its upcoming gathering in May, but a streak of disappointing US data thereafter revived doubts on what could be the wisest choice at the upcoming gathering.
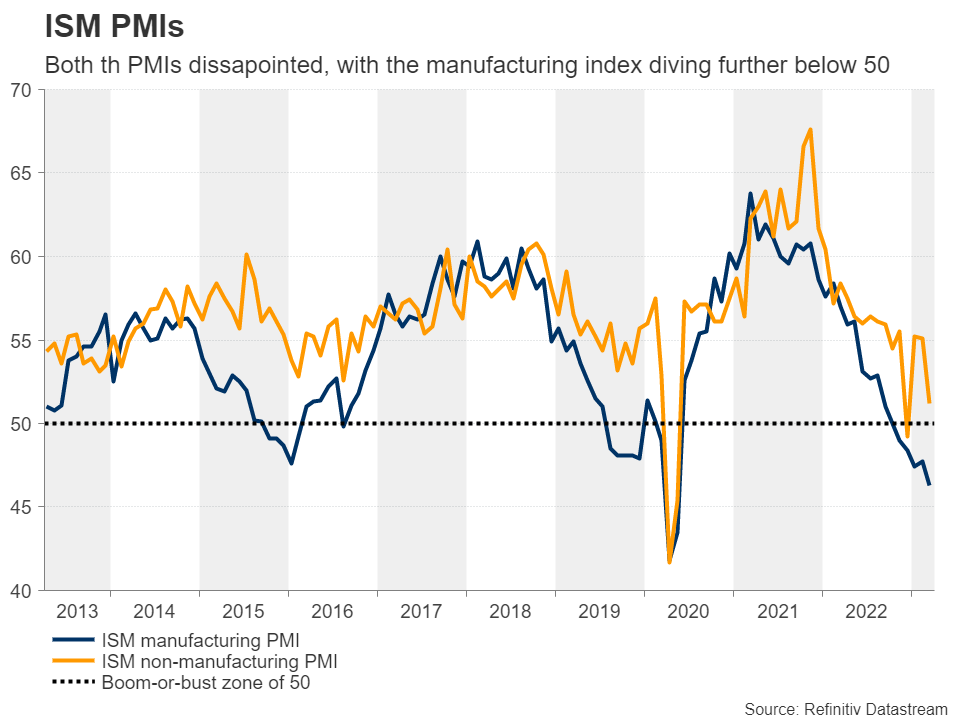
Both the ISM manufacturing and non-manufacturing PMI survey disappointed on all fronts, from employment to prices, with the outlook of the labor market becoming dimmer after job openings for February slipped to their lowest in nearly two years and after the ADP report revealed that the private sector gained fewer than expected jobs in March and much less than it did in February.
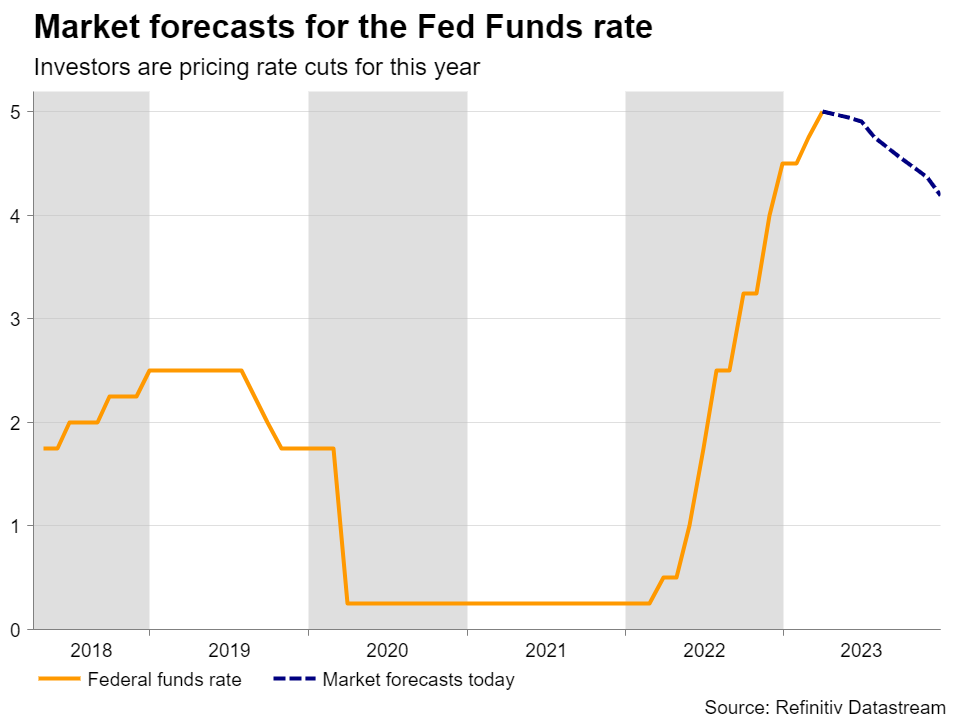
With all that in mind, market participants are now evenly split on whether the Fed should deliver one last 25bps hike in May or stay sidelined, anticipating a series of reductions to start in the summer, with interest rates seen ending 2023 at around 4.2%.
On Wednesday, the CPI data for March are scheduled to be released, while later in the same day, the Fed will publish the minutes of its latest gathering, where officials hiked by 25bps, but changed their forward guidance to note that future increments ‘may’ be warranted. Coming in the midst of concerns about the stability of the banking system, the word ‘may’ was the key to opening the door for a potential pause as soon as at the next gathering, even as the new “dot plot” and several policymakers in the aftermath of the meeting continued indicating that another hike is likely.
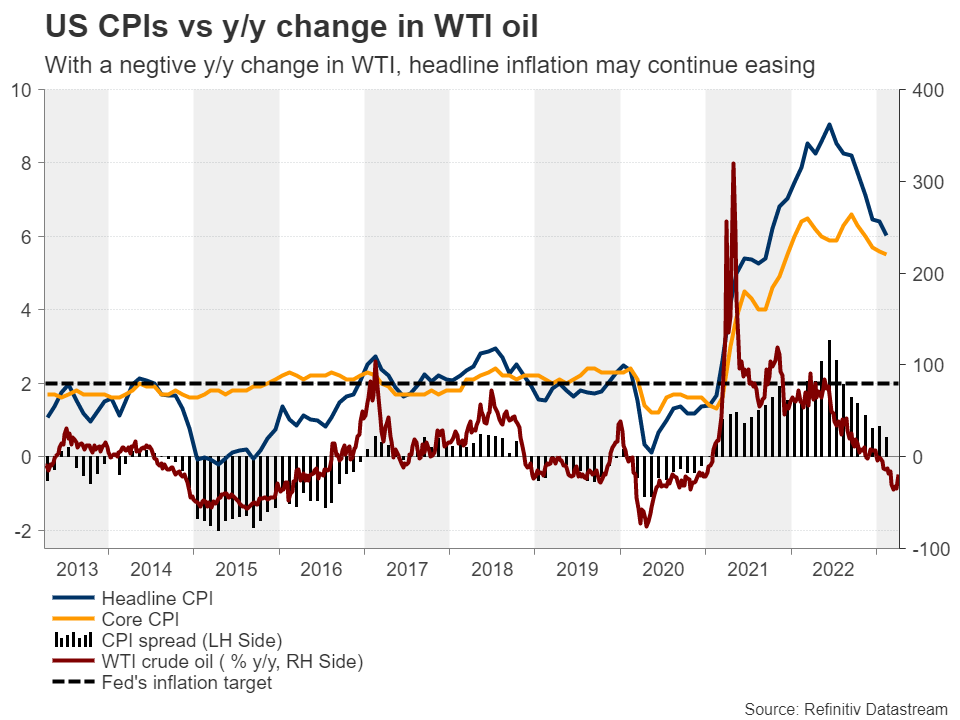
Investors seem to ignore anything that pushes against their view and pay more attention to reaffirmations. Thus, they may dig into the minutes to see whether officials discussed the possibility of a pause. Further slowdown in inflation and even the slightest glimpse in the minutes hinting at a the likelihood of a pause, could add extra credence to the market’s view, thereby sending Treasury yields and the US dollar lower.
The big question is how Wall Street traders will interpret the information. Up until this week, bad data was good for stocks on the thinking that lower interest rates will result in pricier valuations. However, that theme changed this week, with equity indices coming under pressure on fears that the US may be entering a deeper-than-previously-feared downturn.
As for the rest of the US data, Thursday brings the US PPIs for the month, while the last test for dollar traders during next week will come in the form of the US retail sales and industrial production for March, as well as the preliminary UoM consumer sentiment index for April, all to be released on Friday.
Will the BoC be the first major central bank to start cutting rates?
Wednesday will not be a busy day for dollar traders only. Those having the loonie in their portfolios will have to stay in front of their screens when the BoC decides on interest rates. At their last meeting, Canadian policymakers decided to keep interest rates unchanged, becoming the first major central bank to hit the pause button in this tightening crusade. Although in its statement, the BoC reiterated it remains prepared to increase rates further if needed, it also said that the latest data remains in line with the Bank’s expectations that CPI inflation will come down to around 3% in the middle of the year.
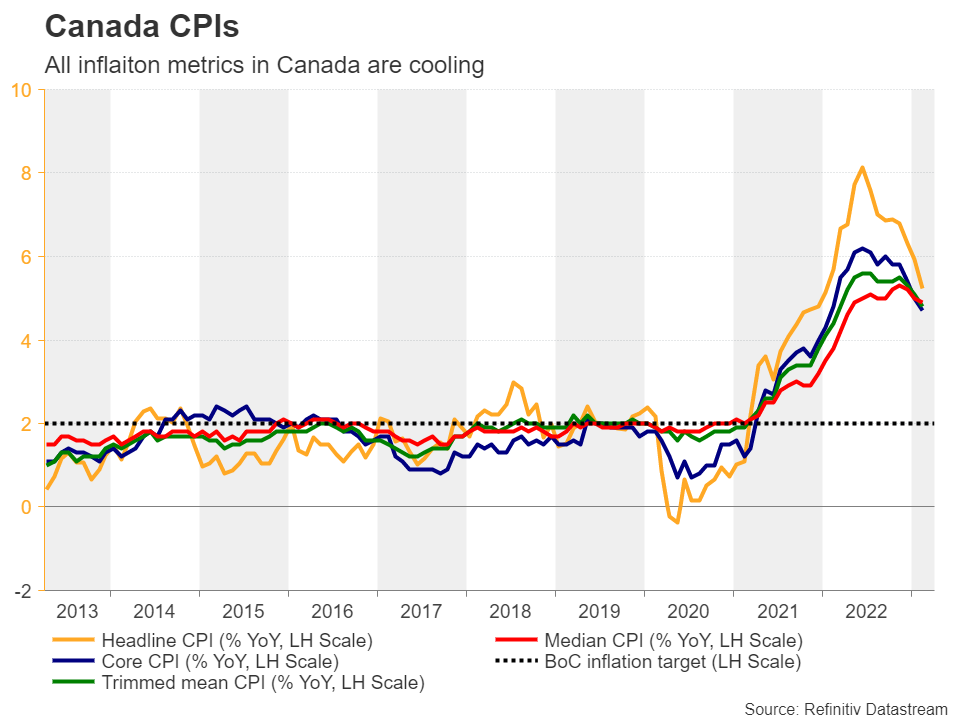
Post-meeting data showed that most inflation metrics in Canada slowed by more than expected in February, reaffirming the Bank’s view and prompting investors to assign a 15% chance of a rate cut as soon as at next week’s gathering, with the remaining 85% pointing to no action. This means that if officials decide to keep interest rates untouched, any market reaction may come from hints and clues regarding the Bank’s future course of action. So, anything suggesting that they could start cutting rates soon could add pressure to the Canadian dollar.
Aussie awaits Australia’s jobs report and China’s inflation numbers
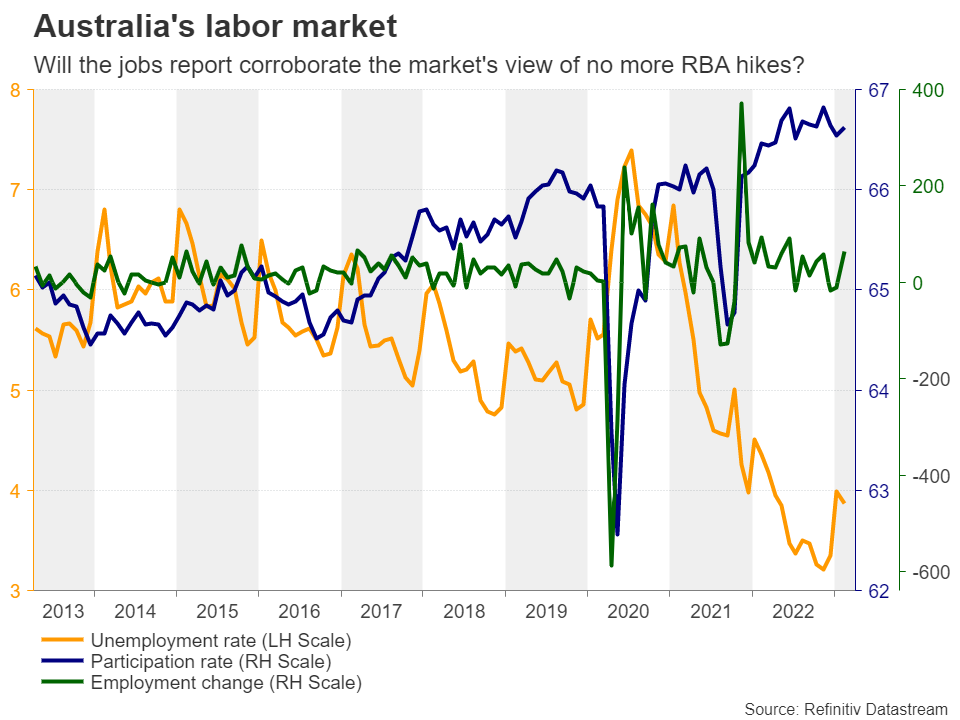
With the RBA standing pat on Tuesday but noting that some further tightening may be needed, aussie traders may pay extra attention to the Australian employment report for March scheduled to be released on Thursday, but also on the Chinese CPI and PPI data, which come on Tuesday, as the world’s second largest economy is Australia’s main trading partner.
The Chinese CPI is forecast to have accelerated notably, but the PPI is expected to have remained well into the negative territory. The former could be due to increasing domestic demand after the economy’s reopening from the COVID-related restrictions, but putting the latter into the equation, it may be hard to identify whether Chinese exports to Australia will fuel Australian inflation. China’s overall trade balance data are coming out on Thursday.
Currently investors are almost fully convinced that the RBA will not deliver any other rate increases. On the contrary, they are nearly fully pricing in a quarter-point rate reduction by the end of this year, and a weak jobs report could justify that view, thereby hurting the already-wounded aussie even more, especially against its New Zealand counterpart, which benefited this week from the RBNZ’s decision to hike by 50bps and signal that more hikes are on the cards.
Other releases on tap
From the Eurozone, retail sales and industrial production for February are coming on Tuesday and Thursday, while on Thursday, traders will also get the industrial and manufacturing production figures, the monthly GDP, and the trade balance, all for February. With the BoE expected to deliver more than 25bps worth of additional rate increments before it takes the sidelines, pound traders may seek reaffirmation in these releases.
EUR/USD Technical Analysis
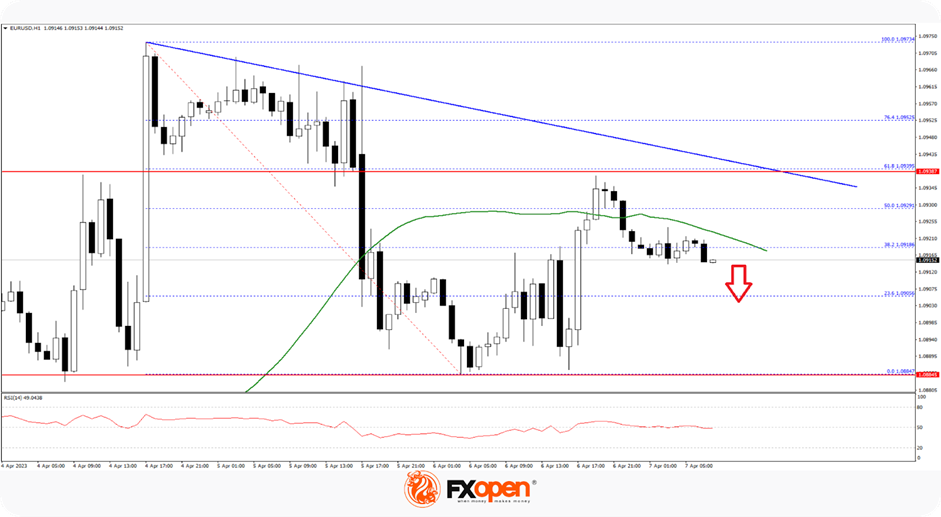
On the hourly chart at FXOpen, the Euro started a fresh increase from the 1.0885 support zone against the US Dollar. The EUR/USD pair climbed above the 1.0915 resistance to move into a short-term positive zone.
However, it struggled to stay above the 1.0920 pivot level and the 50-hour simple moving average. It is now moving lower and trading below the 1.0920 level. On the upside, immediate resistance is near the 50-hour simple moving average.
The next major resistance is near a trendline at 1.0935. A break above the trendline could trigger another increase. In the stated case, the pair could rise toward 1.0980.
Conversely, it may continue to move down below 1.0900. The next key support is near 1.0880. If it’s broken, the price may drop toward the 1.0850 level. Any more losses may send the pair toward the 1.0820 level in the near term.
EURAUD Bulls Eager for Another Move Higher
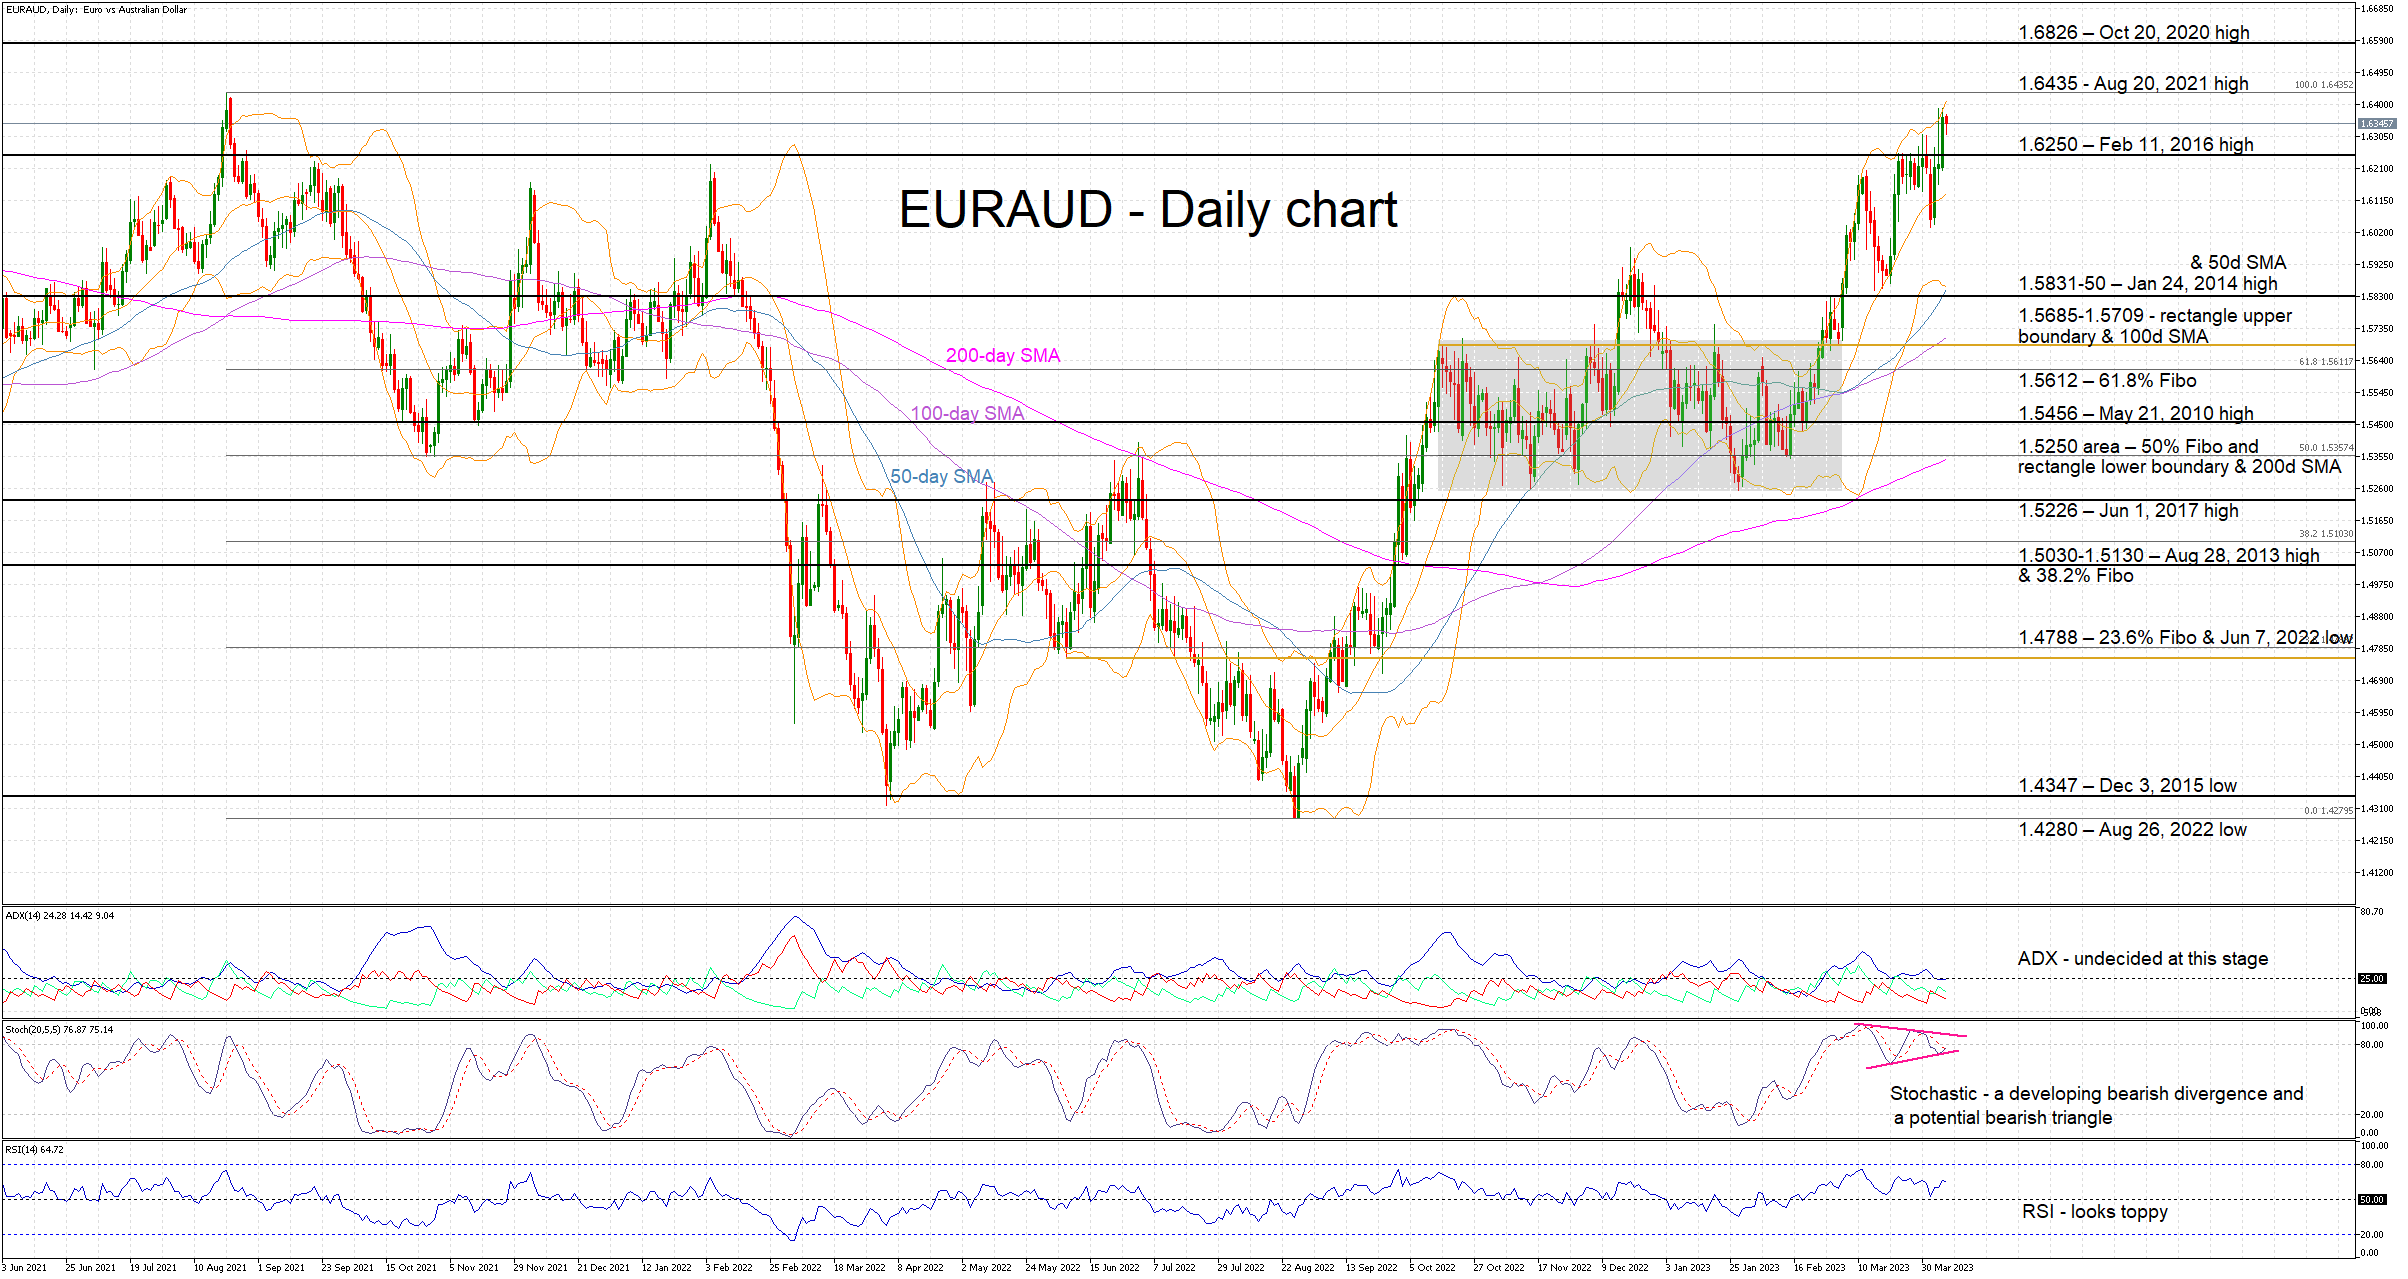
EURAUD is just a tad below the August 20, 2021 high of 1.6435, almost completing a 20-month round trip. It has actually been a one-way street since the August 26, 2022 low of 1.4280 with the EUR bulls staging an impressive 15% rally in just eight months. The recent banking sector events, which did not involve euro area banks, did little to dent the EUR bulls’ appetite.
The interesting thing is that the most recent upleg has occurred even though the Average Directional Movement Index (ADX) is pointing to an almost trendless market. On the other hand, the RSI remains well into bullish territory, but some rally exhaustion appears to be building up lately. The stochastic oscillator is once again the most interesting of the three indicators. The recent EURAUD highs have not been confirmed by a similar print in the stochastic, and the stochastic appears to be hovering inside a symmetric triangle. Both conditions are usually associated with imminent bearish moves, potentially making the bulls’ life more difficult going forward.
Should the bulls remain in control of the market, their first aim would be to test the August 20, 2021 high of 1.6435. This is key for market sentiment and if successfully broken, the path would be clear until 1.6826, the October 20, 2020 high.
On the other hand, the bears would love a push towards the 1.5830-1.5851 area. This is defined by the January 24, 2014 high and the 50-day simple moving average (SMA). A potential break of this area would be a strong win for the bears. Lower, the upper boundary of the October 2022 – March 2023 rectangle and the 100-day SMA at the 1.5685-1.5709 range could put up a stronger fight.
To sum up, the bulls’ confidence is sky-high, but their resolve would be tested if the technical picture turns bearish and EURAUD dips towards the 1.5850 area.
AUDUSD Remains Directionless as 50-day SMA Caps Upside
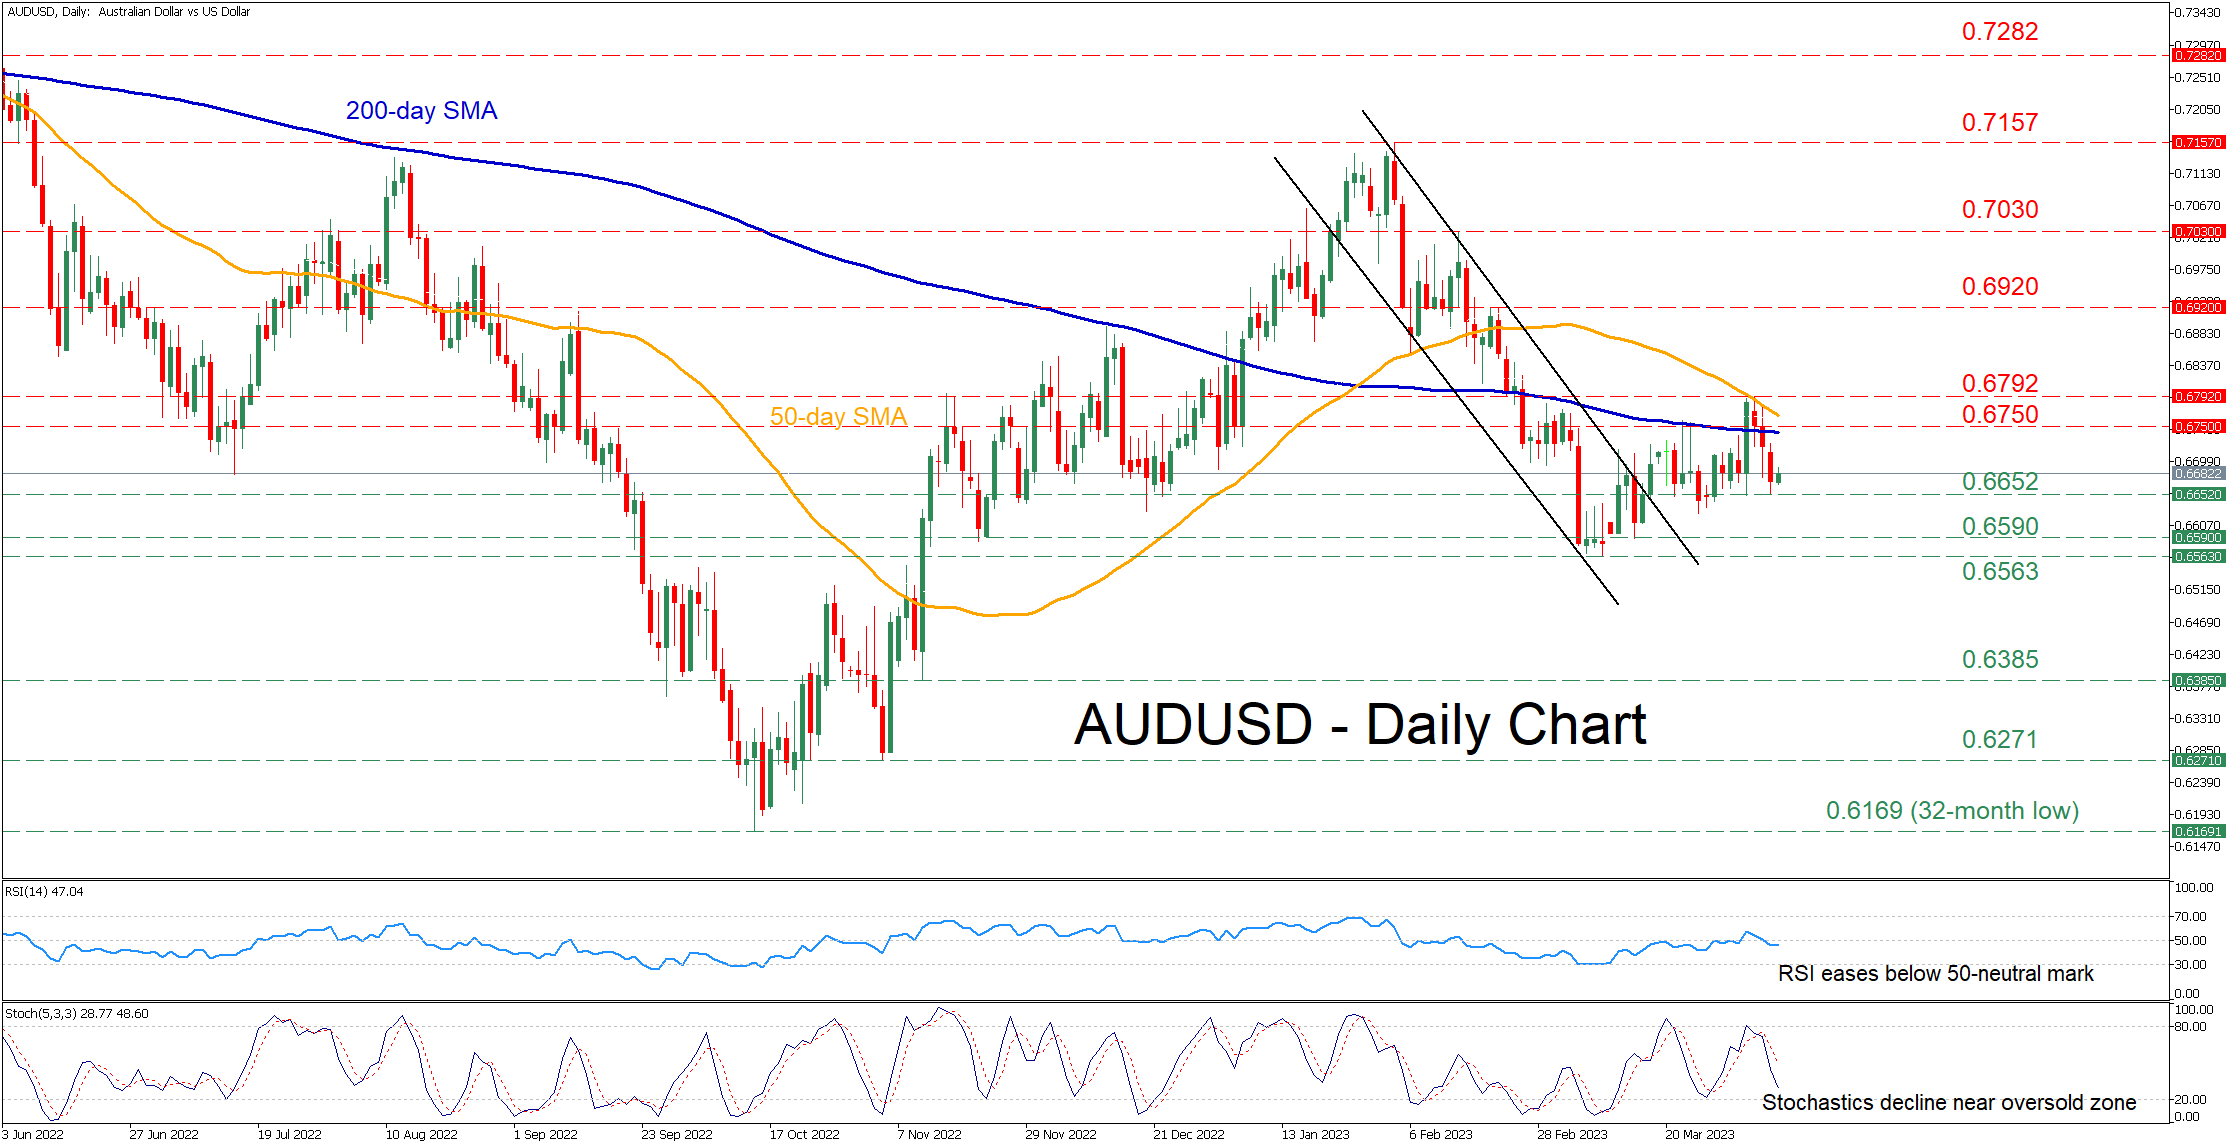
AUDUSD had been trending lower within a downward sloping channel after peaking at 0.7157 in early February. Although the pair managed to escape this bearish pattern to the upside, it has been stuck in a sideways move as initially the 200- day simple moving average (SMA) and later the 50-day SMA rejected further advances.
The momentum indicators are currently endorsing a bearish near-term bias. Specifically, the RSI dropped below its 50-neutral mark, while the stochastic oscillator is falling after posting a bearish cross. Furthermore, the descending 50-day SMA is closing the gap with the 200-day SMA, where a potential death cross could induce negative pressures.
Should the bears manage to push the price lower, initial support could be found at 0.6652. If that barricade fails, the bears might aim for 0.6590 before the 2023 bottom of 0.6563 gets tested. Even lower, the 0.6385 hurdle could provide downside protection.
Alternatively, if the price edges higher, the resistance region of 0.6750 might act as the first obstacle for buyers to clear. Surpassing that zone, the pair could challenge the recent rejection zone of 0.6792. A break above that territory may turn the spotlight to 0.6920.
Overall, AUDUSD seems to be in a neutral phase, but the technical indicators are dangerously pointing towards the bearish side. For that negative sentiment to change, the price needs to jump above both its 50- and 200-day SMAs.
GBP/USD And GBP/JPY Could Aim for Another Increase
GBP/USD started a downside correction from the 1.2520 resistance zone. GBP/JPY is rising and might aim for more upsides above the 164.00 resistance.
Important Takeaways for GBP/USD and GBP/JPY
- The British Pound failed to break above the 1.2520 resistance and corrected lower against the US Dollar.
- There is a key bearish trend line forming with resistance near 1.2460 on the hourly chart of GBP/USD.
- GBP/JPY is slowly moving higher from the 163.00 zone.
- There is a key rising channel forming with support near 163.75 on the hourly chart.
GBP/USD Technical Analysis
This past week, the British Pound formed a base above the 1.2400 line against the US Dollar. The GBP/USD pair started a steady increase above the 1.2425 resistance.
There was a move above the 50-hour simple moving average at 1.2460. It resulted in a break above the 1.2500 level. However, the bears were active near the 1.2520 resistance zone. A high was formed near 1.2525, and the pair started a downside correction.
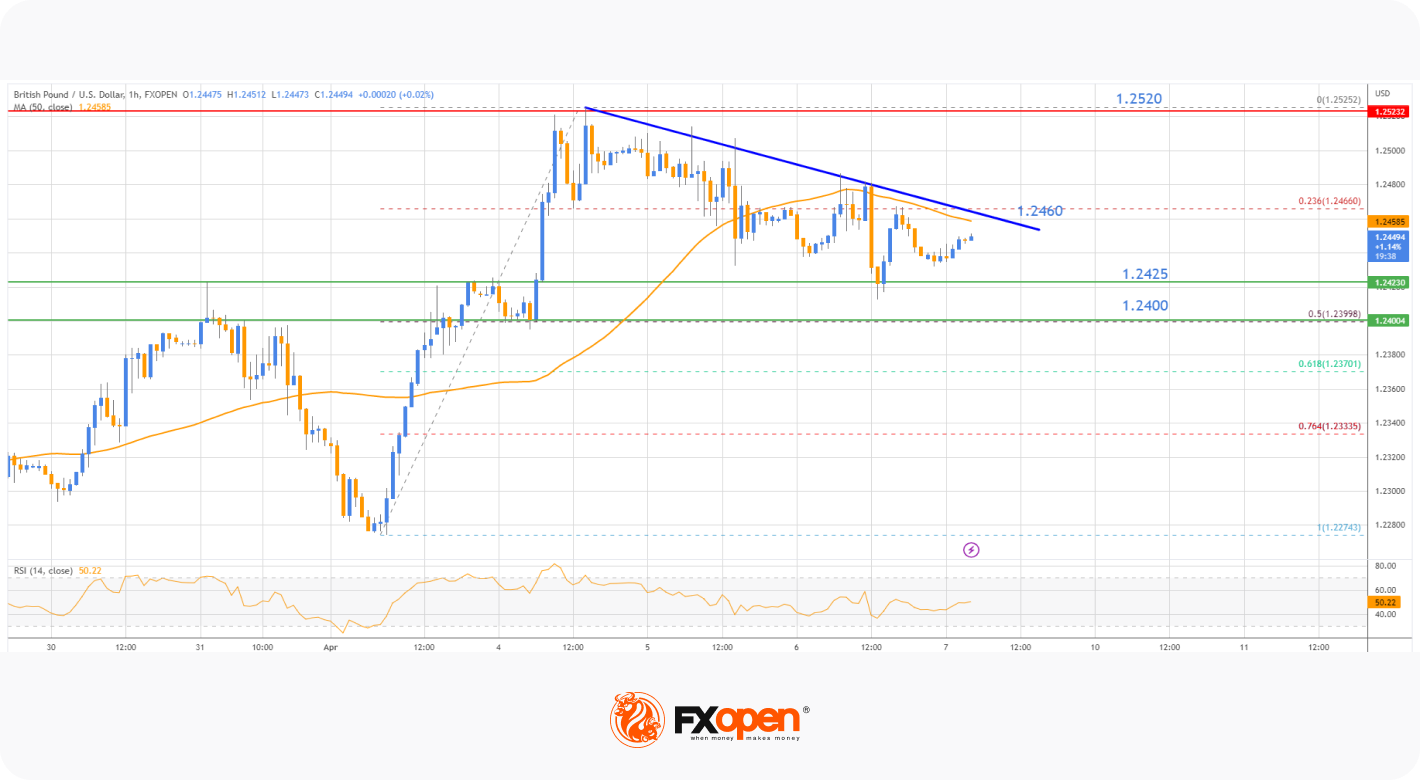
There was a break below the 23.6% Fib retracement level of the upward move from the 1.2274 swing low to the 1.2525 high. GBP/USD even settled below the 50-hour simple moving average.
The previous resistance at 1.2425 is now acting as a support. The next major support is near the 1.2400 level, which coincides with the 50% Fib retracement level of the upward move from the 1.2274 swing low to the 1.2525 high.
If there is a break below the 1.2400 support, the pair will substantially decline. In the stated case, there is a risk of a drop toward the 1.2330 level or the 1.2274 low in the coming days.
Conversely, the pair might attempt a fresh increase from the 1.2425 support. Resistance on the upside is near the 50-hour simple moving average at 1.2455. There is also a key bearish trend line forming with resistance near 1.2460 on the hourly chart of GBP/USD.
A close above the trend line resistance could stage a fresh increase. The hourly RSI is also moving higher and approaching 50, above which it might signal a decent increase. The next major resistance is near the 1.2500 level, above which the pair could revisit the 1.2520 resistance region. Any more gains might call for a move toward 1.2600.
GBP/JPY Technical Analysis
The British Pound started a fresh decline from the 166.40 zone against the Japanese Yen. The GBP/JPY pair declined below the 165.25 and 164.00 support levels.
It traded as low as 162.77, and the pair is now correcting higher. There was a move above the 163.00 pivot level. The bulls pushed the pair above the 23.6% Fib retracement level of the downward move from the 166.39 swing high to the 162.77 low.
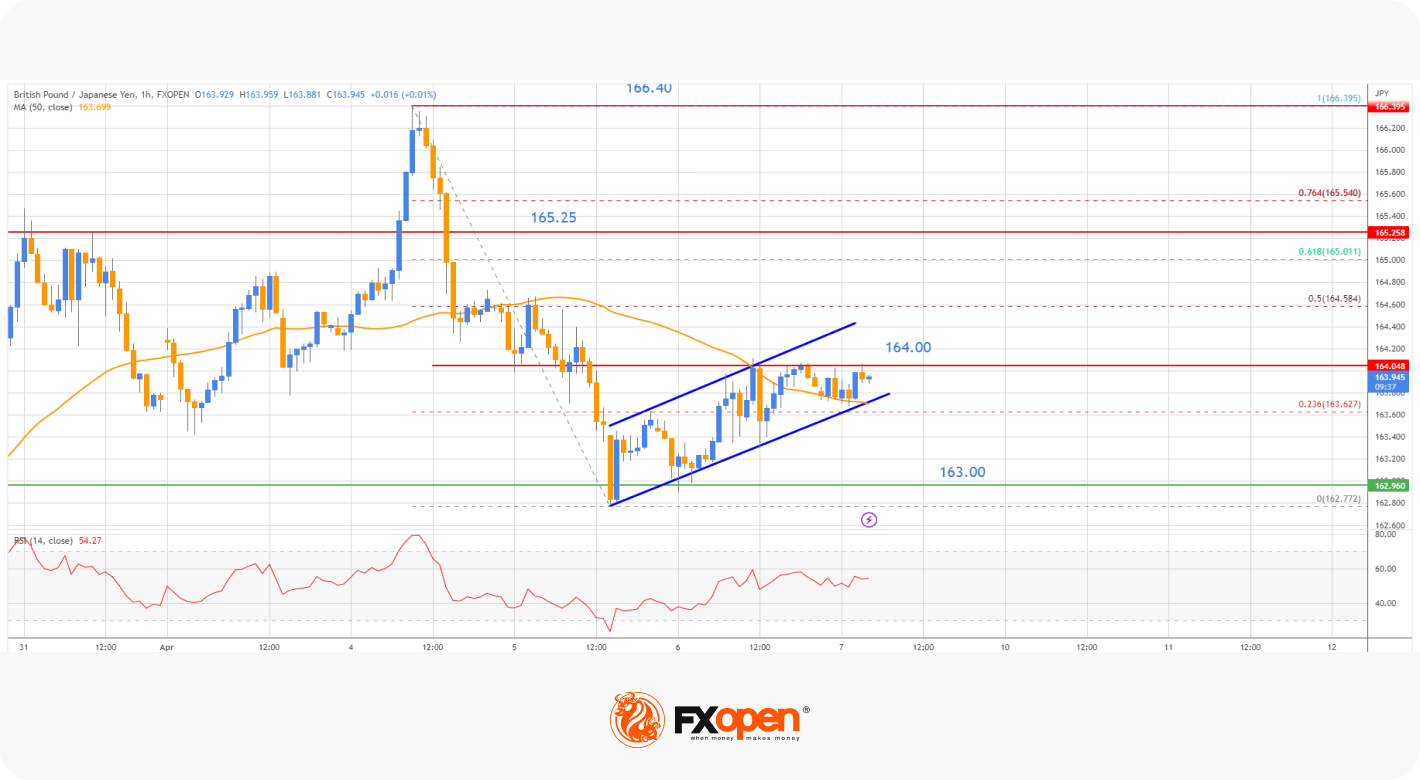
It seems to be consolidating above the 50-hour simple moving average as the hourly RSI is flat above 50. Resistance on the upside is near the 164.00 zone.
The next key resistance could be near the 50% Fib retracement level of the downward move from the 166.39 swing high to the 162.77 low at 164.60. A clear break above the 164.60 resistance could push the pair toward the 165.25 resistance.
If not, the pair might start a fresh decline. On the downside, initial support is near a key rising channel on the hourly chart at 163.75.
A downside break below the channel support could encourage the bears to push the pair further lower. The next major support is near 163.00. Any more losses might call for a test of the 162.20 support level.
GBPJPY’s Signals Warrant Some Caution
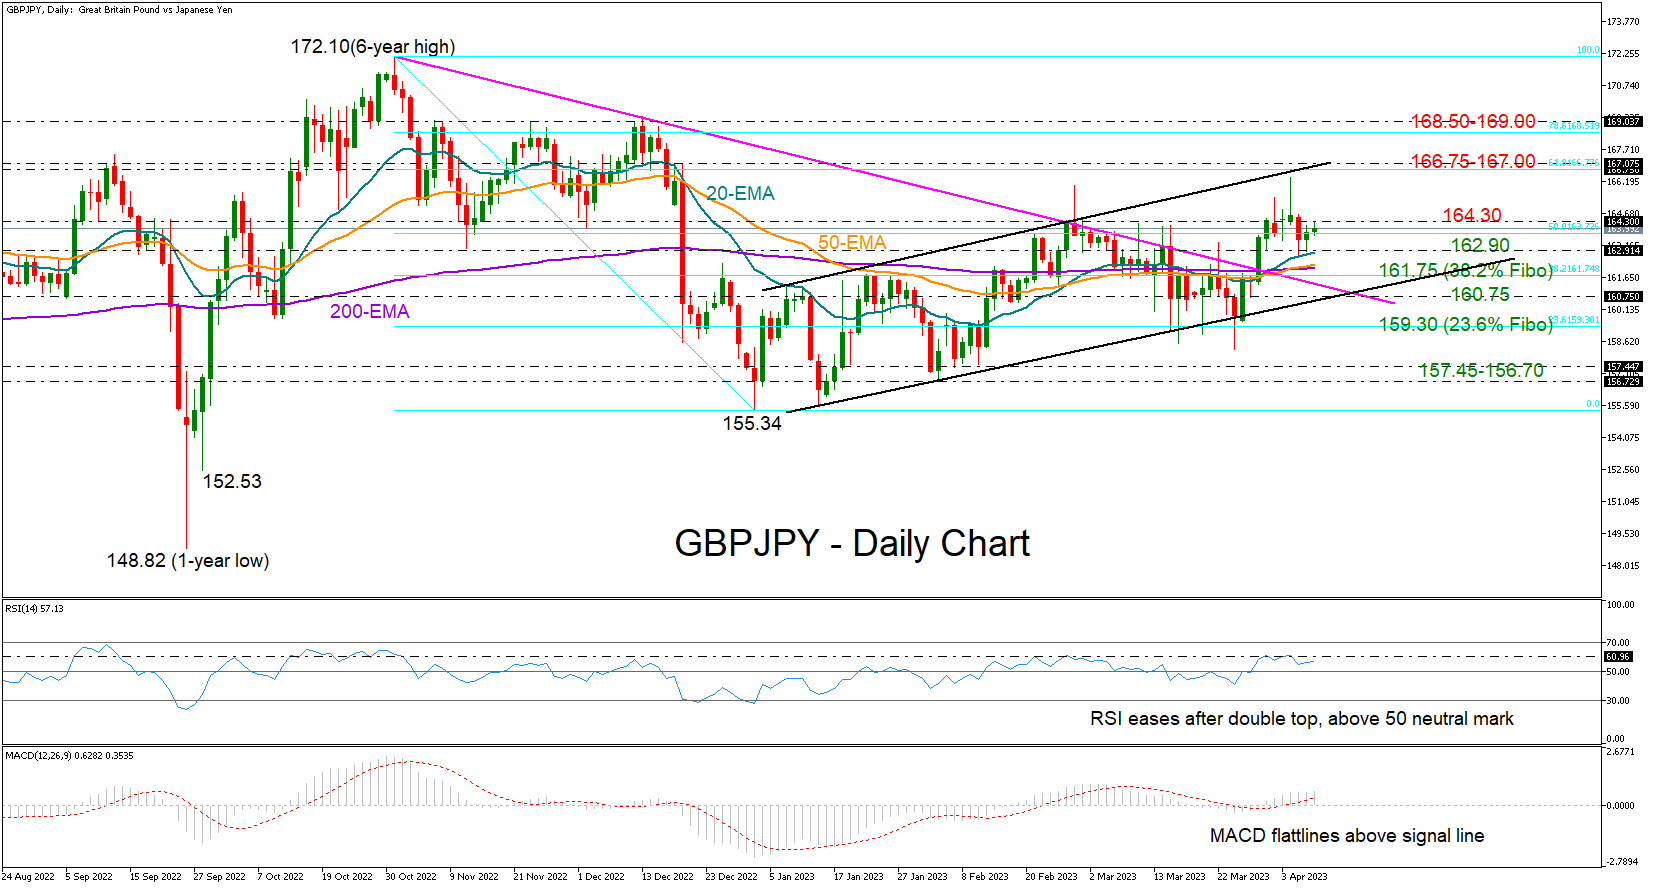
GBPJPY has been on the sidelines this week, unable to find fresh impetus to successfully climb above February’s bar of 164.30.
Despite the weekly neutral trajectory, the shooting star candlestick created on Tuesday is keeping bearish risks in sight, flagging a potential downturn. The double top pattern in the RSI is another discouraging signal, though with the indicator hovering above its 50 neutral mark and the MACD remaining elevated within the positive region, sell-side pressure could be constrained.
The 20-day exponential moving average (EMA) at 162.90 has been limiting market actions periodically since the start of the year, while not far below the 38.2% Fibonacci retracement level of the 172.10-155.34 downleg at 161.75 could be another key area to watch if selling interest grows further. Falling lower, the bears will aim for a channel breakout below 160.75. If they succeed, the door will open for the 23.6% Fibonacci level of 159.30.
Alternatively, a sustainable move above 164.30 would eliminate downside risks, shifting the attention back to the channel’s upper boundary seen between 166.75 and 167.00. Should the bulls strengthen above that threshold, the pair could advance straight up to the key resistance zone of 168.50-169.00. A decisive close higher could be a prerequisite for an extension to the 2022 peak of 172.10.
In brief. GBPJPY may stay in a cautious trading mode in the short term, unless the price overcomes the 164.30 barrier.
USD Awaits Further Catalyst
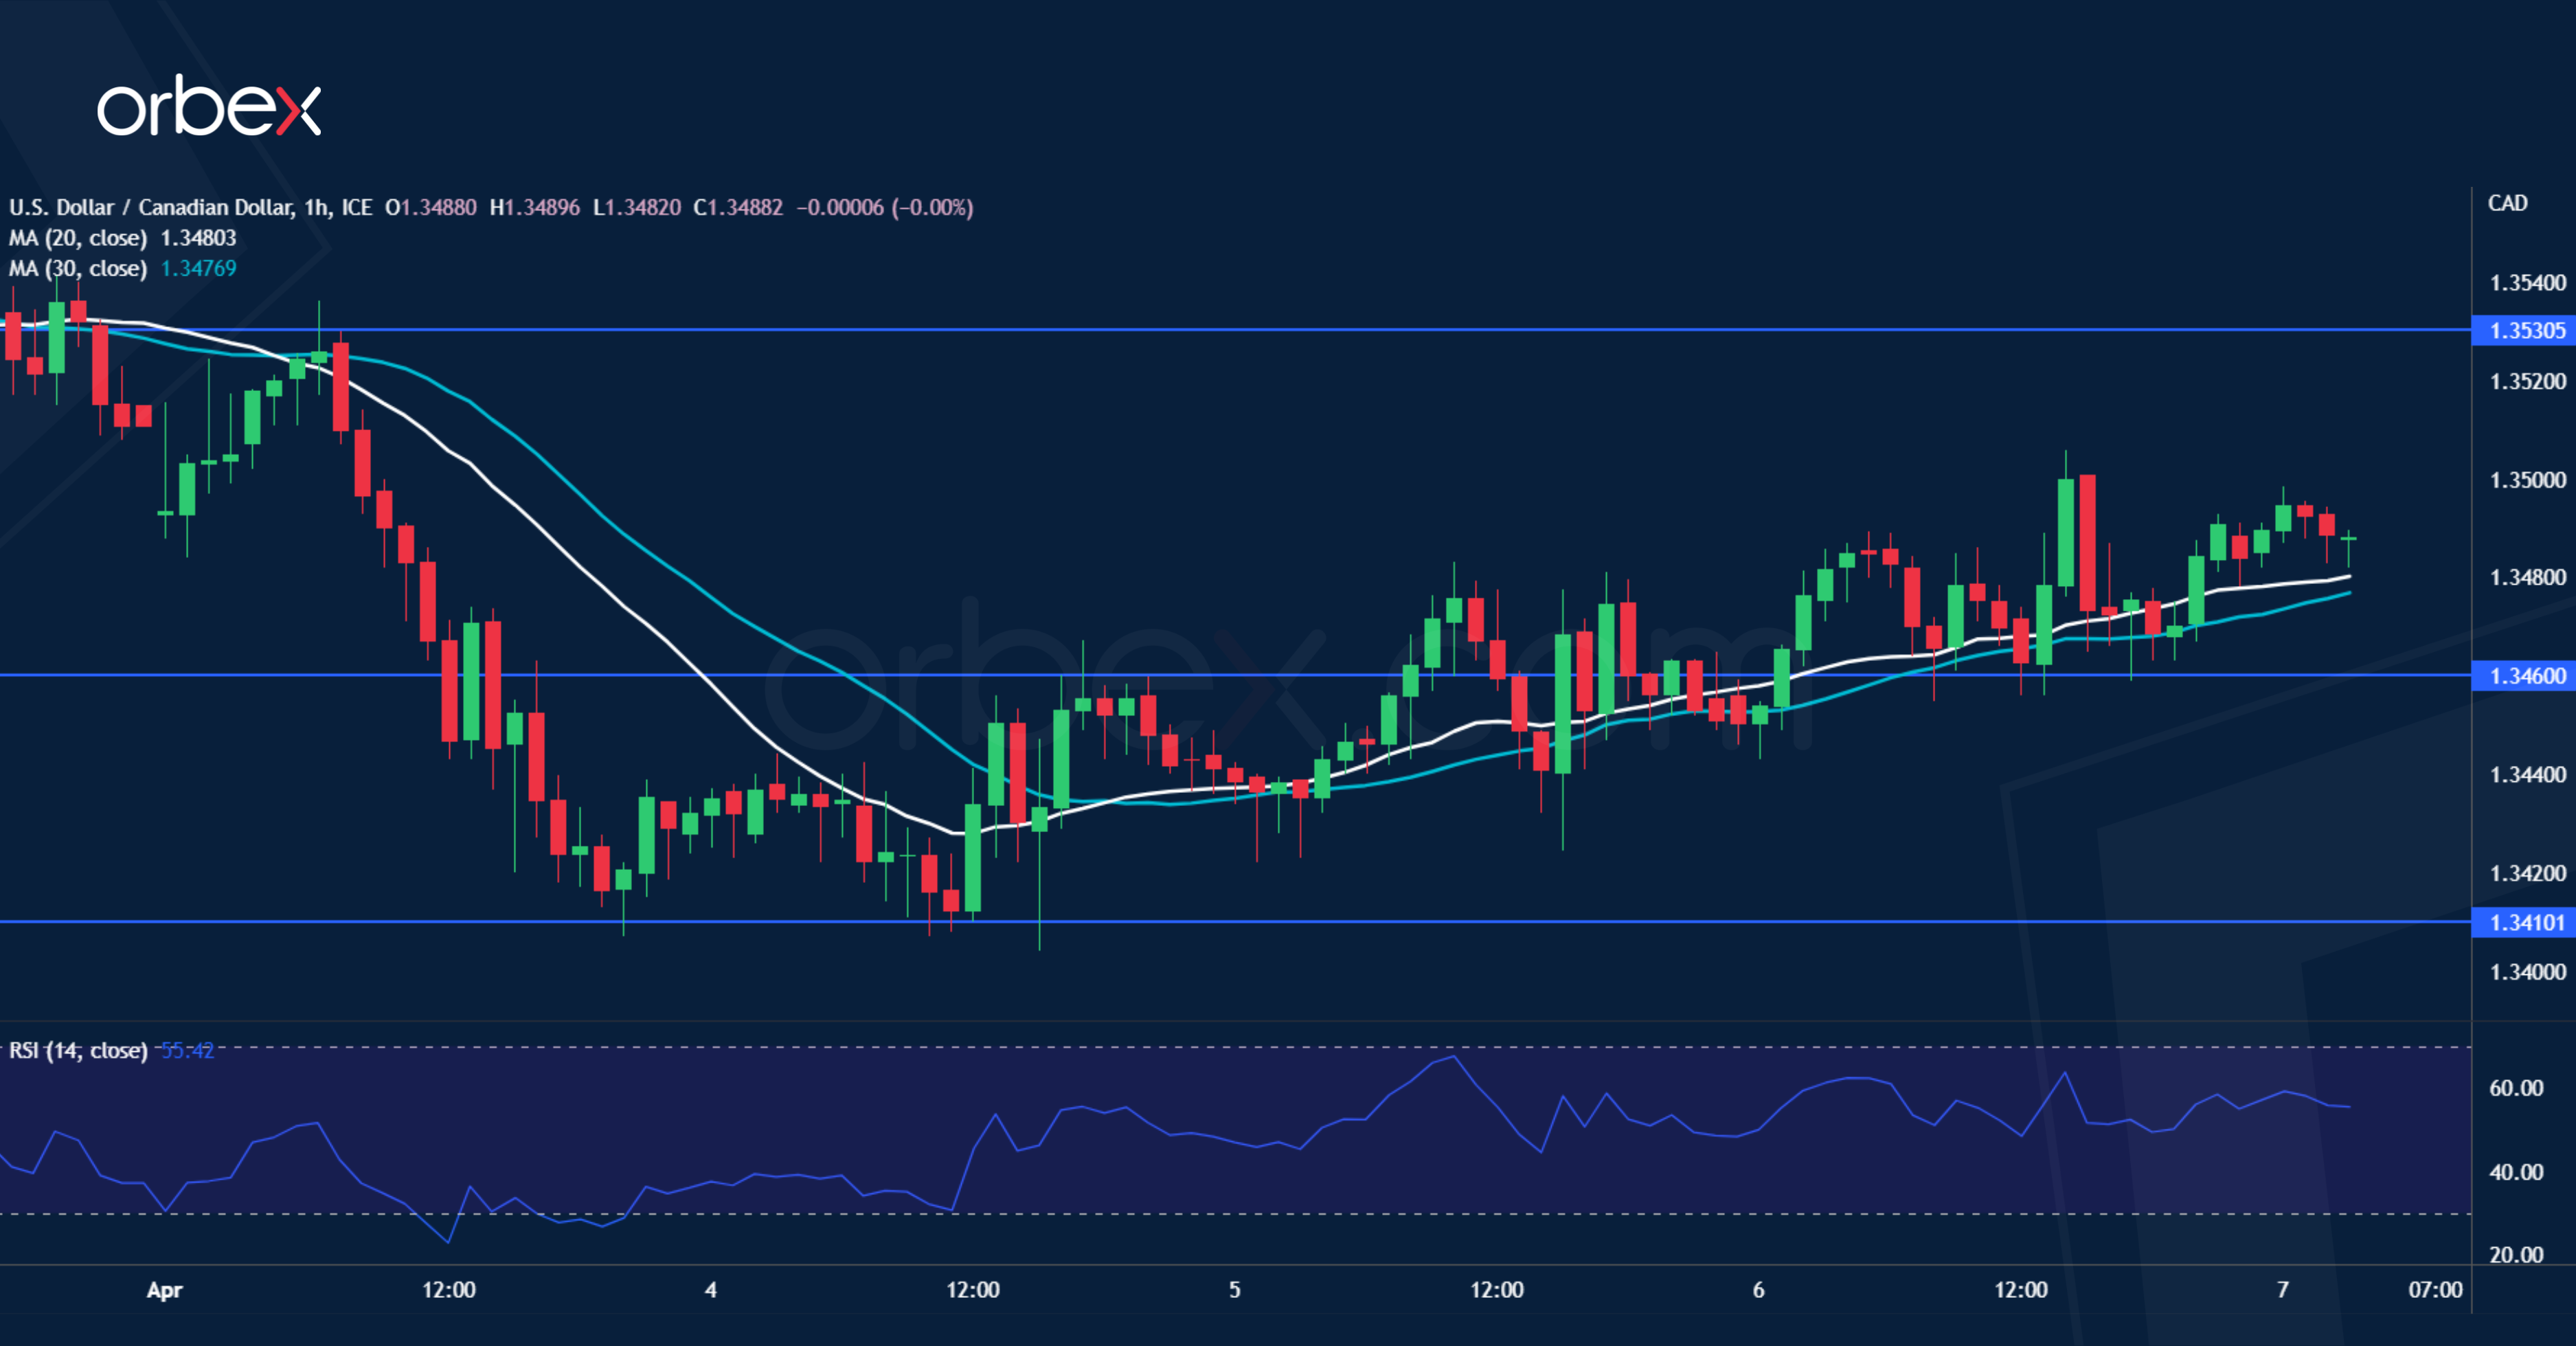
USD/CAD struggles to bounce
The Canadian dollar finds support from lower jobless rate in March. On the daily chart, the pair has found some support in the demand zone (1.3400) from the mid-February rally. A series of higher lows indicates mounting buying pressure and 1.3530 is the first obstacle ahead and a decisive breakout would shake out some sellers and give the buy side a chance to turn things around. Otherwise, a fall below 1.3460 would make the recent floor at 1.3410 vulnerable to a breach and cause a bearish reversal in the medium-term.
USD/CHF tests psychological level
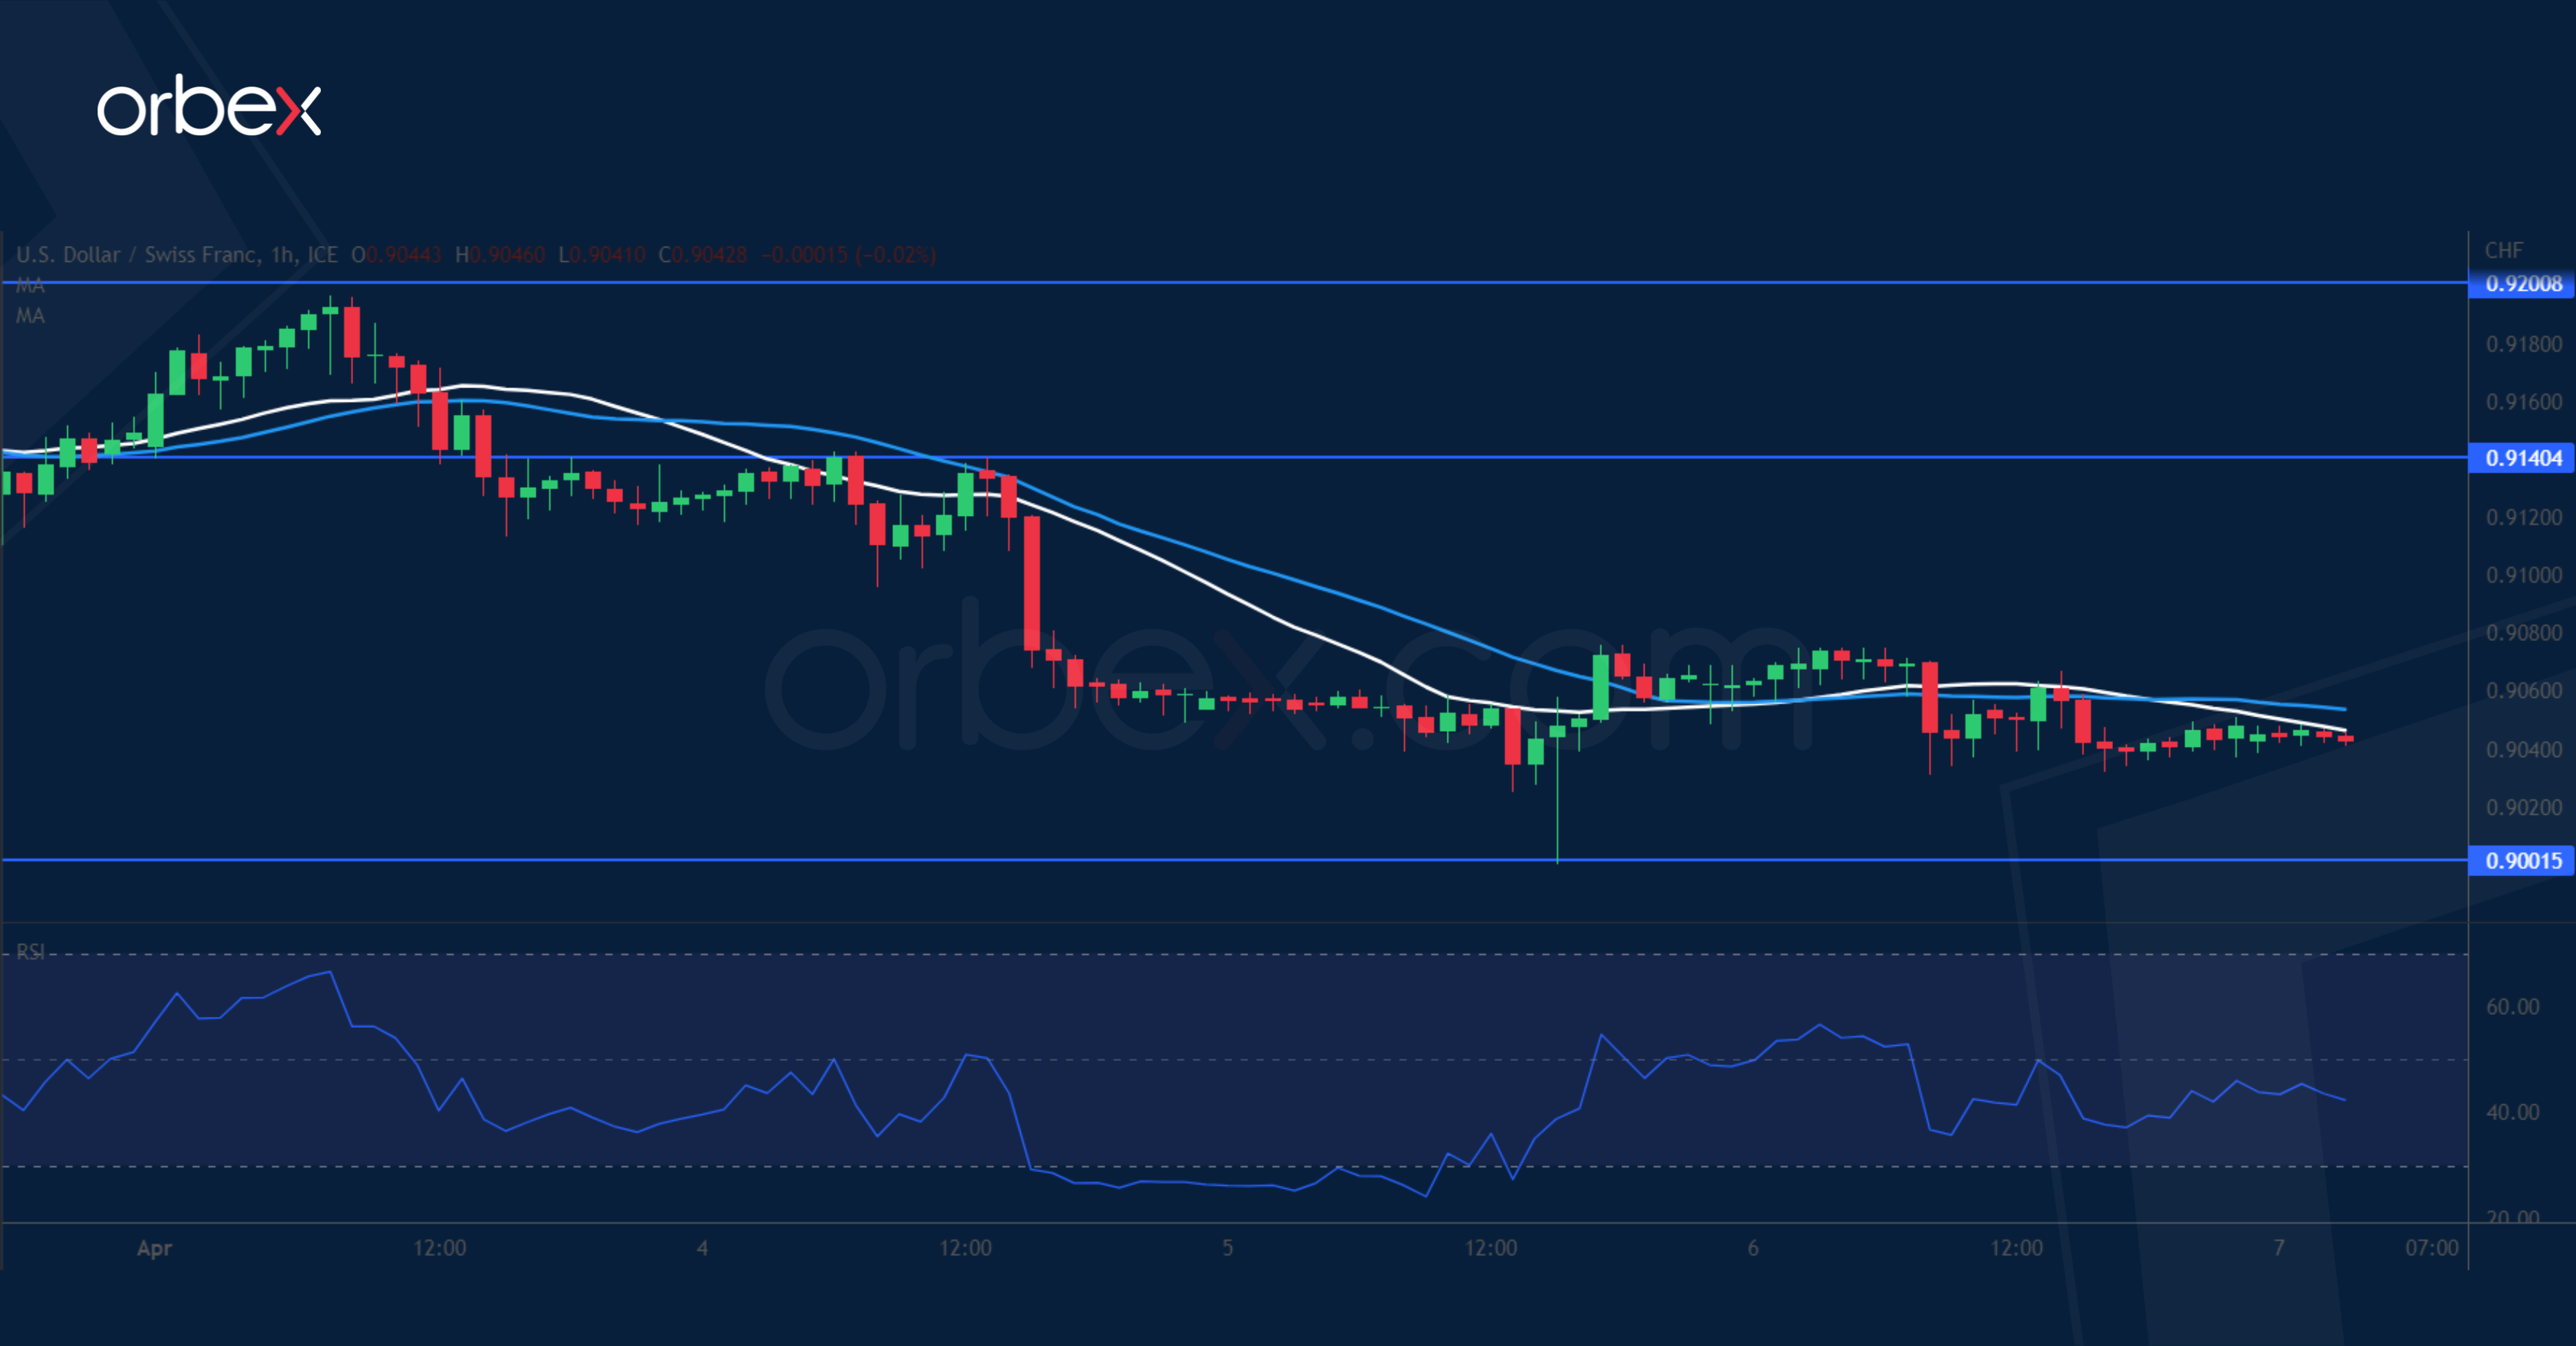
The US dollar slips as traders await the non-farm payrolls report amid Easter’s limited liquidity. A bearish MA cross and a drop below the daily support of 0.9100 suggest an acceleration to the downside. Those who bought the previous dip are looking to get out at rebounds, increasing the downward pressure. The psychological level of 0.9000 looks fragile. As the RSI recovers to the neutrality area, 0.9140 is the first level to expect strong supply and only a break above the 0.9200 area would help the greenback regain its appeal.
EUR/JPY finds support
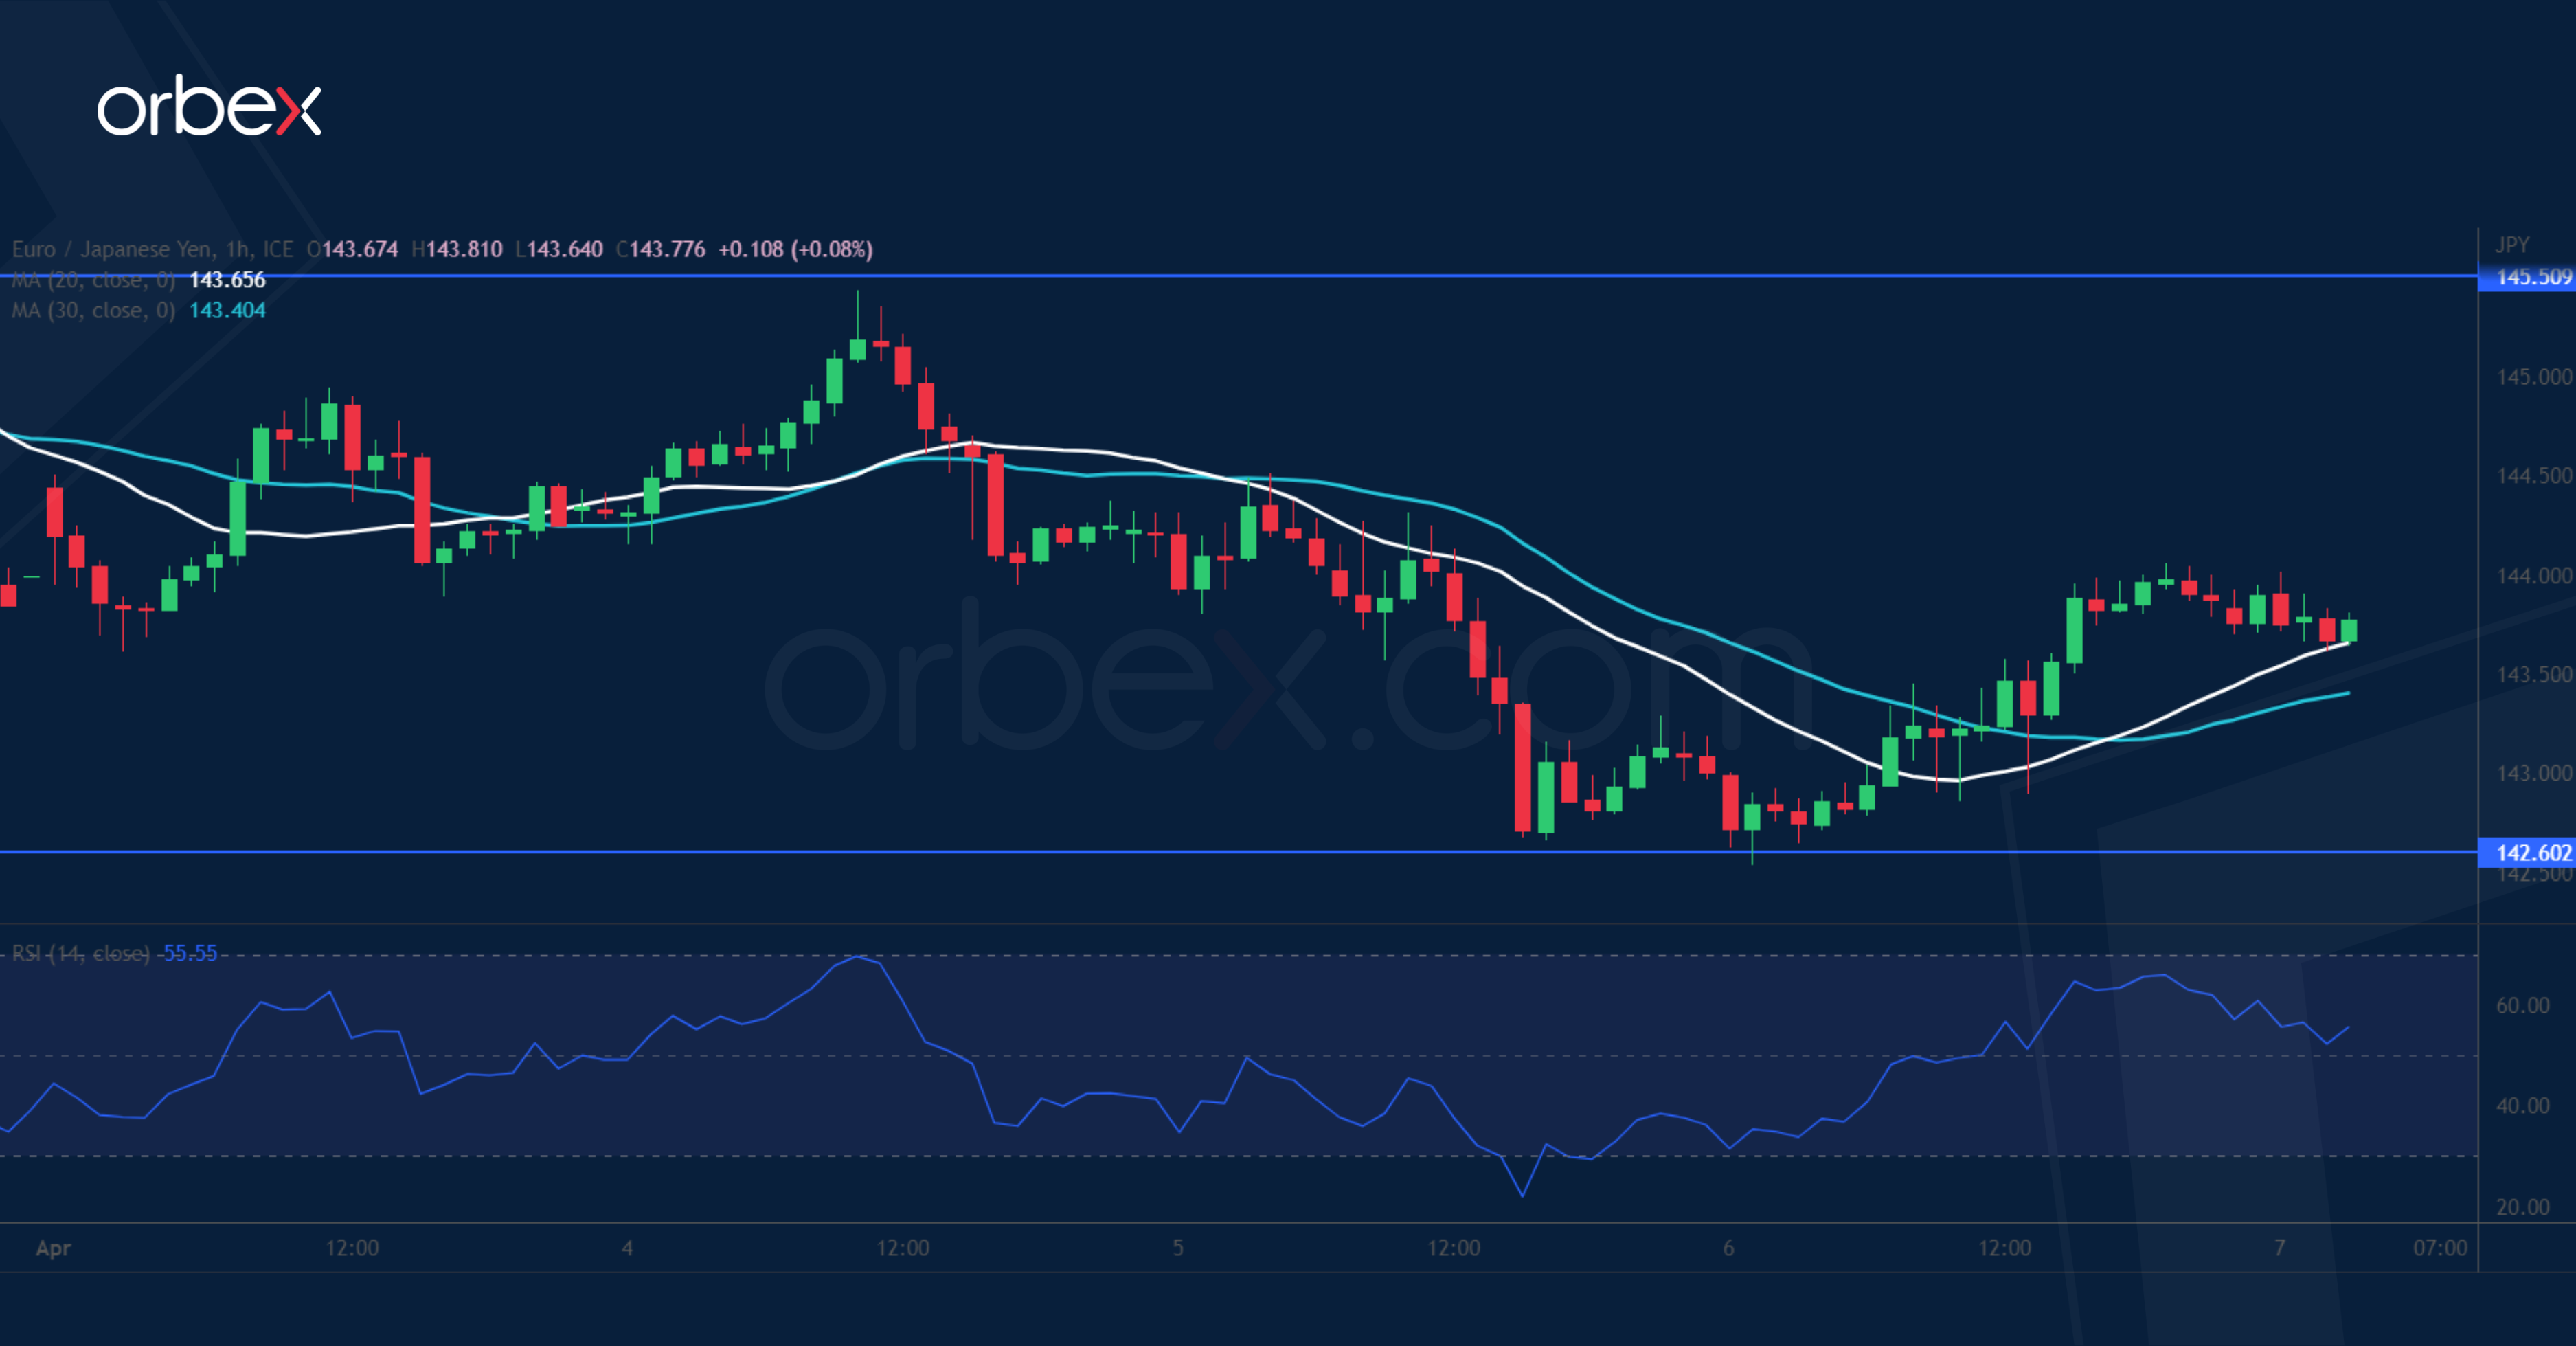
The euro rallied after the ECB’s chief economist stressed that food inflation is still rising. A tentative break above the March high of 145.50 is the first step towards a bullish extension in the medium-term. The pair is looking to hold on to its gains after lifting offers around 143.00. As the RSI bounces back into the neutral area, a rebound is starting to take shape from 142.60 in the previous supply zone. A close above 145.50 would attract momentum buying and resume the rally. 141.00 would be the bulls’ second support level.
Bank of Canada to Stay on the Sidelines
The Bank of Canada likely won’t make any change to the overnight interest rate next week. After announcing a conditional pause on interest rate hikes in January, the central bank is widely expected to make a second consecutive decision to hold. This is despite economic growth that’s been more resilient than expected so far this year. Indeed, though the January Monetary Policy Report anticipated GDP growth of 0.5%, we’re tracking it at closer to 2.5%. And labour markets remain exceptionally tight, with another 35,000 jobs created in March.
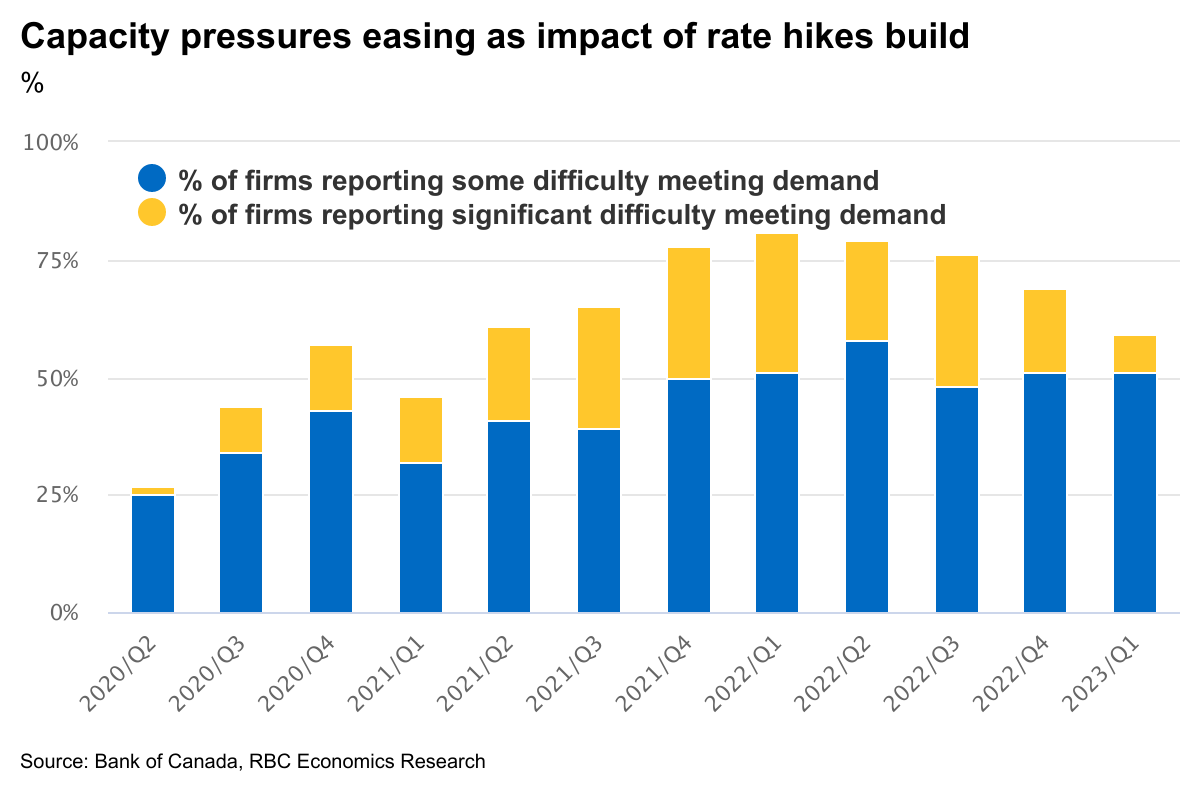
So why hold interest rates again when the economy is still running hot? The BoC’s pause on rate hiking was driven by an expectation that growth would stall through mid-2023, and Governor Macklem said it would take an “accumulation of evidence” to the contrary for it to resume tightening. We don’t think that test has been met yet, and many of the effects of last year’s aggressive increases have yet to ripple through the economy. Businesses in the central bank’s own Q1 Business Outlook Survey continued to expect slower sales growth in the year ahead. And while supply chain constraints continue to ease, concerns remain about credit and the impact of higher interest rates on customer demand. The Survey of Consumer Expectations suggests Canadians will soon cut back on spending as higher interest rates and higher costs for essential goods eat into purchasing power.
Cooler inflation readings have been encouraging—particularly since the softening has come even before the full effect of higher interest rates hits household purchasing power. And the recent round of financial instability is a reminder that aggressive interest rate increases over the last year could yet have unexpected consequences. Inflation (and the broader economy) are still running too hot for the BoC to actively consider cutting interest rates but staying on the sidelines for now looks like an easy decision to make.
Bank of Canada to stay on the sidelines
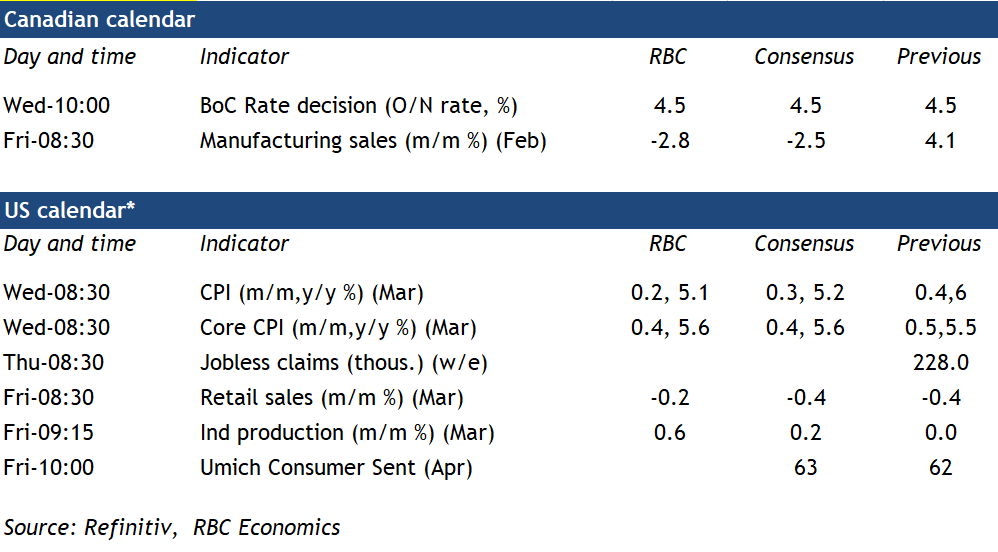
The U.S. year-over-year CPI inflation rate is expected to fall by almost a full percentage point to 5.1% in March. The pullback is largely from a drop in energy prices, although food price growth has also been edging lower in recent months. ‘Core’ (ex-food & energy) inflation has been ‘stickier’ than expected but is also expected to tick lower. Home rents have been driving a rising share of core price growth but should begin to slow going forward as softer growth in current market rents feeds through gradually to the CPI measure as leases are renewed.
Statistics Canada’s advance estimate of February manufacturing sales showed a 2.8% decline – led by lower sales in the motor vehicle, beverage and tobacco, primary metal and food industries. Lower prices (concentrated in a drop in petroleum prices) would explain about half the nominal February sales drop by our count.
U.S. retail sales likely saw a second consecutive decline in March (-0.2%), largely driven by a price-related drop in gas station sales (-4.5%) but also softer motor vehicle sales. We expect U.S industrial production to tick up 0.6% in March, thanks to a weather-related increase in utility output (7.1%) and manufacturing output (0.2%).
USD/JPY Could Drop Further, US NFP Next
Key Highlights
- USD/JPY started a fresh decline below the 132.50 support.
- It broke a key rising channel with support near 132.30 on the 4-hours chart.
- EUR/USD could rise again and clear the 1.1000 resistance.
- The US nonfarm payrolls could decline from 311K to 240K in March 2023.
USD/JPY Technical Analysis
The US Dollar struggled to clear the 133.80 resistance against the Japanese Yen. USD/JPY started a fresh decline below the 133.20 and 132.80 support levels.
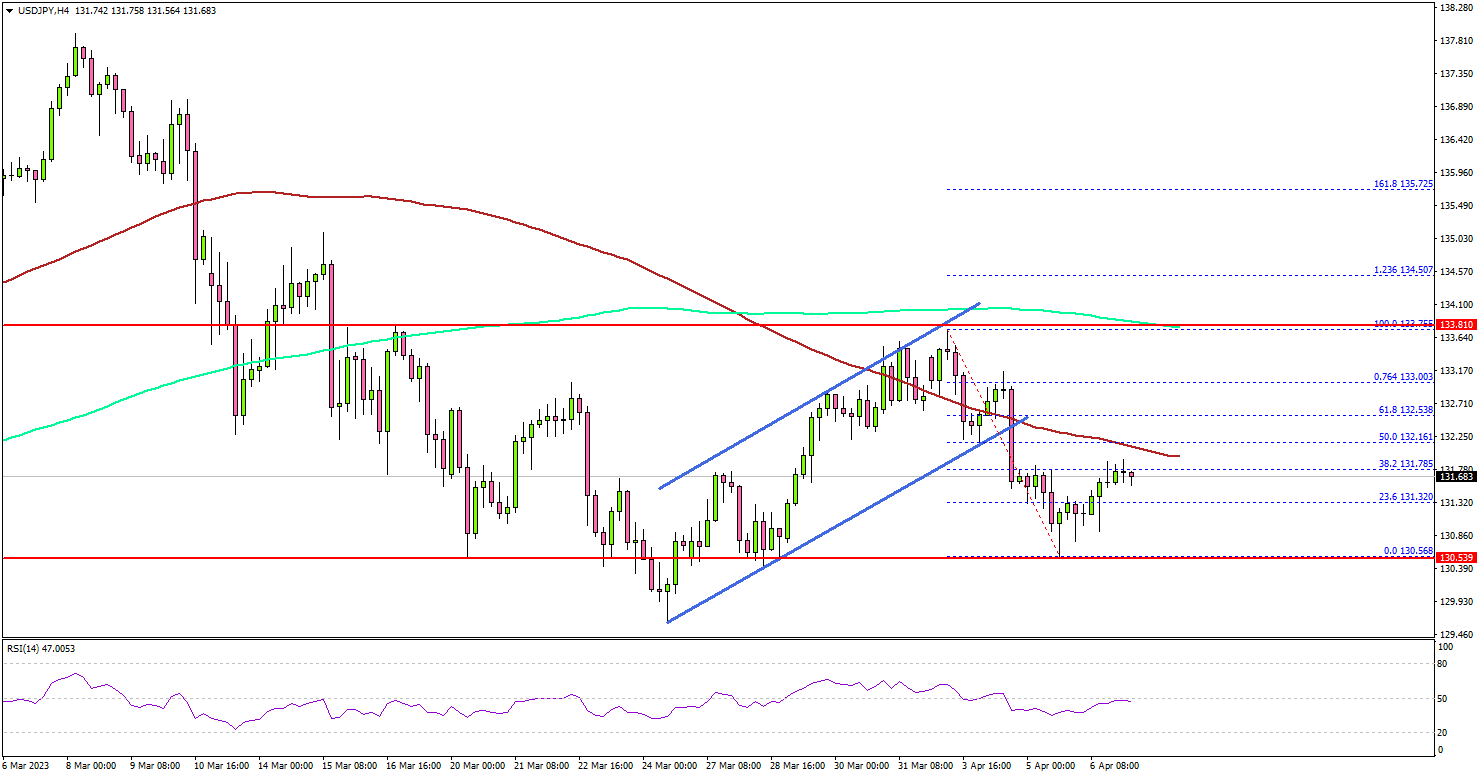
Looking at the 4-hours chart, the pair settled below the 132.50 level, the 100 simple moving average (red, 4-hours), and the 200 simple moving average (green, 4-hours).
Besides, the pair traded below a key rising channel with support near 132.30 on the same chart. It tested the 130.50 zone and started a consolidation phase. On the upside, the pair is now facing resistance near the 132.20 level.
The next key resistance is near the 132.50 zone. A clear move above the 132.50 resistance might send the pair toward the 133.20 zone. Any more gains might send the pair towards 133.80.
On the downside, immediate support is near the 130.50 level. The next major support is near the 130.00 level, below which the pair might test the 129.20 zone.
Looking at EUR/USD, the pair is gaining pace and it seems like the bulls could aim for a move above the 1.1000 resistance.
Economic Releases
- US nonfarm payrolls for March 2023 – Forecast 240K, versus 311K previous.
- US Unemployment Rate for March 2023 - Forecast 3.6%, versus 3.6% previous.
Gold (XAUUSD) Elliott Wave Bullish Sequence Favors Higher
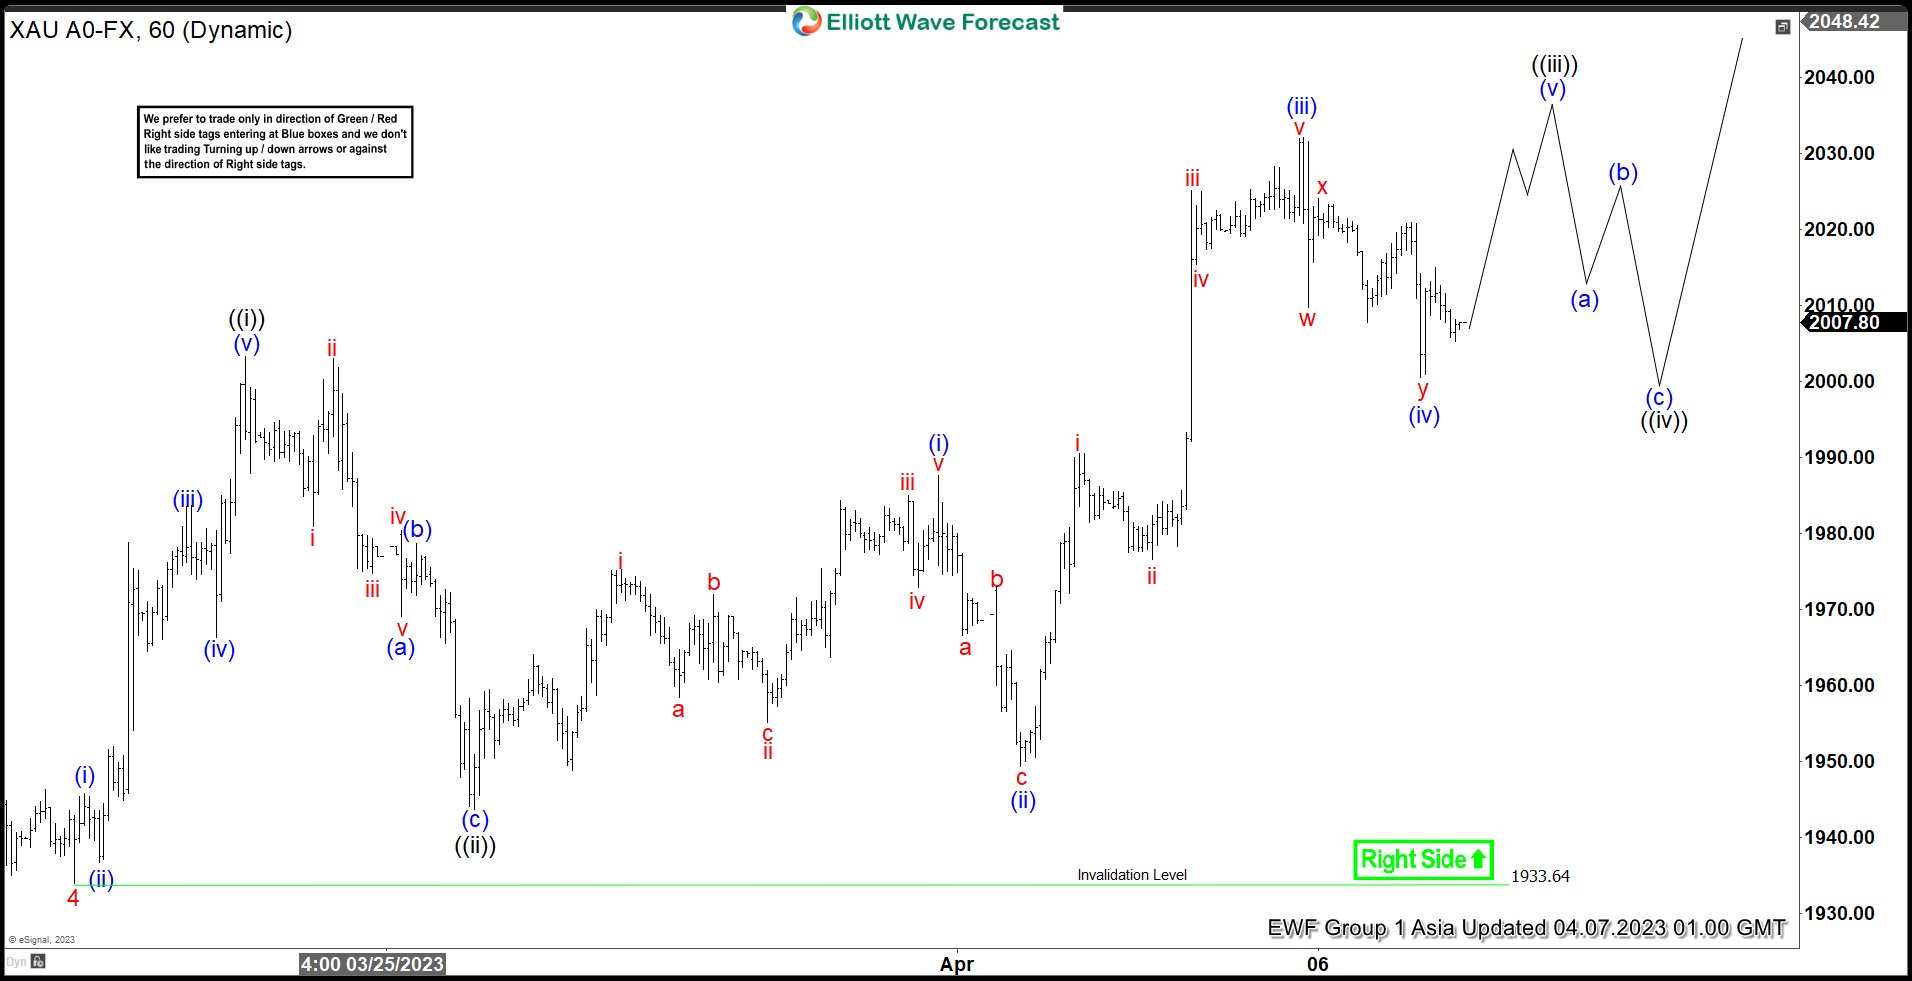
Gold (XAUUSD) broke above the previous peak on February 2, 2023 at 1959.74. It shows a bullish sequence from 9.28.2022 low favoring further upside. A 100% – 161.8% Fibonacci extension from 9.28.2022 low targets 2148 – 2360 to the upside. Near term, cycle from 2.28.2023 low is currently in progress as a 5 waves impulse Elliott Wave structure. Up from 2.28.2023 low, wave 1 ended at 1858.33 and dips in wave 2 ended at 1809. The metal extends higher again in wave 3 towards 2009.75. The 1 hour chart below shows pullback in wave 4 ended at 1933.90.
Wave 5 higher is now in progress with subdivision as another impulse in lesser degree. Up from 4, wave ((i)) ended at 2003.28 and pullback in wave ((ii)) ended at 1943.70. Up from there, wave (i) ended at 1987.57, wave (ii) ended at 1949.30. Gold then extends higher in wave (iii) towards 2032.13 and dips in wave (iv) is proposed complete at 2000.50. Expect Gold to extend higher in wave (v) to complete wave ((iii)), then it should pullback in wave ((iv)) before the rally resumes. Near term, as far as pivot at 1933.64 low stays intact, expect dips to find support in 3, 7, 11 swing for further upside.
XAUUSD 60 Minute Elliott Wave Chart
Gold (XAUUSD) Elliott Wave Video
https://www.youtube.com/watch?v=4MeUZyaAbiQ