Sample Category Title
BoE Bailey: Interest rates will go up further if inflation got embedded
In a interview with BBC, BoE Governor Andrew Bailey emphasized that the central bank expects inflation to decline sharply this year as the impact of last year's steep energy price increases drops from year-on-year price comparisons. He expressed relief that inflation had stabilized and noted some "encouraging signs" of progress. However, he urged continued vigilance, stating, "we have to be extremely vigilant on that front."
Bailey also issued a warning to businesses setting prices, cautioning that "if we get inflation embedded, interest rates will have to go up further." While acknowledging that companies must set prices according to the costs they face, he urged them to remember the anticipated decrease in inflation this year when setting prices: "we do expect inflation to come down sharply this year and I would just say please bear that in mind."
GBP/JPY Daily Outlook
Daily Pivots: (S1) 159.85; (P) 160.86; (R1) 161.77; More...
Immediate focus in now on 158.54 support in GBP/JPY with today's decline. Current development suggests that fall from 165.99 is a falling leg of the whole decline from 172.11. Deeper decline is expected as long as 164.12 resistance holds. Break of 158.54 will target a retest on 155.33 low. However, break of 164.12 resistance will bring stronger rise back to 165.99 resistance.
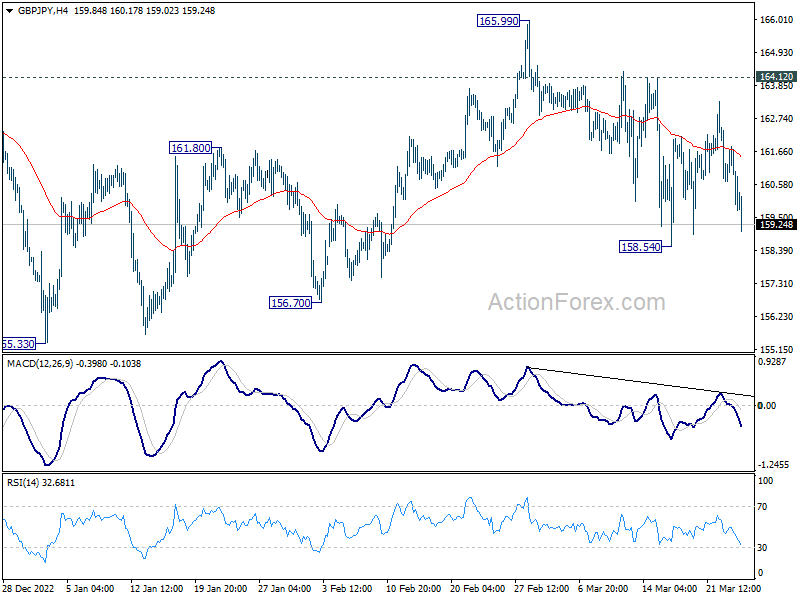
In the bigger picture, as long as 38.2% retracement of 123.94 (2020 low) to 172.11 (2022 high) at 153.70 holds, medium term bullishness is retained. That is, larger up trend from 123.94 (2020 low) is still in progress. Break of 172.11 high to resume such up trend is expected at a later stage.
EUR/JPY Daily Outlook
Daily Pivots: (S1) 140.87; (P) 142.04; (R1) 142.91; More....
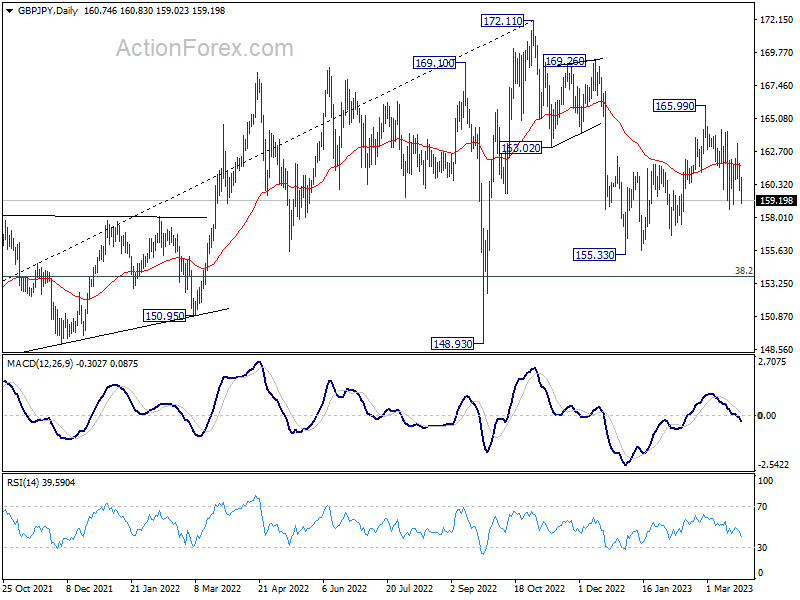
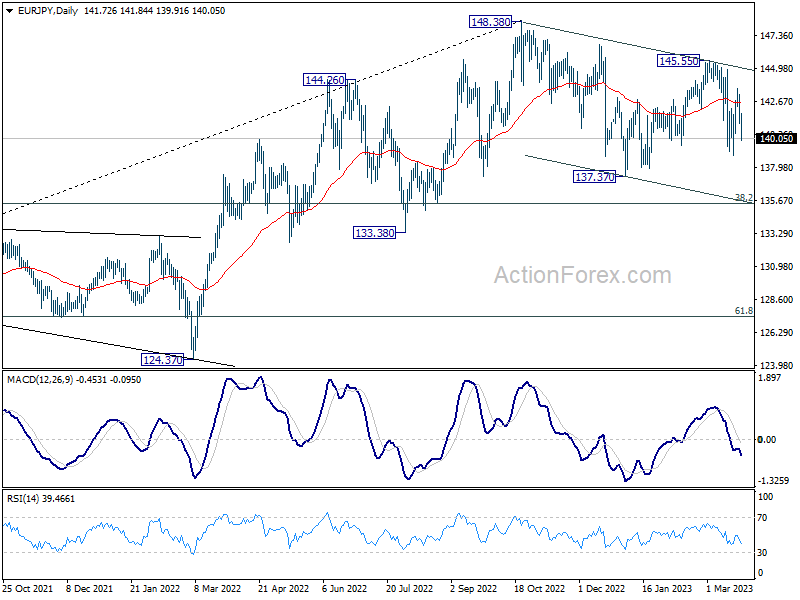
EUR/JPY's current downside acceleration argues that rebound from 138.81 has completed at 143.61 already. Intraday bias is back on the downside for 138.81 support first. Break there will suggest that whole corrective pattern from 148.38 is resuming for 137.37 support and below. On the upside, above 141.82 minor resistance will turn intraday bias again.
In the bigger picture, as long as 55 week EMA (now at 139.54) holds, larger up trend from 114.42 (2020 low) is still in progress for 149.76 long term resistance. However, firm break of 55 week EMA will bring deeper fall to 38.2% retracement of 114.42 to 148.38 at 135.40. Sustained break there will raise the chance of trend reversal, and target 61.8% retracement at 127.39.
EUR/GBP Daily Outlook
Daily Pivots: (S1) 0.8799; (P) 0.8832; (R1) 0.8850; More...
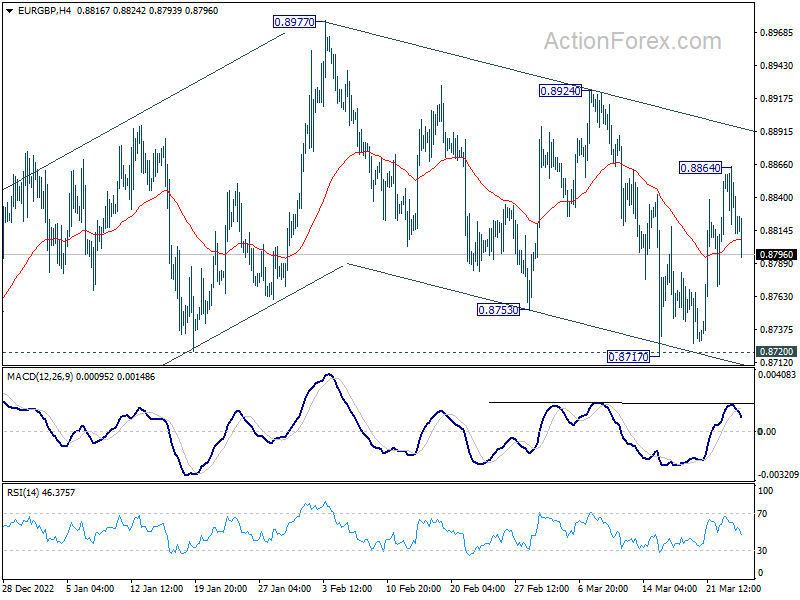
Intraday bias in EUR/GBP is turned neutral again as it retreated after hitting 0.8864. Overall outlook remains bullish as long as 0.8270 support holds. Above 0.8864 will target 0.8924 resistance first. Firm break there should resume larger rise from 0.8545 through 0.8977 high.
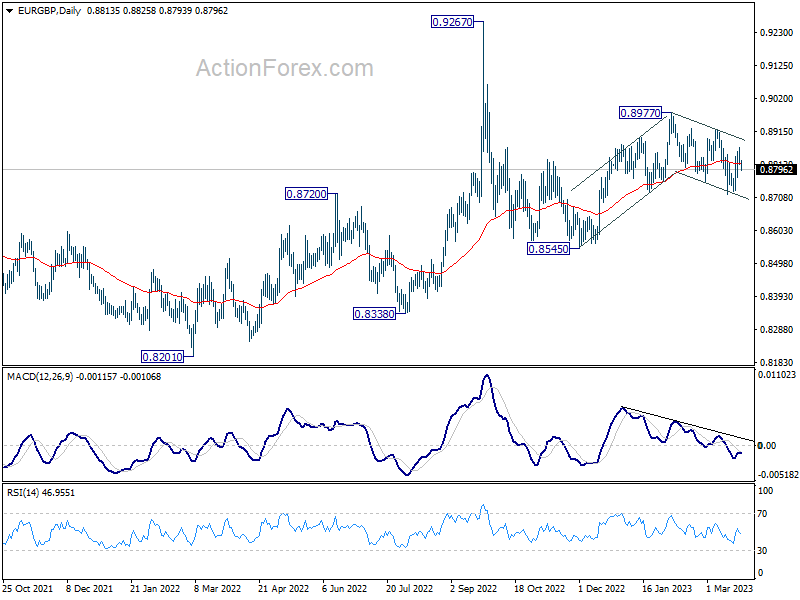
In the bigger picture, outlook is rather mixed for now, except that price actions from 0.9267 (2022 high) are part of the long term range pattern from 0.9499 (2020 high). With 0.8720 support intact, rise from 0.8545 is in favor to continue through 0.8977. However, firm break of 0.8720 will argue that such rebound has completed, and open up deeper fall through this support level.
EUR/AUD Daily Outlook
Daily Pivots: (S1) 1.6162; (P) 1.6209; (R1) 1.6249; More...
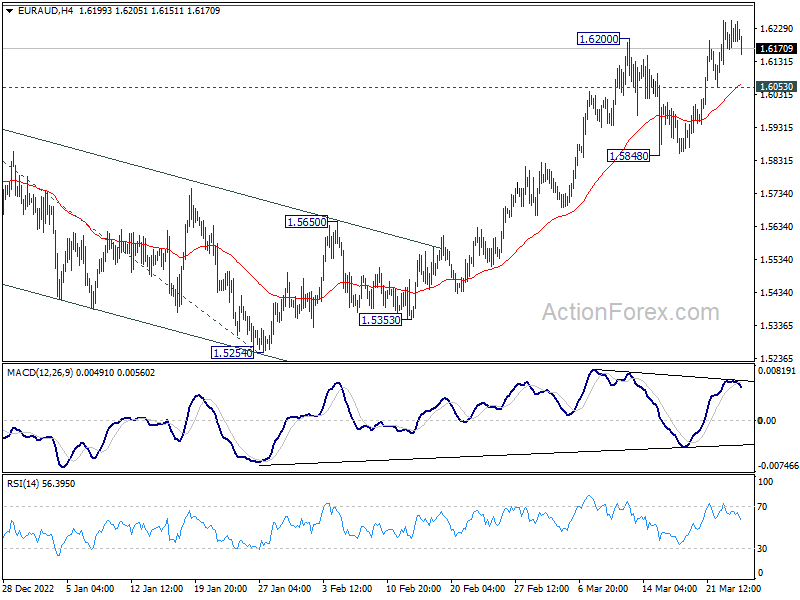
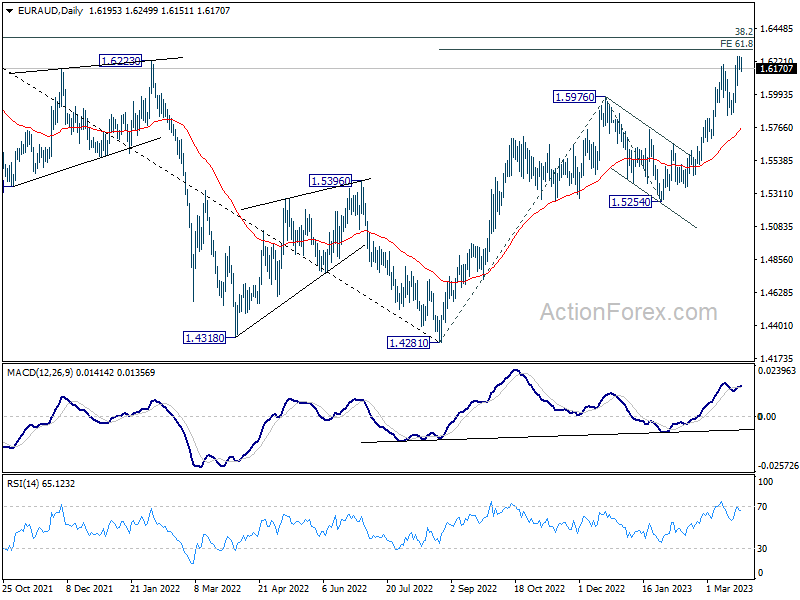
Intraday bias in EUR/AUD is turned neutral again with current retreat. Further rally is expected as long as 1.6053 support holds, for 61.8% projection of 1.4281 to 1.5976 from 1.5254 at 1.6302. Firm break there will resume larger rally from 1.4281 to 1.6389 fibonacci level. However, firm break of 1.6053 will indicate rejection by 1.6302 and turn bias back to the downside for 1.5848 support.
In the bigger picture, the strong support from 55 week EMA (now at 1.5404) is raising the chance of bullish trend reversal. Focus is now on 1.6434 cluster resistance (38.2% retracement of 1.9799 to 1.4281 at 1.6389). Sustained break there should confirm that whole down trend from 1.9799 (2020 high) has completed. Further rally should then be seen to 61.8% retracement at 1.7691. However, rejection by this cluster resistance will make medium term outlook neutral at best.
EUR/CHF Daily Outlook
Daily Pivots: (S1) 0.9900; (P) 0.9949; (R1) 0.9978; More...
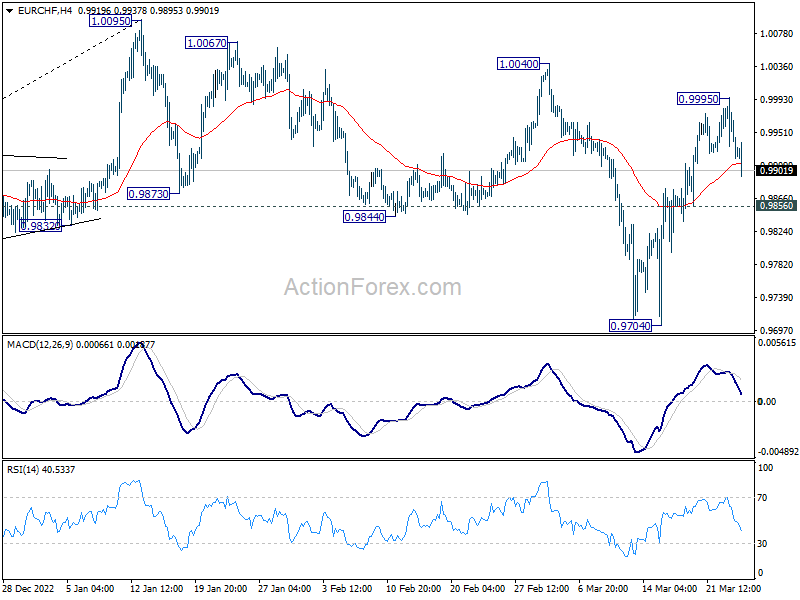
Intraday bias in EUR/CHF remains neutral for the moment. Outlook is unchanged that corrective decline from 1.0095 should have completed at 0.9704. Further rally is in favor as long as 0.9856 minor support holds. Above 0.9995 will target 1.0040 and then 1.0095. However, firm break of 0.9856 will dampen this bullish view and turn bias back to the downside for 0.9704 support instead.
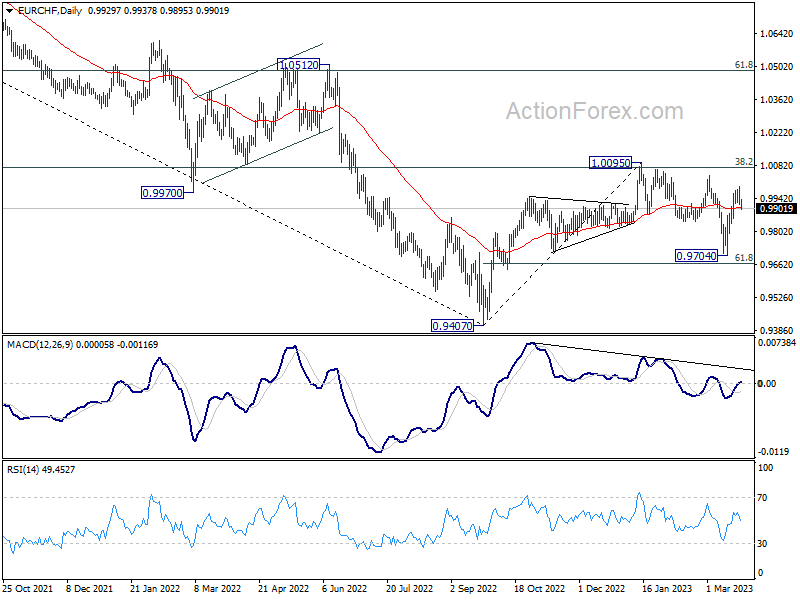
In the bigger picture, prior rejection by 55 week EMA (now at 1.0011) and 38.2% retracement of 1.1149 to 0.9407 at 1.0072 suggests that medium term outlook is staying bearish. That is, down trend from 1.2004 is not completed yet and is in favor to resume through 0.9407 at a later stage. However, decisive break of 1.0095 resistance will raise the chance of bullish trend reversal. Rise from 0.9407 should then target 1.0505 cluster resistance (2020 low at 1.0505, 61.8% retracement of 1.1149 to 0.9407 at 1.1484).
Ethereum Ended The Wave 4 Pullback At Blue Box Area
In this technical blog, we will look at the past performance of the 1-hour Elliott Wave Charts of Ethereum. We presented to members at the elliottwave-forecast. In which, the rally from 10 March 2023 low unfolded as an impulse structure. And showed a higher high sequence favored more upside extension to take place. Therefore, we advised members not to sell the pair & buy the dips in 3, 7, or 11 swings at the blue box areas. We will explain the structure & forecast below:
Ethereum 1-Hour Elliott Wave Chart From 3.22.2023
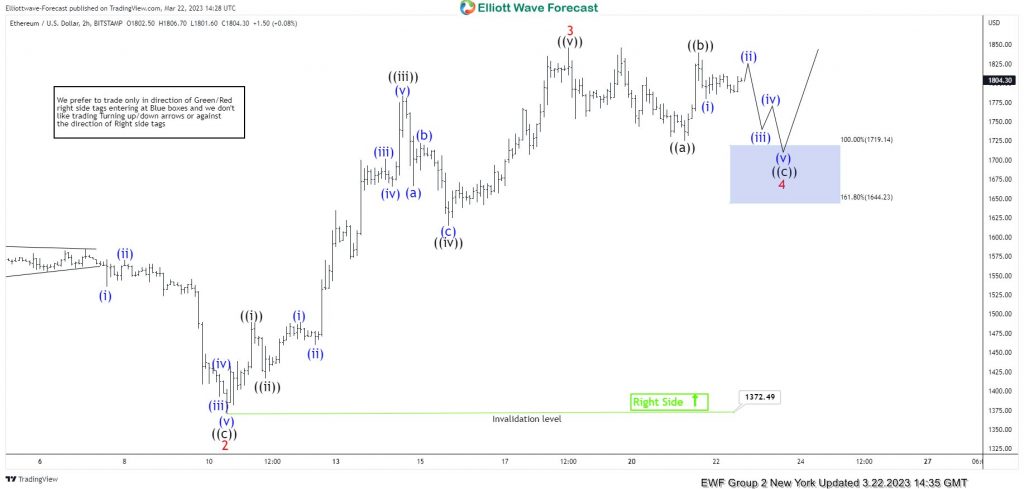
Here’s 1 hr Elliott wave chart from the 3/22/2023 New York update. In which, the cycle from the 3/10/2023 low ended in wave 3 as an impulse structure at $1846 high. Down from there, the pair made a pullback in wave 4 to correct that cycle. The internals of that pullback unfolded as a zigzag structure where wave ((a)) at $1725 low. Wave ((b)) ended at $1839.90 high and wave ((c)) managed to reach the blue box area at $1719.14- $1644.23 area. From there, buyers were expected to appear looking for the next leg higher or for a 3-wave bounce minimum.
Ethereum 1 Hour Latest Elliott Wave Chart From 3.24.2023
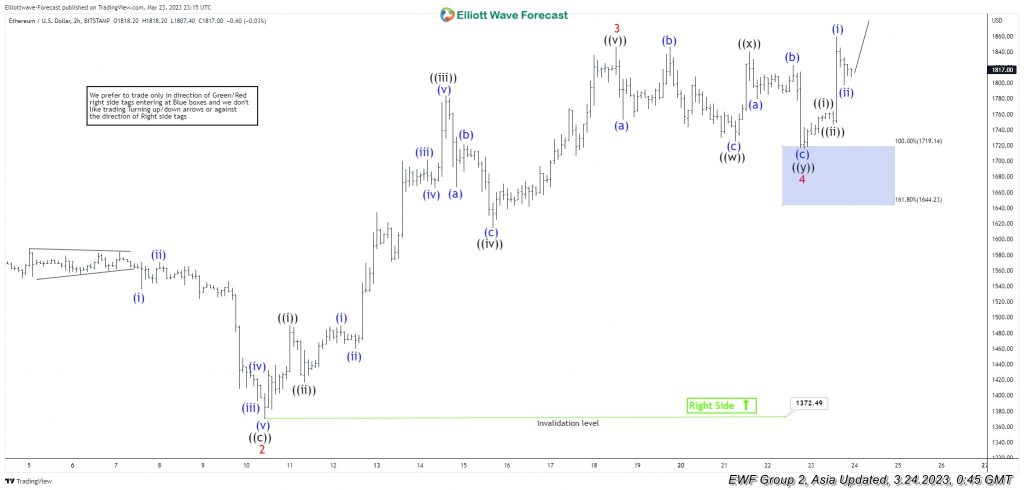
This is the latest 1 hr Elliott wave Chart from the 3/24/2023 update. In which the pair is showing a strong reaction higher taking place, right after ending the pullback within the blue box area. Allowed members to create a risk-free position shortly after taking the long position at the blue box area.
USDCAD Looks for Recovery After Peaking at 1.3860
USDCAD has been consolidating losses since the day it surged to 1.3860 and holds near the 20-day simple moving average (SMA).
The momentum indicators, though, are currently suggesting that the sell-off may have found a bottom and the pair may be pushing for some recovery. The RSI and the Stochastics are pointing up, with the former standing in the positive region and the second one posting a bullish crossover between its %K and %D lines.
A closing price above 1.3860 could boost buying interest and confirm additional gains towards the 1.3975 resistance, taken from the peak in October 2022.
In the event of a pullback below 1.3640, the bears may push harder to clear the 50-day SMA, which stands around the 1.3520 support level and head for the 200-day SMA at 1.3360. Any movements beneath this line could endorse the negative structure.
In brief, USDCAD seems to be searching for a recovery, though only a closing price above the 1.3860 territory would convince that the worst has passed, at least in the medium-term.

USD Remains Under Pressure
GBP/USD tests supply area
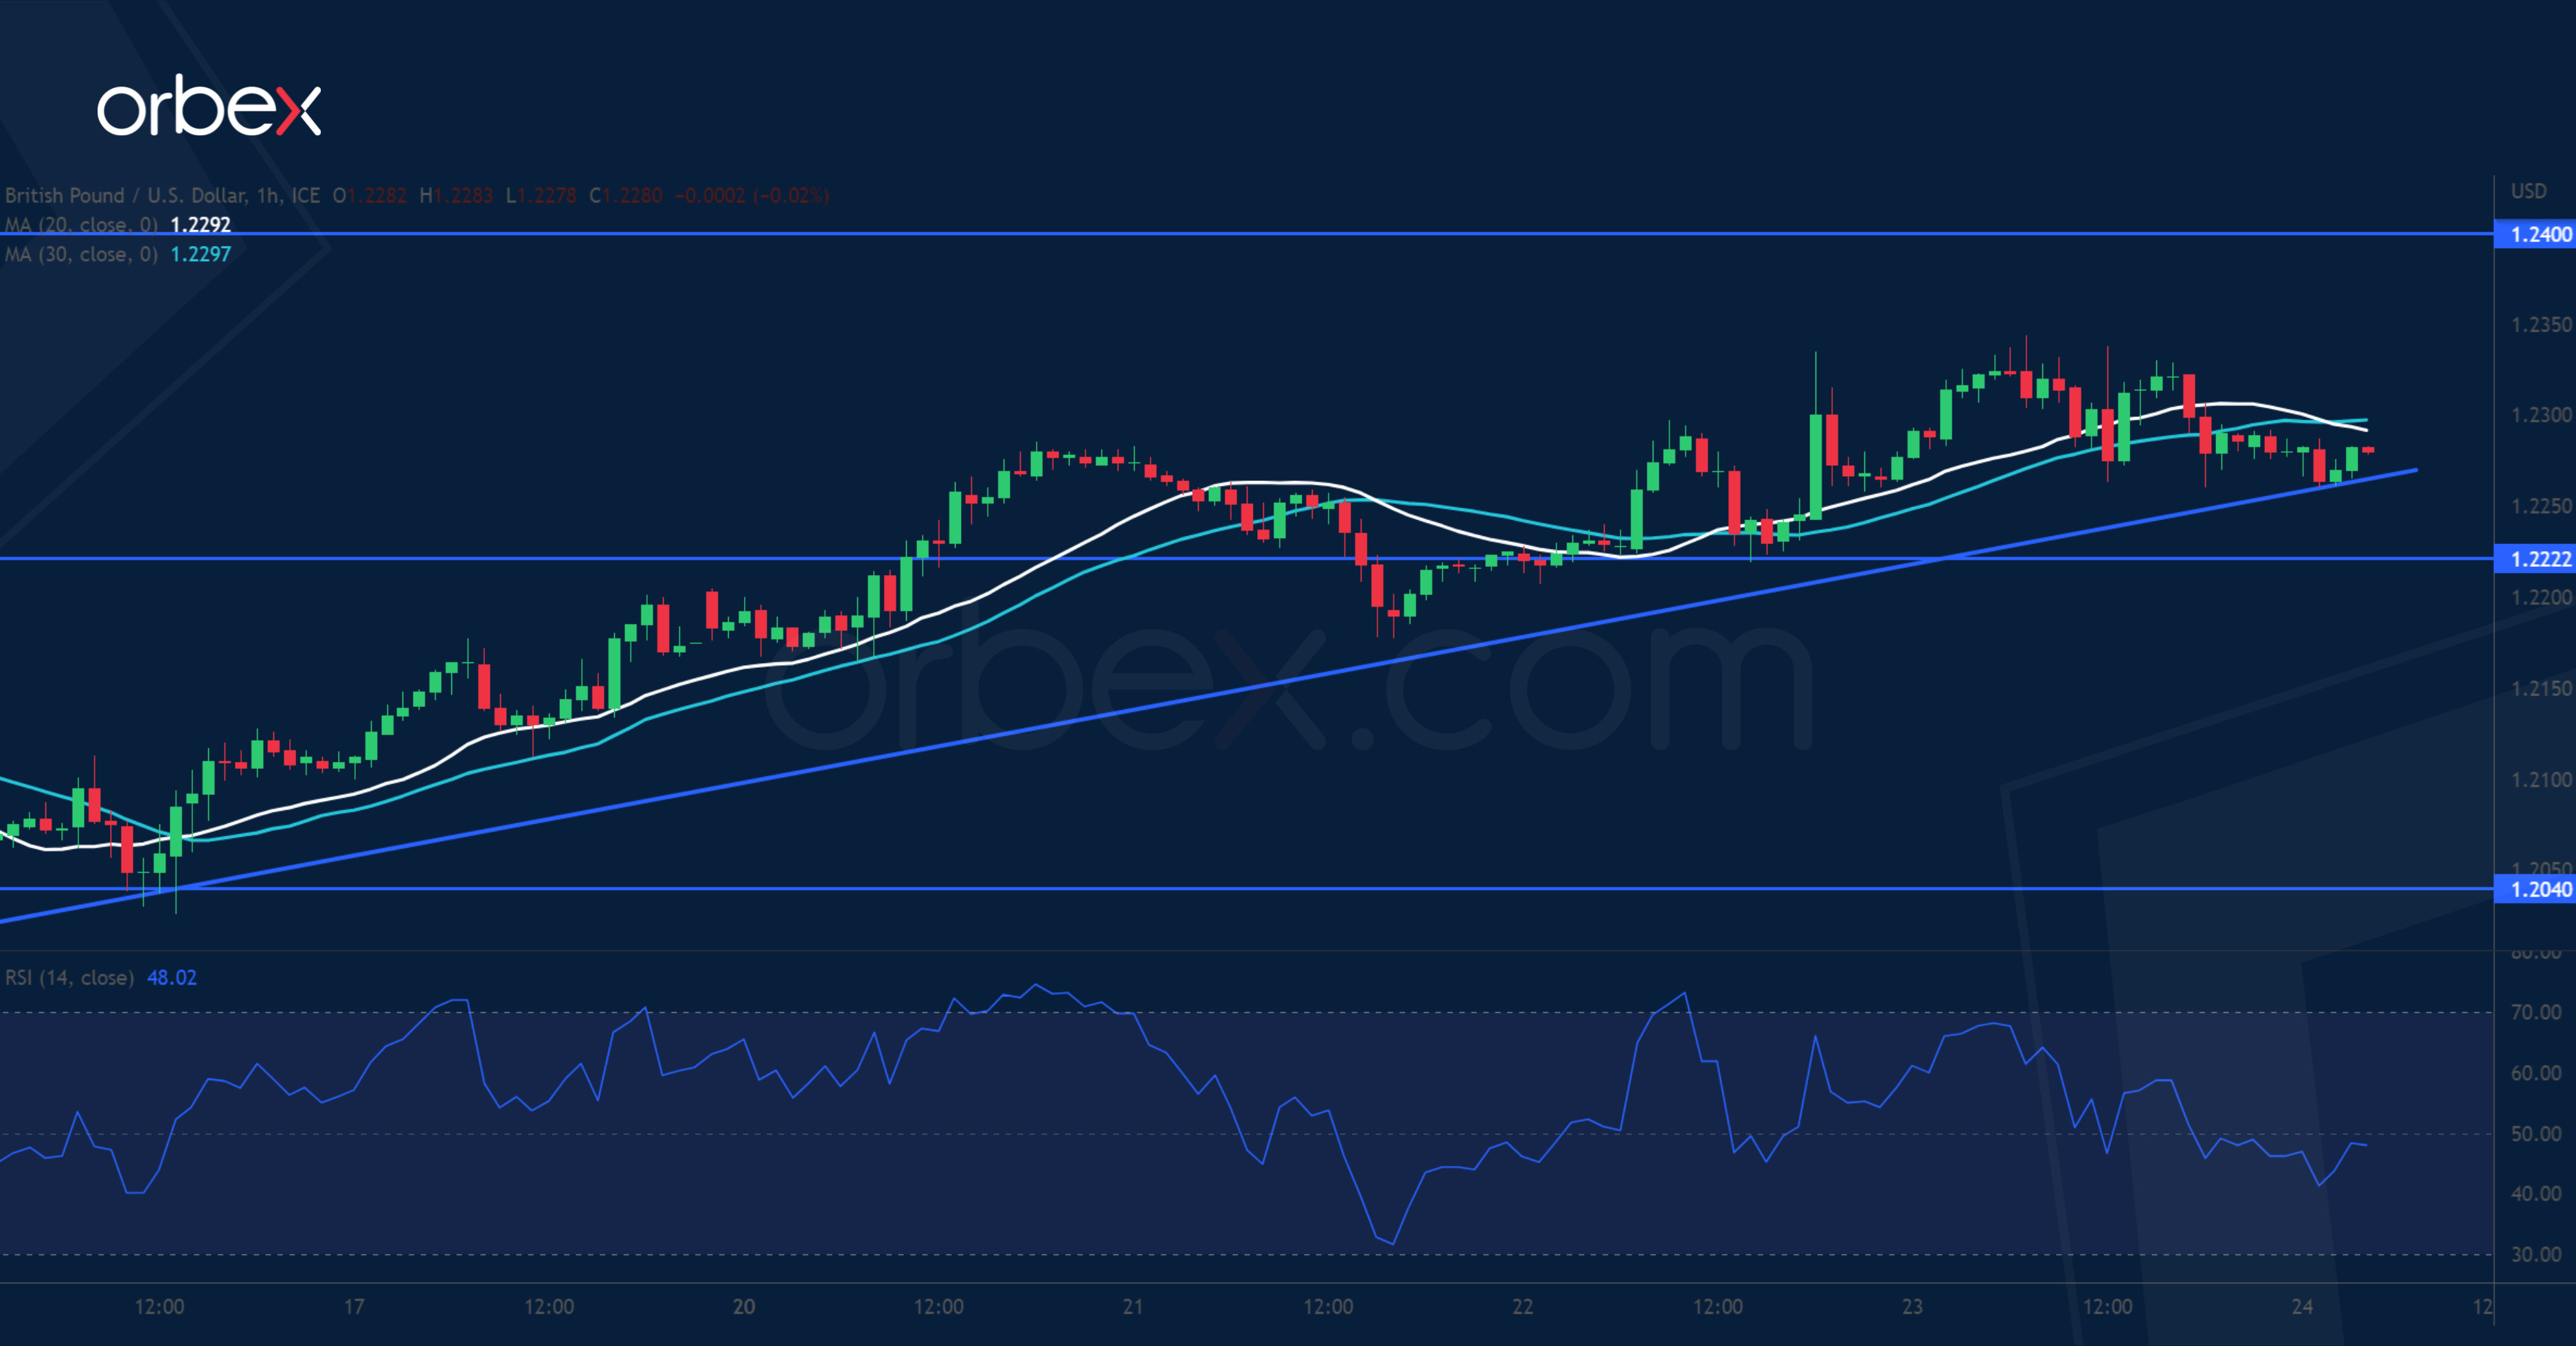
The pound holds onto its gains after the BoE raised its rates by 25 bp as expected. On the daily chart, the pair is still in a horizontal consolidation between 1.1800 and 1.2450. Zooming into the hourly time frame, Sterling has been recovering along a rising trend line which indicates mounting buying pressure. The supply zone around 1.2340 and 1.2400 from an early February sell-off is an important cap. A breakout could lead to a bullish continuation in the medium-term. The area between the trend line and 1.2220 is the first support.
USD/CHF gives up gains
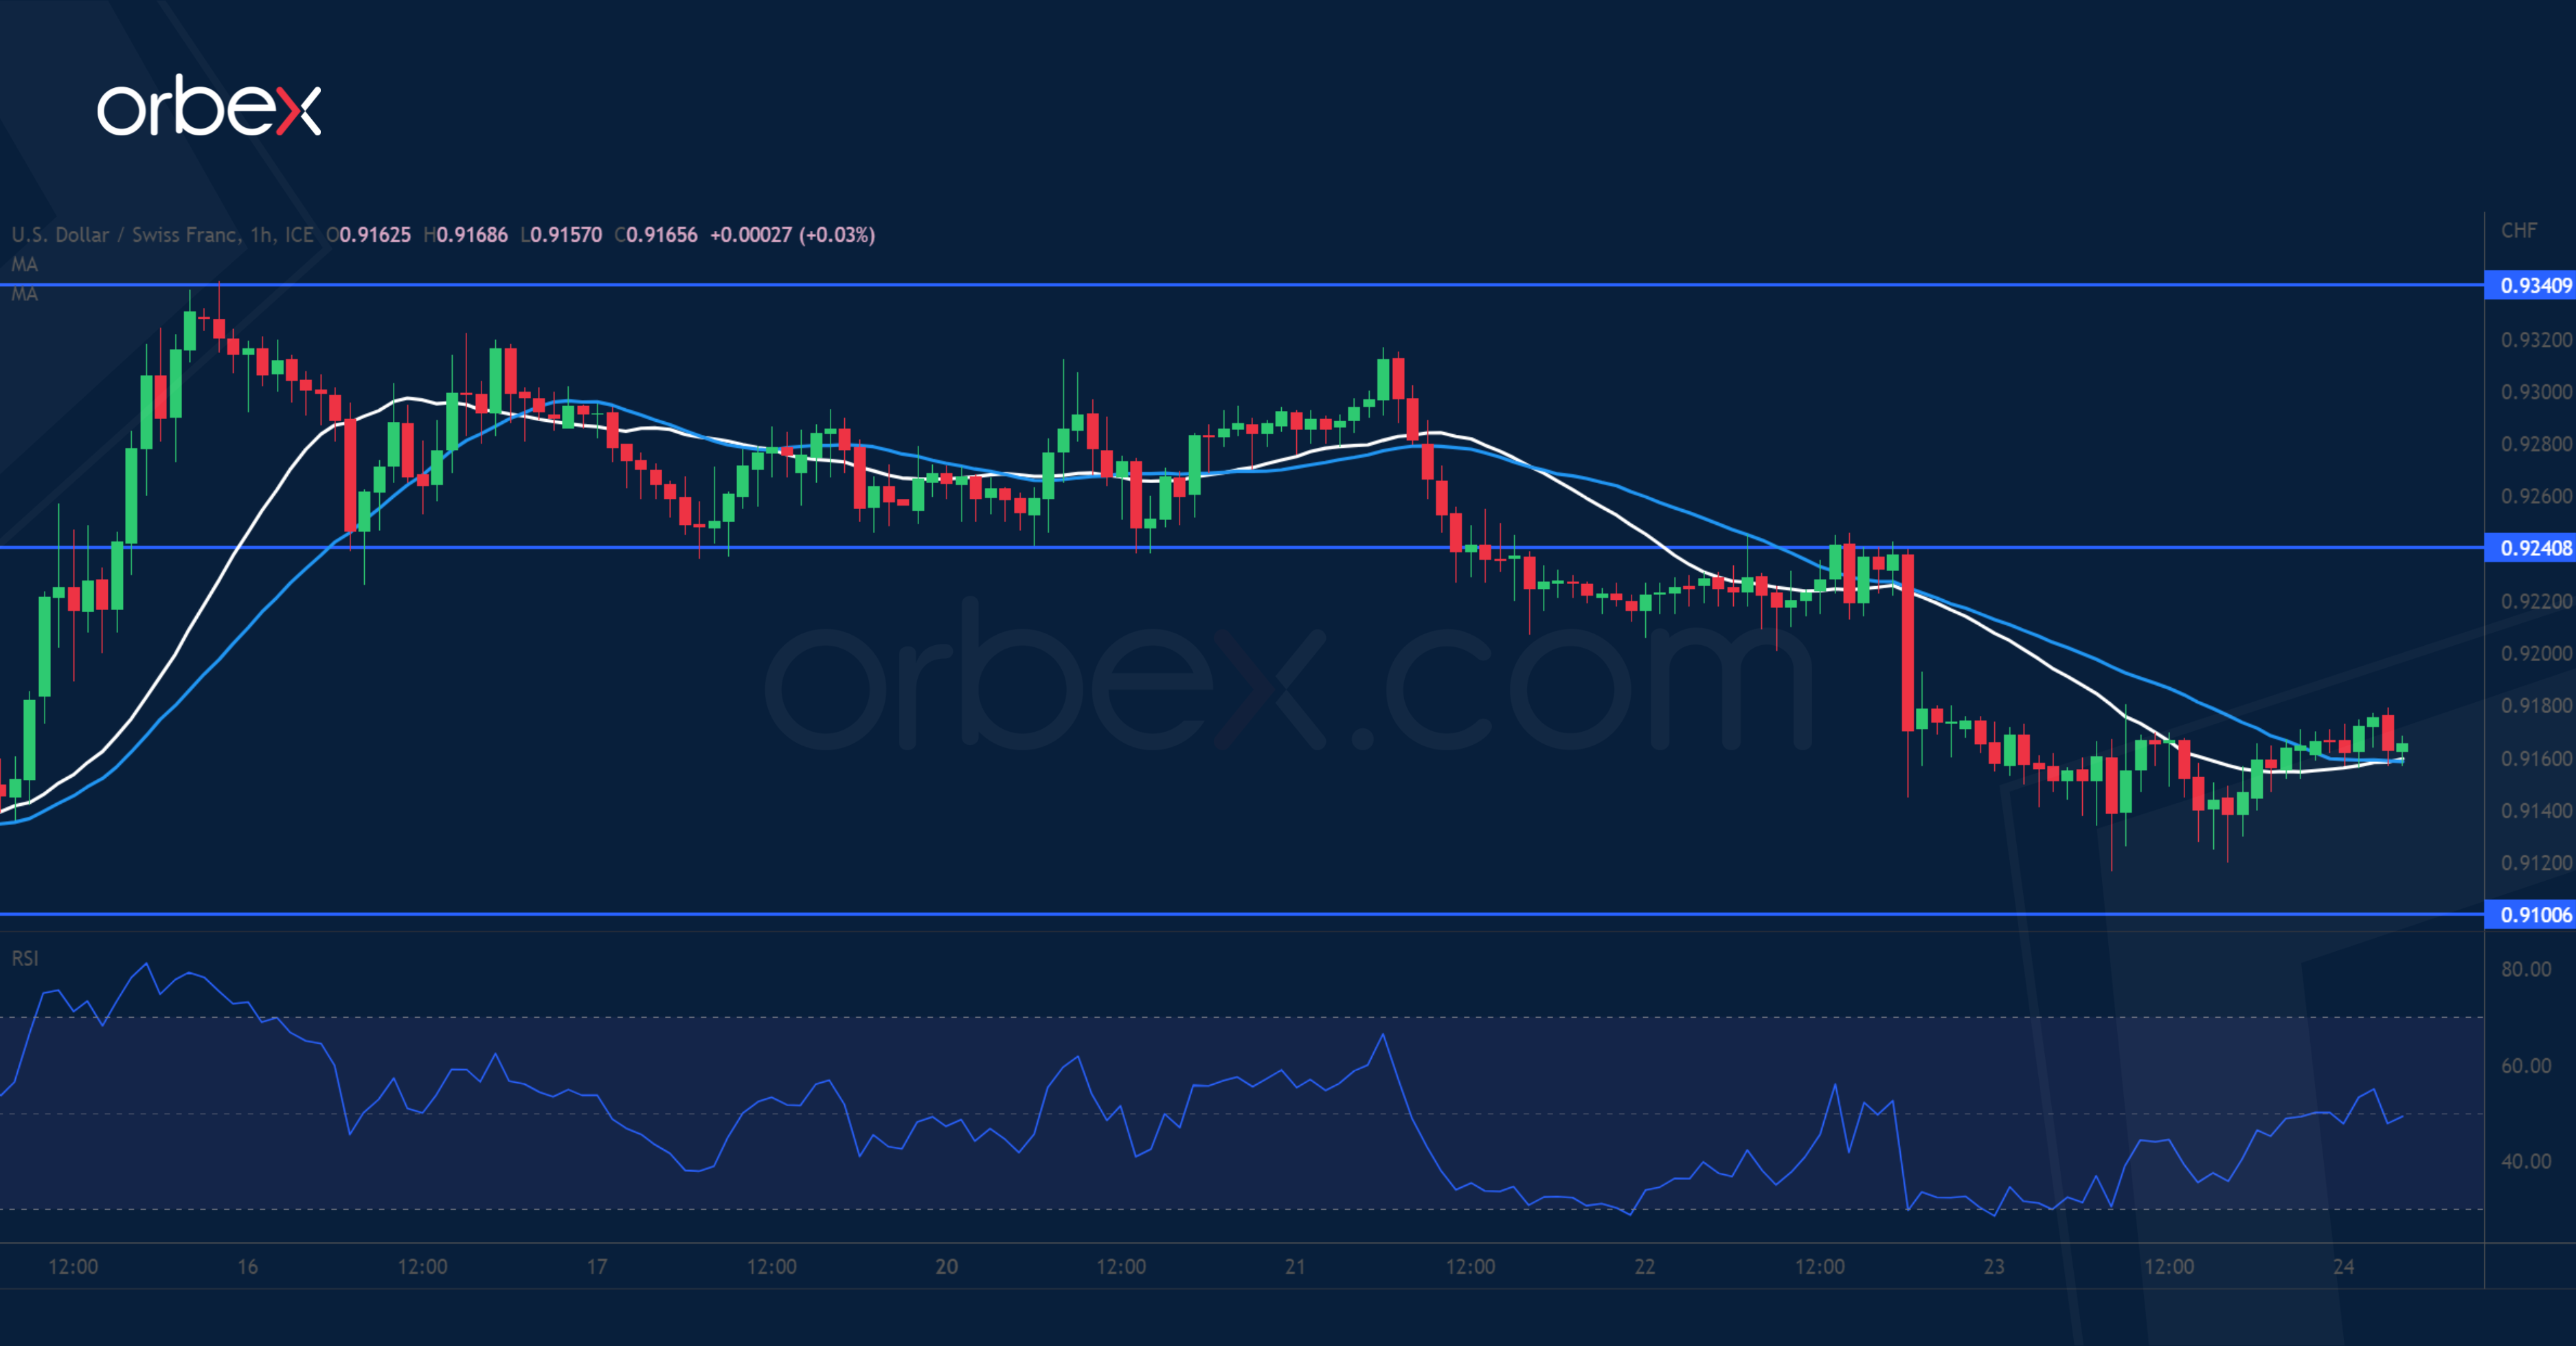
The Swiss franc strengthened after the SNB also raised its policy rate by 50 bp. After hitting resistance at 0.9340, the US dollar has given back its latest gains, which indicates the bulls’ struggle to turn sentiment around. 0.9100 right over the double bottom (0.9080) on the daily chart is a critical floor and its breach would signal that the path of least resistance is down, potentially triggering a broader sell-off towards the psychological level of 0.9000. 0.9240 is the first resistance to ease the selling pressure.
EUR/JPY seeks support
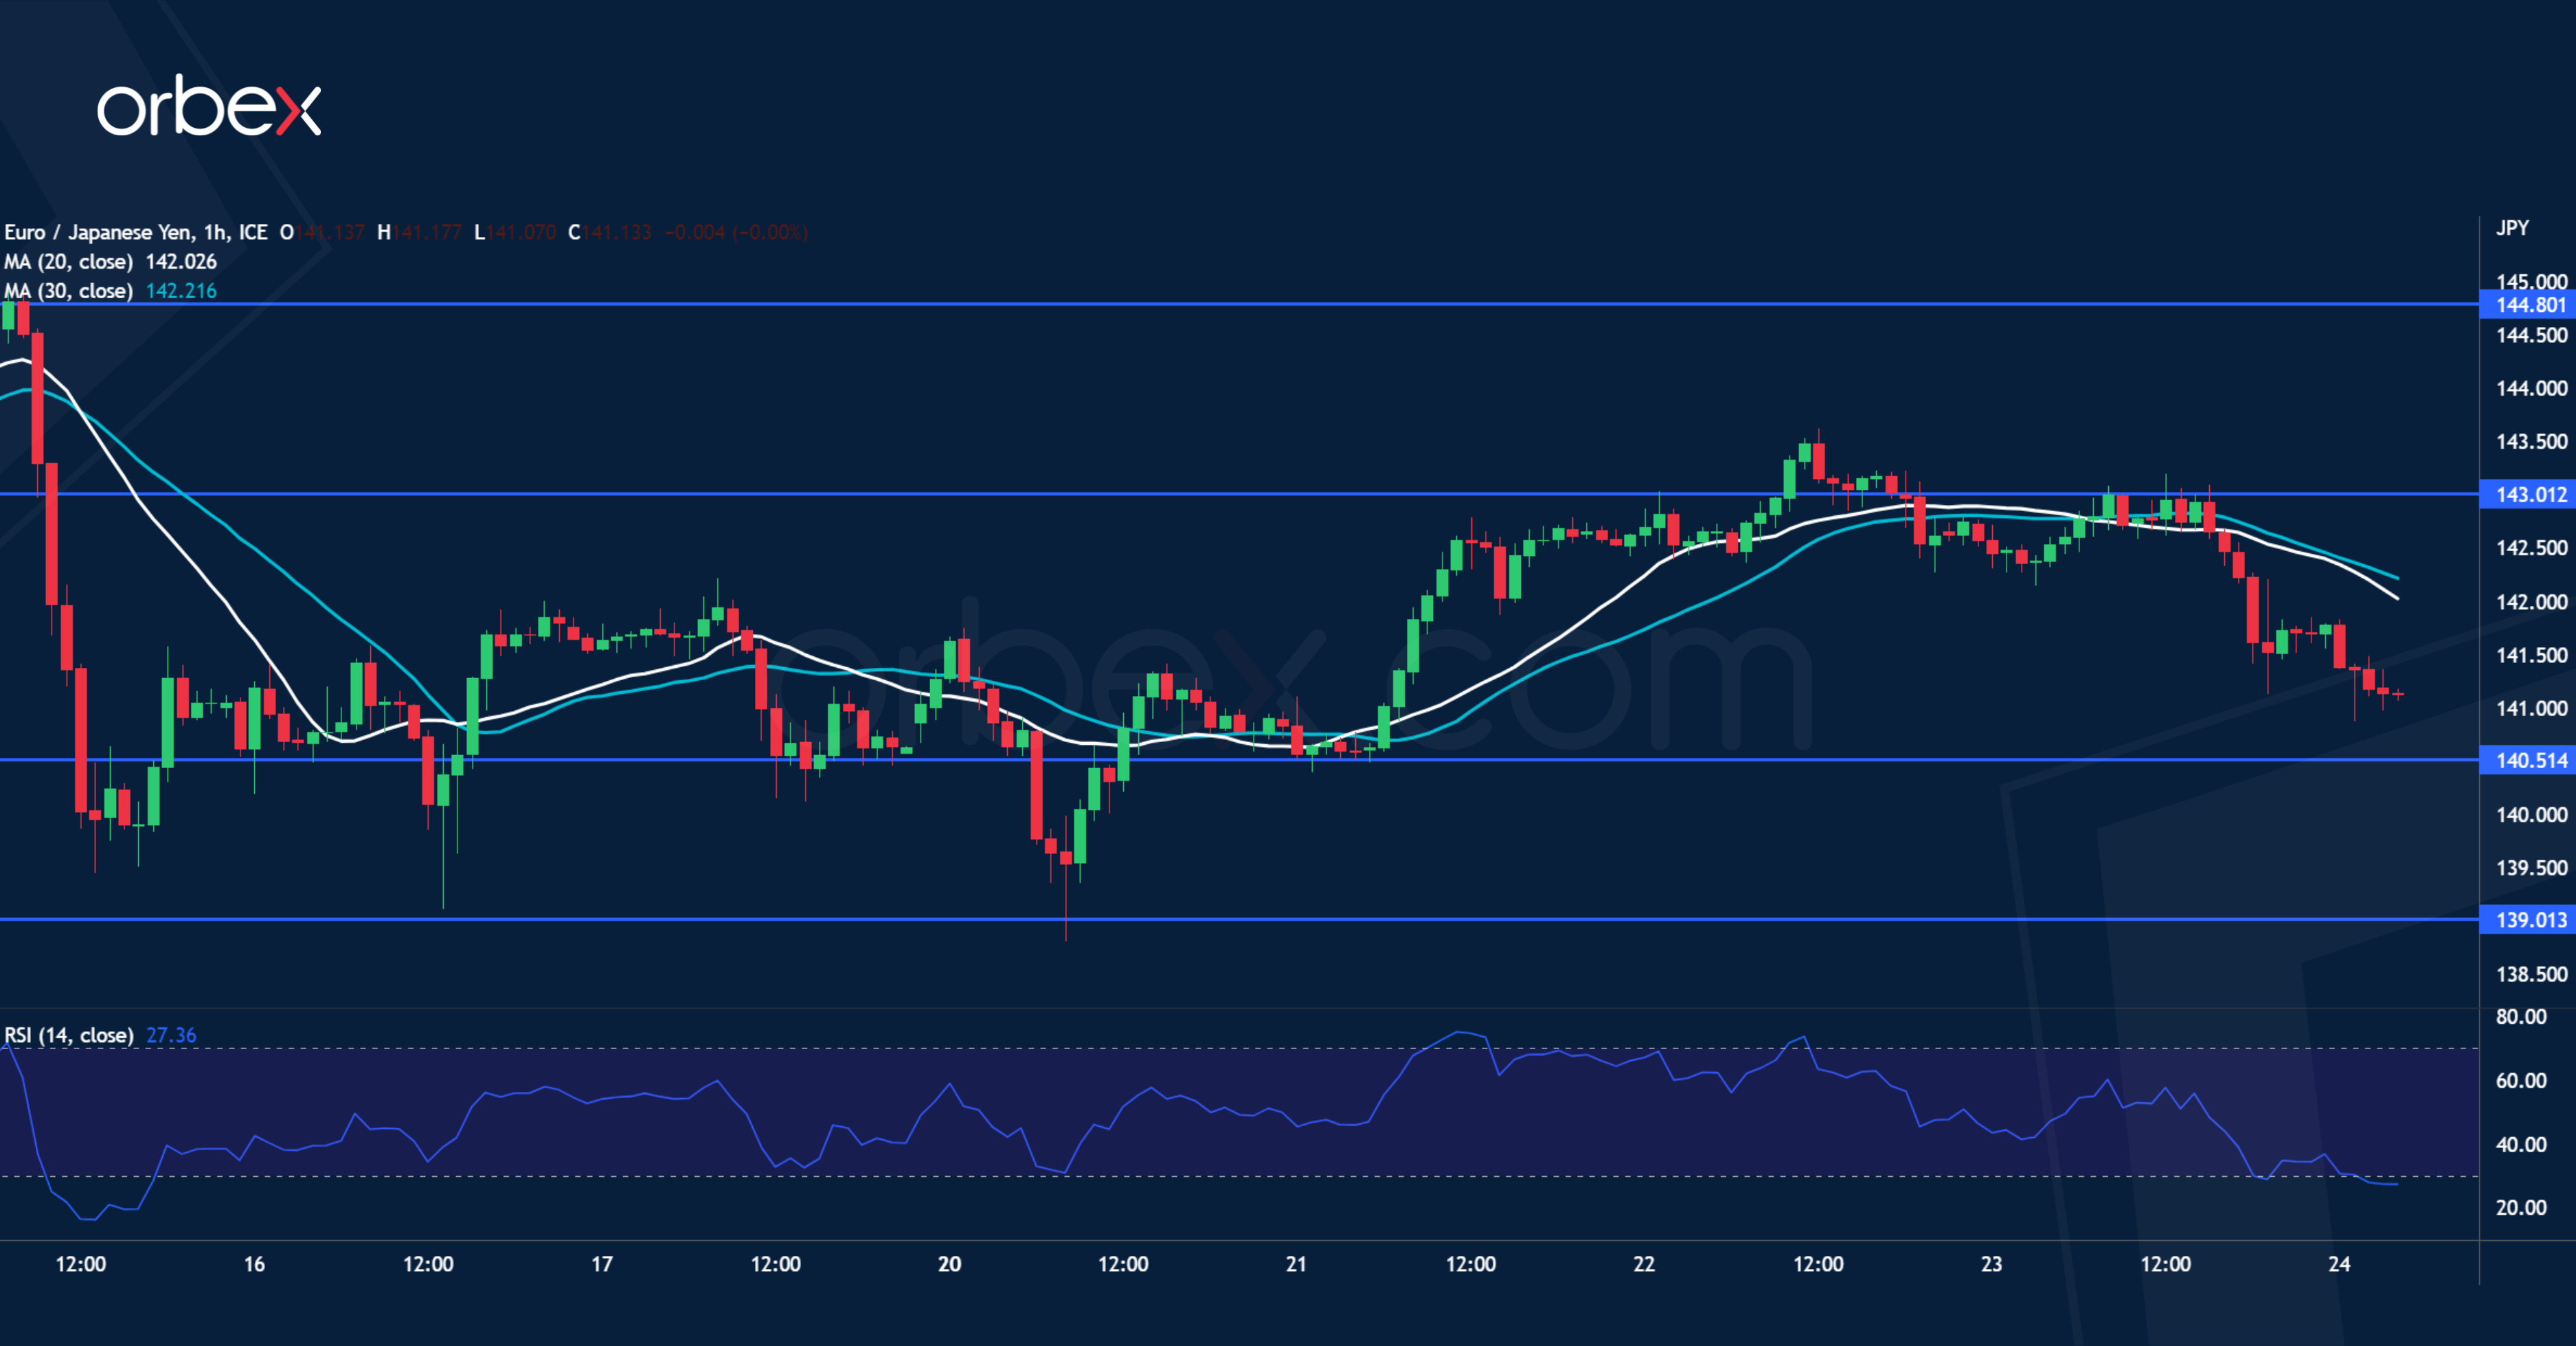
The Japanese yen bounces back over an upbeat core CPI in February. The bears’ double push was halted at 139.00 with long lower shadows suggesting a rejection of lower offers. But the euro’s bounce turned south in the supply zone around 143.50 near the start of last week’s sharp liquidation. 140.50 is a key support to keep the rebound intact as a lack of follow-up buying may threaten the floor at 139.00. Buyers would regain control of the direction if they manage to push back above the fresh resistance at 143.00.
USD/CAD Daily Outlook
Daily Pivots: (S1) 1.3651; (P) 1.3695; (R1) 1.3758; More....
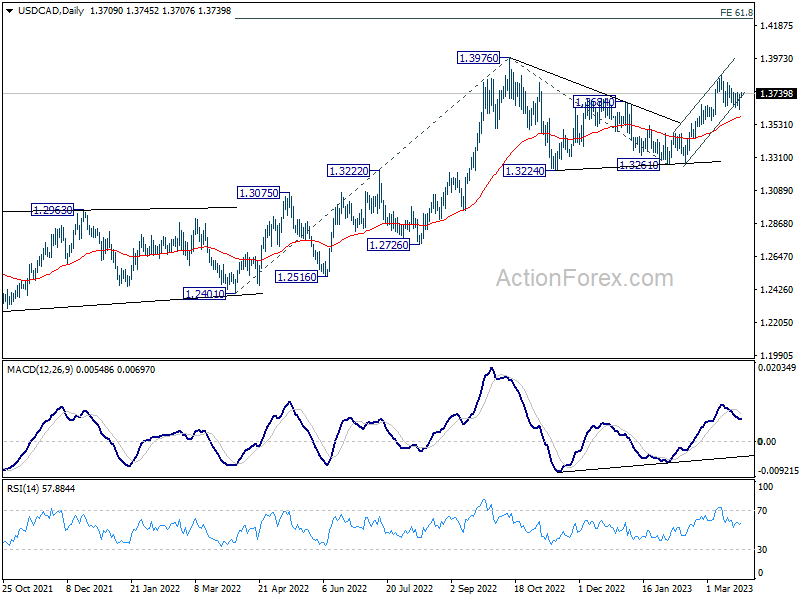
USD/CAD defended 1.3650 support again and recovered. Intraday bias remains neutral first. On the upside, break of 1.3860 will resume the rally from 1.3261 to retest 1.3976 high. However, firm break of 1.3650 will mix up the near term outlook and bring deeper pullback to 55 day EMA (now at 1.3578).
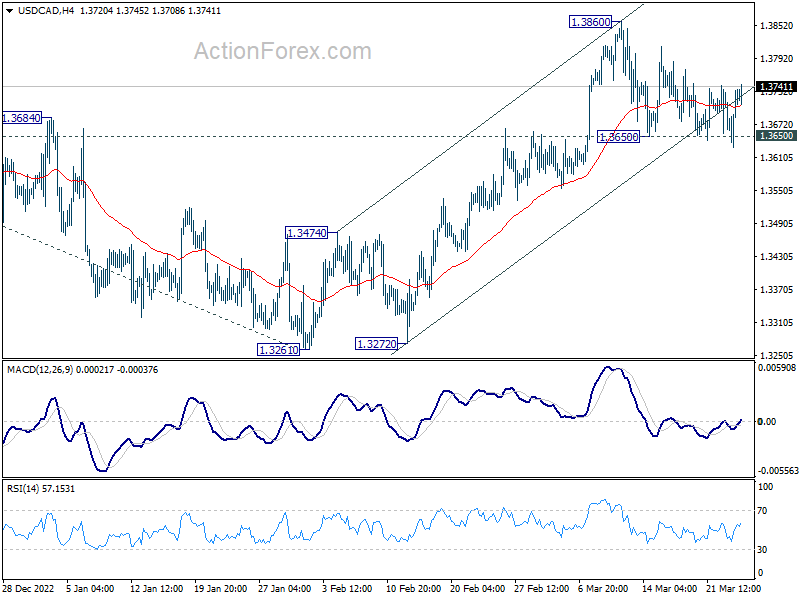
In the bigger picture, the up trend from 1.2005 (2021 low) is still in progress. Break of 1.3976 will confirm resumption and target 61.8% projection of 1.2401 to 1.3976 from 1.3261 at 1.4234. Firm break there will pave the way to long term resistance zone at 1.4667/89 (2016, 2020 highs). On the downside, break of 1.3261 support is needed to confirm medium term topping. Otherwise, outlook will remain bullish even in case of deep pull back.