Sample Category Title
Technical Outlook and Review
DXY:
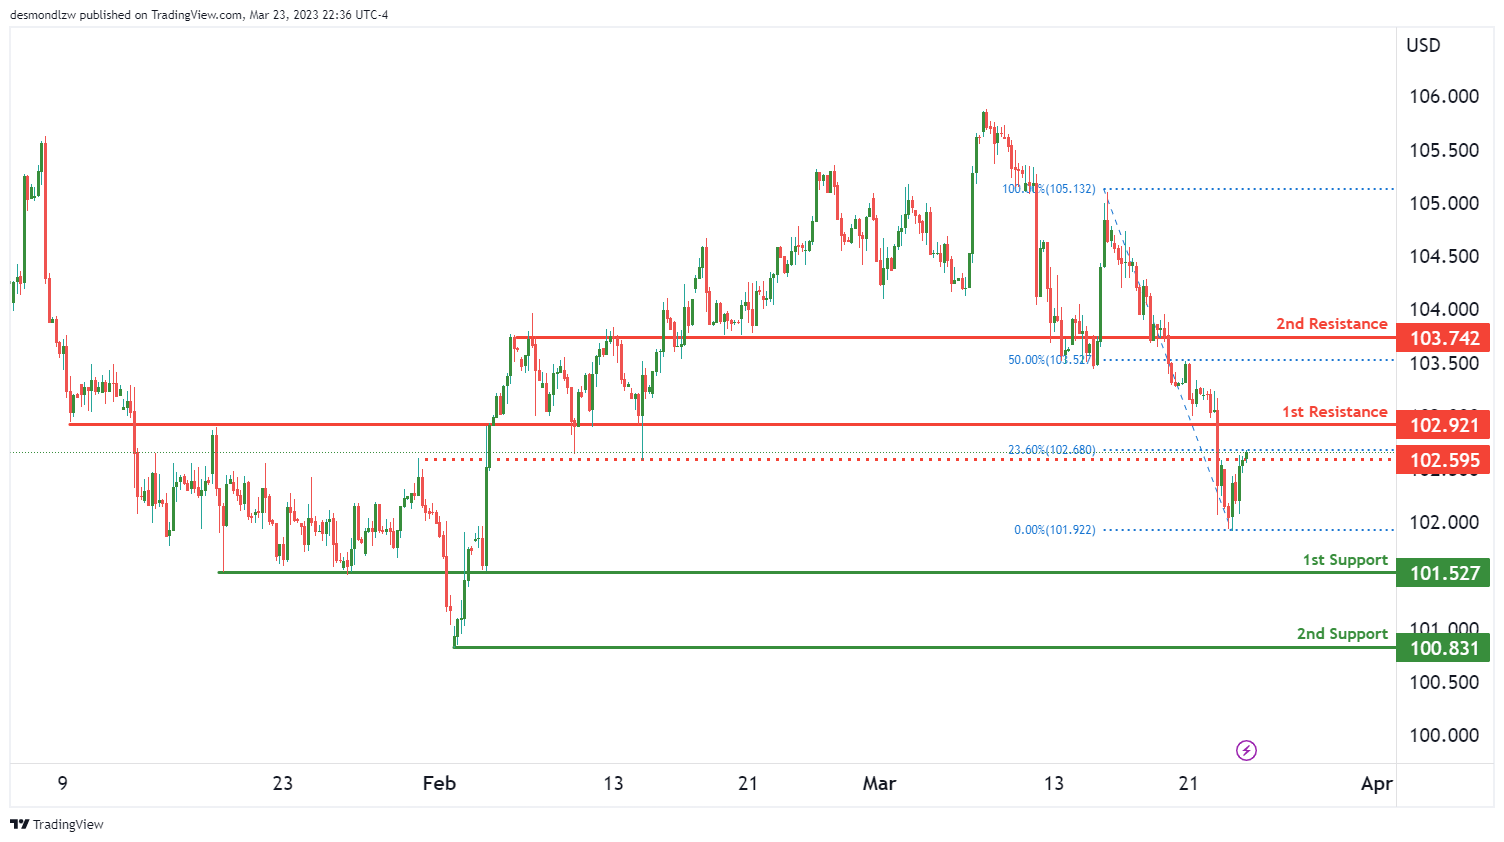
Based on the analysis of the DXY chart, the overall momentum of the chart is currently bullish. In the short term, price could potentially continue its bullish trend towards the 1st resistance level at 102.92.
The 1st support level at 101.52 is a good level of support as it is an overlap support. Additionally, the 2nd support level at 100.83 is a swing low support, making it another good level of support.
On the resistance side, the 1st resistance level at 102.92 is also an overlap resistance, making it a significant level of resistance. There is also an intermediate resistance level at 103.74, which is an overlap resistance and coincides with a 50% Fibonacci retracement level. Another intermediate resistance level can be found at 102.59.
It’s worth noting that the overall momentum of the chart is bullish, suggesting potential for prices to continue rising towards the 1st resistance level. If price were to drop below the 1st support level, the next support level would be the 2nd support at 100.83.
EUR/USD:
Looking at the EUR/USD chart, the overall momentum is currently bearish, indicating that prices may continue to drop in the near term. There is a potential for a bearish continuation towards the 1st support level at 1.0768.
The 1st support level is a strong level of support as it is an overlap support and coincides with a 38.20% Fibonacci retracement level. The 2nd support level at 1.0694 is also an overlap support, making it another strong level of support.
On the resistance side, the 1st resistance level at 1.0925 is an overlap resistance and coincides with a 78.60% Fibonacci retracement level. Additionally, there is an intermediate resistance level at 1.1027, which is a swing high resistance level.

GBP/USD:
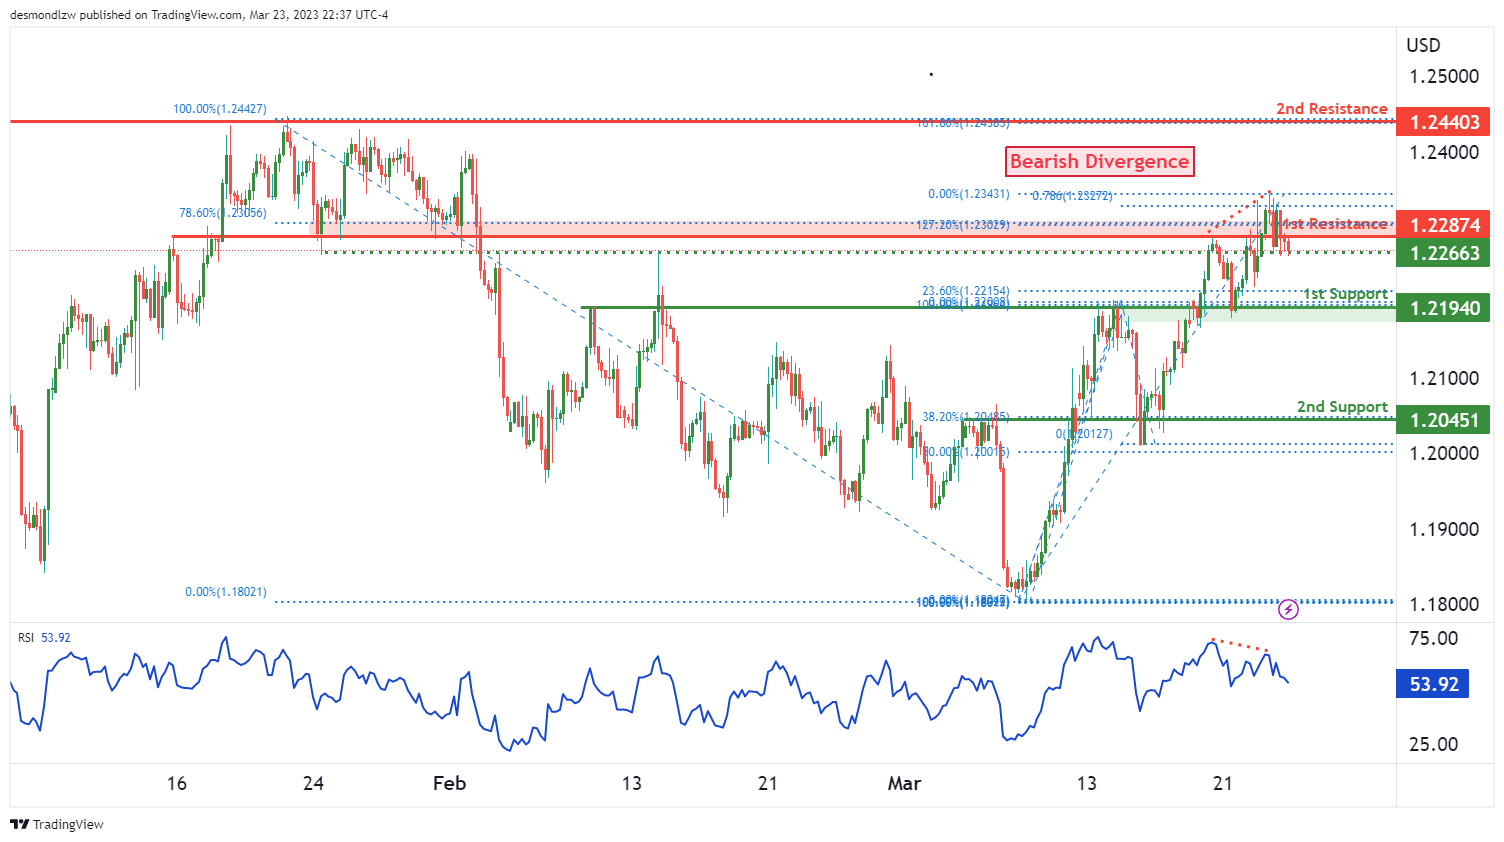
The GBP/USD chart currently shows a strong bearish momentum with high confidence. There is a potential for a bearish continuation towards the 1st support at 1.2194, which is a strong overlap support level and has a 23.60% Fibonacci retracement lining up with it. Additionally, the 2nd support at 1.2045 is another good level of support, being an overlap support level and also coinciding with a 38.20% Fibonacci retracement.
On the resistance side, the 1st resistance level at 1.0925 is an overlap resistance and also happens to be at a 127% Fibonacci extension. There is also an intermediate resistance level at 1.2440, which is a swing high resistance and a 161.80% Fibonacci extension.
It’s worth noting that the RSI is displaying bearish divergence versus price, suggesting that a reversal might occur soon. This adds to the bearish bias of the chart and supports the potential for a bearish continuation towards the 1st support level.
USD/CHF:
The USD/CHF chart is showing bullish momentum with potential for further upward movement. The current price is testing the pivot point at 0.9136, which is an overlap support level and also has a 78.60% Fibonacci retracement lining up with it. If the price were to reverse, it could drop to the 1st support level at 0.9071, a multi-swing low support level.
On the resistance side, the 1st resistance level is at 0.9240, which is an overlap resistance level and coincides with a 50% Fibonacci retracement. There is also an intermediate resistance level at 0.9300, which is another overlap resistance level. A further intermediate resistance level is located at 0.9207, which is between the current price and the 1st resistance level and has a 38.20% Fibonacci retracement.
Overall, the bias is bullish, with the potential for a bullish continuation towards the 1st resistance level. If the price were to break above the pivot point, it could push to the 1st resistance level at 0.9240. However, if the price were to break below the pivot point, it could drop to the 1st support level at 0.9071.
USD/JPY:
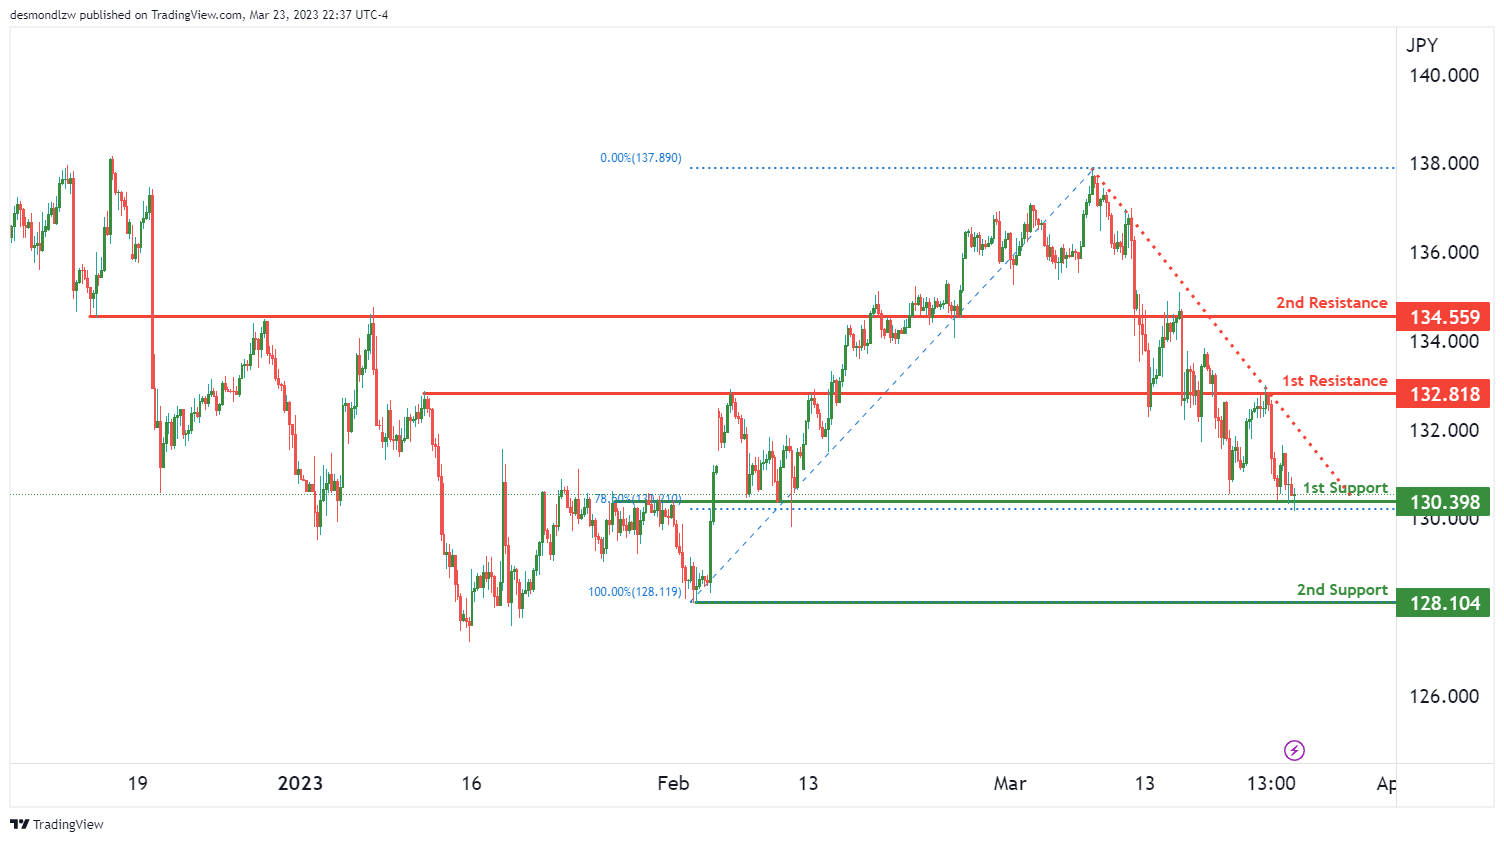
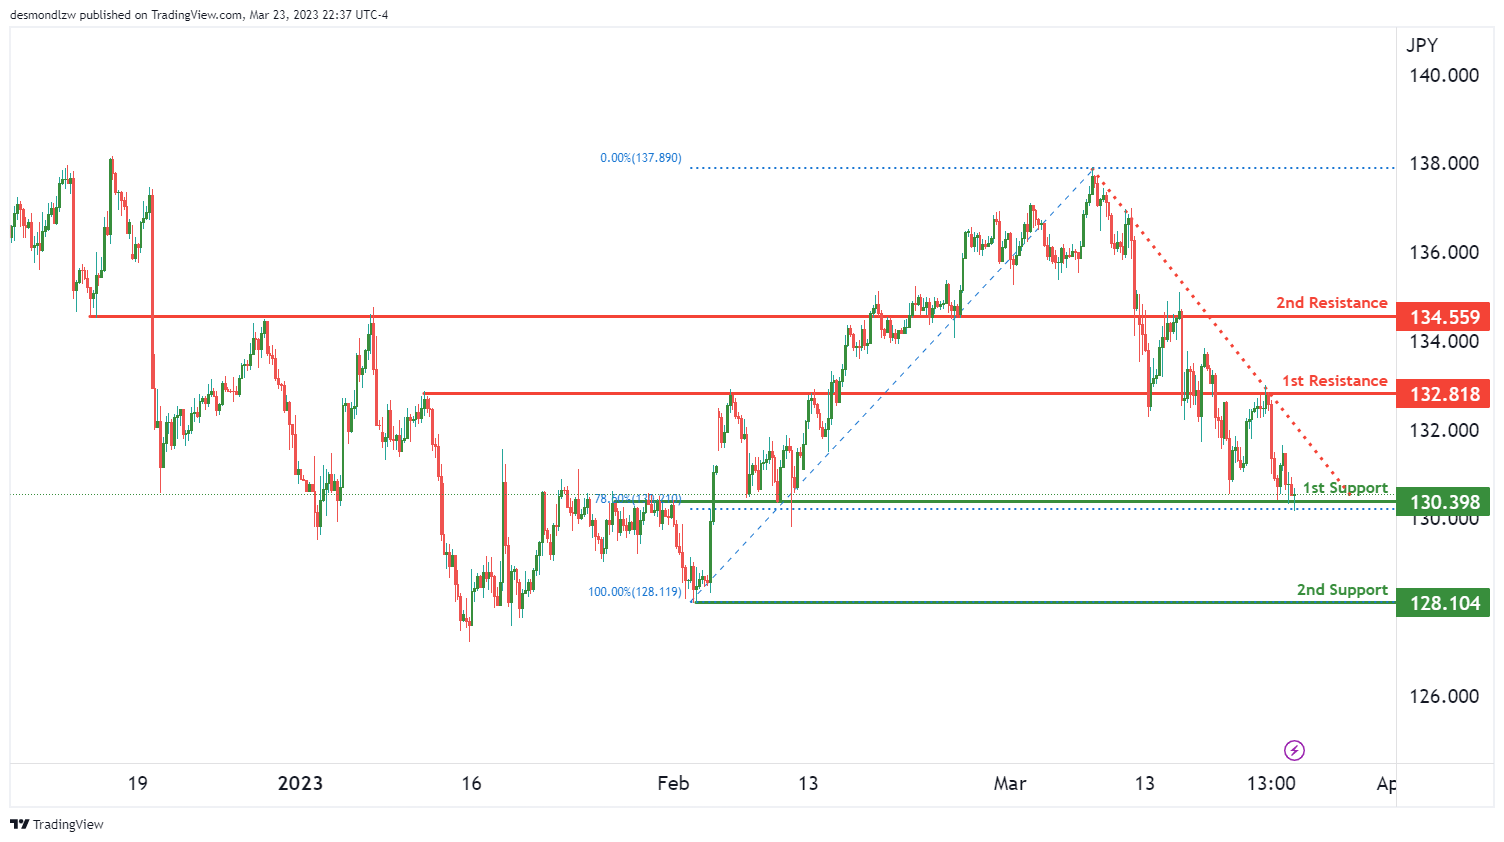
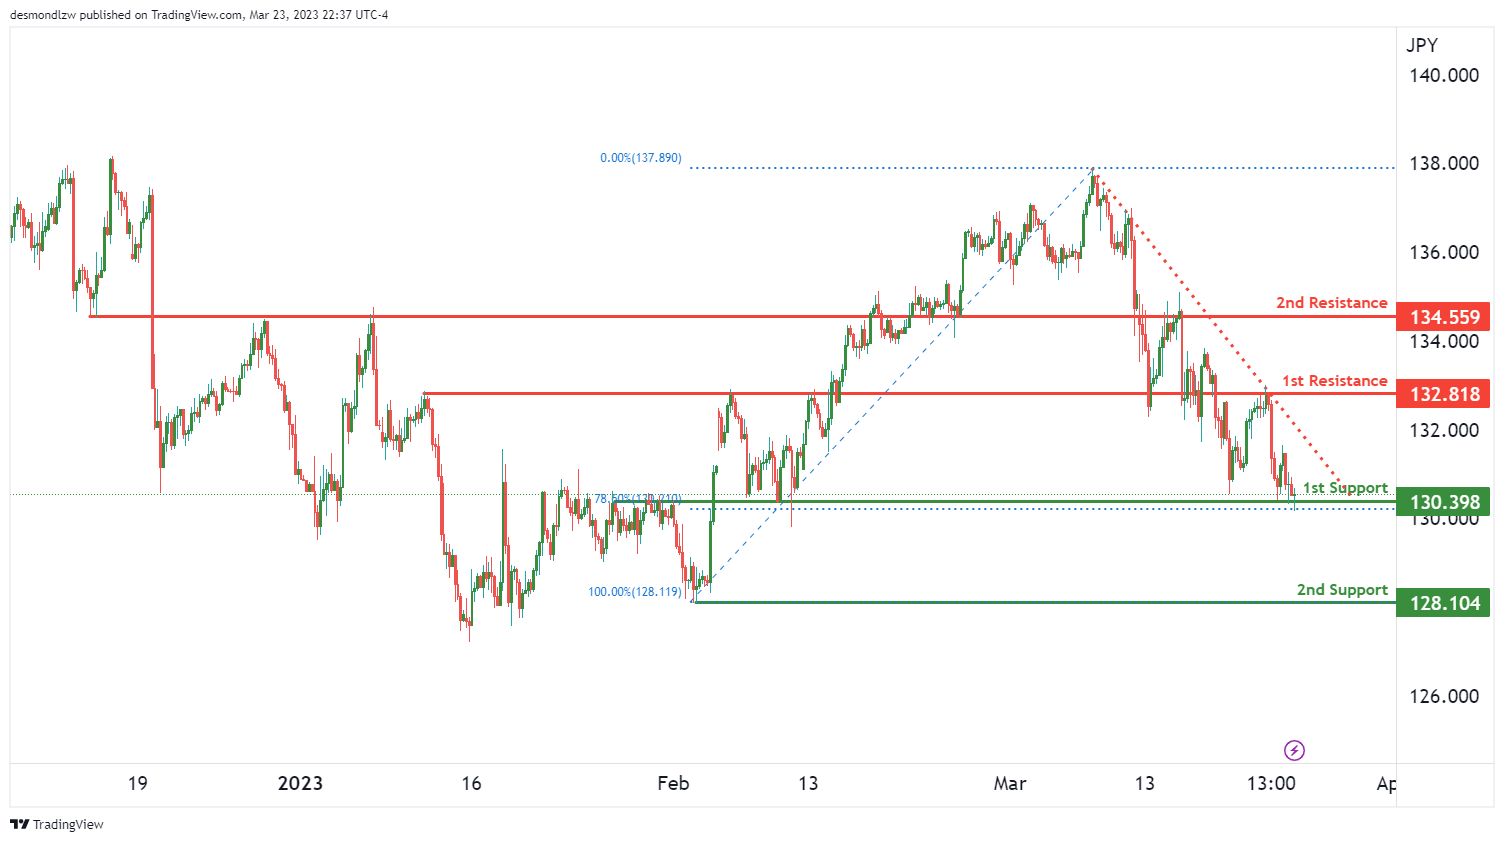
USD/JPY has a weak momentum with low confidence. The factors contributing to the momentum is that the price is below a major descending trend line, suggesting that bearish momentum is on the cards.
If price were to break off from the 1st support at 130.39, it could potentially drop towards the 2nd support at 128.10. The 1st support level is a good level as it is an overlap support with a 78.60% Fibonacci retracement lining up with it. Meanwhile, the 2nd support level is a multi-swing low support level.
On the resistance side, the 1st resistance level is at 132.81, which is an overlap resistance. There is also an intermediate resistance level at 134.55, which is another overlap resistance.
As the overall momentum is weak with low confidence, it’s difficult to predict whether the price will break above or below these levels. We’ll have to keep a close eye on how the price behaves around these levels to make an informed decision.
In conclusion, USD/JPY has a weak momentum with low confidence. While the 1st support and 1st resistance levels provide good opportunities for traders to enter the market, the overall momentum makes it difficult to predict whether the price will break above or below these levels.
AUD/USD:
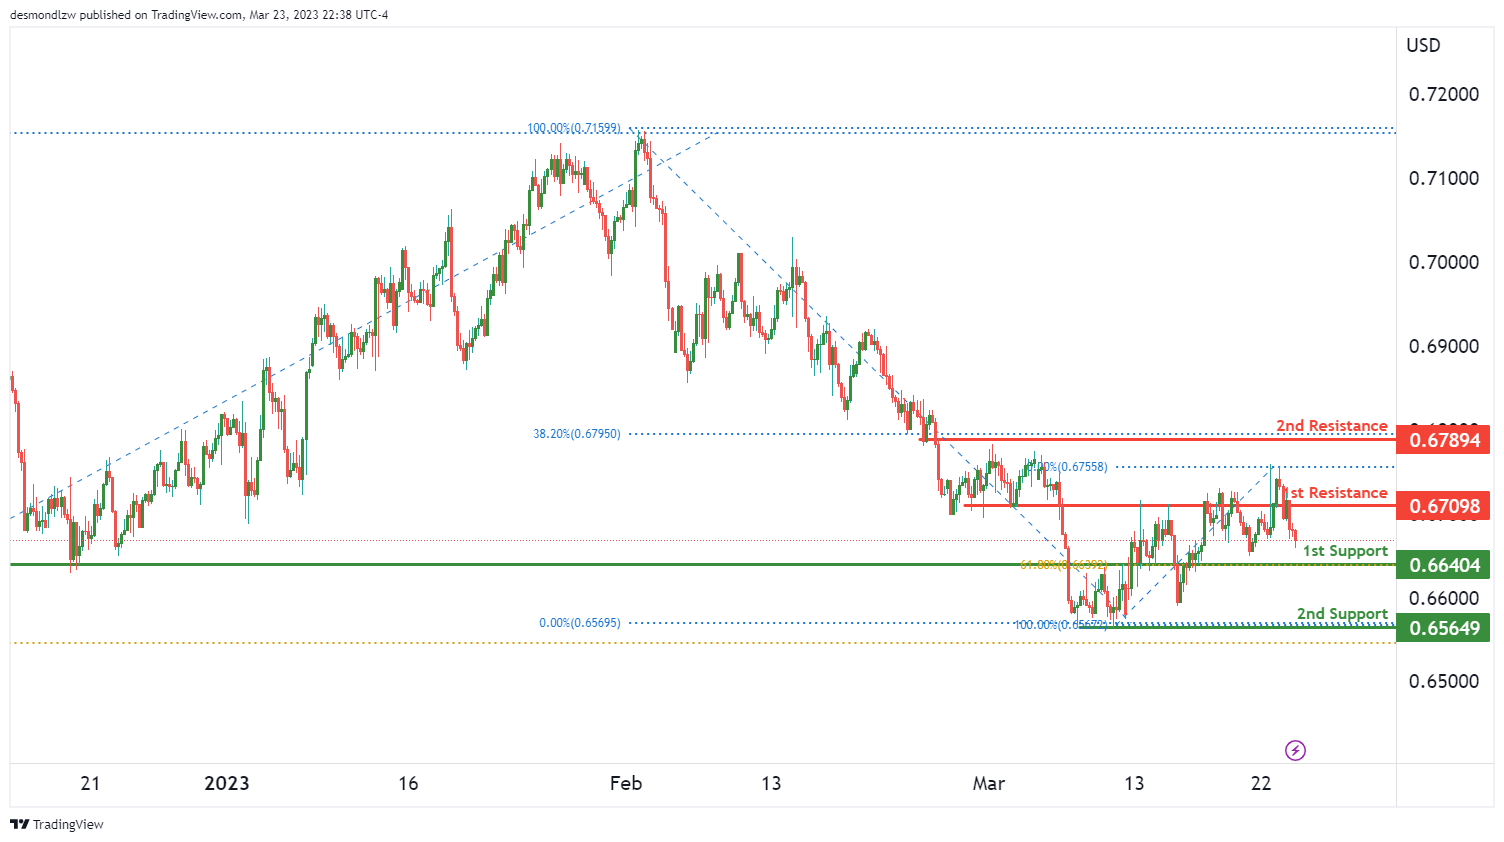
The AUD/USD chart is currently displaying a bearish momentum with potential for a continuation towards the 1st support level at 0.6640. This level is a strong overlap support and has a 61.80% Fibonacci retracement lining up with it, making it a reliable support level. In addition, there is a multi-swing low support at 0.6564, which could serve as a second support level if price were to break through the 1st support.
On the resistance side, the 1st resistance level is at 0.6709, which is also an overlap resistance level. The 2nd resistance level at 0.6789 coincides with a 38.20% Fibonacci retracement, making it a strong level of resistance.
It’s important to note that the overall momentum of the chart is bearish, indicating a potential for further downside. A break of the 1st support could trigger a drop towards the 2nd support level, while a break of the 1st resistance could lead to a rise towards the 2nd resistance level.
NZD/USD:
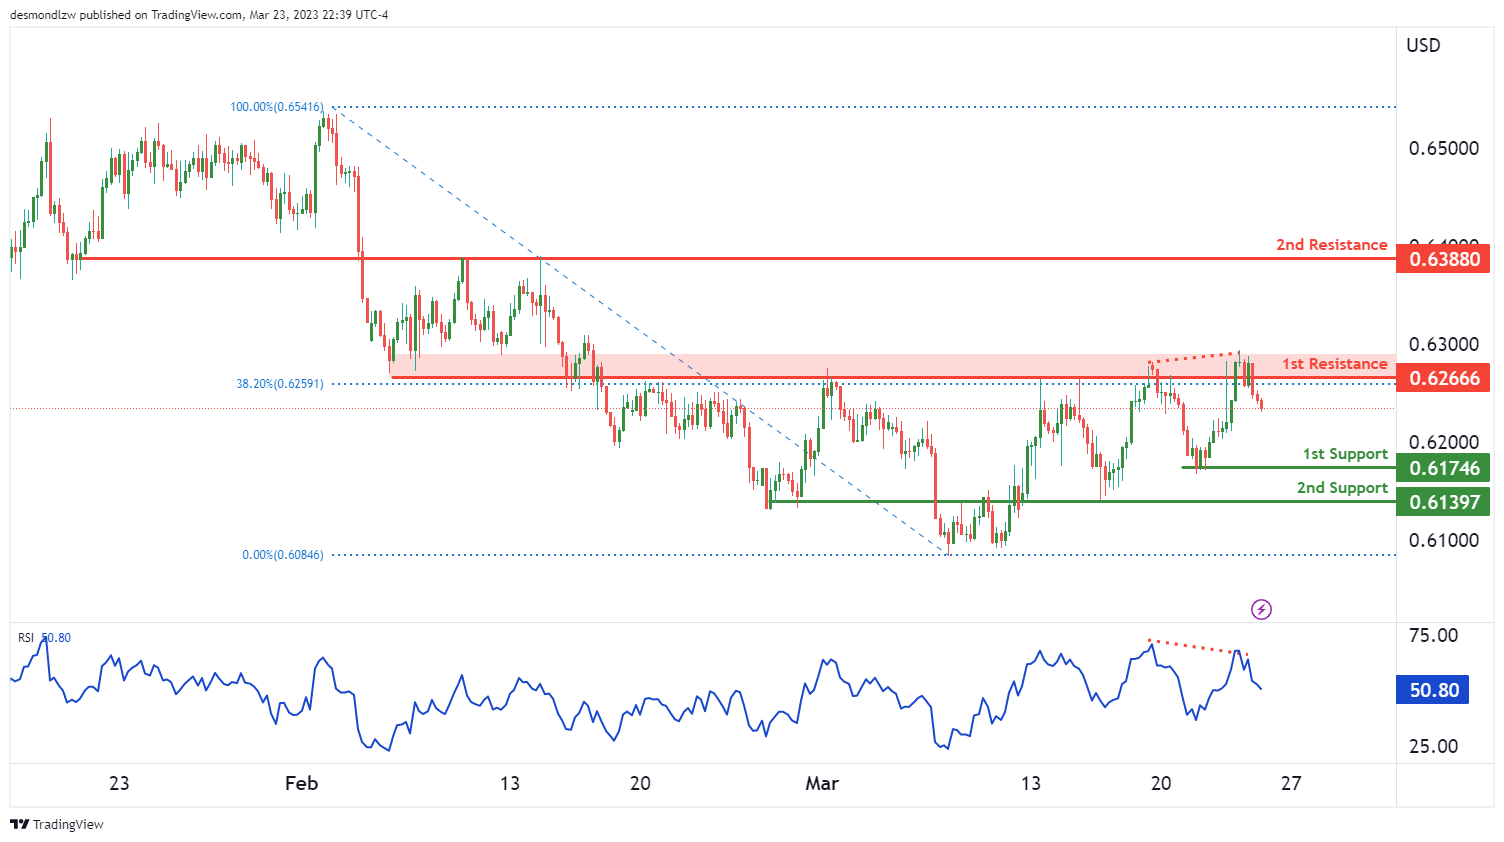
The NZD/USD chart is currently showing a bearish momentum. Price could potentially make a bearish continuation towards the first support level at 0.6174. This support level is a swing low support and could provide a strong level of buying interest. If price were to break through this level, it could drop further towards the second support level at 0.6139, which is an overlap support and has held prices up in the past.
On the resistance side, the first resistance level is at 0.6266. This level is an overlap resistance and has a 38.20% Fibonacci retracement lining up with it. If price were to rise from the current level, it could face selling pressure at this level. If price were to break through this resistance, it could potentially rise towards the second resistance level at 0.6388, which is also an overlap resistance level.
USD/CAD:
The USD/CAD chart is currently showing a bullish momentum, triggered by a break above a descending resistance line. Price could potentially make a bullish break through the first resistance level at 1.3743 and rise towards the second resistance level at 1.3815, which is an overlap resistance level.
On the support side, the first support level is at 1.3645. This level is an overlap support and has a 38.20% Fibonacci retracement lining up with it, which could provide a strong level of buying interest. If price were to break through this level, it could drop further towards the second support level at 1.3569, which is also an overlap support level and has held prices up in the past.
Overall, with the bullish momentum and the potential for a break through the first resistance level, it suggests that prices may continue to rise in the short term. However, it’s worth noting that the support and resistance levels are relatively close to each other
DJ30:
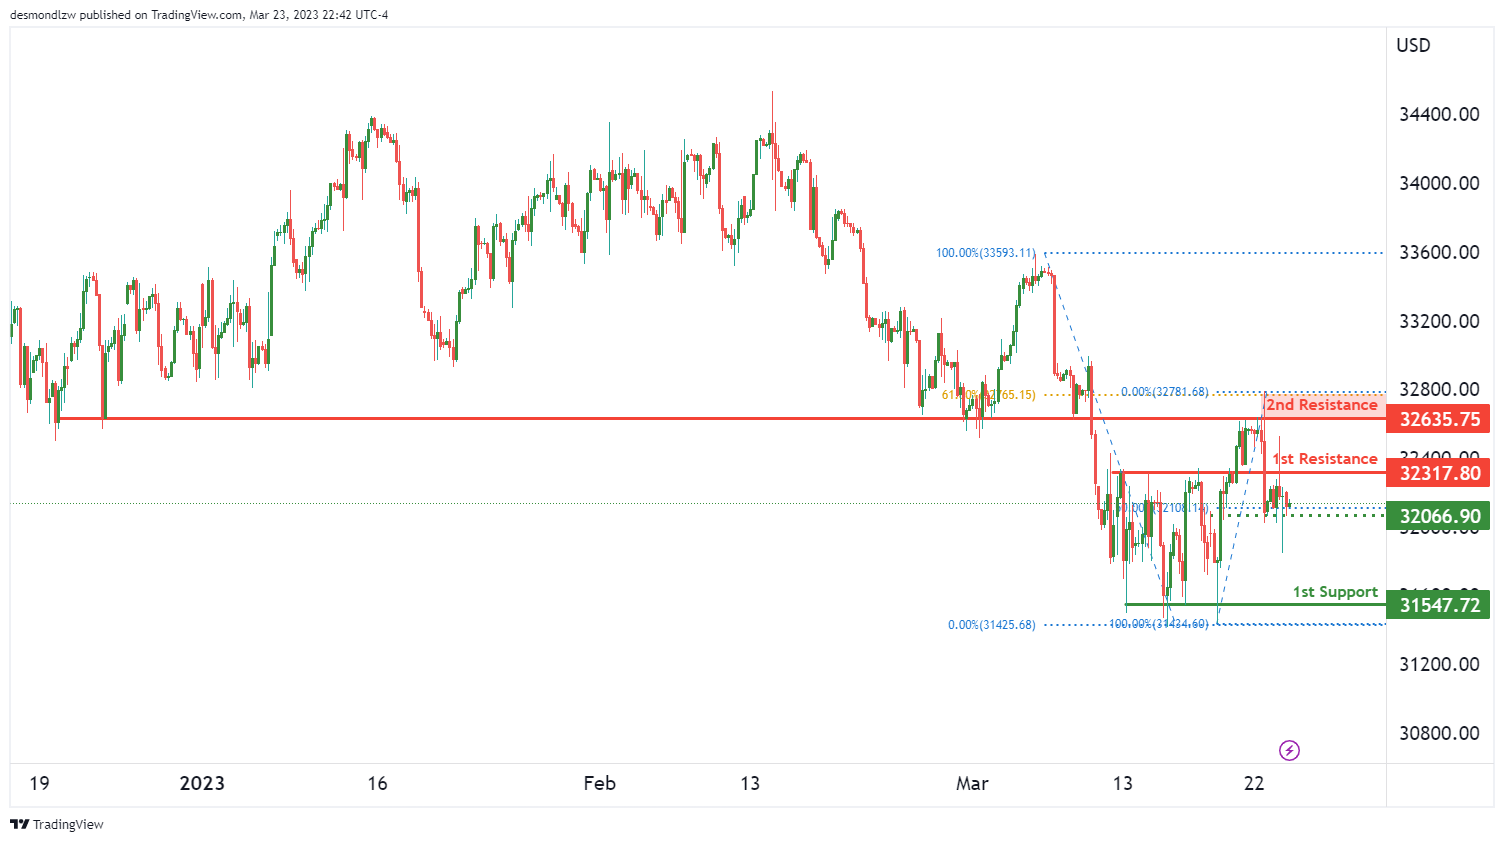
The DJ30 chart is currently showing a bearish momentum, but there is a possibility of a bullish continuation towards the first resistance level. The first support level is at 31547, which is a multi-swing low support level that has held prices up in the past. If the price were to bounce from this support level, it could potentially rise towards the intermediate support level at 32066, which is an overlap support level.
On the resistance side, the first resistance level is at 32317, which is an overlap resistance level that could provide a strong level of selling interest. If the price were to break through this resistance level, it could potentially rise towards the second resistance level at 32635, which is also an overlap resistance level and has a 61.80% Fibonacci retracement lining up with it.
GER30:
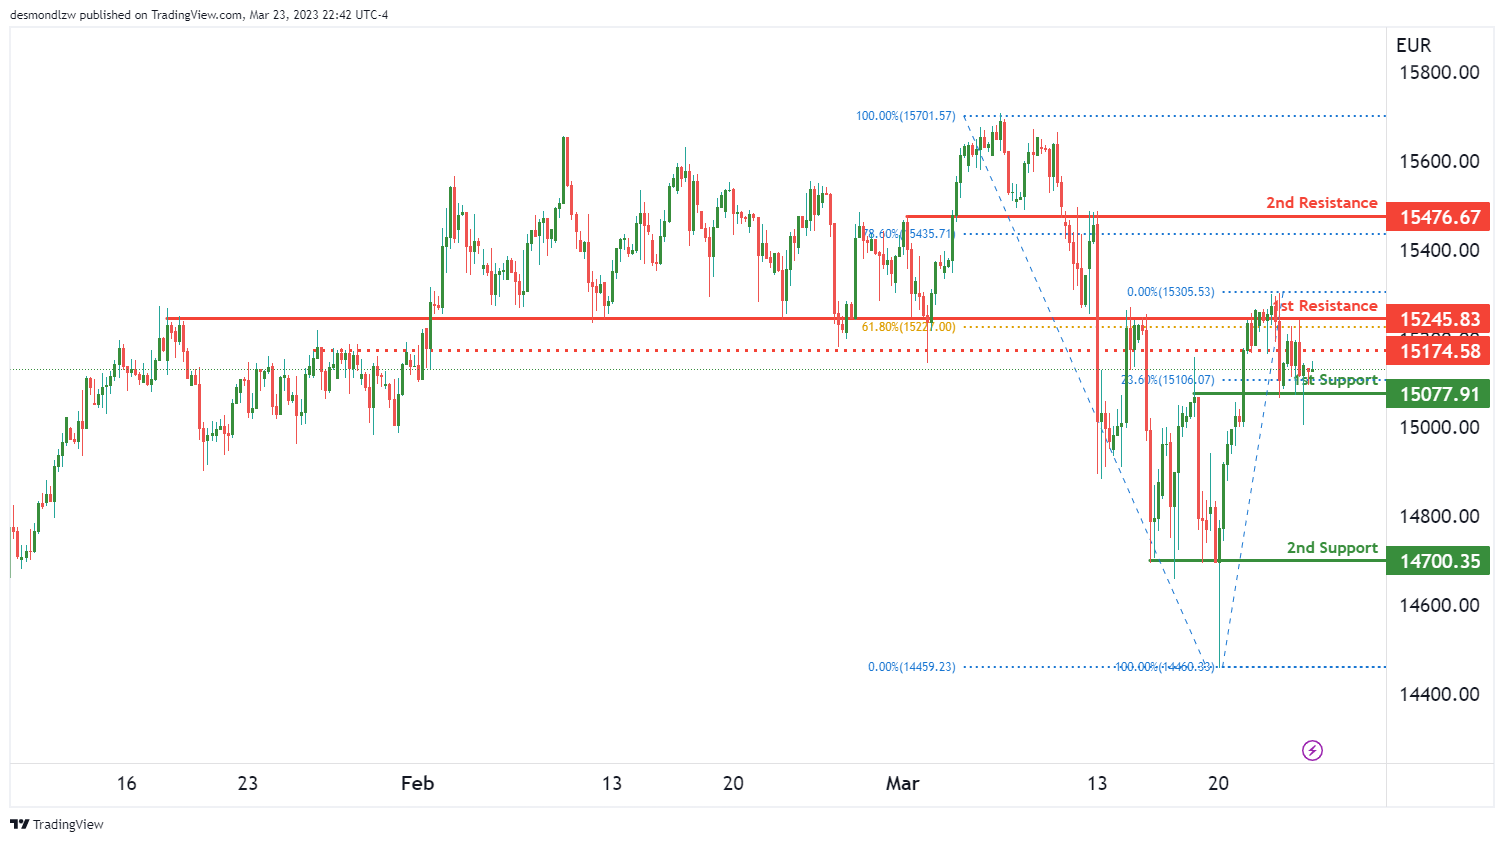
The GER30 chart is currently showing bearish momentum and price could potentially make a bearish break off the first support level at 15077 and drop towards the second support level at 14700, which is a multi-swing low support level that has held prices up in the past. The first support level is an overlap support and has a 23.60% Fibonacci retracement lining up with it.
On the resistance side, the first resistance level at 15245 is an overlap resistance level and has a 61.80% Fibonacci retracement lining up with it. If price were to rise from the current level, it could face selling pressure at this level. If price were to break through this resistance, it could potentially rise towards the second resistance level at 15476, which is also an overlap resistance level and has a 78.60% Fibonacci retracement lining up with it.
There is an intermediate resistance at 15174 between where price is currently and the first resistance level. This level could also act as a selling pressure zone if price were to rise towards it.
BTC/USD:
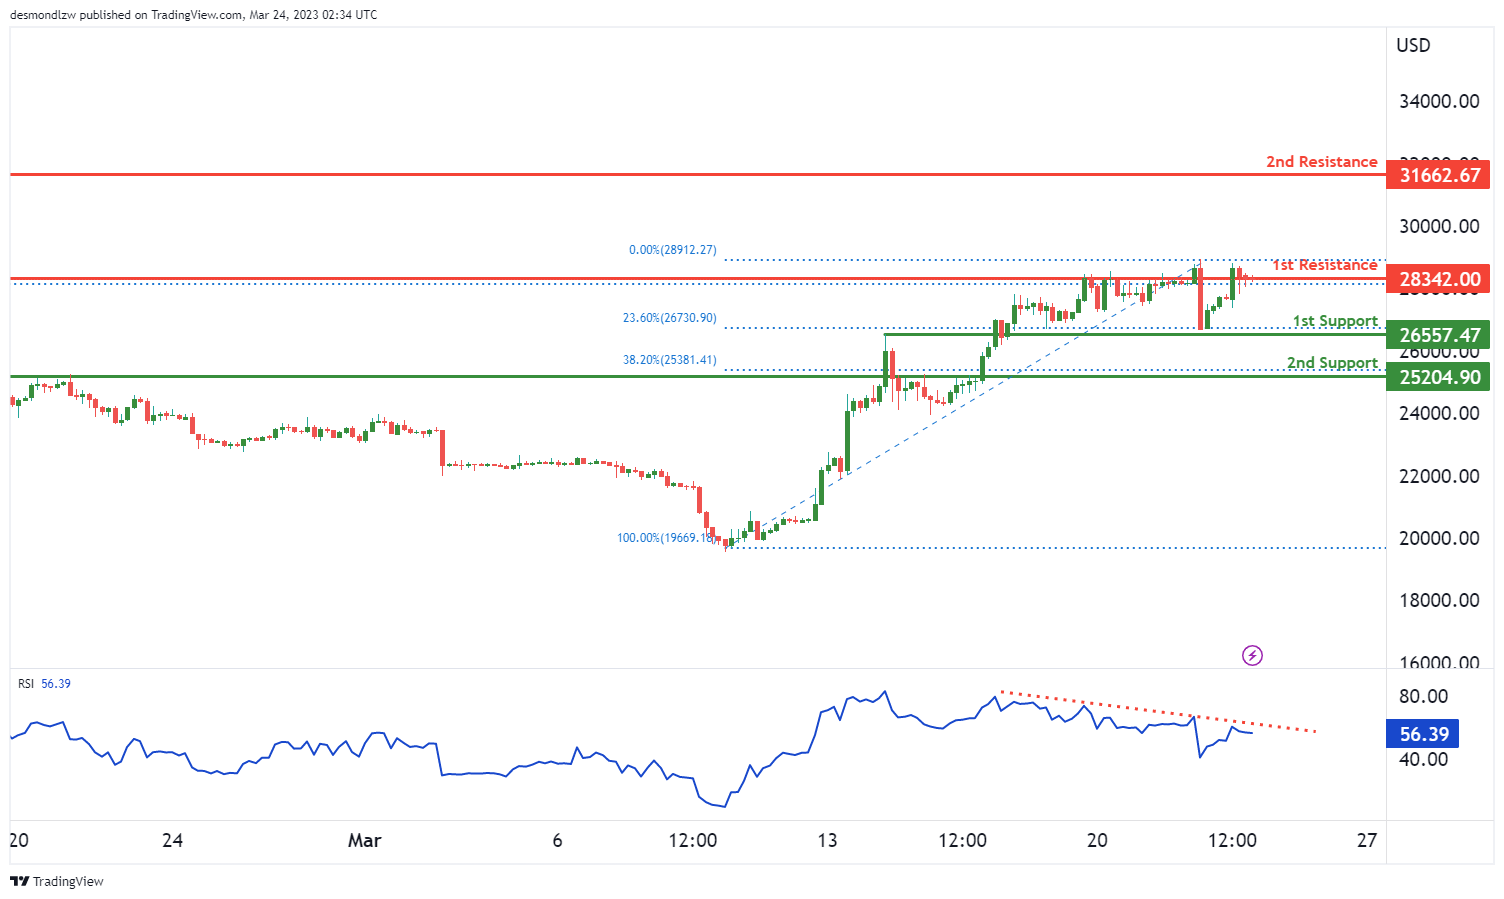
The BTC/USD chart is currently showing a bearish momentum, suggesting that prices may fall further. Price could potentially make a bearish reaction off the first resistance level at 28342 and drop towards the first support level at 26557. This support level is an overlap support and has a 23.60% Fibonacci retracement lining up with it, which could provide a strong level of buying interest. If the price were to break through this level, it could drop further towards the second support level at 25204, which is also an overlap support and has a 38.20% Fibonacci retracement lining up with it.
On the resistance side, the first resistance level is at 28342. This level is a multi-swing high resistance and could provide a strong level of selling pressure. If the price were to break through this resistance, it could potentially rise towards the second resistance level at 31662, which is a swing high resistance.
US500
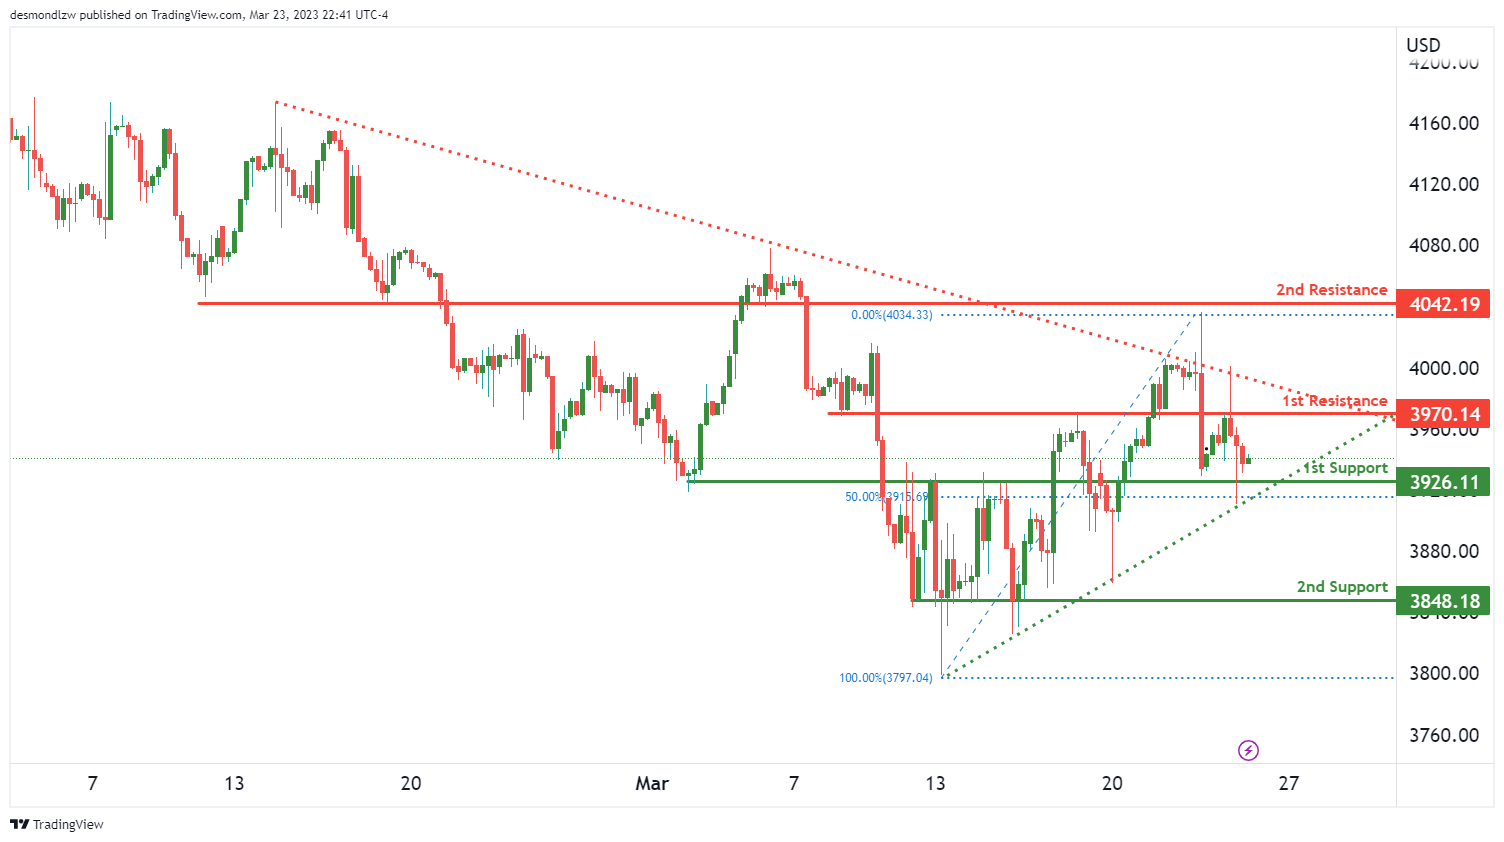
The US500 chart is currently showing a neutral momentum as it is below a major descending trend line which suggests bearish momentum, while also being above a major ascending trend line indicating further bullish momentum. Price could potentially fluctuate between the first resistance level at 3970 and the first support level at 3926.
The first support level at 3926 is an overlap support and has a 50% Fibonacci retracement lining up with it, making it a strong level of buying interest. If price were to break through this level, it could potentially drop towards the second support level at 3848, which is a multi-swing low support and has held prices up in the past.
On the resistance side, the first resistance level at 3970 is an overlap resistance level. If price were to rise from the current level, it could potentially face selling pressure at this level. If price were to break through this resistance, it could potentially rise towards the second resistance level at 4042, which is also an overlap resistance level.
ETH/USD:
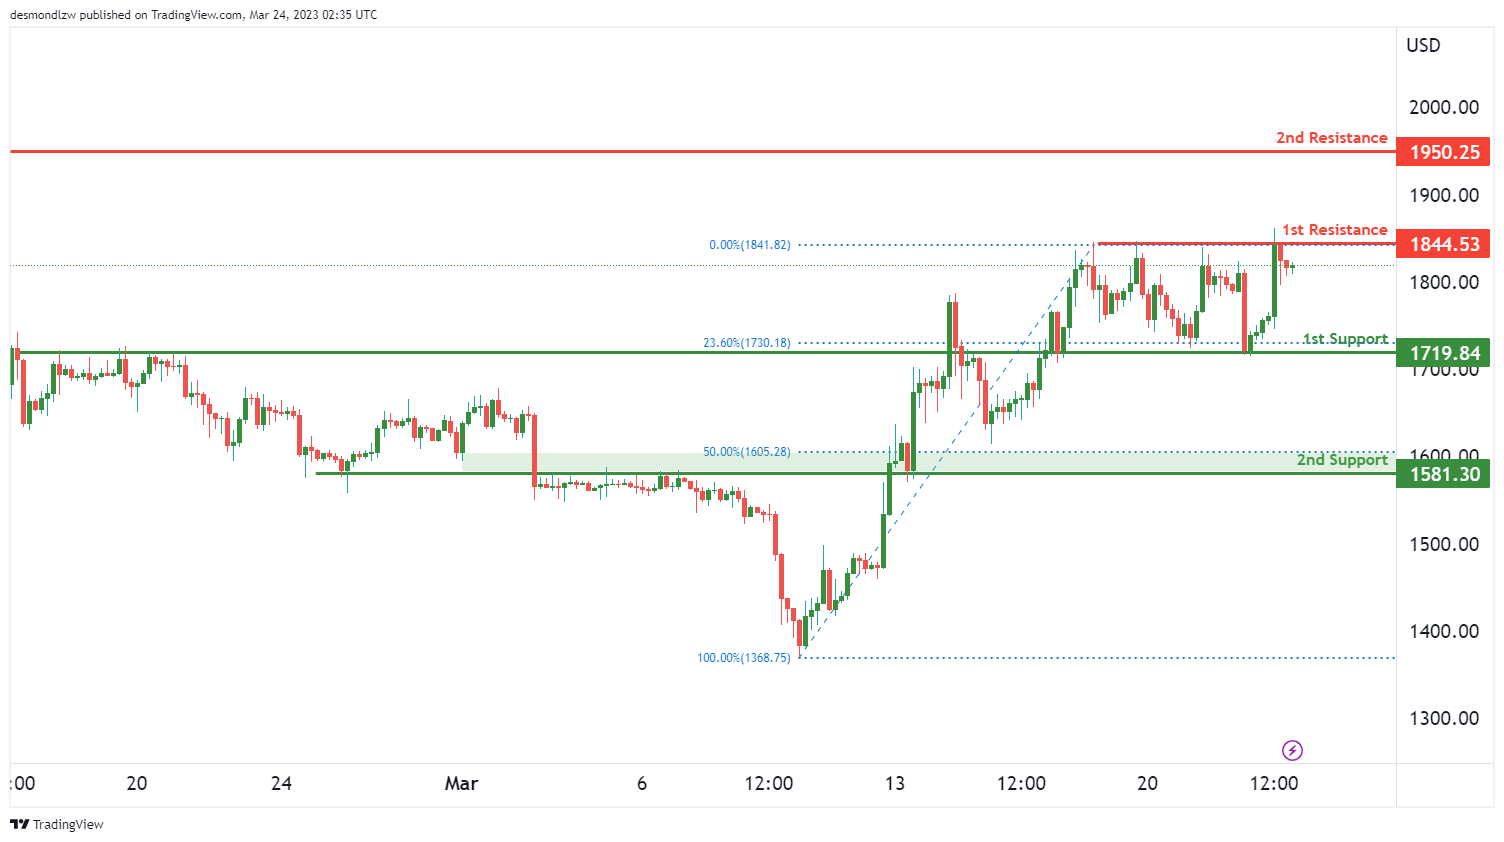
The ETH/USD chart is currently showing a bearish momentum, and price could potentially make a bearish reaction off the first resistance level at 1844.53 and drop towards the first support level at 1719.84. This support level is an overlap support and has a 23.60% Fibonacci retracement lining up with it. If price were to break through this level, it could potentially drop further towards the second support level at 1581.30, which is another overlap support and has a 50% Fibonacci retracement lining up with it.
On the resistance side, the first resistance level is at 1844.53, which is a multi-swing high resistance level. If price were to rise from the current level, it could face selling pressure at this level. If price were to break through this resistance, it could potentially rise towards the second resistance level at 1950.25, which is a swing high resistance level.
WTI/USD:
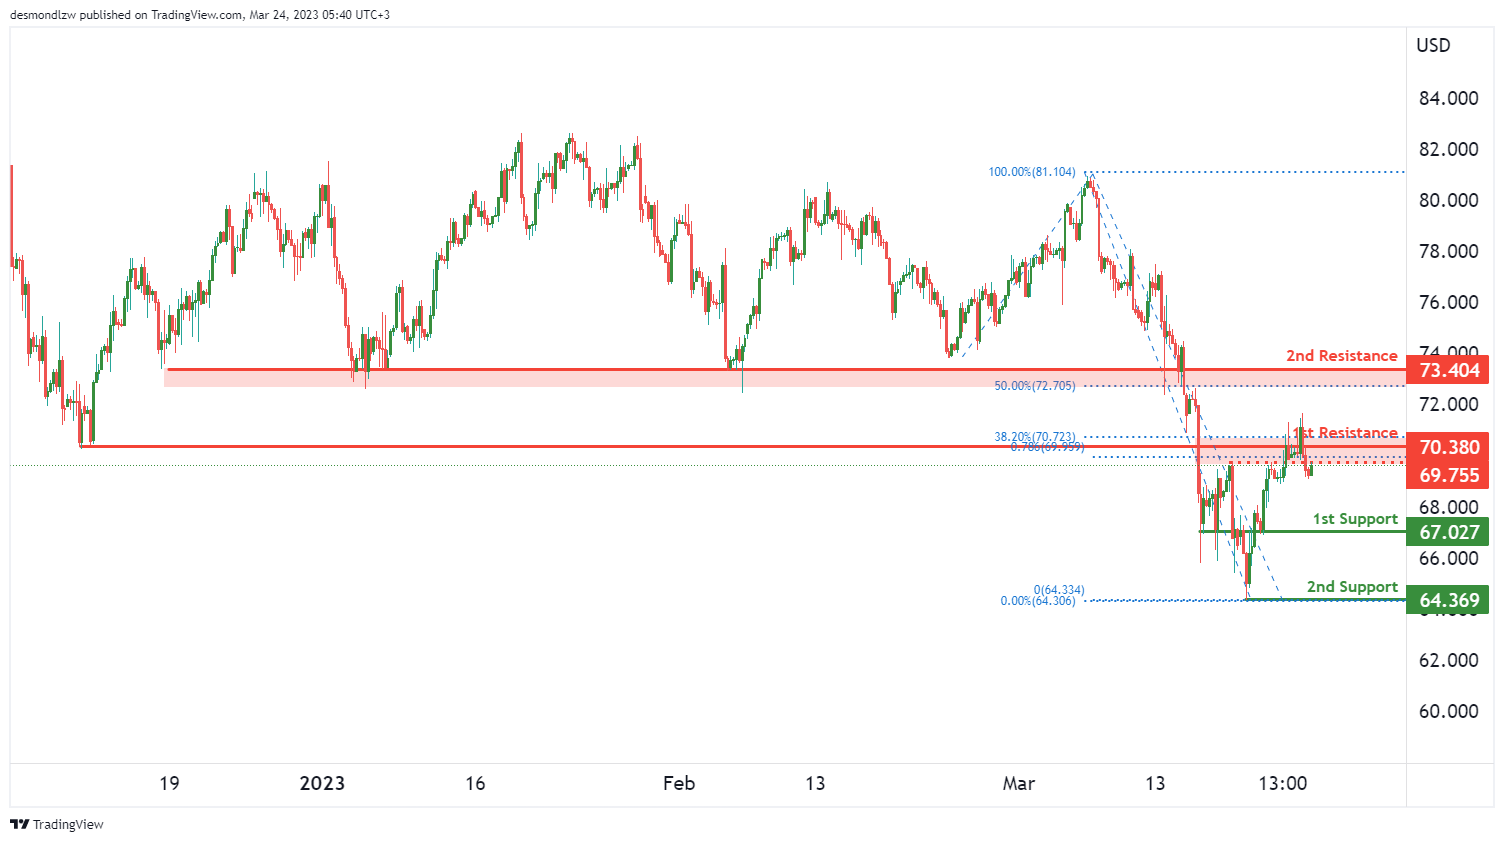
The WTI chart is currently showing a bearish momentum and price could potentially continue in a bearish direction towards the first support level at 67.02. This support level is an overlap support and could provide a strong level of buying interest. If price were to break through this level, it could drop further towards the second support level at 64.36, which is a swing low support and has held prices up in the past.
On the resistance side, the first resistance level is at 70.38, which is a pullback resistance level and has a 38.20% Fibonacci retracement lining up with it. If price were to rise from the current level, it could face selling pressure at this level. If price were to break through this resistance, it could potentially rise towards the second resistance level at 73.40, which is another pullback resistance level and has a 50% Fibonacci retracement lining up with it.
There is also an intermediate resistance at 69.75 between the current price and the first resistance level, which could provide a minor hurdle for prices to overcome before testing the first resistance.
XAU/USD (GOLD):
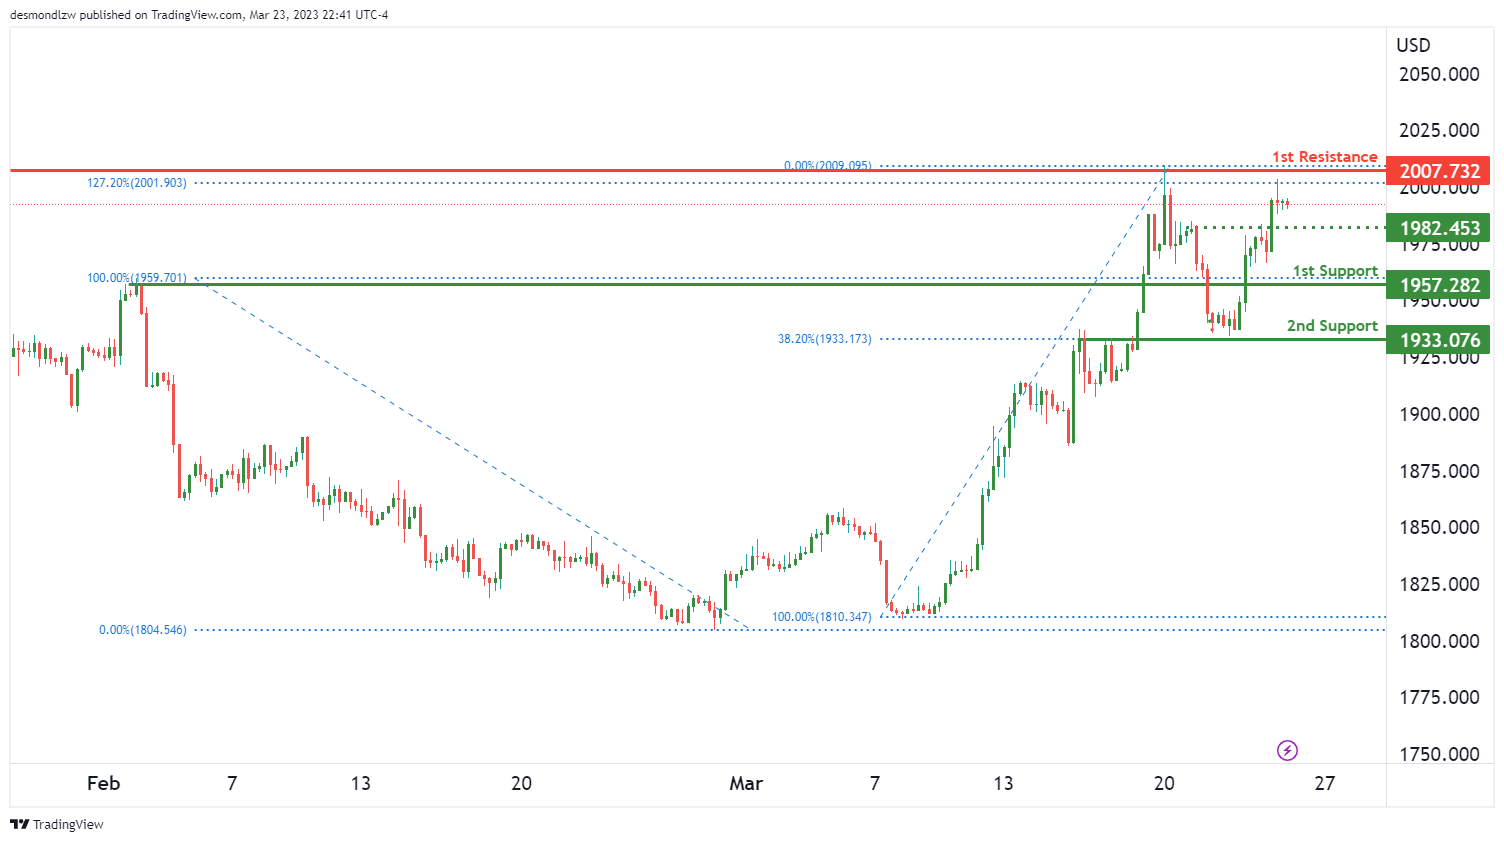
The XAU/USD chart is currently showing a bearish momentum. Price could potentially make a bearish reaction off the first resistance level at 2007 and drop towards the first support level at 1957. This support level is an overlap support and has held prices up in the past. If price were to break through this level, it could drop further towards the second support level at 1933, which is also an overlap support level.
On the resistance side, the first resistance level is at 2007. This level is a swing high resistance and has a 127% Fibonacci extension lining up with it. If price were to rise from the current level, it could face selling pressure at this level. There is also an intermediate support level at 1982, which could act as a pullback support if price were to drop from the current level.
Japan CPI core down sharply to 3.1%, but core-core rose to 40-yr high
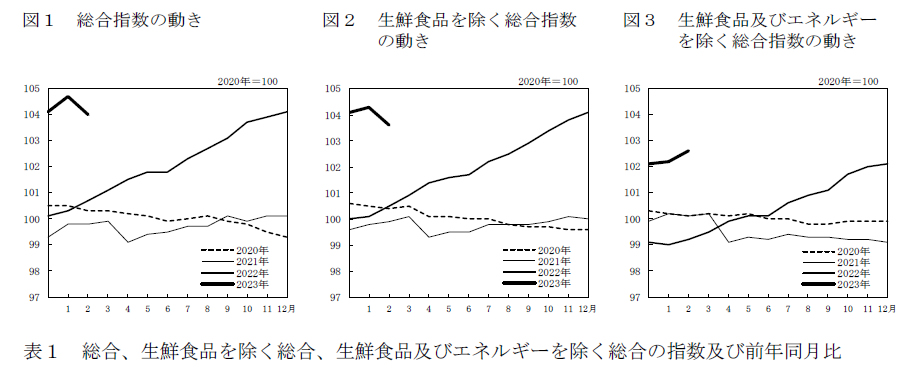
Japan's headline CPI in February experienced a sharp slowdown from 4.3% yoy to 3.3% yoy, falling below the expected 4.1% yoy. CPI core (all items excluding food) dropped from 4.2% yoy to 3.1% yoy, meeting expectations. Meanwhile, CPI core-core (all items excluding food and energy) rose from 3.2% yoy to 3.5% yoy, surpassing the anticipated 3.4% yoy.
Despite the steep decline in CPI core from a 41-year high of 4.2% to 3.1%, the figure remains well above the Bank of Japan's (BoJ) 2% target. The core-core reading, closely monitored by the BoJ as an indicator of domestic demand, reached its highest rate since January 1982.
The data suggests that incoming BoJ Governor Kazuo Ueda may need to address a shift from cost-push inflation to demand-driven inflation, which could prove more sustainable.
Japan PMIs: Growth continues with strong services but struggling manufacturing
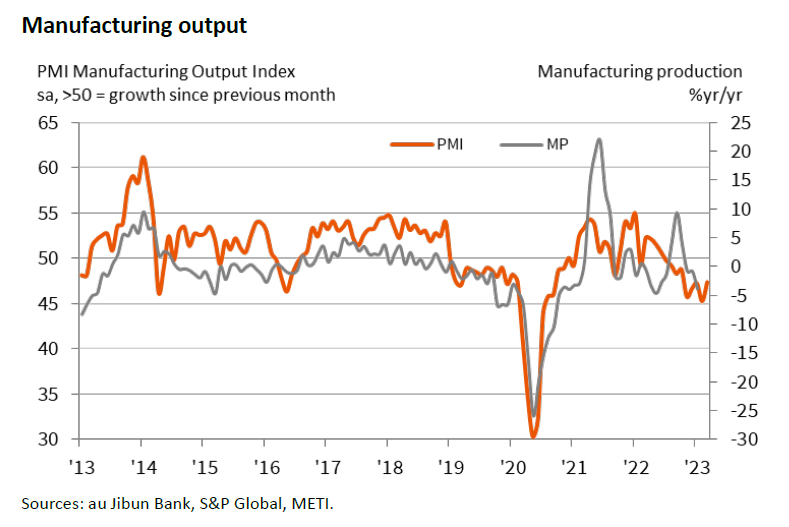
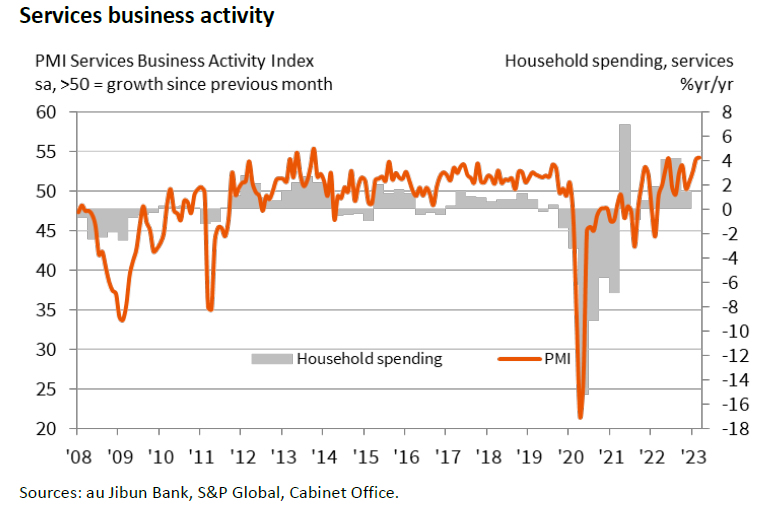
Japan PMI Manufacturing rose from 47.7 to 48.6 in March, slightly above expectation of 48.2. PMI Manufacturing Output rose from 45.3 to 47.4. PMI Services ticked up from 54.0 to 54.2, the best reading since October 2013. PMI Composite improved from 51.1 to 51.9.
Japanese private sector firms experienced growth for the third consecutive month, with the services sector witnessing a notable improvement. Demand conditions strengthened, as government support and the lifting of COVID-19 restrictions in mainland China led to increased activity and new orders.
However, the manufacturing sector continued to face challenges, with output and new orders still contracting, albeit at a slower rate than February. Manufacturers reported ongoing supply chain normalization, as supplier delivery times lengthened at the slowest pace since October 2020.
Australia PMI composite dropped to 48.1, renewed contraction
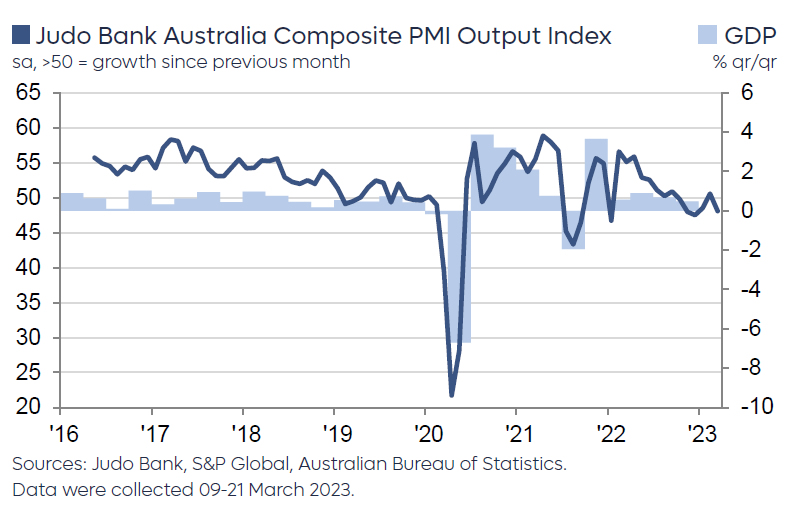
Australia PMI Manufacturing dropped from 50.5 to 48.7 in March, a 34-month low. PMI Services dropped from 50.7 to 48.2, a 3-month low. PMI Composite dropped from 50.6 to 48.1, a 3-month low. All readings indicated renewed contraction in the private sector following improvements in February.
Looking at some details, the results indicate a continued economic slowdown, with composite output and new orders indexes at their lowest since the 2021 Delta lockdowns. Despite easing labor demand, employment indexes suggest businesses are still looking to expand their workforce in 2023. Price indicators have eased but remain elevated, with Australian inflation peaking in late 2022. Service industry input prices are still high, suggesting potential inflationary pressures in 2023 due to labor costs and energy prices.
As the Reserve Bank of Australia (RBA) prepares for its April meeting, it faces a tough decision on whether to pause its tightening cycle amid global financial uncertainty, strong employment numbers, and concerns about inflation levels. Some argue that the RBA should raise the cash rate closer to 4% before pausing to observe the economy's performance over the next few months.
Warren Hogan, Chief Economic Advisor at Judo Bank noted: "There is no point pausing for a month before hiking again. The RBA Board need to get the cash rate to a level that they think will buy them the time to observe how the economy unfolds for at least three months, if not longer."
Cliff Notes: The End of the Global Tightening Cycle
Key insights from the week that was.
The FOMC and Bank of England both delivered 25bp rate hikes at their March meeting, bringing their respective tightening cycles to an end – in our view. The RBA’s policy tightening is also near its end, with one final 25bp move to occur in May.
The March RBA meeting minutes gave a detailed assessment of only one policy option, their decision to hike by 25bps. Though discussion of a pause at the March meeting was not evident, the Board “agreed to reconsider the case for a pause at the following meeting, recognising that pausing would allow for additional time to reassess the outlook for the economy”. It was also interesting to see the Board’s in depth assessment of market pricing, particularly as their commitment to considering a pause in April pre-dated current developments in the global banking sector, which have seen market pricing flip from hikes to cuts offshore and in Australia.
As discussed by Chief Economist Bill Evans in a video update midweek, the minutes support our view of a pause from the RBA in April; however, we do not believe this will mark the end of the tightening cycle. By May, we expect the Board will be presented with a strong Q1 CPI report and an updated set of economic forecasts that justify one final 25bp rate hike, raising the cash rate from 3.60% to a peak of 3.85% in order to fully ensure that inflation risks are contained. Developments thereafter will be centred on the abrupt slowing of growth and easing inflation over the second half of 2023, warranting the RBA remain on hold over the rest of the year to assess before easing in 2024, with 150bps of rate cuts through to mid-2025. For an in-depth summary and state-by-state breakdown of the growth outlook, see the latest edition of Westpac’s Coast-to-Coast.
Before moving on, a quick note on Australian manufacturing. The latest ACCI-Westpac Business Survey reported that manufacturing conditions, after having stalled flat in Q4 2022, posted a modest improvement in Q1 2023. That said, the overall tone of the survey is still downbeat, with expectations for future activity moderating amid broadening headwinds for the sector. Most notably, Australian manufacturers are facing acute cost pressures – a net 70% reporting an increase in input prices in the period – as surging energy costs continue to impact, resulting in margin squeeze and a loss of competitiveness. With regards to production, not only is labour still being cited as a major limiting factor, but evidence is also beginning to emerge that manufacturers are facing pressures in sourcing financing.
Turning to the US, at their March meeting, the FOMC kept the immediate focus on the fight against inflation by hiking 25bps to a mid-point of 4.875% while also recognising the tightening of financial conditions to come as a result of this month’s Silicon Valley Bank and Signature Bank failures. While uncertain in time and scale, the inclusion of “Recent developments are likely to result in tighter credit conditions for households and businesses and to weigh on economic activity, hiring, and inflation” makes clear the Committee’s expectation that the cost to the economy from this crisis of confidence in US regional banks will prove significant. The FOMC could certainly justify hiking once more in May to a peak of 5.125%. However, given the risks around financial conditions and confidence, holding off to assess would be the prudent course, particularly given policy is already contractionary and forward indicators for inflation and the labour market were pointing down ahead of this shock. Accordingly, we confirm our view that the federal funds rate has now peaked for this cycle.
Against market expectations of 3-4 cuts by January 2024, we also confirm our view that the federal funds rate is likely to remain on hold through the remainder of 2023, with a clear need to guard against inflation risks over the period. It is only once inflation is back near target that the FOMC will be confident to cut and, at that time, we believe they will do so aggressively, by 200bps in 2024 and a further 75bp in 2025, back to 2.125% -- a broadly neutral policy level. In assessing the risks to this view, it is important to emphasise as Chair Powell did in the press conference, that there are now multiple financial condition dynamics to assess in real time, each with its own timeline and risk profile. Even as rates are cut in 2024, a tighter regulatory focus on regional banks with less than $250bn in assets will likely continue to constrain lending and consequently investment and employment. It is only after the regulatory regime is reset and confidence fully restored that easier policy will bring growth back above trend on a sustainable basis. This is unlikely before late-2024, at the earliest.
Over in the UK, the Bank of England (BoE) also delivered a 25bp hike, albeit with two members voting instead for no change. In the communications from the meeting, there was little concern over the recent upside surprise for inflation which came as a result of core goods inflation, primary clothing and footwear “which tend to be volatile”. Services inflation meanwhile had proven to be marginally weaker than forecast in February, and the MPC anticipate that Q2 2023 will see a significant deceleration to a rate lower than forecast in February given falls in wholesale energy prices and a three-month extension of the Government’s Energy Price Guarantee from April. It is notable that this confidence in the outlook for inflation comes despite the economy continuing to outperform expectations and the Government giving additional modest support to the economy in the Spring Budget.
Like in the US, another 25bp hike could certainly be justified by the BoE in coming months, though it would come with the risk of a swift reversal. To us, the prudent course for the BoE is instead to remain on hold, providing stability and confidence while the already-contractionary stance of policy and global uncertainty works to cool inflation pressures. Albeit with one more hike to go, on our expectations, the ECB clearly finds itself in a similar position. This week, it was constructive to see ECB speakers much more conscious of the broad array of risks they face for the remainder of 2023 and into 2024.
USD/JPY At Risk of Additional Decline, PMI’s Next
Key Highlights
- USD/JPY started a fresh decline below the 133.50 support zone.
- A major bearish trend line is forming with resistance at 131.80 on the 4-hours chart.
- EUR/USD and GBP/USD rallied above 1.0800 and 1.2220 respectively.
- The US Manufacturing PMI could decline from 47.3 to 47.0 in March 2023 (Preliminary).
USD/JPY Technical Analysis
The US dollar started a fresh decline from well above 134.00 against the Japanese Yen. USD/JPY traded below the 133.50 and 133.00 levels to enter a bearish zone.
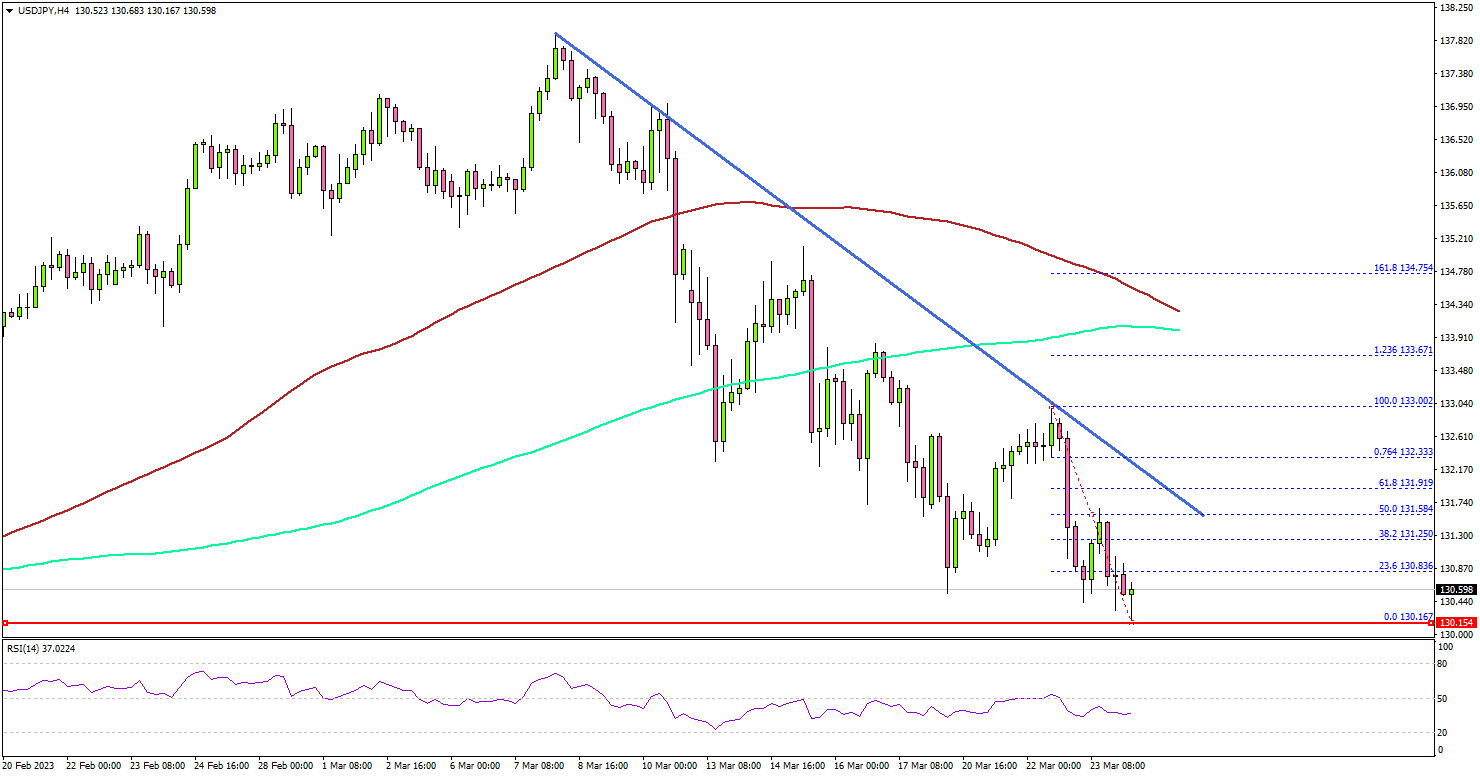
Looking at the 4-hours chart, the pair moved below the 132.50 support level, the 100 simple moving average (red, 4-hours), and the 200 simple moving average (green, 4-hours).
The pair even traded below the 131.20 support. A low is formed near 130.40 and the pair is now consolidating losses. An immediate resistance on the upside is near the 131.55 level.
The first major resistance is near the 131.80 level. There is also a major bearish trend line forming with resistance at 131.80 on the same chart. The next major resistance is near the 132.20. A clear move above the 132.20 resistance might send the pair towards the 133.00 zone.
Any more gains might send the pair towards 133.50 or even 134.00. On the downside, an immediate support is near the 130.50.
The next major support is near the 130.00 level, below which there is a risk of a move towards the 128.80 level or 127.50 in the coming days.
Looking at EUR/USD, the pair gained strength above the 1.0800 resistance zone and even spiked above the 1.0880 level.
Economic Releases
- Germany’s Manufacturing PMI for March 2023 (Preliminary) - Forecast 47.0, versus 46.3 previous.
- Germany’s Services PMI for March 2023 (Preliminary) - Forecast 51.0, versus 50.9 previous.
- Euro Zone Manufacturing PMI for March 2023 (Preliminary) – Forecast 49.0, versus 48.5 previous.
- Euro Zone Services PMI for March 2023 (Preliminary) – Forecast 52.5, versus 52.7 previous.
- US Manufacturing PMI for March 2023 (Preliminary) – Forecast 47.0, versus 47.3 previous.
- US Zone Services PMI for March 2023 (Preliminary) – Forecast 50.5, versus 50.6 previous
Elliott Wave Favors More Downside in GBPJPY
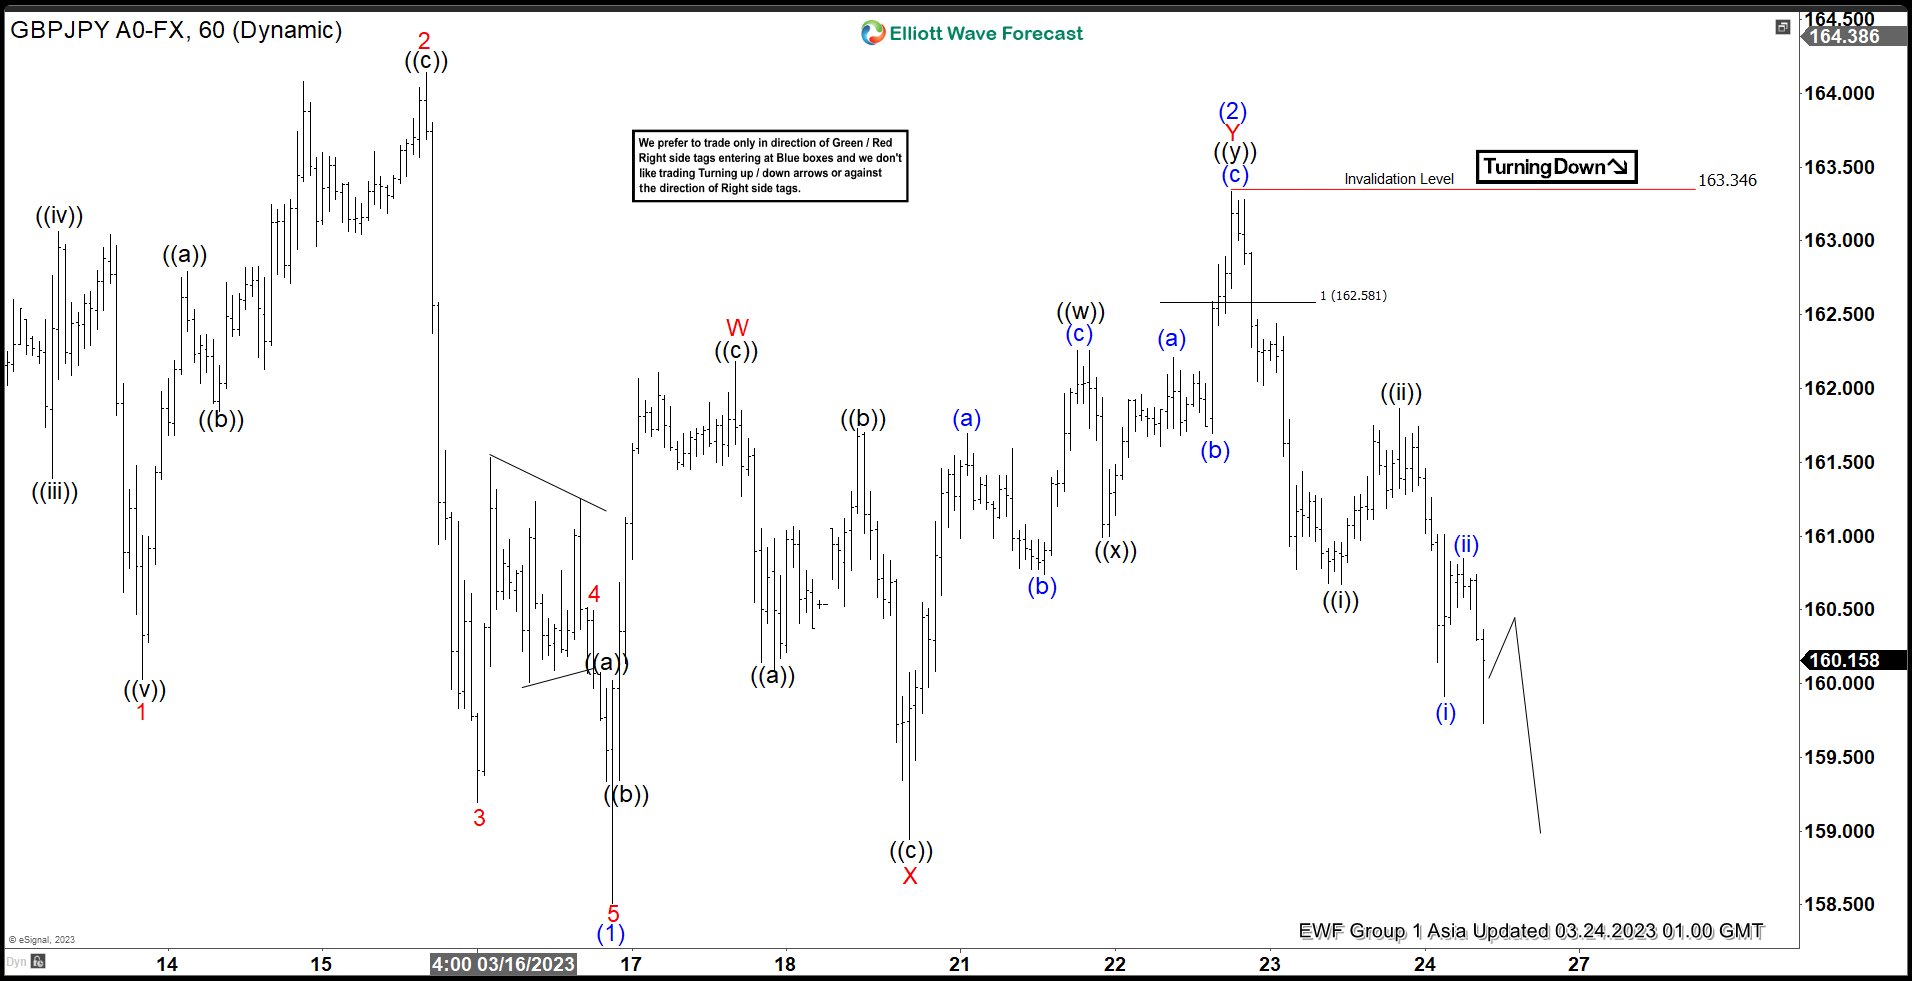
Decline from 2.28.2023 is in progress as a 5 waves impulse Elliott Wave structure. Down from 2.28 high, wave 1 ended at 160.02 and rally in wave 2 ended at 164.14. Pair resumes lower in wave 3 towards 159.19, and wave 4 ended at 160.49. Last leg lower wave 5 ended at 158.51 which completed wave (1). Wave (2) corrective rally ended at 163.34 as a double three Elliott Wave structure. Up from wave (1), wave W ended at 162.18, and pullback in wave X ended at 158.94. Wave Y higher ended at 163.34 which completed wave (2).
Pair resumes lower in wave (3) with internal subdivision as another 5 waves in lesser degree. Down from wave (2), wave ((i)) ended at 160.67 and rally in wave ((ii)) ended at 161.86. Pair has resumed lower in wave ((iii)) and broken below wave ((i)). Down from wave ((ii)), wave (i) ended at 159.91 and wave (ii) rally ended at 161.01. Expect pair to continue lower within wave (iii) of ((iii)). A break below wave (1) at 158.51 would confirm the bearish view and rule out a double correction. Near term, as far as pivot at 163.34 high stays intact, expect rally to fail in 3, 7, or 11 swing for further downside
GBPJPY 1 Hour Elliott Wave Chart
GBPJPY Elliott Wave Video
https://www.youtube.com/watch?v=Ue3pVdKIRDE
AUDNZD Wave Analysis
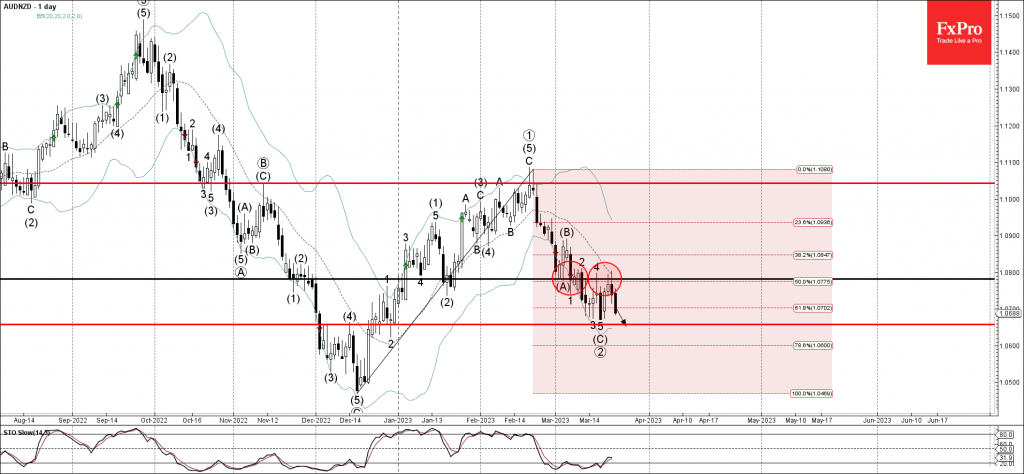
- AUDNZD reversed from resistance level 1.078
- Likely to fall to support level 1.0670
AUDNZD currency pair recently reversed down from the key resistance level 1.078 (former support from the start of March).
The resistance level 1.078 was strengthened by the intersecting 50% Fibonacci correction of the previous upward impulse from December (acting as the resistance after it was broken in March).
AUDNZD can then be expected to fall further toward the next support level 1.0670 (which stopped the previous correction (C)).
Silver Wave Analysis
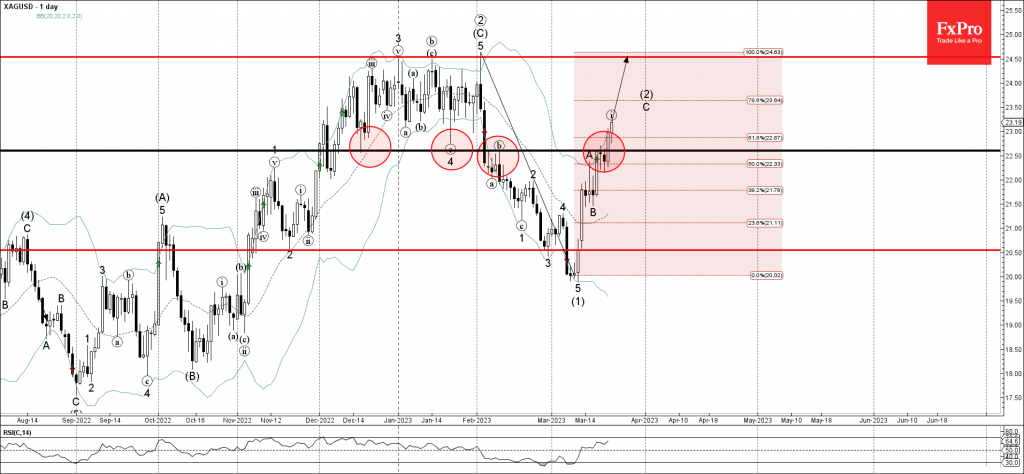
- Silver broke key resistance level 22.60
- Likely to rise to resistance level 24.50
Silver recently broke the key resistance level 22.60 (former support from December, which has been reversing the price from February).
The breakout of the resistance level 22.60 coincided with the breakout of the 50% Fibonacci correction of the previous downward impulse (1) from February (which accelerated the active impulse wave C).
Silver can then be expected to rise further toward the next resistance level 24.50 (previous Triple Top from December and January).