

Sample Category Title
Gold Bulls Take a Breather After 1-year High Above 2,000
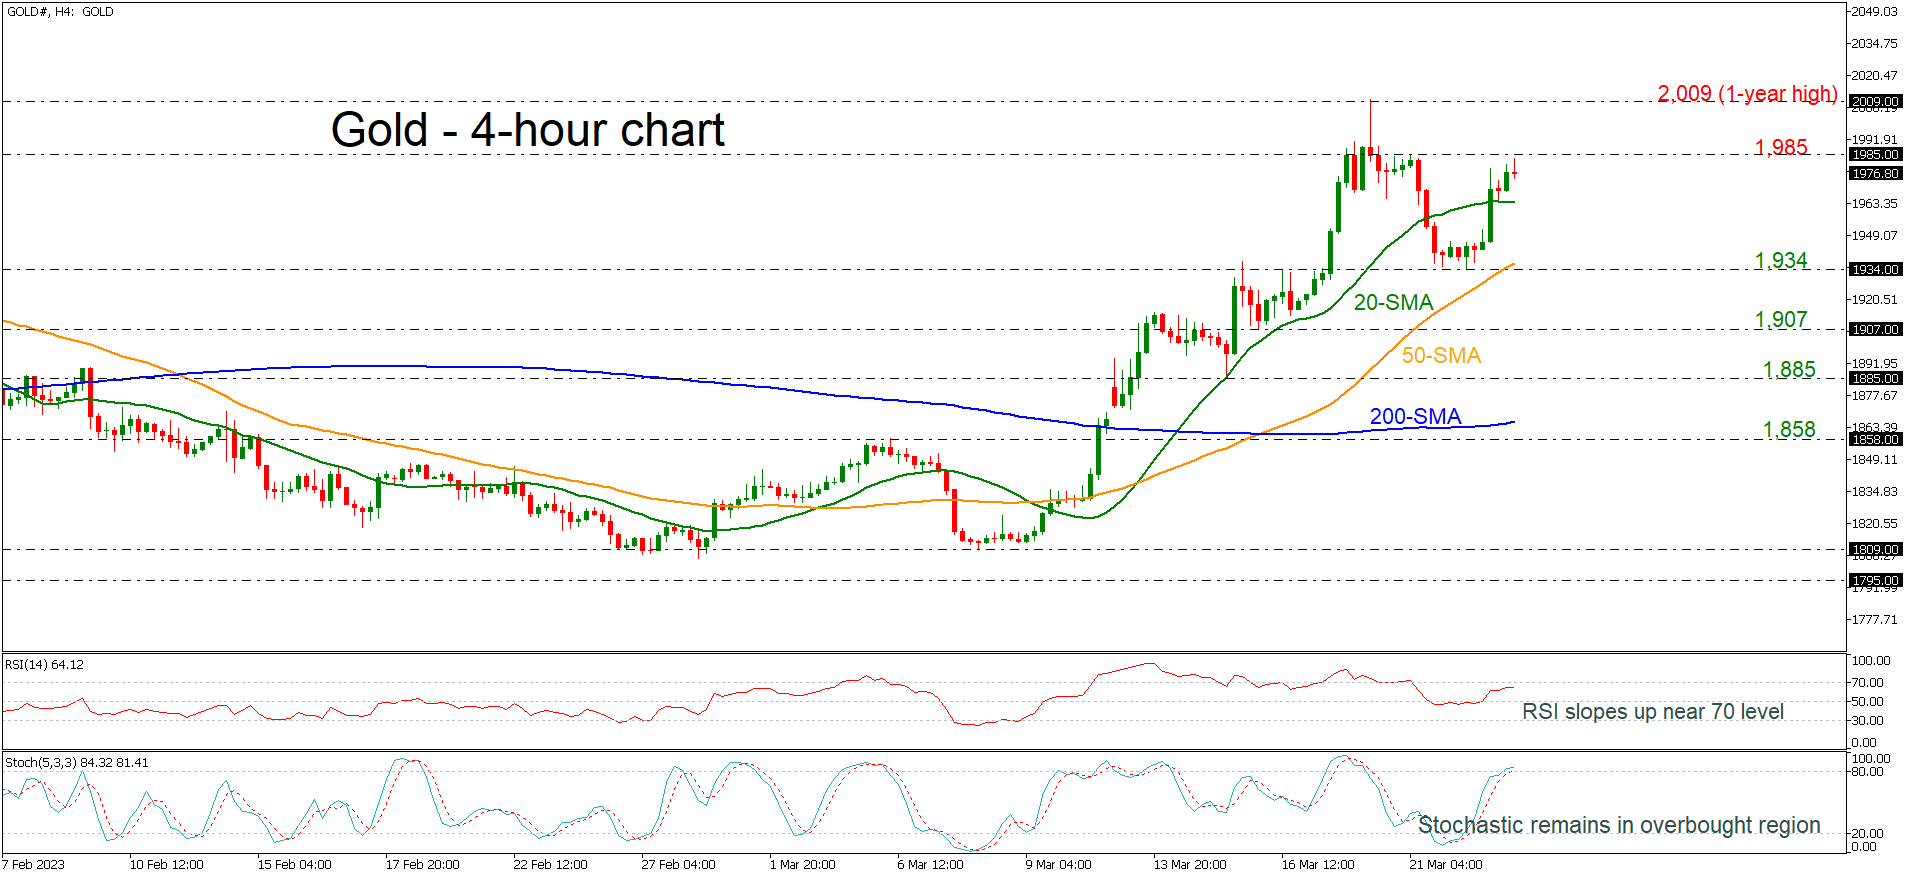
Gold struggled to jump above the immediate resistance of 1,985, keeping its footing above the short-term simple moving averages (SMAs) in the 4-hour chart.
Trend signals remain daunting as regards the market momentum. Some downside correction seems to be building as the RSI has paused its uptrend in the positive area and the stochastics are flattening in the overbought region.
Should the bulls dominate, driving the price above the 1,985 number, the spotlight will shift to the one-month high of 2,009 ahead of the 2,070 obstacle, taken from the peak in March 2022.
In the event the bears take control, the 20-period SMA at 1,964 will come first into view. A violation at this point may see another challenging battle around the 50-period SMA, which is currently near the 1,934 support. If sellers claim that zone this time, the 1,907 barrier could immediately add some downside pressure.
In brief, gold continues to send upward trend signals, the odds for an upturn seem to be growing, with the confirmation expected to come above 1,985.
Is the Banking Crisis Over, Or is the Worst Yet to Come?
When the Fed started signalling higher for longer last summer, everybody assumed that the first thing to break would be consumption, followed by big job losses. Few anticipated that the banking sector would get caught up in the crossfire of the Federal Reserve’s battle against high inflation. After all, banks traditionally perform better in higher interest rate environments as their profit margins improve. So why is it that we are now talking about bank runs, in an eerie reminder of the days of the 2008 Financial Crisis, and what are the risks of this panic escalating?
SVB: the first domino to fall
It all started with Silicon Valley Bank – a mid-sized Californian bank that mostly lent to venture-backed tech and life science companies. The bank was well capitalized to begin with but found itself unable to meet clients’ requests to withdraw deposits as tech startups began struggling for cash under the weight of rising borrowing costs. Subsequently, SVB resorted to selling its assets to raise funds, most of which were locked in 10-year Treasury notes.
However, the timing to sell bonds couldn’t have been worse for SVB as sovereign bond prices globally have been hammered over the past year as their yields have soared on rate hike expectations. This meant that in its bid to find more cash, the bank incurred heavy losses when it was forced to sell its bond holdings at a lower price than what it purchased them for.
It can be argued that this business model was unique to SVB and it’s unlikely that other regional banks would face similar risks. But the problem is, if liquidity has started to dry up for SVB’s customers, it’s likely that other small-to-medium-sized businesses across America are having to tap into their cash deposits to stay afloat.
Are authorities doing enough?
More importantly, once there is a loss of confidence in the banking sector, it is hard to stem the outflow of cash from worried depositors. That is why US banks are far from being out of the woods and is also the reason the government is bowing to pressure to provide additional safeguards. US Treasury Secretary Janet Yellen has signalled that the deposit guarantees agreed for SVB’s depositors were not a one-off and depositors of other banks would be protected too if there is further contagion.
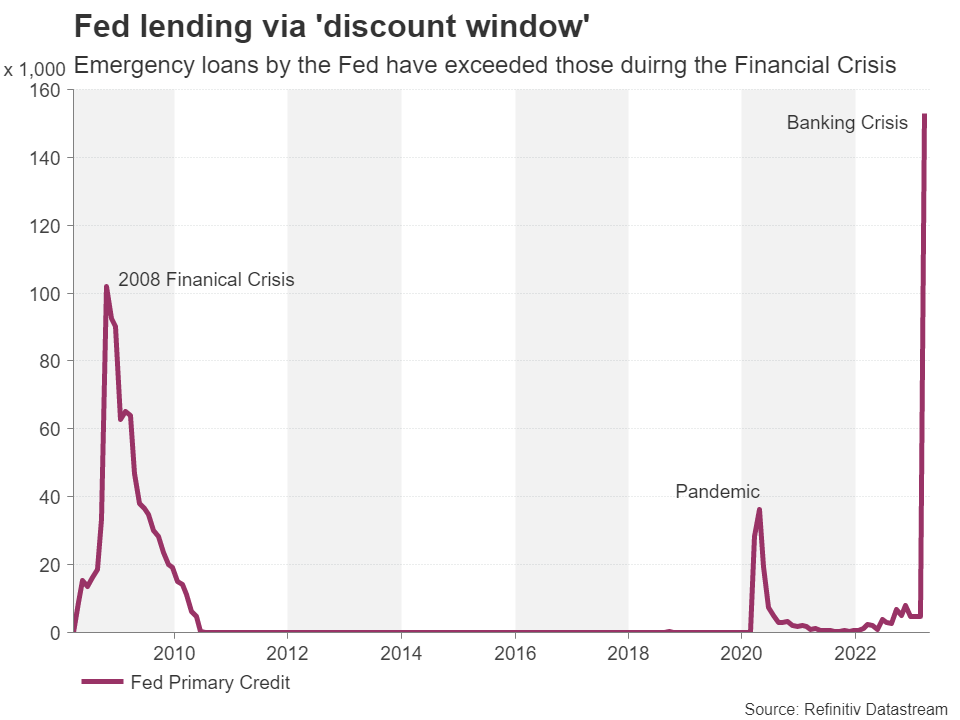
The Fed on its part launched a new emergency lending facility – the Bank Term Funding Program – and boosted dollar liquidity in the markets by increasing the frequency of its swap lines from weekly to daily operations.
Criticism about preferential treatment
Unfortunately, the combined responses came too late for Signature Bank, whose collapse was also sparked by a run on deposits, most of which were uninsured, just like SVB. Although, there have been suggestions that the decision to shut it down was political due to the bank’s connections to the crypto industry.
Then there is First Republic Bank – another one with high uninsured deposits that had to be rescued with a $30 billion injection by 11 big Wall Street banks. The fact that First Republic caters to a lot of wealthy clients might have played a role as to why there was so much interest to save the bank.
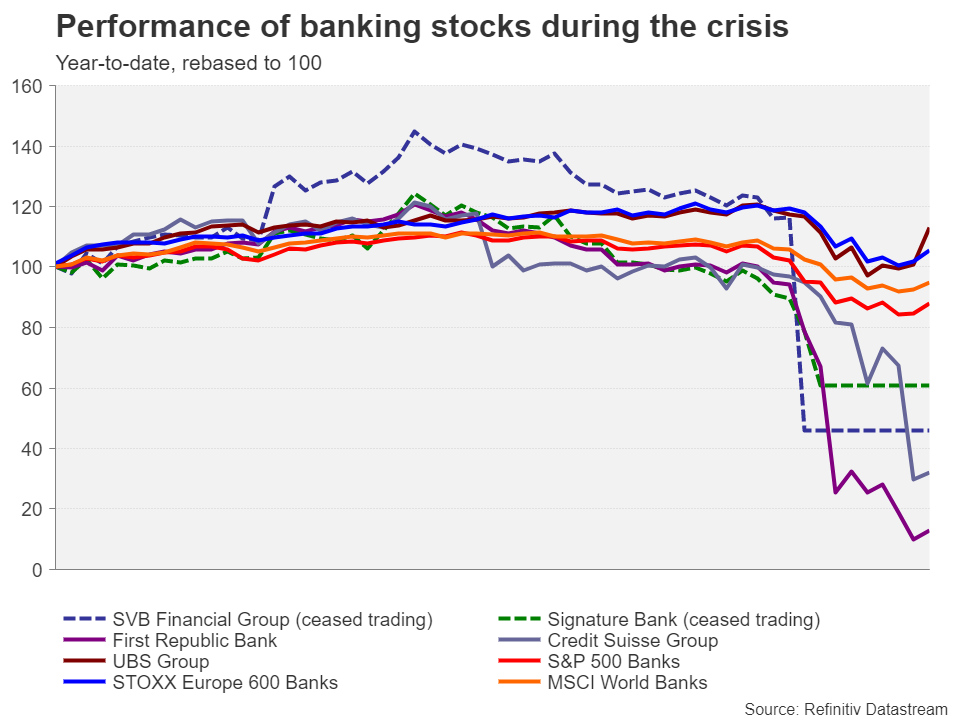
Other regional banks have suffered some degree of deposit runs too, but the outflow appears to be easing – something reflected in the rebound in their share prices. Even Swiss banking giant UBS’ stock is rebounding from the crash that followed after regulators and the Swiss government forced it to absorb its embattled smaller rival Credit Suisse.
Credit Suisse’s demise was a long time coming
It may be one of the oldest banks in the world, but Credit Suisse’s troubles predate this latest banking crisis. Its share price has in effect been in freefall over the past year, as the bank has been unable to draw a line over a series of scandals and mismanagement that have resulted in billions in fines from regulators around the world over the years.
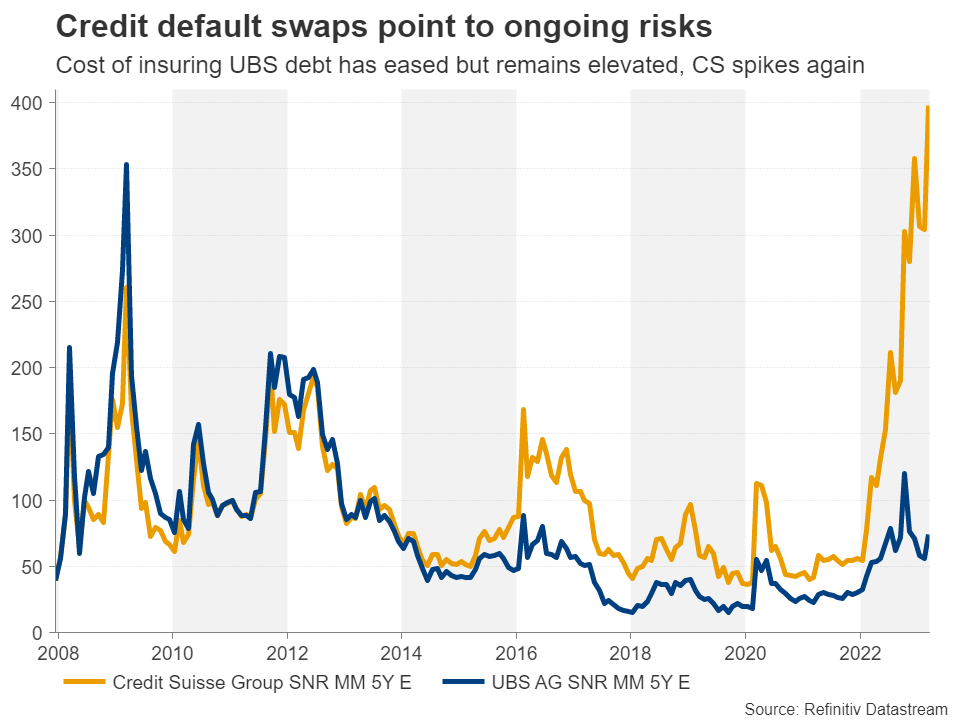
However, Swiss authorities are hoping that this ‘shotgun wedding’ between UBS and Credit Suisse will put an end to all the speculation, especially as the total size of the rescue deal is worth more than the value of Switzerland’s GDP in 2022.
Is the fallout contained or still contagious?
So does this mean that the crisis is fading, or are all the measures that regulators and policymakers have come up with so far merely sticking plasters? It may be too early to tell, but several financial stress indicators are pointing to an easing in investor panic.
For traders, the bigger question is how does this episode affect the outlook for interest rates and therefore the outlook for the major currencies and the various asset classes, in particular, commodities and equities.
Systemic risk is greater in the US
In the euro area, President Lagarde has made it clear the European Central Bank will focus on getting inflation down by raising interest rates and use other tools to help banks with liquidity should they need it. However, in the United States, the situation is quite different. Although the Fed is not about to relinquish its responsibilities on price stability, there is a real risk of the banking problems becoming systemic due to the nature of America’s regional banks.
But even if policymakers decide not to press on with further rate hikes and regulators take their time to bolster banking rules, there is a growing concern and an expectation that banks in the US will toughen their lending standards on their own accord and take less risk until this crisis has fully blown over. This would lead to a significant tightening of financial conditions, which would have a similar effect to rate increases by the Fed.
A recession has become more inevitable
More to the point, a US recession is now looking more likely than before this turmoil began and the Fed going on pause earlier than anticipated may not necessarily prevent one.
That cannot be good news for the US dollar, which has already taken a battering on dimming rate hike bets and worries about the economy. Fresh jitters about the US as well as the global economic outlook have also knocked demand-sensitive commodities such as crude oil. Gold on the other hand has received a major boost, both on safe-haven flows and on the back of the plunge in bond yields.
For Wall Street, however, there isn’t a straightforward relationship with falling Treasury yields and a shallower Fed rate path, as the benefits of lower short- and long-term borrowing costs would have to be weighed against the impact a potentially weaker economy would have on corporate earnings.
But perhaps the worst outcome for the markets is if this crisis of confidence in the banking system drags on for several months without completely evaporating, toppling more banks along the way, until decisive action is taken by politicians, regulators and central banks.
WTI Oil Futures Bounce Off 15-Month Low; Bearish Bias Intact
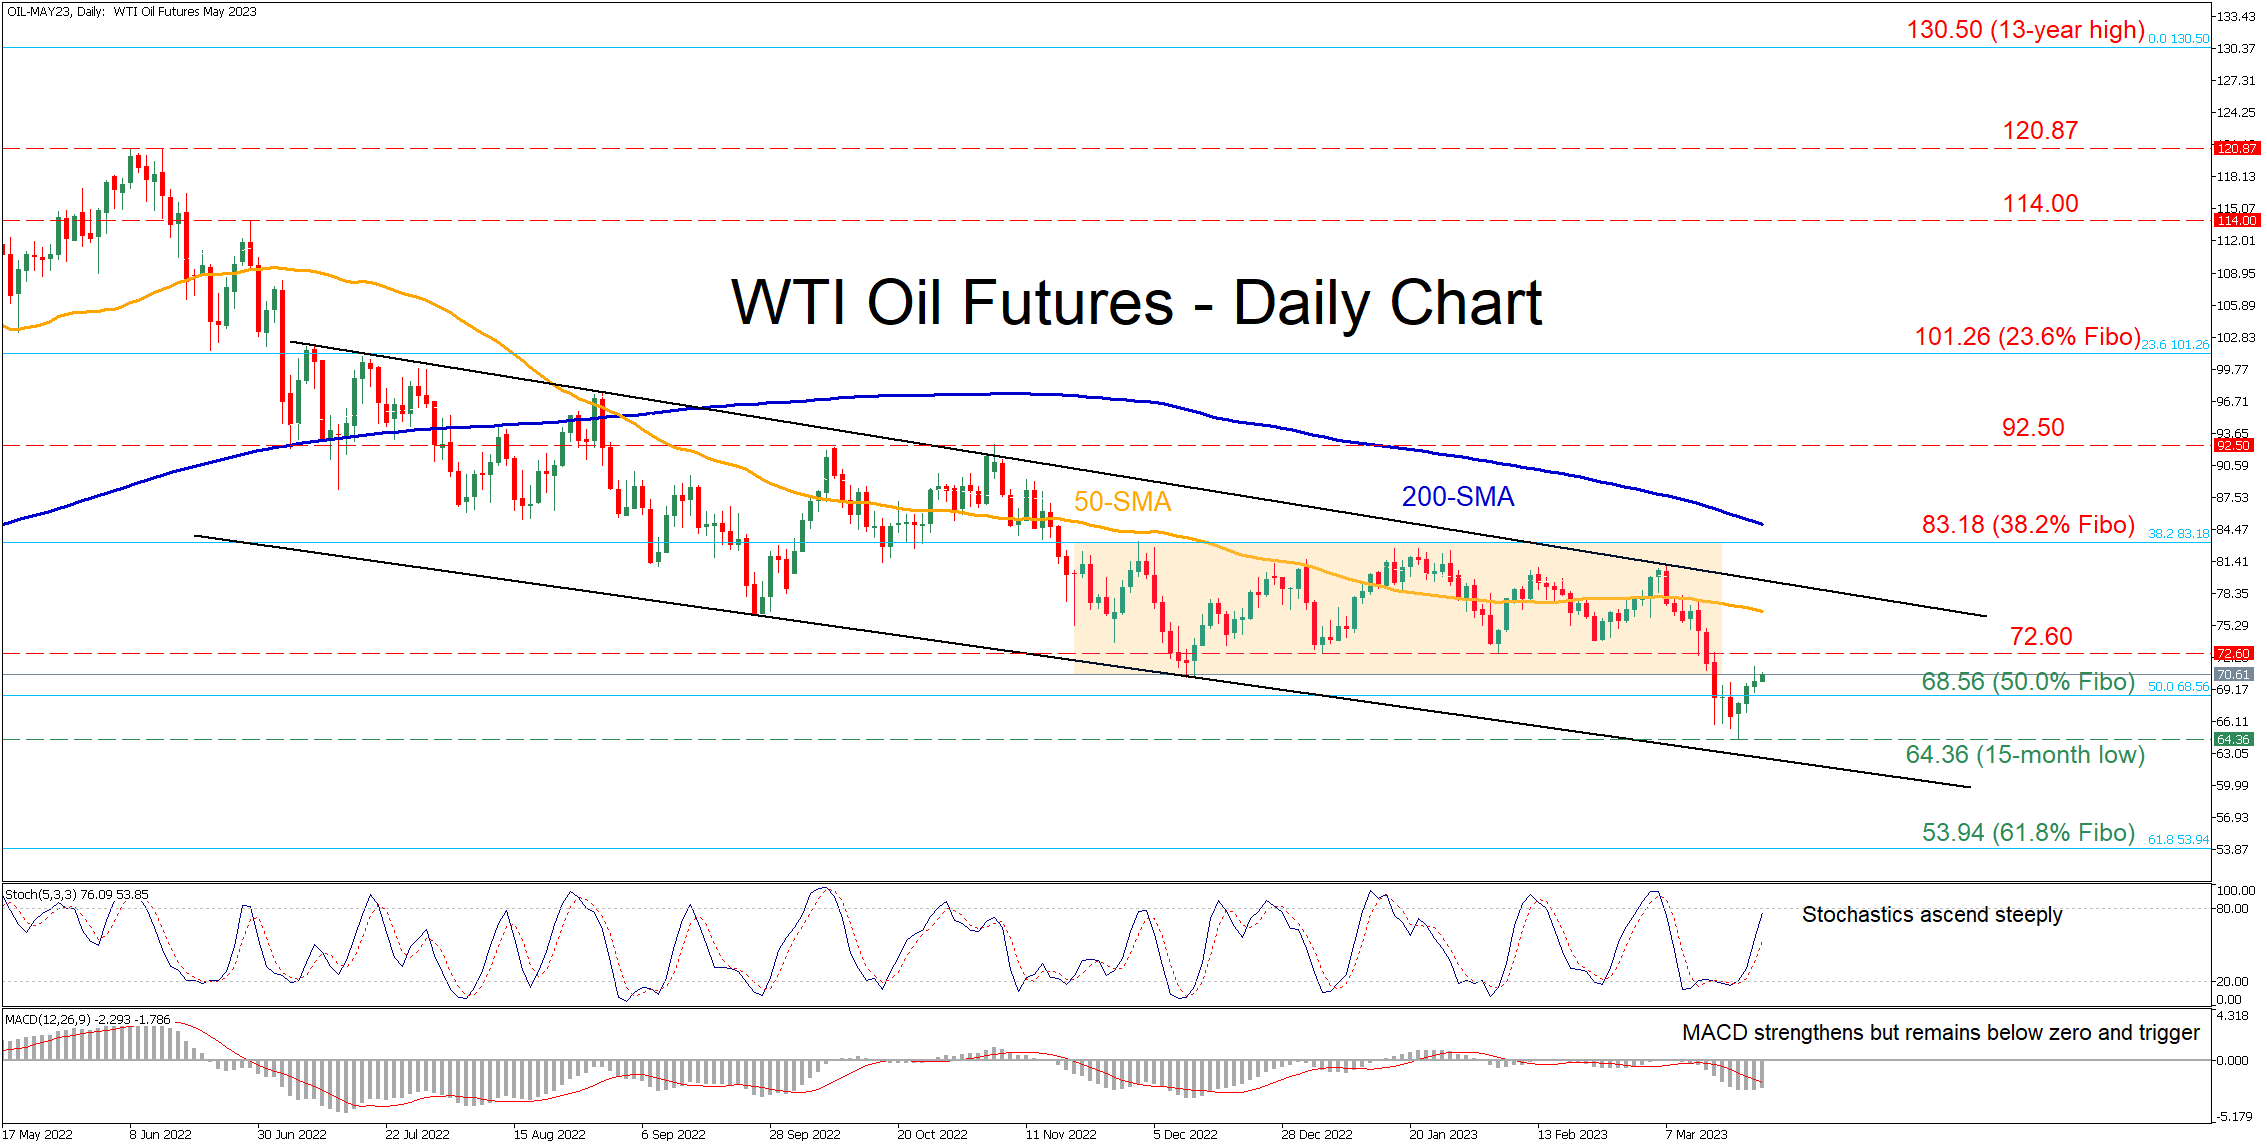
WTI oil futures (May delivery) broke below their rectangle pattern, which held strong since late November, posting a fresh 15-month low of 64.36. Even though the commodity managed to recoup some losses, its technical picture remains bearish.
The momentum indicators currently suggest that buying forces are strengthening but have not taken control yet. Specifically, the stochastic oscillator is ascending near its 80-overbought zone after escaping oversold conditions, while the MACD histogram is gaining ground but still below both zero and its red signal line.
If the recent rebound resumes, the price could initially challenge the recent support of 72.60, which could act as resistance in the future. Breaking above that zone, the commodity could ascend towards 83.18, which is the 38.2% Fibonacci retracement of the 6.62-130.5 uptrend that extended from the pandemic lows till the 13-year high in March 2022. Even higher, further upside moves could cease at the November high of 92.50.
On the flipside, should the negative momentum intensify and the price reverses lower again, the 50.0% Fibo of 68.56 could act as the first line of defense. A violation of that territory may open the door for the 15-month low of 64.36. Failing to halt there, the price could descend to test the 61.8% Fibo of 53.94.
In brief, WTI oil futures posted a minor rebound after plummeting to a fresh 15-month low and reaching oversold conditions. For the bearish outlook to reverse, the price needs to jump above the 83.18 ceiling.
GBPJPY Elliott Wave Forecasting The Path
Hello fellow traders. In this article we’re going to take a quick look at the Elliott Wave charts of GBPJPY forex pair published in members area of the website. As our members know, GBPJPY Is trading within the cycle from the February 28th peak. Recently we got 3 waves recovery against 165.98 high . The pair found sellers at the extreme zone and made the turn down as expected. In the further text we are going to explain the Elliott Wave Forecast.
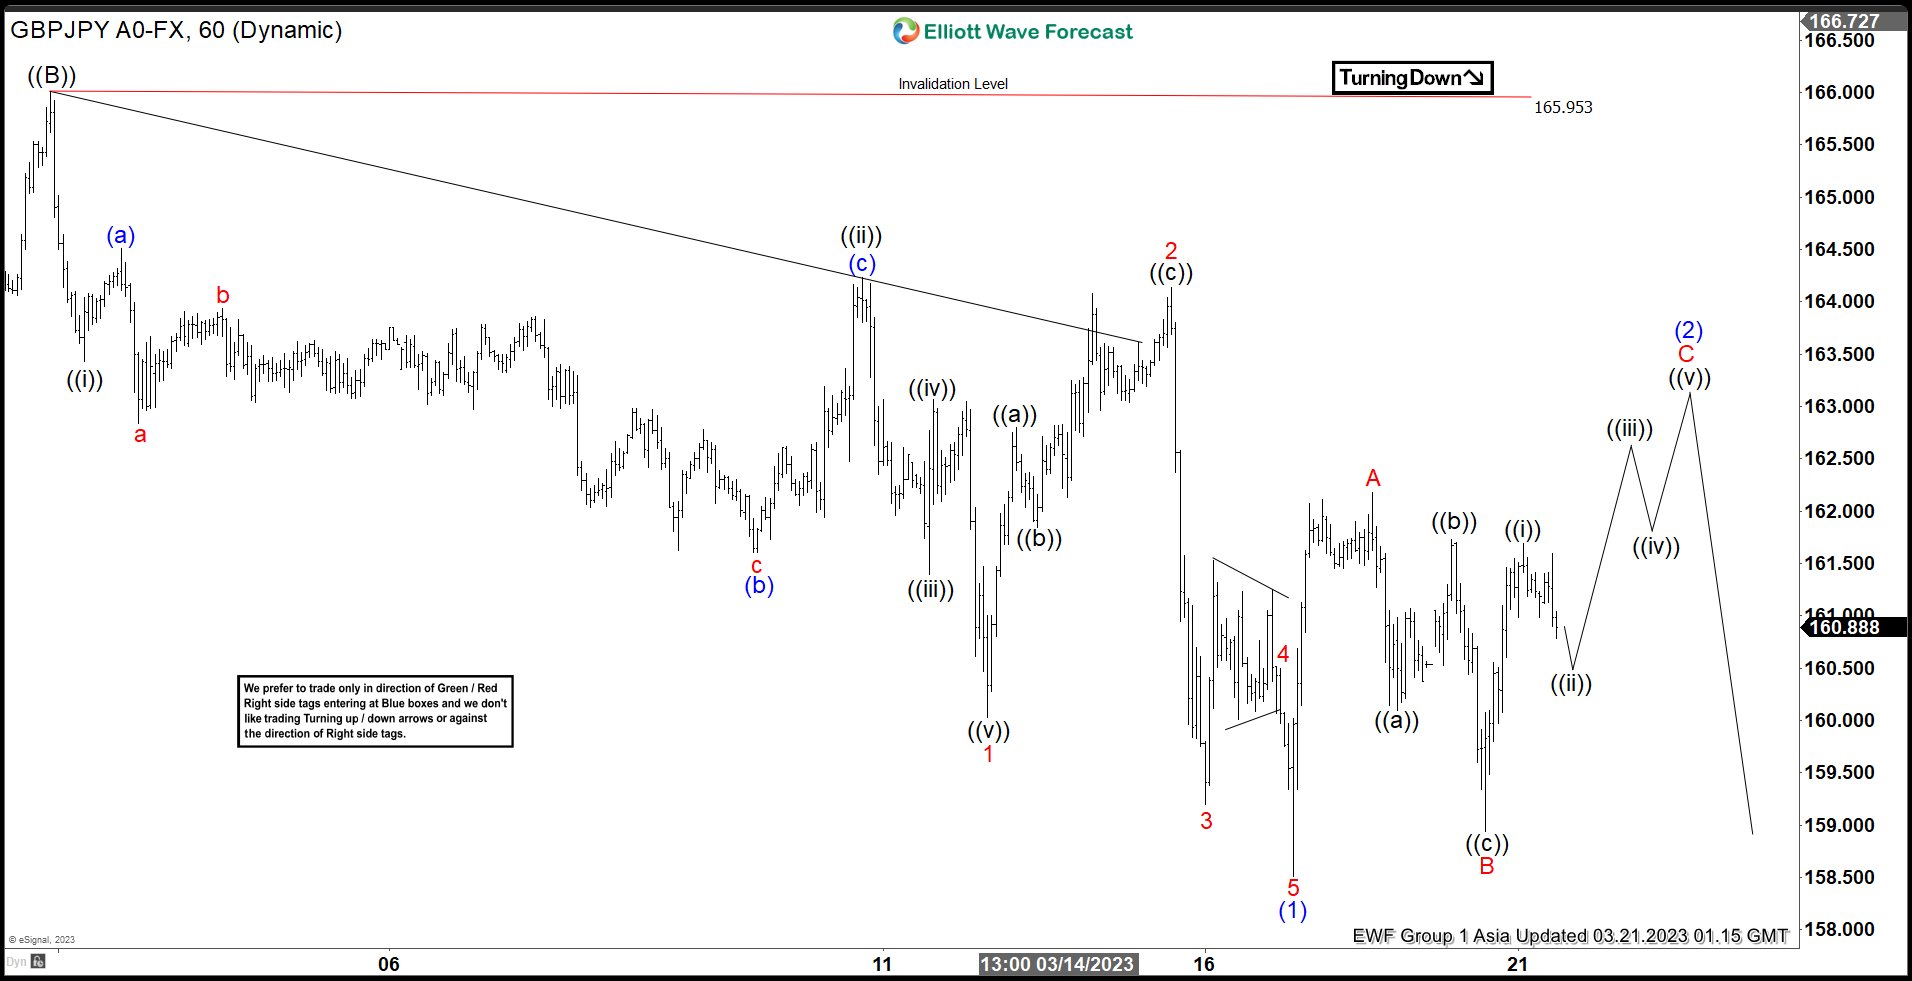
GBPJPY Elliott Wave 1 Hour Chart 02.10.2022
We are calling cycle from the 165.95 high completed as the 5 waves structure. Currently GBPJPY is doing correction against that high, which looks incomplete. We expect to see another leg up C red to complete wave (2) recovery.
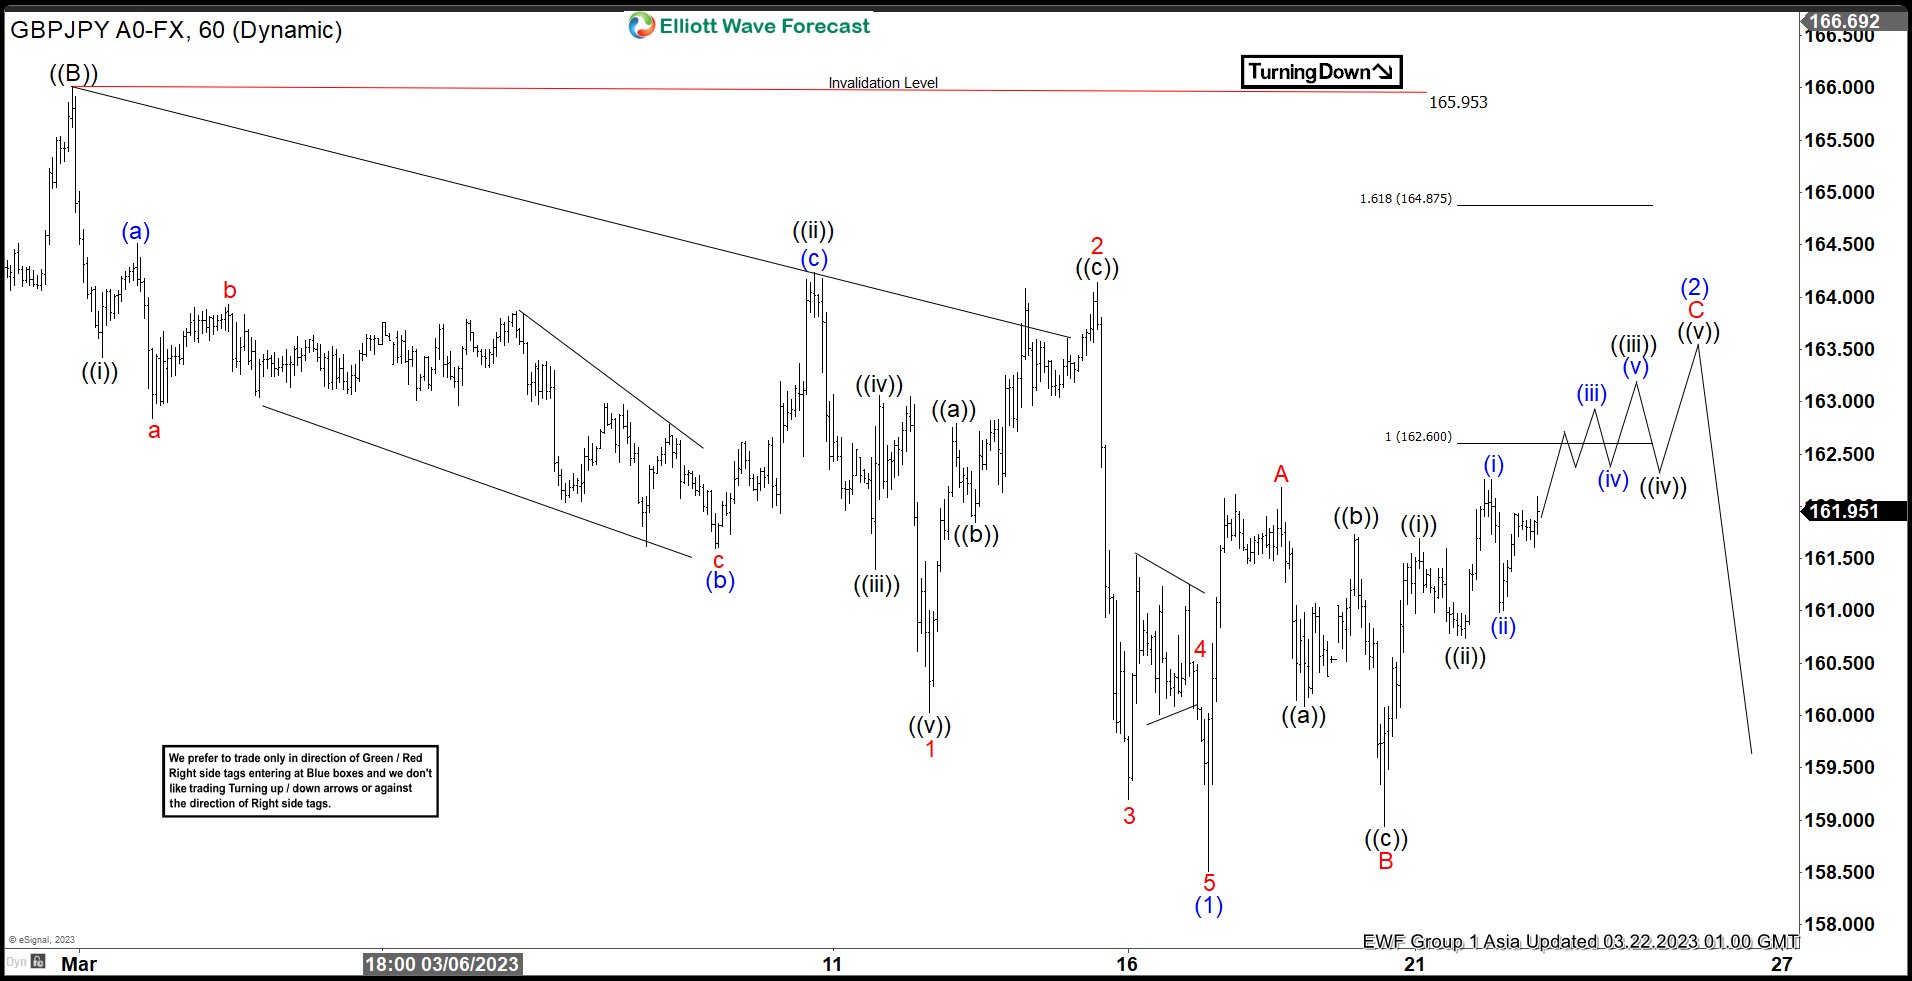
GBPJPY Elliott Wave 1 Hour Chart 03.22.2022
The pair has traded higher as we expected. It broke previous peak A red, confirming C red leg is in progress. More short term strength should ideally follow toward 162.6-164.87 area before turn lower takes place ideally.
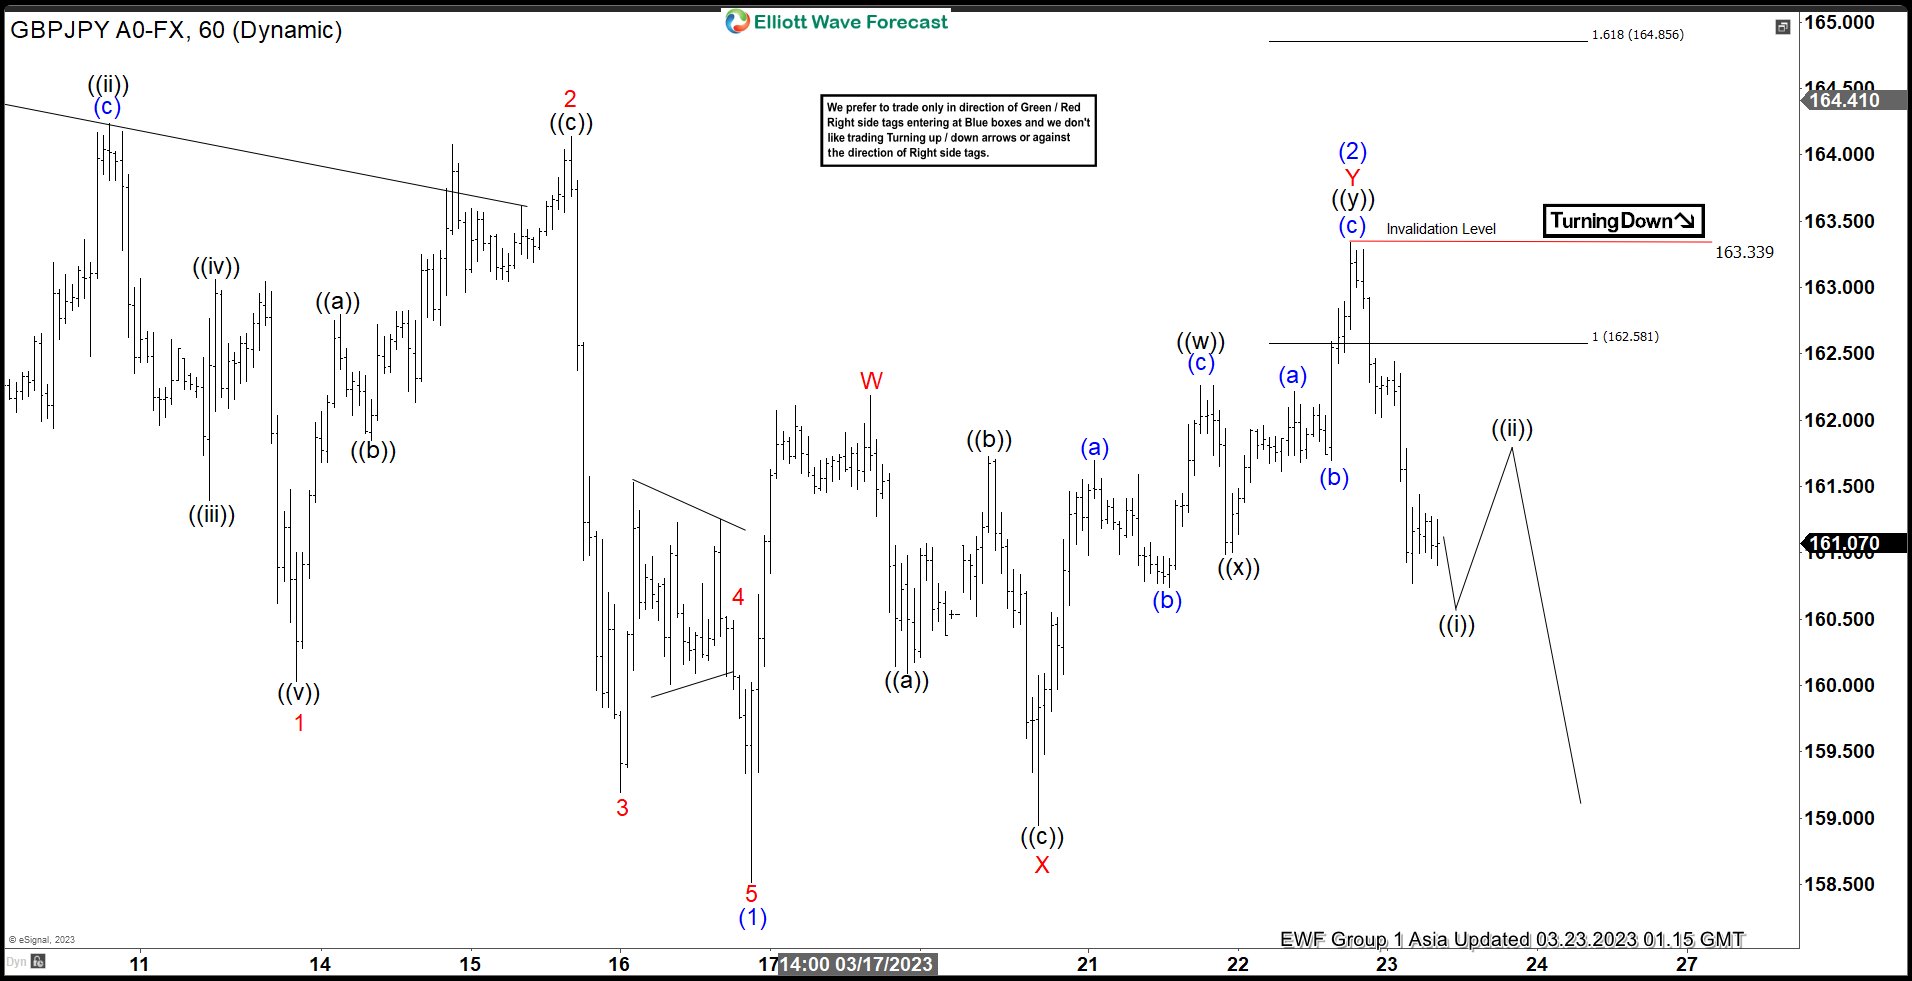
GBPJPY Elliott Wave 1 Hour Chart 03.23.2022
Eventually the pair made rally toward equal legs area 162.6-164.87 and found sellers as we expected. We already got decent pull back so we label wave (2) completed at the 163.33 high. As far as the price holds below that peak, chances are we are going to see further weakness. However , break of 03/16 low is needed to confirm next leg down is in progress.
GBP/JPY Daily Outlook
Daily Pivots: (S1) 160.30; (P) 161.82; (R1) 162.85; More...
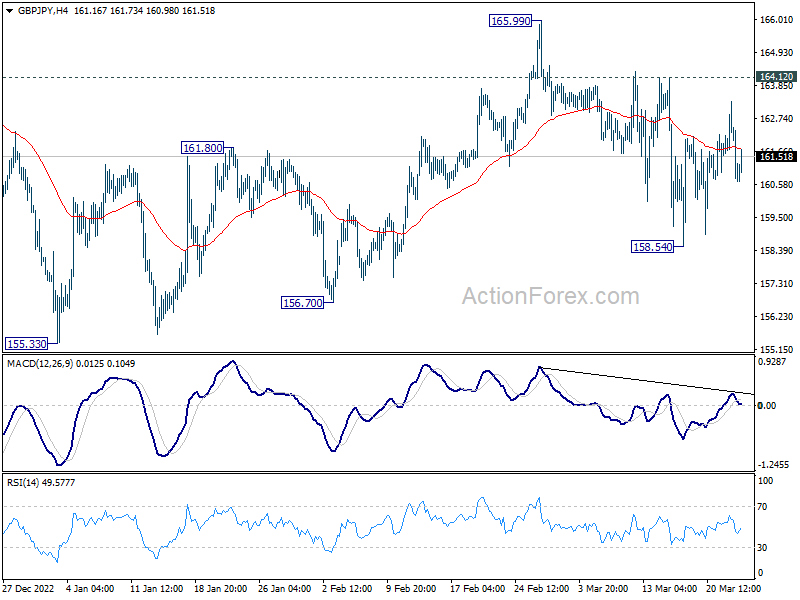
Outlook in GBP/JPY remains unchanged and intraday bias stays neutral. Current development suggests that fall from 165.99 is a falling leg of the whole decline from 172.11. Deeper decline is expected as long as 164.12 resistance holds. Break of 158.54 will target a retest on 155.33 low. However, break of 164.12 resistance will bring stronger rise back to 165.99 resistance.
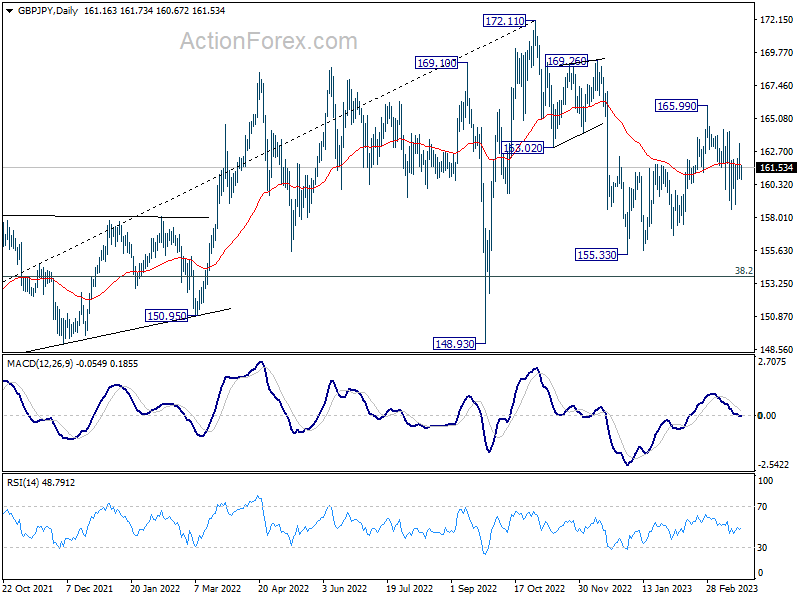
In the bigger picture, as long as 38.2% retracement of 123.94 (2020 low) to 172.11 (2022 high) at 153.70 holds, medium term bullishness is retained. That is, larger up trend from 123.94 (2020 low) is still in progress. Break of 172.11 high to resume such up trend is expected at a later stage.
EUR/JPY Daily Outlook
Daily Pivots: (S1) 142.18; (P) 142.90; (R1) 143.50; More....
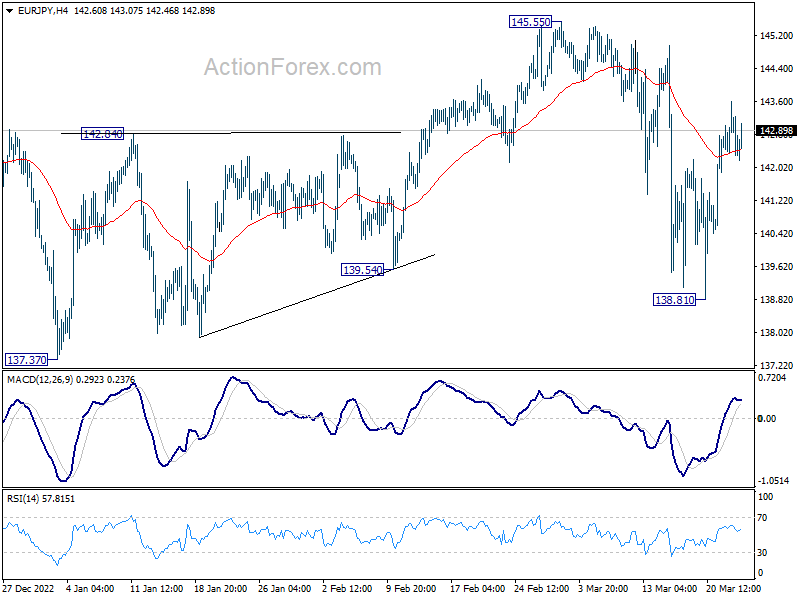
Intraday bias in EUR/JPY stays neutral for the moment and near term outlook is mixed for now. On the downside, break of 138.81 will resume the fall from 145.55 to retest 137.37 low. However, break of 145.55 will resume the rebound from 137.37 low instead.
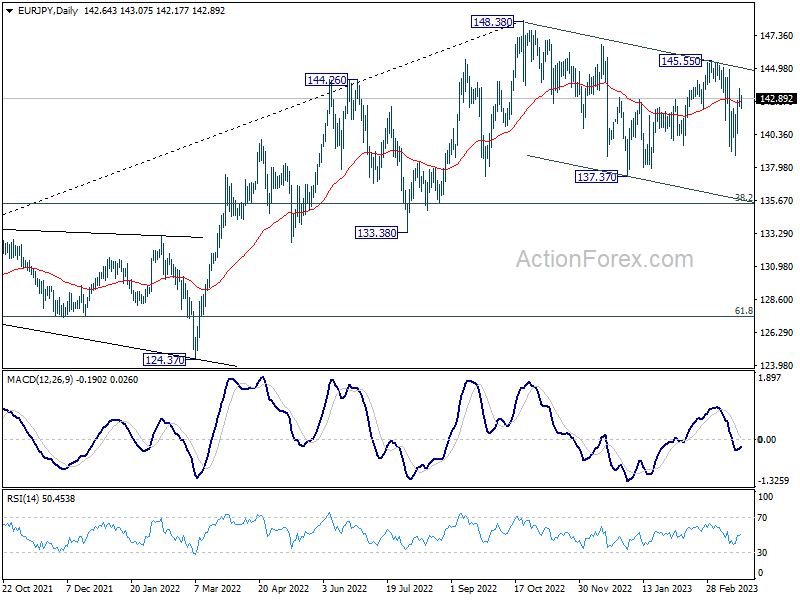
In the bigger picture, as long as 55 week EMA (now at 139.54) holds, larger up trend from 114.42 (2020 low) is still in progress for 149.76 long term resistance. However, firm break of 55 week EMA will bring deeper fall to 38.2% retracement of 114.42 to 148.38 at 135.40. Sustained break there will raise the chance of trend reversal, and target 61.8% retracement at 127.39.
EUR/GBP Daily Outlook
Daily Pivots: (S1) 0.8797; (P) 0.8825; (R1) 0.8879; More...
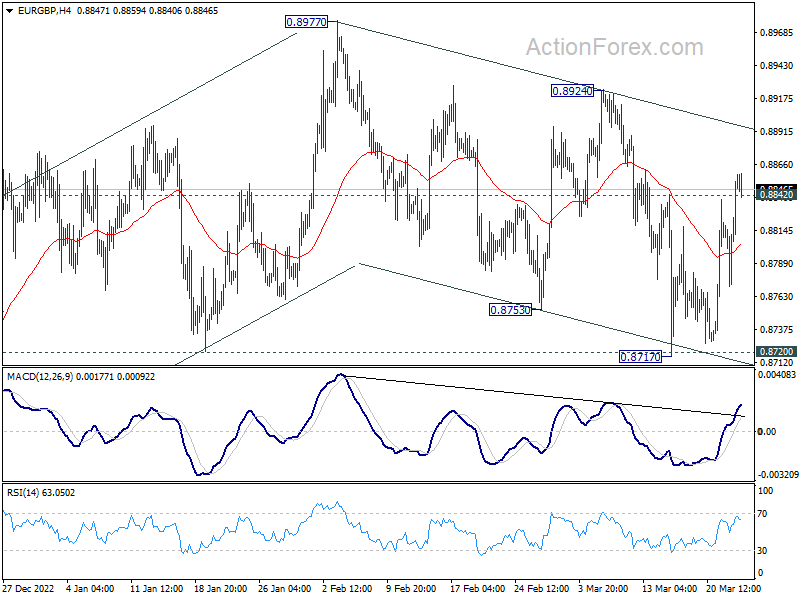
The break of 0.8852 minor resistance argues that EUR/GBP's corrective fall from 0.8977 has completed, after touching 0.8720 support. Intraday bias is back on the upside for 0.8924 resistance first. Firm break there should resume larger rise from 0.8545 through 0.8977 high. This will continue to be the favored case as long as 0.8270 support holds.
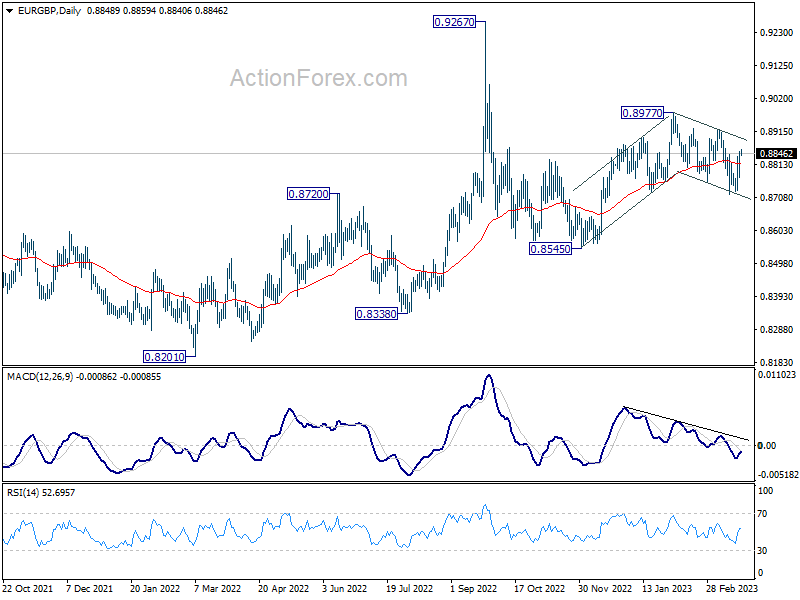
In the bigger picture, outlook is rather mixed for now, except that price actions from 0.9267 (2022 high) are part of the long term range pattern from 0.9499 (2020 high). With 0.8720 support intact, rise from 0.8545 is in favor to continue through 0.8977. However, firm break of 0.8720 will argue that such rebound has completed, and open up deeper fall through this support level.
EUR/AUD Daily Outlook
Daily Pivots: (S1) 1.6115; (P) 1.6185; (R1) 1.6314; More...
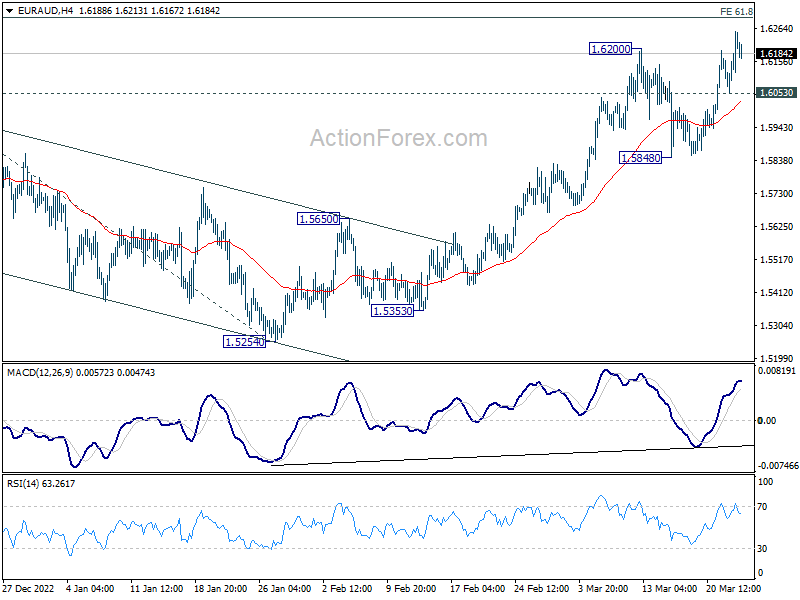
EUR/AUD's break of 1.6200 resistance confirms resumption of larger rise from 1.4281. Intraday bias is back on the upside for 61.8% projection of 1.4281 to 1.5976 from 1.5254 at 1.6302 and then 1.6389 fibonacci level. On the downside, below 1.6053 minor support will turn intraday bias neutral first. But outlook will continue to stay bullish as long as 1.5848 support holds.
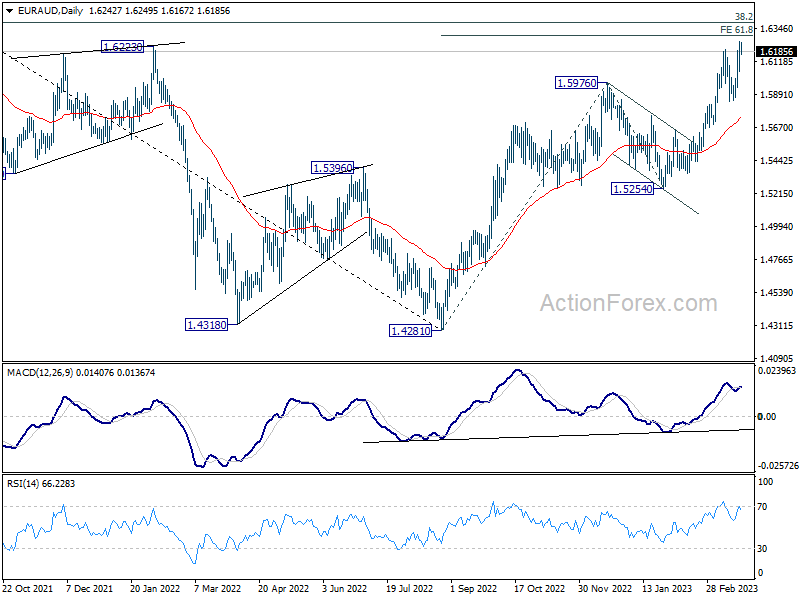
In the bigger picture, the strong support from 55 week EMA (now at 1.5404) is raising the chance of bullish trend reversal. Focus is now on 1.6434 cluster resistance (38.2% retracement of 1.9799 to 1.4281 at 1.6389). Sustained break there should confirm that whole down trend from 1.9799 (2020 high) has completed. Further rally should then be seen to 61.8% retracement at 1.7691. However, rejection by this cluster resistance will make medium term outlook neutral at best.
EUR/CHF Daily Outlook
Daily Pivots: (S1) 0.9930; (P) 0.9956; (R1) 0.9986; More...
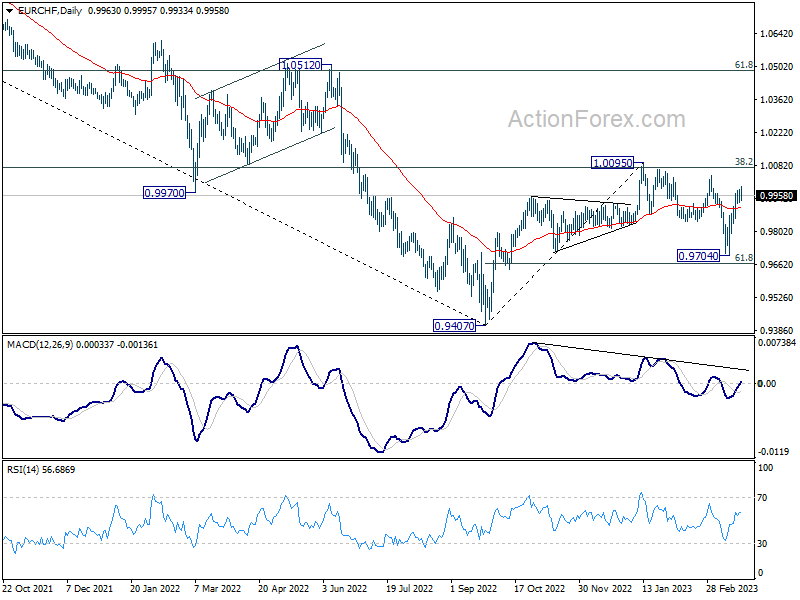
EUR/CHF edged higher to 0.9995 earlier today but quickly retreated. Intraday bias remains neutral first. Outlook is unchanged that corrective decline from 1.0095 should have completed at 0.9704. Further rally is in favor as long as 0.9856 minor support holds. Above 0.9995 will target 1.0040 and then 1.0095. However, firm break of 0.9856 will dampen this bullish view and turn bias back to the downside for 0.9704 support instead.
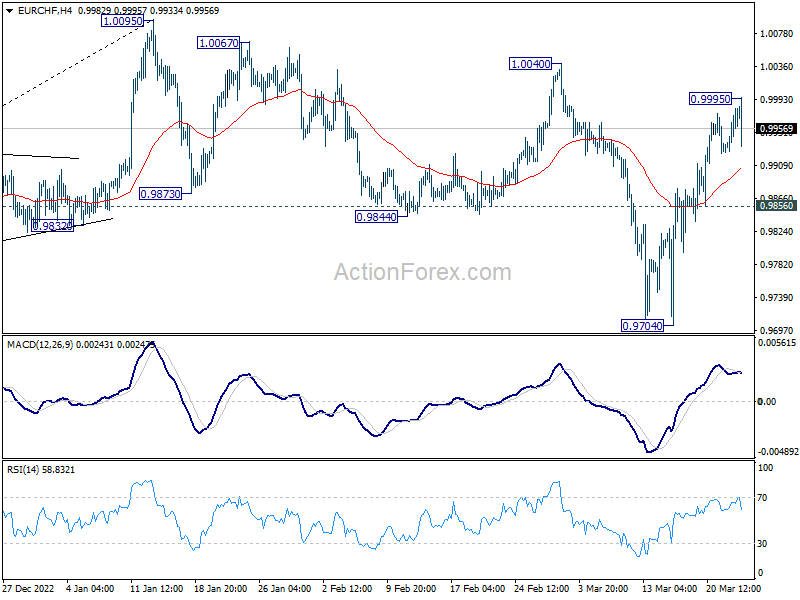
In the bigger picture, prior rejection by 55 week EMA (now at 1.0011) and 38.2% retracement of 1.1149 to 0.9407 at 1.0072 suggests that medium term outlook is staying bearish. That is, down trend from 1.2004 is not completed yet and is in favor to resume through 0.9407 at a later stage. However, decisive break of 1.0095 resistance will raise the chance of bullish trend reversal. Rise from 0.9407 should then target 1.0505 cluster resistance (2020 low at 1.0505, 61.8% retracement of 1.1149 to 0.9407 at 1.1484).
SNB hikes 50bps, signals more tightening possible
SNB raises its policy rate by 50bps to 1.50% as widely expected. The central bank indicated the openness to further tightening while inflation forecasts are raised due to stronger second-round effects and increased overseas inflationary pressure.
The central bank said the rate hike is for "countering the renewed increase in inflationary pressure". It also noted in the statement, "it cannot be ruled out that additional rises in the SNB policy rate will be necessary to ensure price stability over the medium term." It also remains "willing to be active in the foreign exchange market" with focus on "selling foreign currency" for some quarters.
The bank's conditional inflation forecast assumes an interest rate of 1.5% over the horizon. Average inflation estimates for 2023 and 2024 were raised from 2.4% to 2.6% and from 1.8% to 2.0%, respectively. Inflation is projected to average 2.0% in 2025, a new forecast.
SNB statement highlighted that "stronger second-round effects and the fact that inflationary pressure from abroad has increased again mean that, despite the raising of the SNB policy rate, the new forecast is higher through to mid-2025 than in December."
The central bank anticipates a modest GDP growth of around 1% for the year, citing subdued foreign demand and the dampening effect of inflation on purchasing power.
